
The U.S. population grew by just 7.4% in the 2010s, the slowest rate of any decade since the 1930s. Now in the 2020s, reduced immigration, falling birth rates, and an uptick in premature mortality, have further slowed population growth. According to the U.S. Census Bureau, the number of people living in the United States climbed by just 0.12% from mid-2020 to mid-2021, the smallest annual increase since record keeping began over a century ago.
Stagnant population growth will likely continue into the foreseeable future. The Congressional Budget Office projects an average annual population growth rate of just 0.3% over the next 30 years.
Notably, however, there are parts of the country that have broken from the broader national trend. Through a combination of inbound migration and rising birth rates, many of the nation’s more than 3,200 counties and county equivalents have reported a population boom in recent years.
Using five-year population estimates from Census Bureau’s American Community Survey, 24/7 Wall St. identified America’s 50 fastest growing counties. We ranked all counties and county equivalents on the percent change in population over the 10 years from 2012 to 2021. Only counties with a base population of at least 1,000 in 2012 were considered.
Among the counties and county equivalents on this list, populations expanded by anywhere from about 25% to over 100% from 2012 to 2021, the most recent 10 years of available data. For context, the U.S. population grew by just 6.7% over the same period. The majority of these counties – 34 in total – are located in the South, including 15 in Texas alone.
In many of these places, rapid population growth was driven in part by high birth rates. The number of children under age 10 increased in all but four counties on this list, climbing by more than 30% in over a dozen of them. Meanwhile, the number of children in the same age group fell by 1.9% nationwide between 2012 and 2021.
In most counties on this list, the job market expanded enough to accommodate the influx of new residents, as overall employment growth outpaced population growth. Only four counties on this list had a higher average unemployment rate in 2021 than in 2012, according to data from the Bureau of Labor Statistics. (These cities will add the most jobs by 2060, according to economists.)
Increased demand for housing in these places had a meaningful impact on the real estate market. Among the counties on this list, median home values climbed by anywhere from about 15% to nearly 200%, based on ACS estimates from 2012 to 2021. (These are the American cities spending the most to build new homes.)
50. Montgomery County, TN
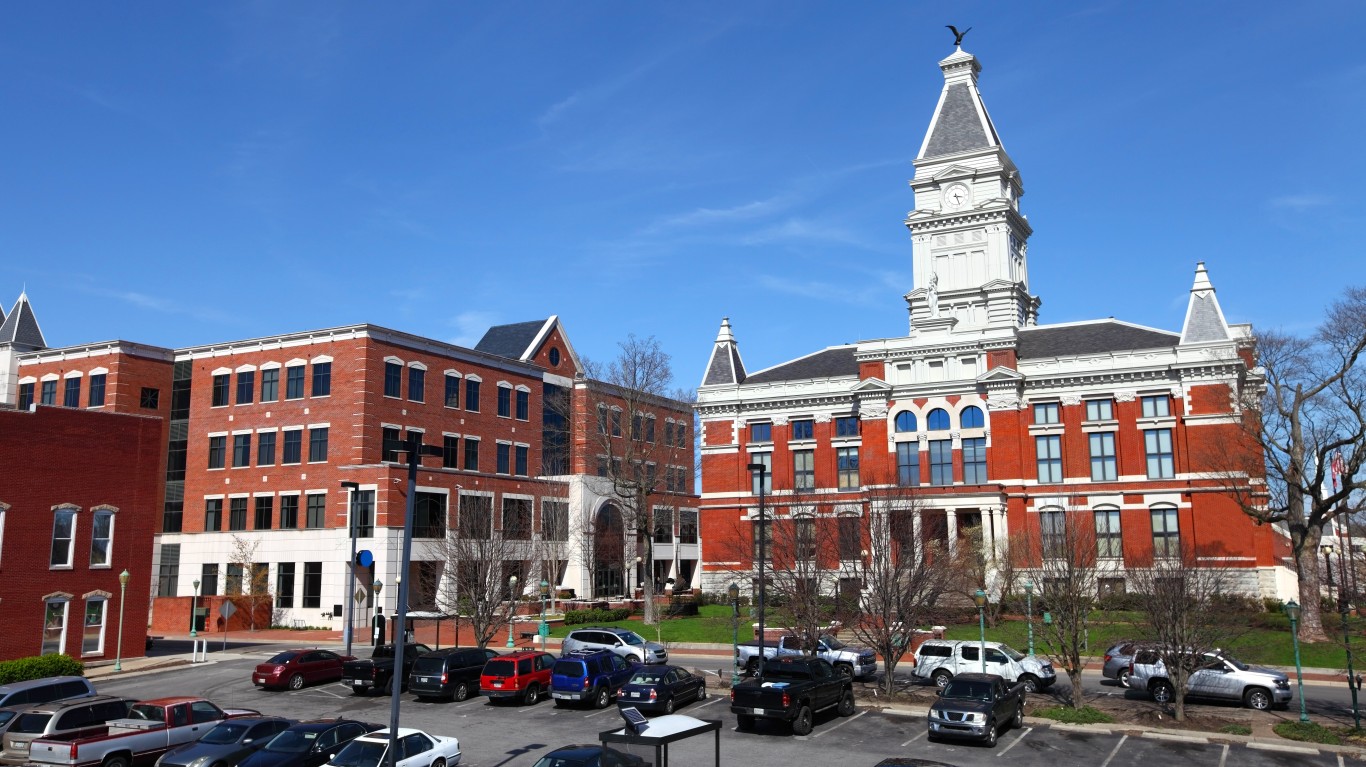
- 10-yr. population growth: 24.9% (+43,034 people)
- Total population by year: 216,172 in 2021; 173,138 in 2012
- 10-yr. change in median home value: +35.0% (+$48,700)
- Median home value by year: $187,700 in 2021; $139,000 in 2012
- 10-yr. change in employment: +16.1% (+11,553 jobs)
- Avg. unemployment rate by year: 4.7% in 2021; 7.7% in 2012
- County seat: Clarksville, Tennessee
49. Johnston County, NC
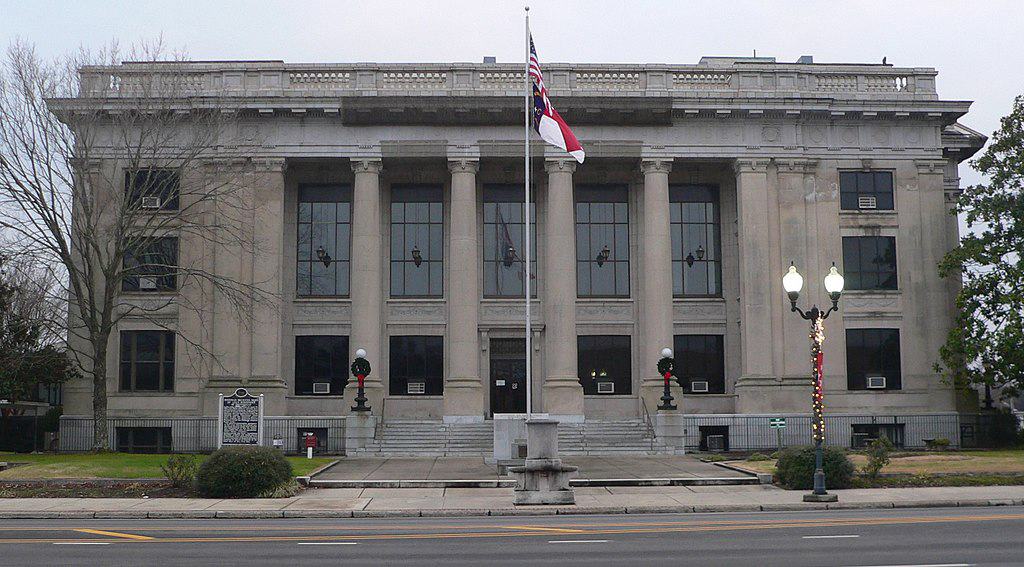
- 10-yr. population growth: 25.0% (+42,198 people)
- Total population by year: 211,320 in 2021; 169,122 in 2012
- 10-yr. change in median home value: +44.0% (+$61,900)
- Median home value by year: $202,600 in 2021; $140,700 in 2012
- 10-yr. change in employment: +26.6% (+20,475 jobs)
- Avg. unemployment rate by year: 4.3% in 2021; 8.6% in 2012
- County seat: Smithfield, North Carolina
48. Oconee County, GA
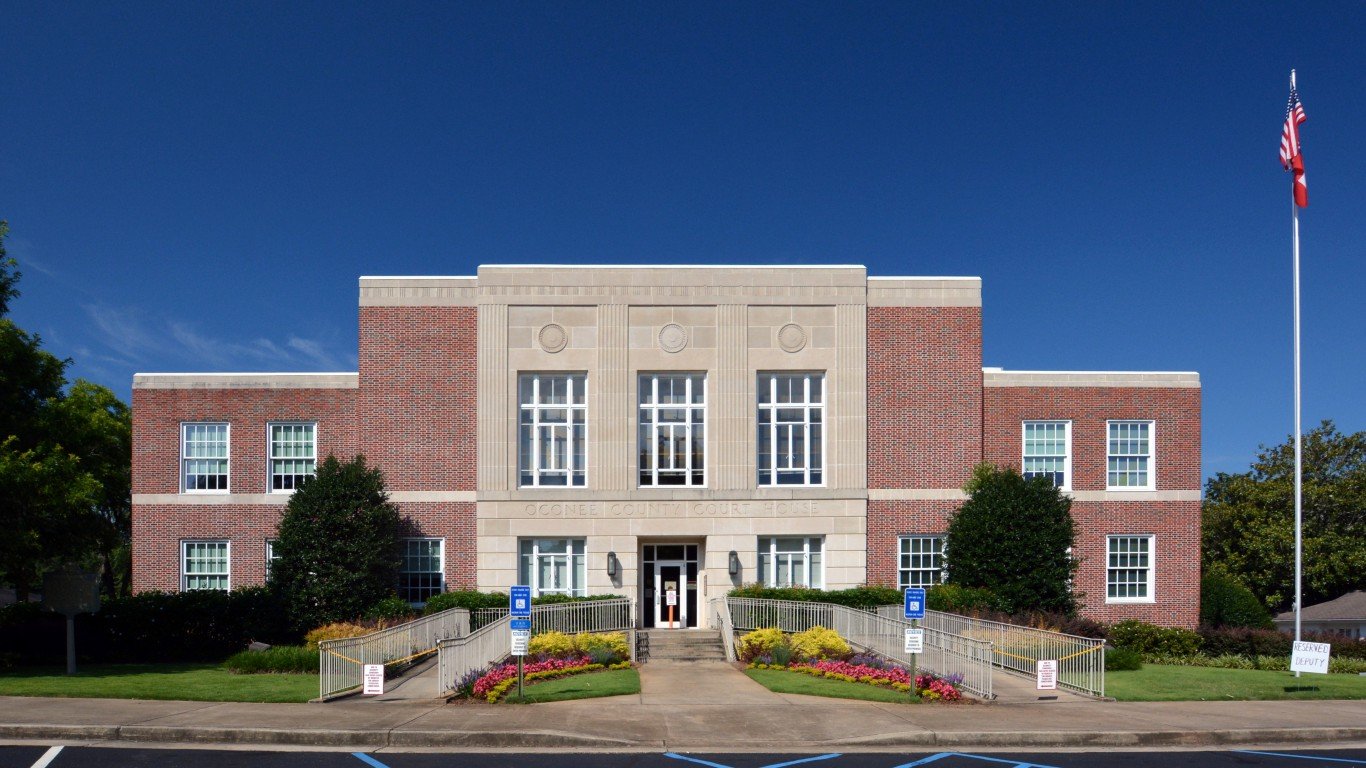
- 10-yr. population growth: 25.0% (+8,192 people)
- Total population by year: 41,006 in 2021; 32,814 in 2012
- 10-yr. change in median home value: +36.6% (+$88,300)
- Median home value by year: $329,700 in 2021; $241,400 in 2012
- 10-yr. change in employment: +22.9% (+3,661 jobs)
- Avg. unemployment rate by year: 2.2% in 2021; 6.2% in 2012
- County seat: Watkinsville, Georgia
47. Berkeley County, SC
- 10-yr. population growth: 25.0% (+45,033 people)
- Total population by year: 224,806 in 2021; 179,773 in 2012
- 10-yr. change in median home value: +43.2% (+$65,200)
- Median home value by year: $216,100 in 2021; $150,900 in 2012
- 10-yr. change in employment: +26.4% (+21,490 jobs)
- Avg. unemployment rate by year: 3.6% in 2021; 8.2% in 2012
- County seat: Moncks Corner, South Carolina
46. Utah County, UT
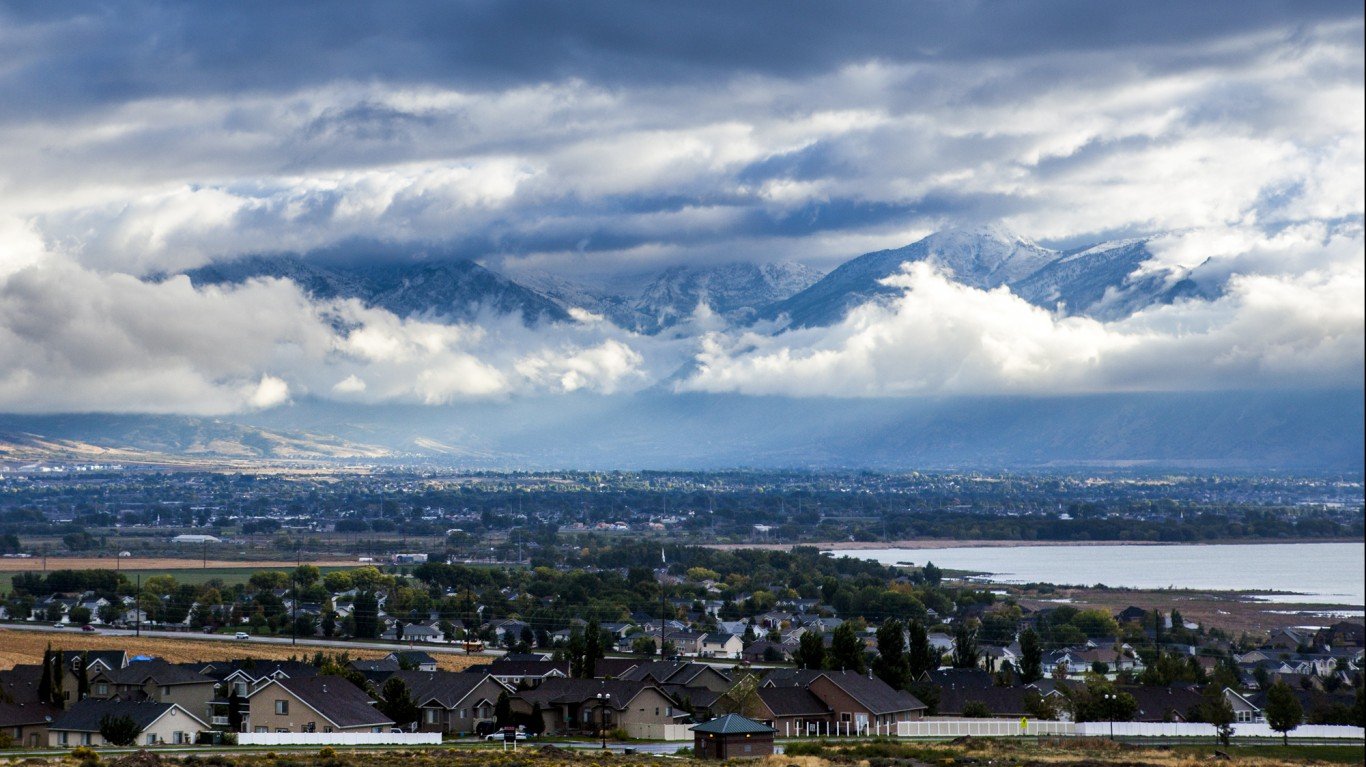
- 10-yr. population growth: 25.5% (+131,694 people)
- Total population by year: 648,265 in 2021; 516,571 in 2012
- 10-yr. change in median home value: +60.5% (+$138,400)
- Median home value by year: $367,200 in 2021; $228,800 in 2012
- 10-yr. change in employment: +44.8% (+100,508 jobs)
- Avg. unemployment rate by year: 2.4% in 2021; 4.4% in 2012
- County seat: Provo, Utah
45. Benton County, AR
- 10-yr. population growth: 25.6% (+56,746 people)
- Total population by year: 278,774 in 2021; 222,028 in 2012
- 10-yr. change in median home value: +40.1% (+$60,400)
- Median home value by year: $211,100 in 2021; $150,700 in 2012
- 10-yr. change in employment: +33.7% (+35,348 jobs)
- Avg. unemployment rate by year: 2.8% in 2021; 5.8% in 2012
- County seat: Bentonville, Arkansas
44. Ellis County, TX
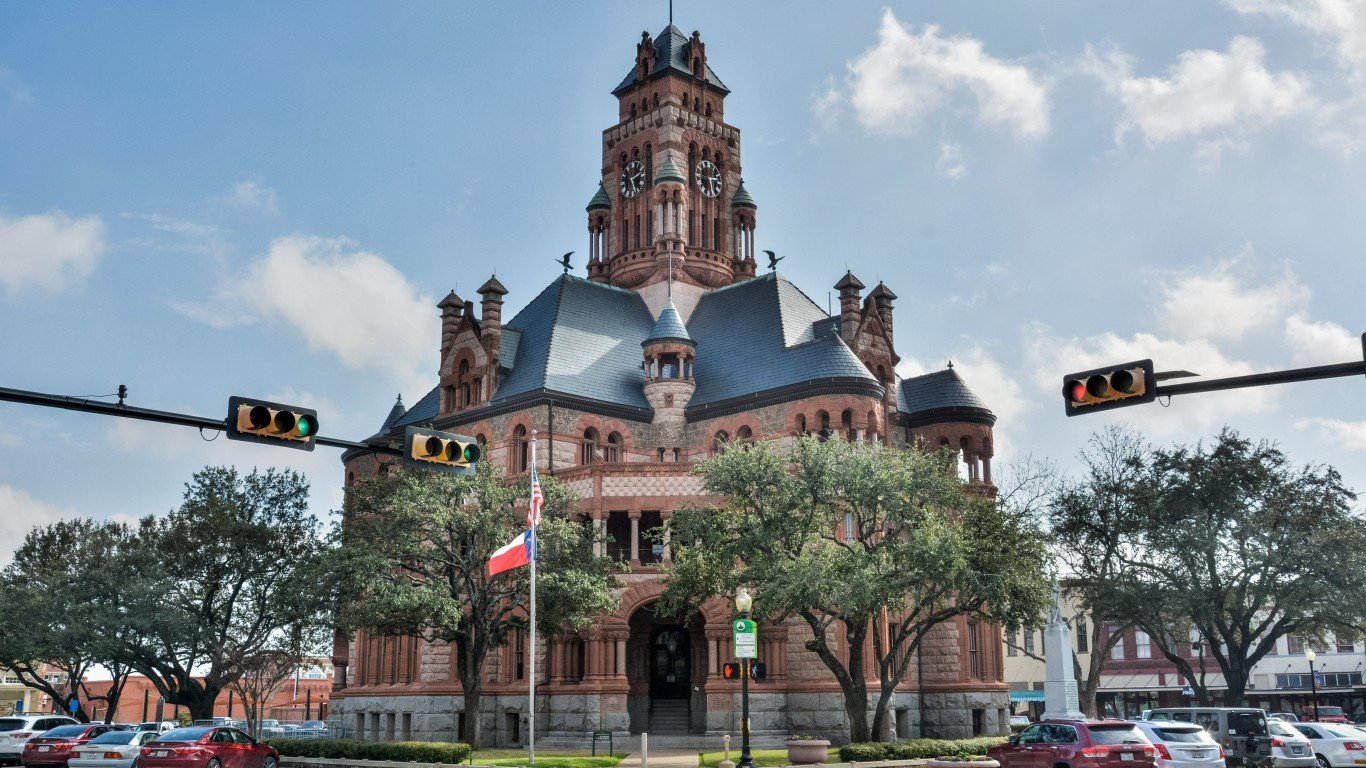
- 10-yr. population growth: 25.6% (+38,272 people)
- Total population by year: 187,984 in 2021; 149,712 in 2012
- 10-yr. change in median home value: +71.9% (+$100,000)
- Median home value by year: $239,000 in 2021; $139,000 in 2012
- 10-yr. change in employment: +32.5% (+23,250 jobs)
- Avg. unemployment rate by year: 4.5% in 2021; 6.7% in 2012
- County seat: Waxahachie, Texas
43. Lake County, FL
- 10-yr. population growth: 25.9% (+77,064 people)
- Total population by year: 375,059 in 2021; 297,995 in 2012
- 10-yr. change in median home value: +43.4% (+$67,500)
- Median home value by year: $223,000 in 2021; $155,500 in 2012
- 10-yr. change in employment: +25.8% (+31,291 jobs)
- Avg. unemployment rate by year: 4.7% in 2021; 9.1% in 2012
- County seat: Tavares, Florida
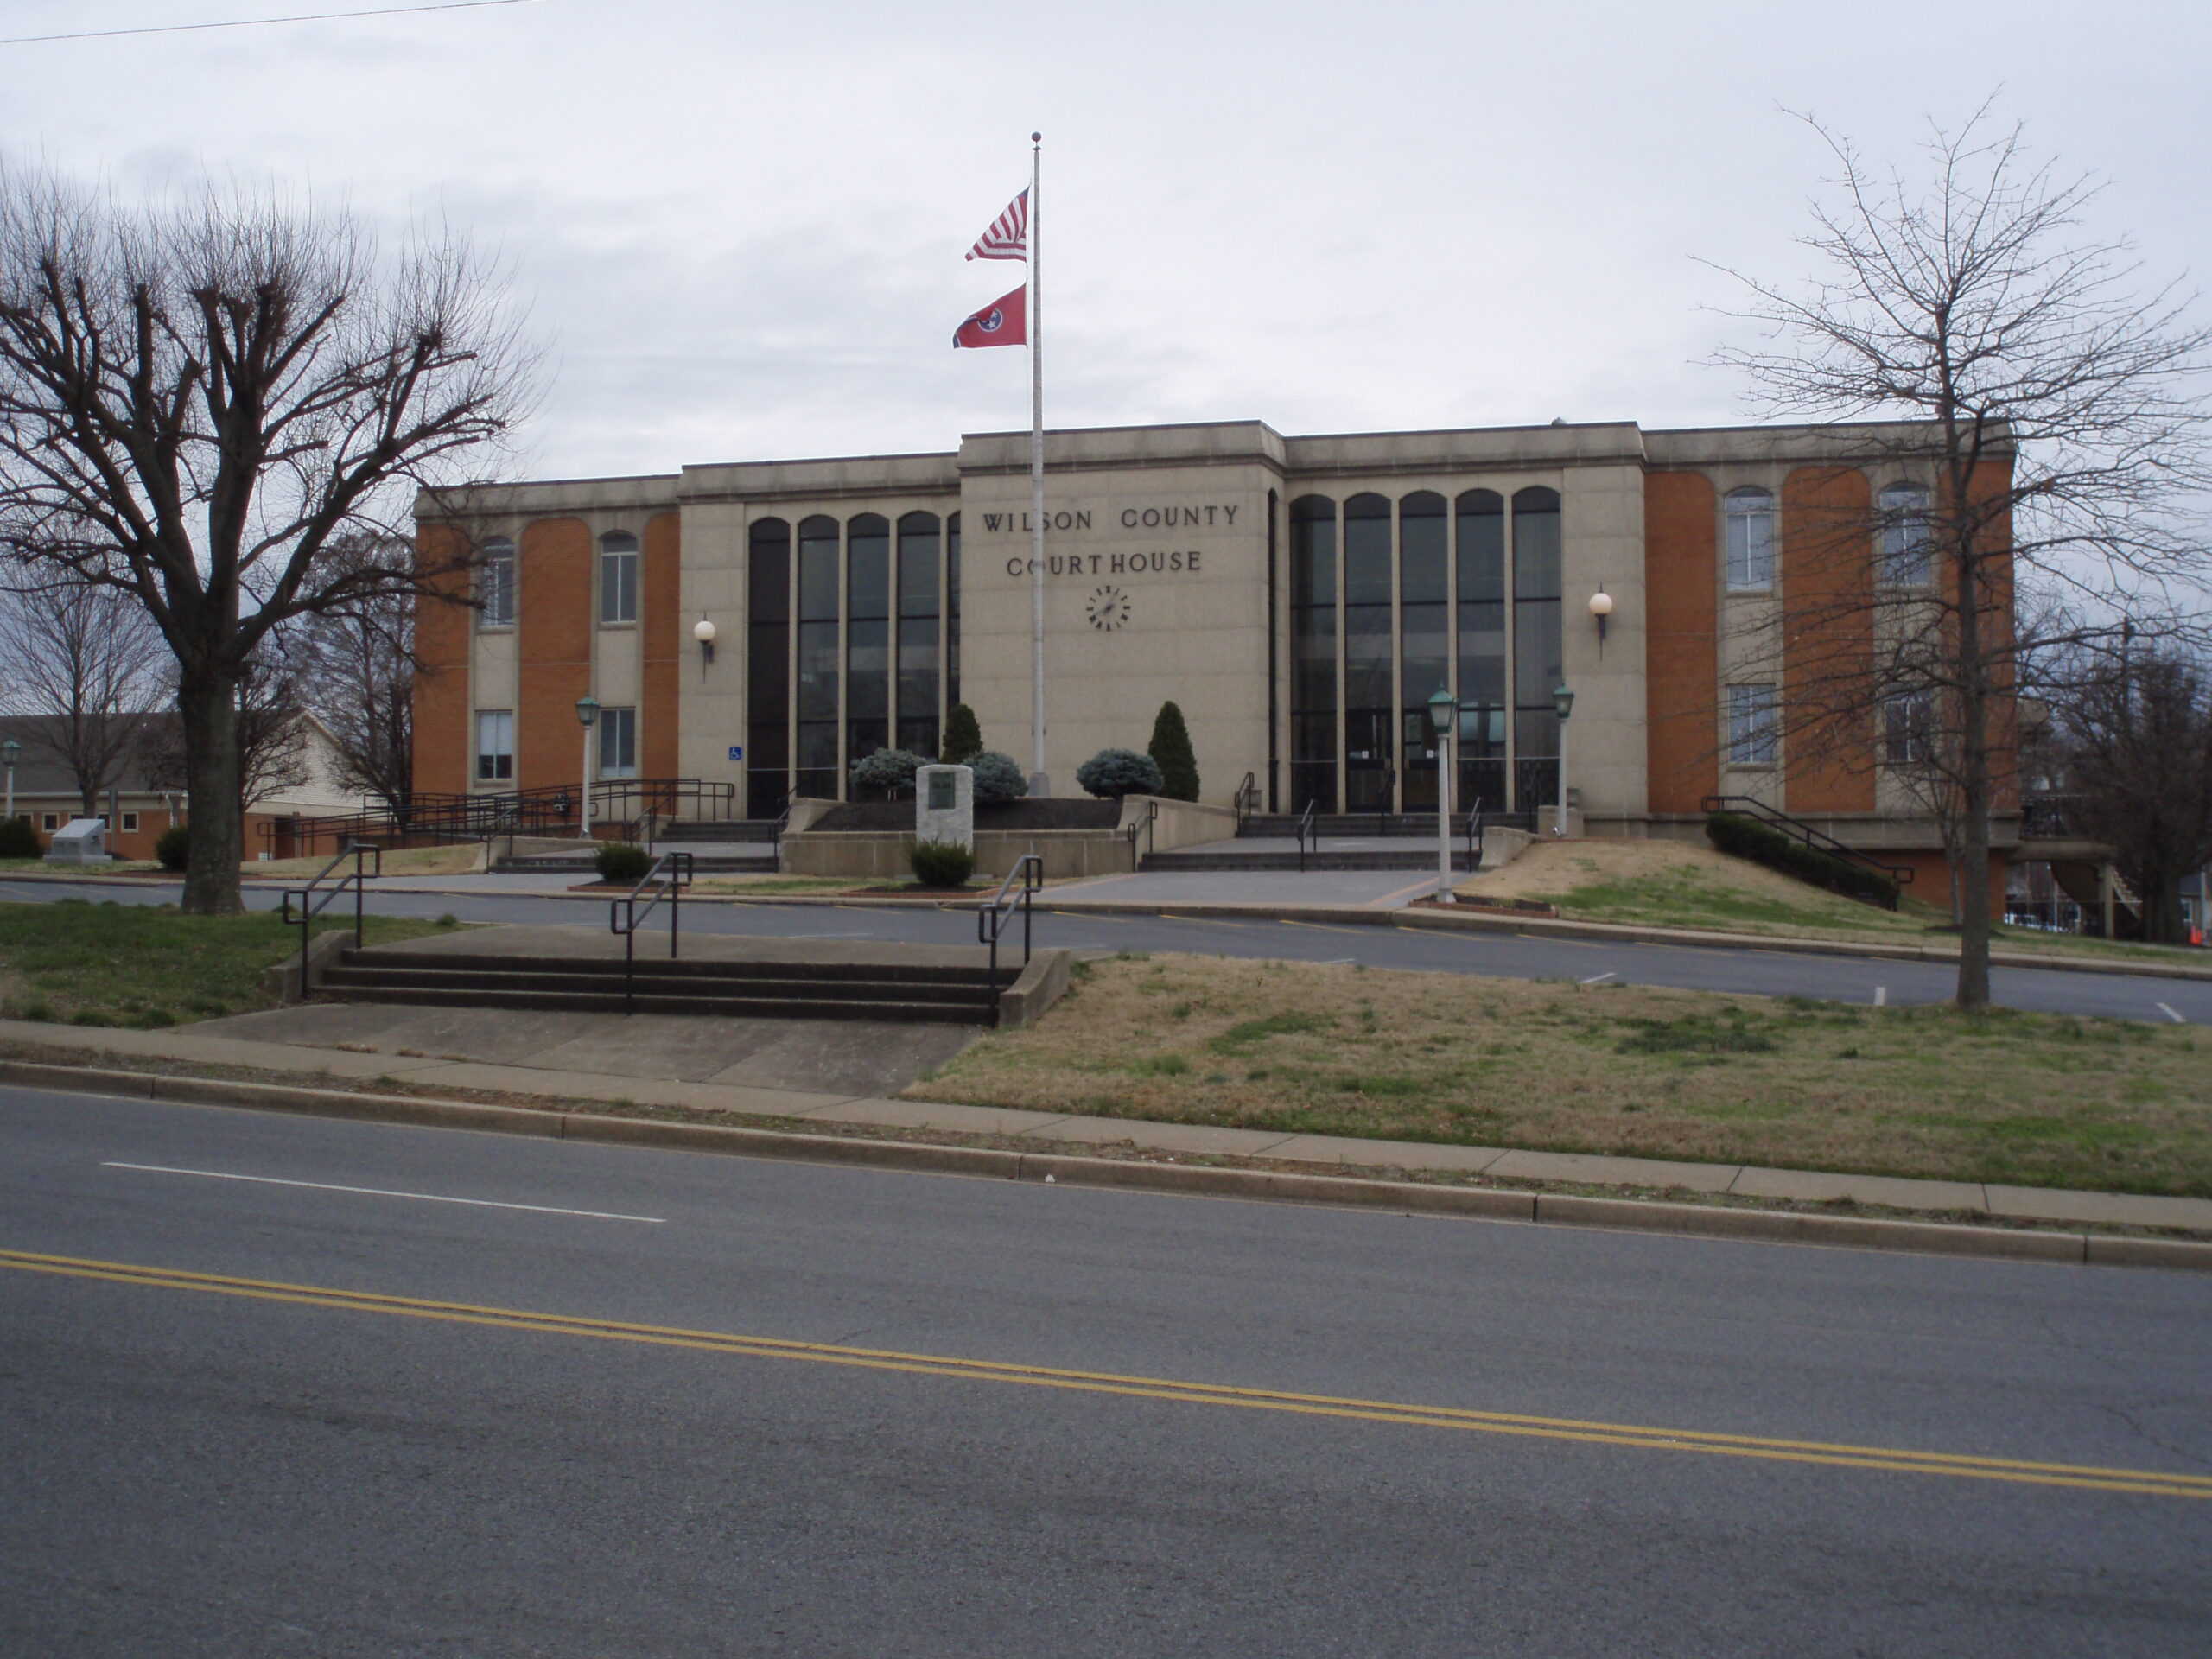
42. Wilson County, TN
- 10-yr. population growth: 26.3% (+30,130 people)
- Total population by year: 144,748 in 2021; 114,618 in 2012
- 10-yr. change in median home value: +57.2% (+$109,500)
- Median home value by year: $300,800 in 2021; $191,300 in 2012
- 10-yr. change in employment: +35.6% (+20,166 jobs)
- Avg. unemployment rate by year: 3.4% in 2021; 6.5% in 2012
- County seat: Lebanon, Tennessee
41. Washington County, UT
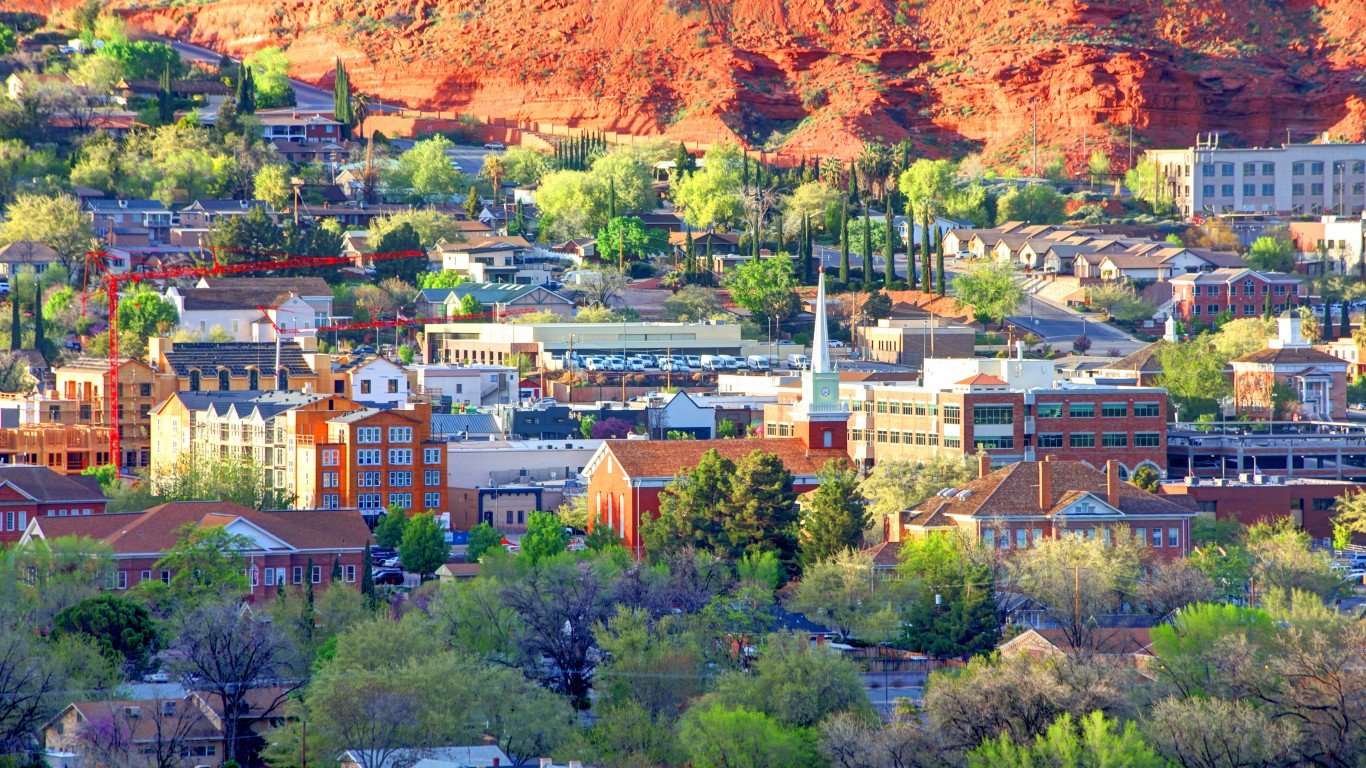
- 10-yr. population growth: 26.6% (+37,049 people)
- Total population by year: 176,533 in 2021; 139,484 in 2012
- 10-yr. change in median home value: +54.1% (+$120,600)
- Median home value by year: $343,700 in 2021; $223,100 in 2012
- 10-yr. change in employment: +54.9% (+28,915 jobs)
- Avg. unemployment rate by year: 3.0% in 2021; 6.1% in 2012
- County seat: St. George, Utah
40. Skagway Municipality, AK

- 10-yr. population growth: 26.6% (+279 people)
- Total population by year: 1,329 in 2021; 1,050 in 2012
- 10-yr. change in median home value: +32.8% (+$100,300)
- Median home value by year: $406,500 in 2021; $306,200 in 2012
- 10-yr. change in employment: -14.1% (-91 jobs)
- Avg. unemployment rate by year: 13.6% in 2021; 14.2% in 2012
- County seat: Skagway, Alaska
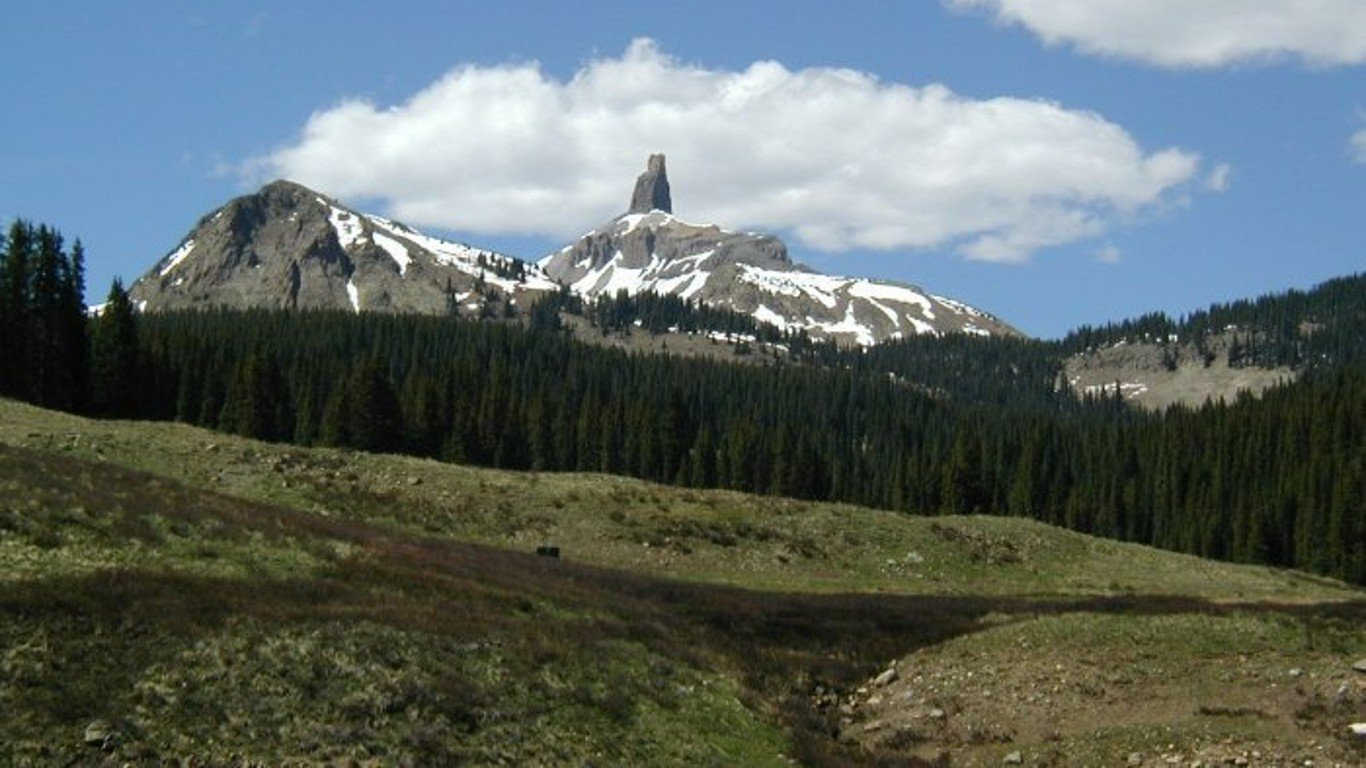
39. Dolores County, CO
- 10-yr. population growth: 26.7% (+482 people)
- Total population by year: 2,288 in 2021; 1,806 in 2012
- 10-yr. change in median home value: +47.5% (+$58,400)
- Median home value by year: $181,400 in 2021; $123,000 in 2012
- 10-yr. change in employment: +25.6% (+217 jobs)
- Avg. unemployment rate by year: 5.0% in 2021; 10.3% in 2012
- County seat: Dove Creek, Colorado
38. Weld County, CO
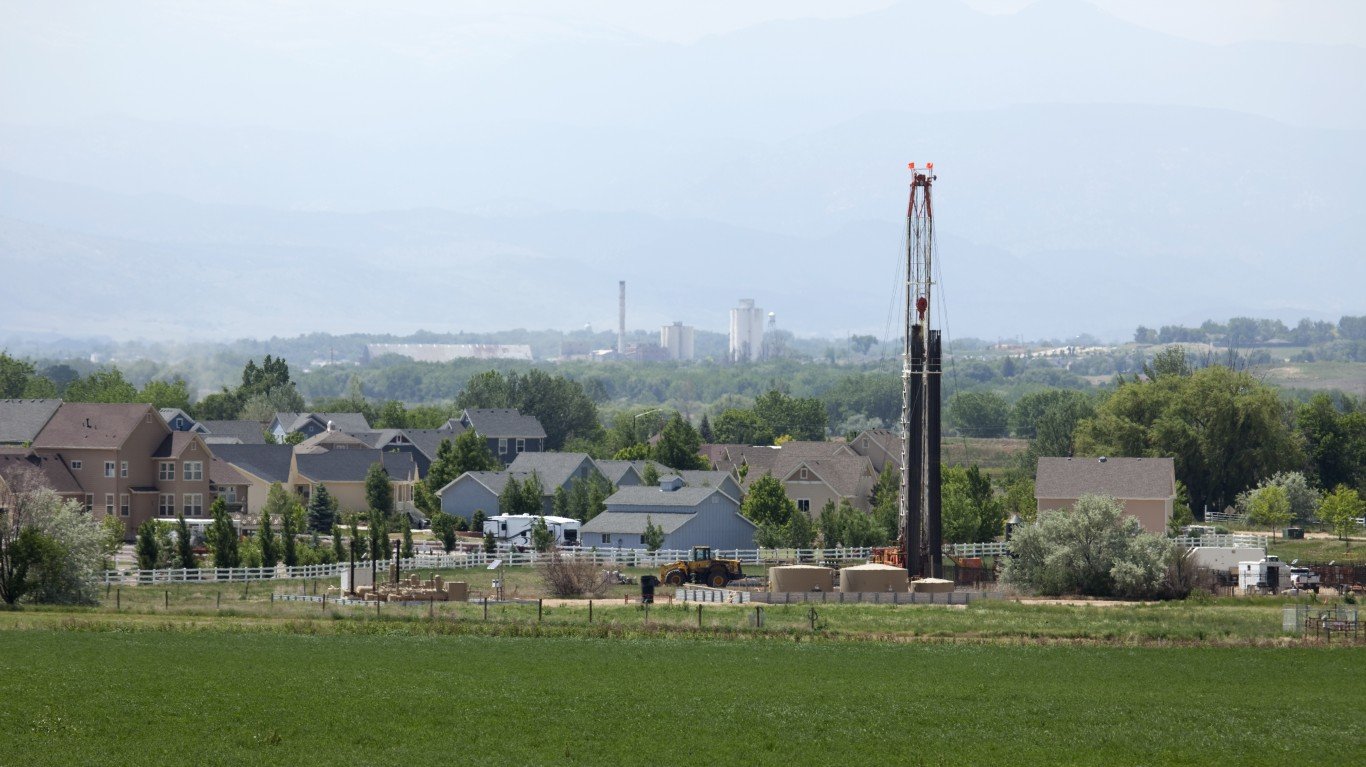
- 10-yr. population growth: 27.2% (+68,872 people)
- Total population by year: 322,424 in 2021; 253,552 in 2012
- 10-yr. change in median home value: +83.2% (+$159,900)
- Median home value by year: $352,000 in 2021; $192,100 in 2012
- 10-yr. change in employment: +24.9% (+31,374 jobs)
- Avg. unemployment rate by year: 5.8% in 2021; 7.9% in 2012
- County seat: Greeley, Colorado
37. Rutherford County, TN
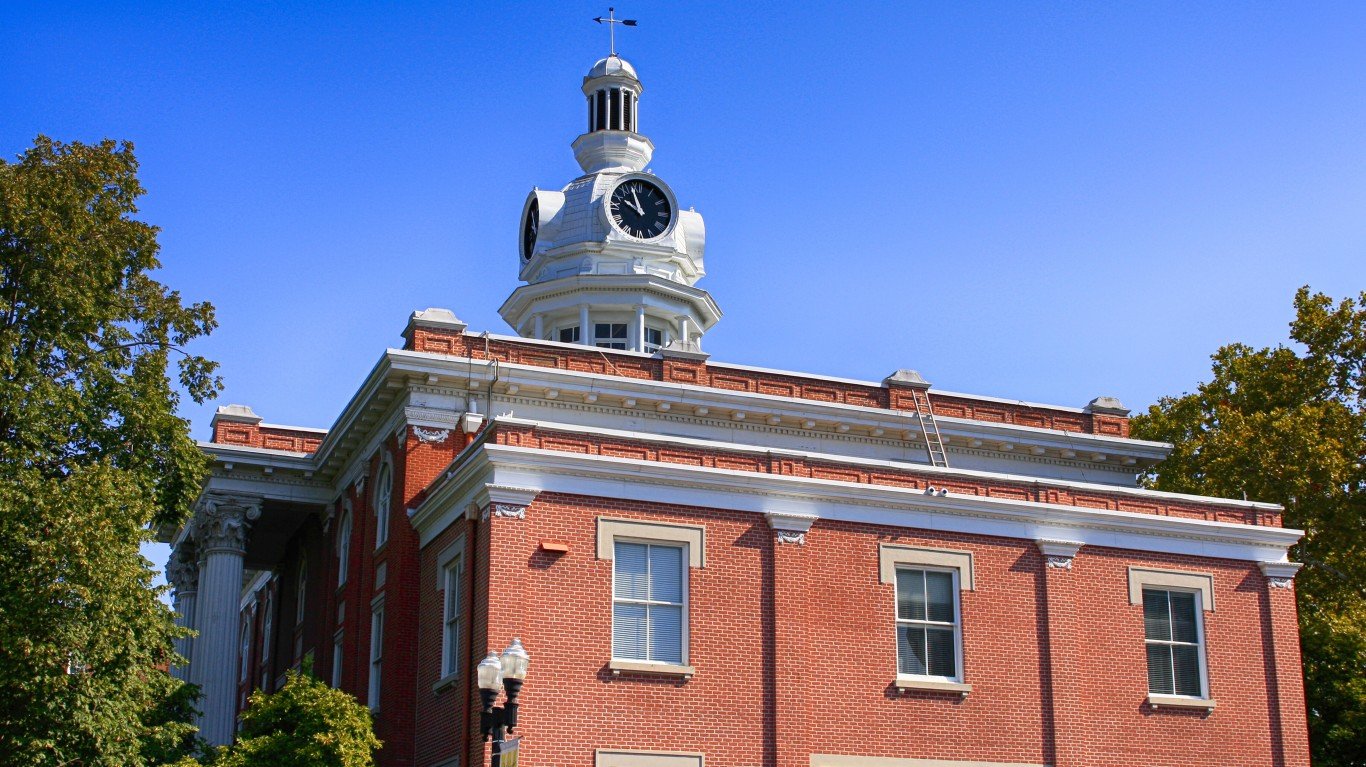
- 10-yr. population growth: 27.2% (+71,780 people)
- Total population by year: 335,595 in 2021; 263,815 in 2012
- 10-yr. change in median home value: +60.3% (+$96,600)
- Median home value by year: $256,700 in 2021; $160,100 in 2012
- 10-yr. change in employment: +35.3% (+47,731 jobs)
- Avg. unemployment rate by year: 3.6% in 2021; 6.6% in 2012
- County seat: Murfreesboro, Tennessee
36. Horry County, SC
- 10-yr. population growth: 27.3% (+73,922 people)
- Total population by year: 344,865 in 2021; 270,943 in 2012
- 10-yr. change in median home value: +21.4% (+$35,100)
- Median home value by year: $199,100 in 2021; $164,000 in 2012
- 10-yr. change in employment: +17.2% (+20,496 jobs)
- Avg. unemployment rate by year: 5.0% in 2021; 10.1% in 2012
- County seat: Conway, South Carolina
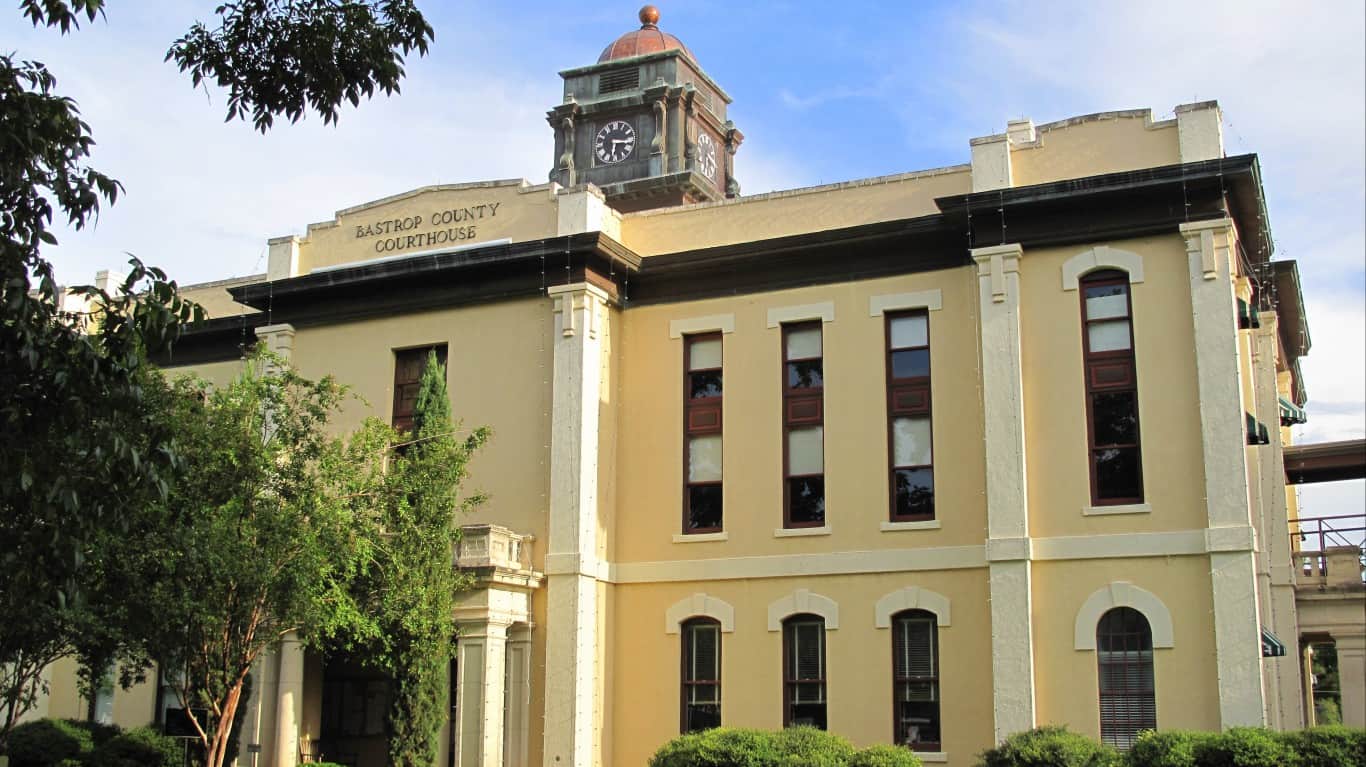
35. Bastrop County, TX
- 10-yr. population growth: 28.2% (+20,864 people)
- Total population by year: 94,887 in 2021; 74,023 in 2012
- 10-yr. change in median home value: +72.4% (+$87,800)
- Median home value by year: $209,000 in 2021; $121,200 in 2012
- 10-yr. change in employment: +32.3% (+10,630 jobs)
- Avg. unemployment rate by year: 4.5% in 2021; 6.6% in 2012
- County seat: Bastrop, Texas
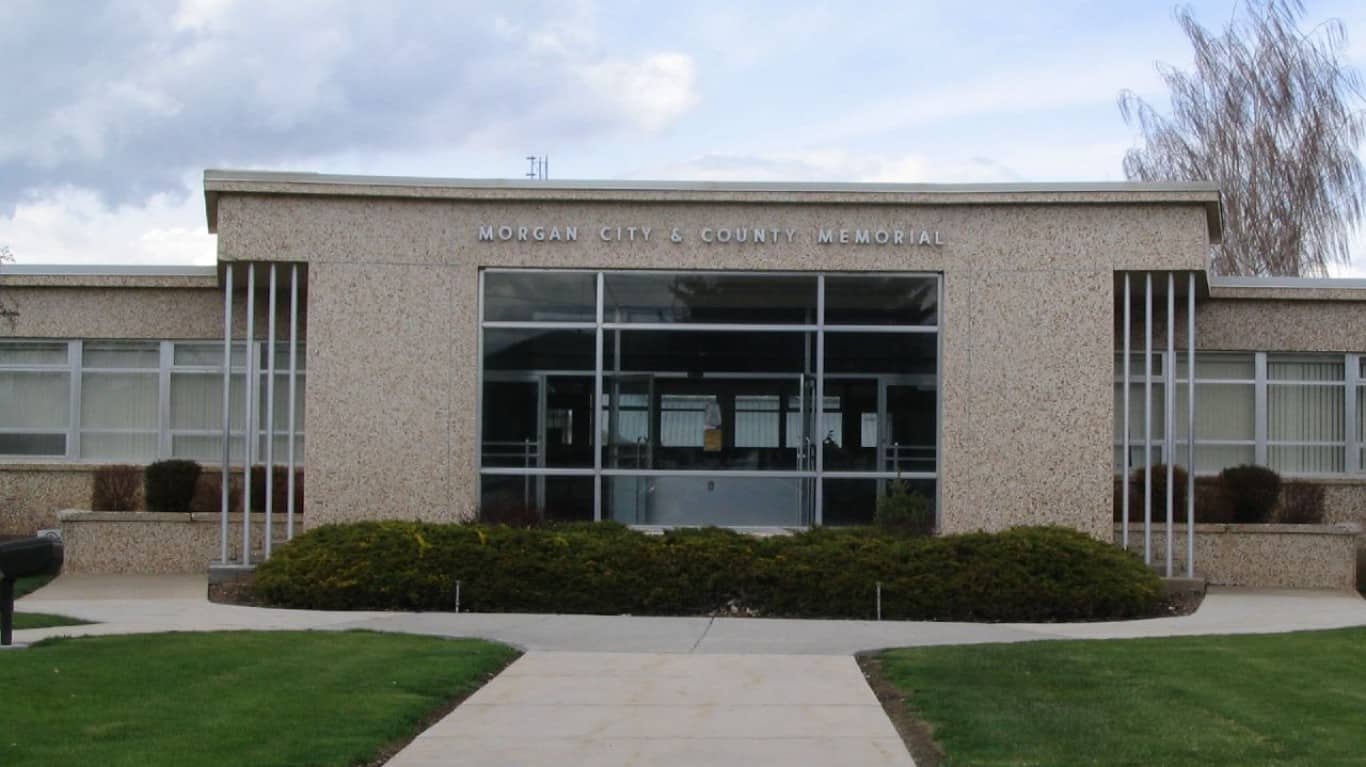
34. Morgan County, UT
- 10-yr. population growth: 28.2% (+2,677 people)
- Total population by year: 12,162 in 2021; 9,485 in 2012
- 10-yr. change in median home value: +70.4% (+$187,600)
- Median home value by year: $453,900 in 2021; $266,300 in 2012
- 10-yr. change in employment: +39.3% (+1,601 jobs)
- Avg. unemployment rate by year: 2.2% in 2021; 4.3% in 2012
- County seat: Morgan, Utah
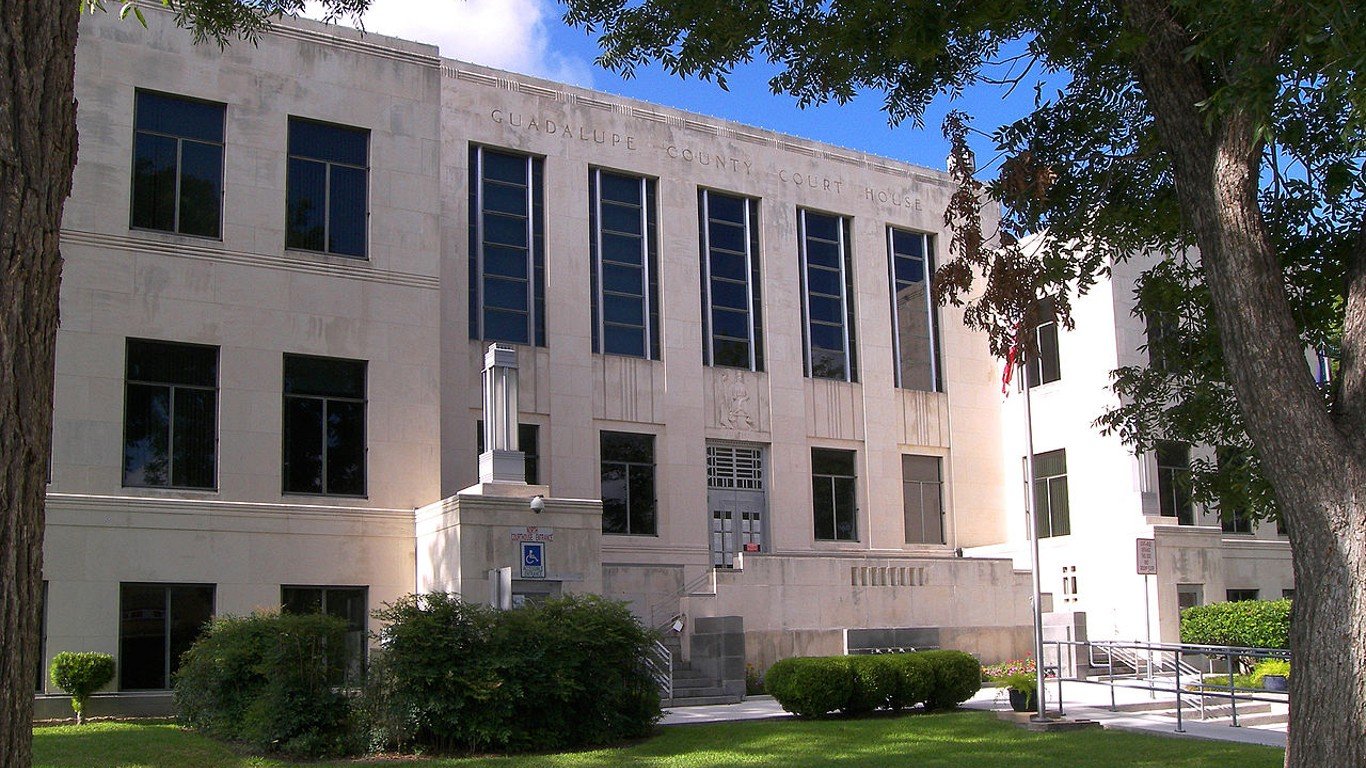
33. Guadalupe County, TX
- 10-yr. population growth: 28.4% (+37,532 people)
- Total population by year: 169,477 in 2021; 131,945 in 2012
- 10-yr. change in median home value: +43.0% (+$66,400)
- Median home value by year: $220,700 in 2021; $154,300 in 2012
- 10-yr. change in employment: +23.1% (+14,857 jobs)
- Avg. unemployment rate by year: 4.5% in 2021; 5.6% in 2012
- County seat: Seguin, Texas
32. Gallatin County, MT
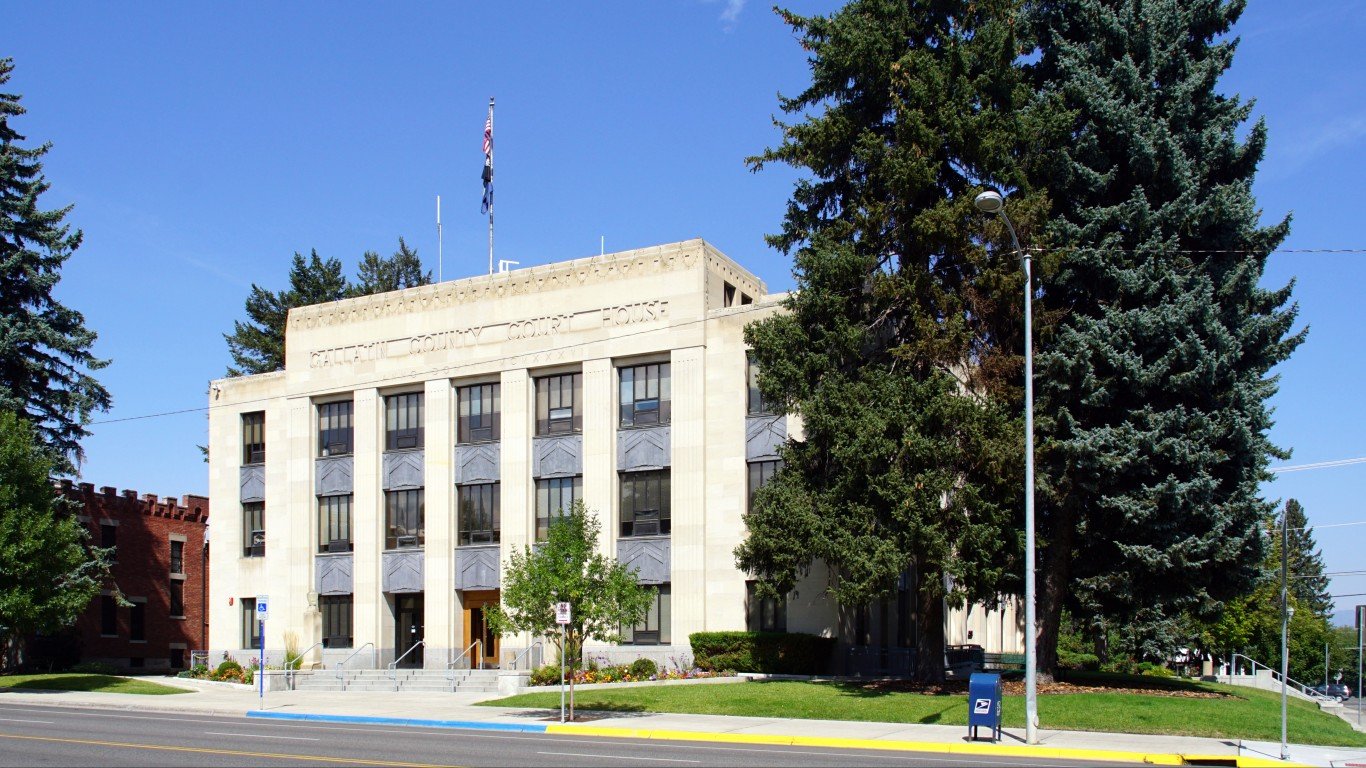
- 10-yr. population growth: 29.2% (+26,386 people)
- Total population by year: 116,725 in 2021; 90,339 in 2012
- 10-yr. change in median home value: +61.0% (+$164,900)
- Median home value by year: $435,400 in 2021; $270,500 in 2012
- 10-yr. change in employment: +45.0% (+22,446 jobs)
- Avg. unemployment rate by year: 2.4% in 2021; 5.0% in 2012
- County seat: Bozeman, Montana
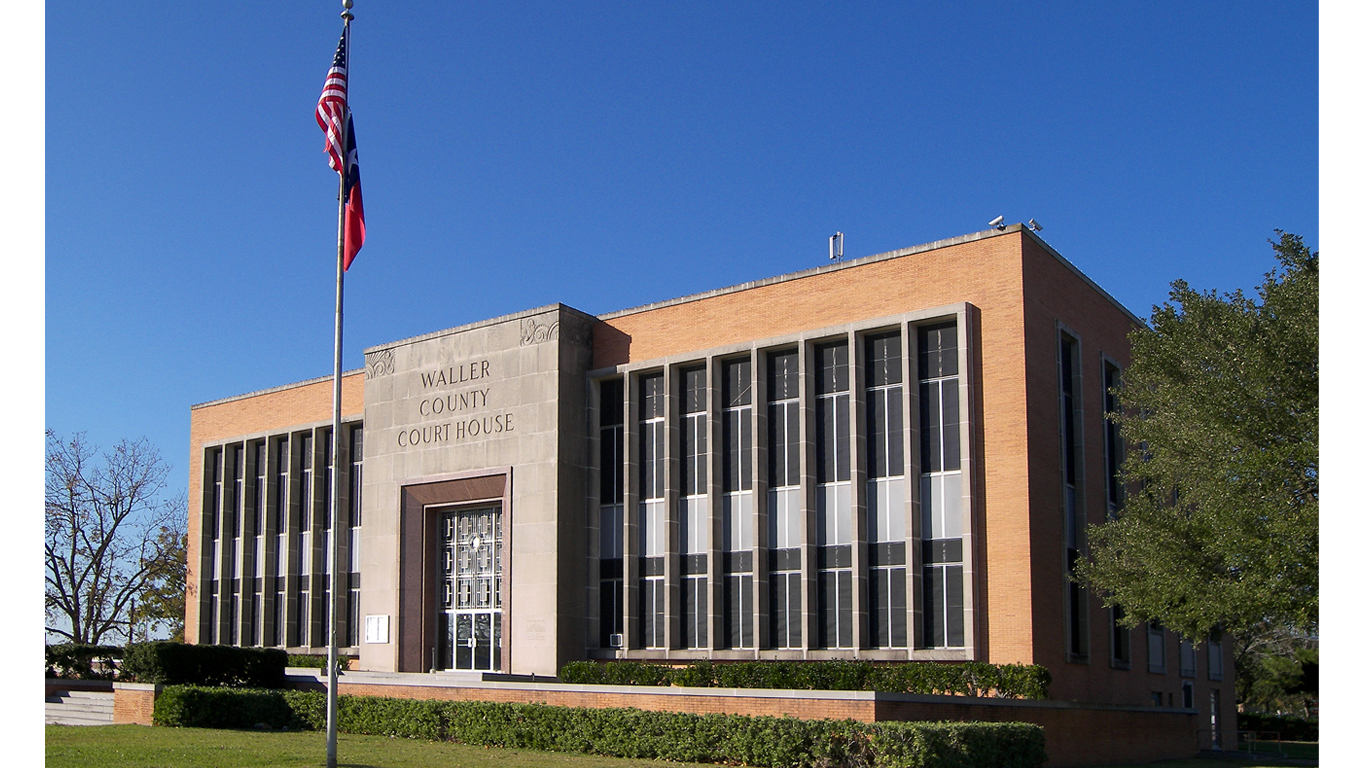
31. Waller County, TX
- 10-yr. population growth: 29.4% (+12,611 people)
- Total population by year: 55,505 in 2021; 42,894 in 2012
- 10-yr. change in median home value: +79.2% (+$106,800)
- Median home value by year: $241,700 in 2021; $134,900 in 2012
- 10-yr. change in employment: +22.8% (+4,330 jobs)
- Avg. unemployment rate by year: 6.3% in 2021; 7.0% in 2012
- County seat: Hempstead, Texas
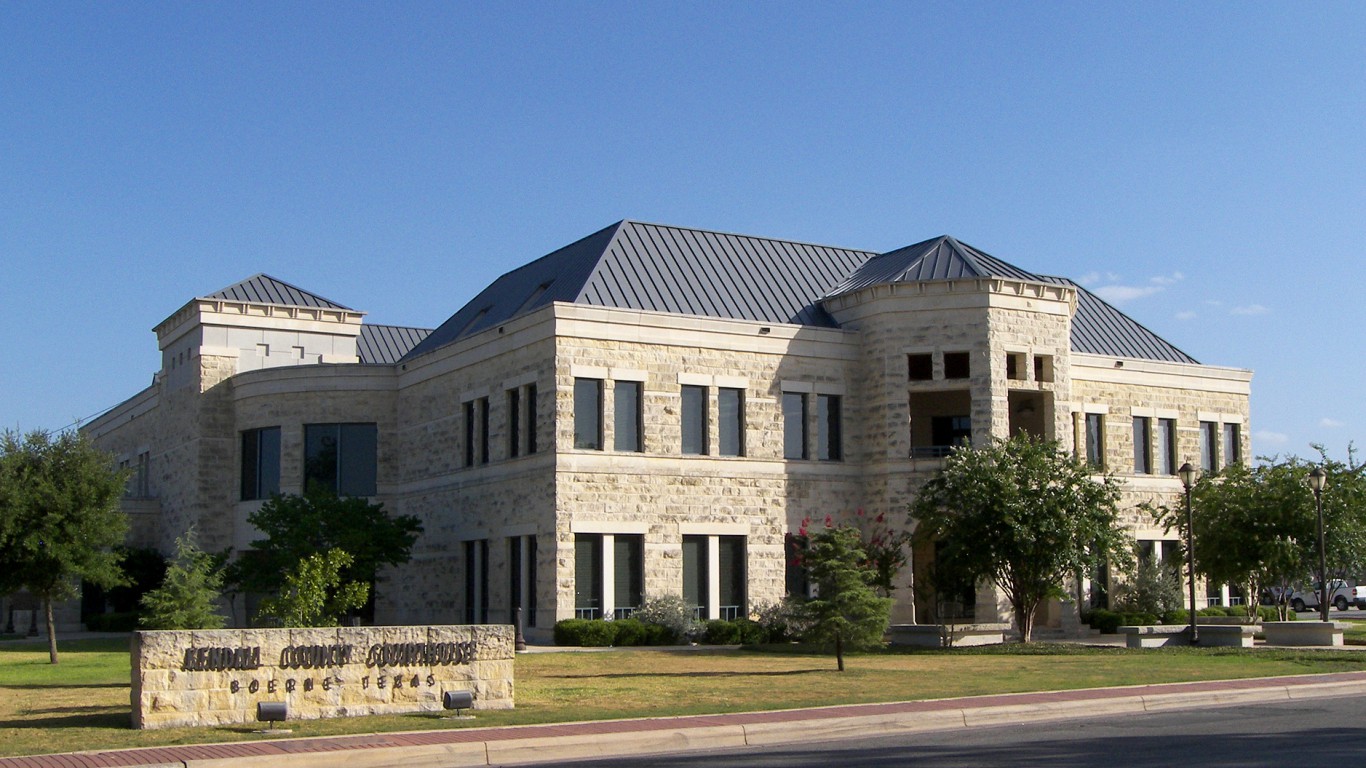
30. Kendall County, TX
- 10-yr. population growth: 29.9% (+10,097 people)
- Total population by year: 43,842 in 2021; 33,745 in 2012
- 10-yr. change in median home value: +44.1% (+$120,400)
- Median home value by year: $393,200 in 2021; $272,800 in 2012
- 10-yr. change in employment: +33.8% (+5,579 jobs)
- Avg. unemployment rate by year: 3.9% in 2021; 5.4% in 2012
- County seat: Boerne, Texas
29. Canadian County, OK
- 10-yr. population growth: 30.0% (+34,875 people)
- Total population by year: 151,174 in 2021; 116,299 in 2012
- 10-yr. change in median home value: +31.1% (+$42,800)
- Median home value by year: $180,400 in 2021; $137,600 in 2012
- 10-yr. change in employment: +24.8% (+15,065 jobs)
- Avg. unemployment rate by year: 3.4% in 2021; 3.8% in 2012
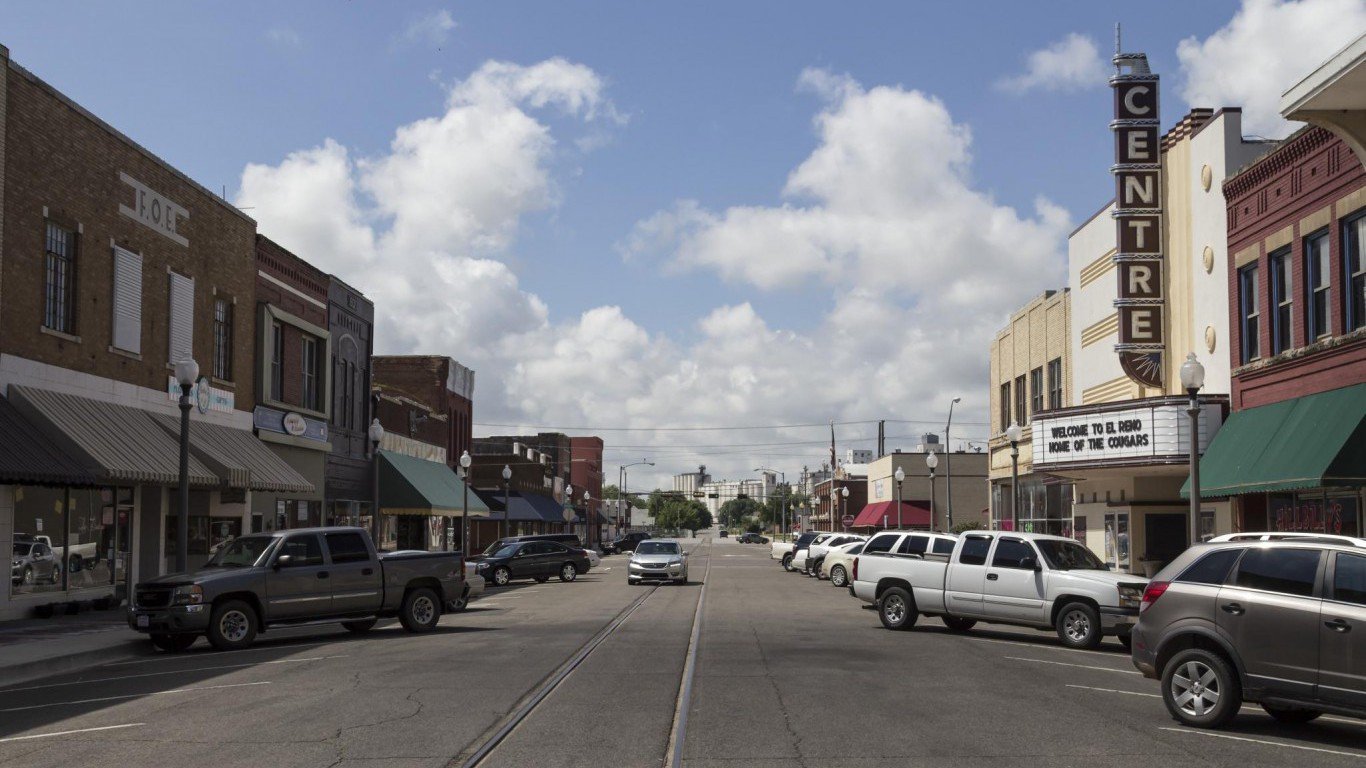
- County seat: El Reno, Oklahoma
28. Broomfield County, CO
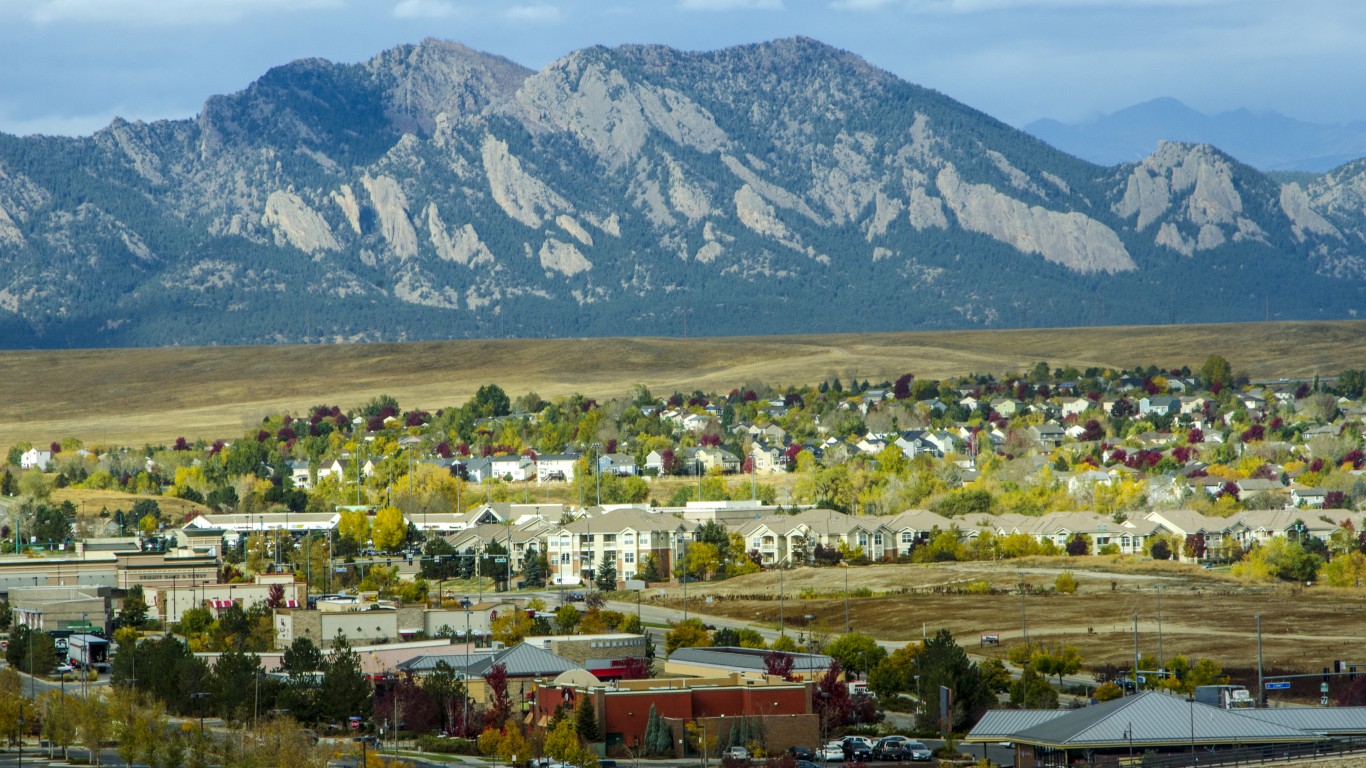
- 10-yr. population growth: 30.0% (+16,784 people)
- Total population by year: 72,697 in 2021; 55,913 in 2012
- 10-yr. change in median home value: +75.4% (+$207,200)
- Median home value by year: $482,100 in 2021; $274,900 in 2012
- 10-yr. change in employment: +32.1% (+9,643 jobs)
- Avg. unemployment rate by year: 4.6% in 2021; 6.7% in 2012
- County seat: Broomfield, Colorado
27. Chambers County, TX
- 10-yr. population growth: 30.9% (+10,695 people)
- Total population by year: 45,257 in 2021; 34,562 in 2012
- 10-yr. change in median home value: +66.7% (+$96,700)
- Median home value by year: $241,700 in 2021; $145,000 in 2012
- 10-yr. change in employment: +21.2% (+3,340 jobs)
- Avg. unemployment rate by year: 8.1% in 2021; 8.0% in 2012
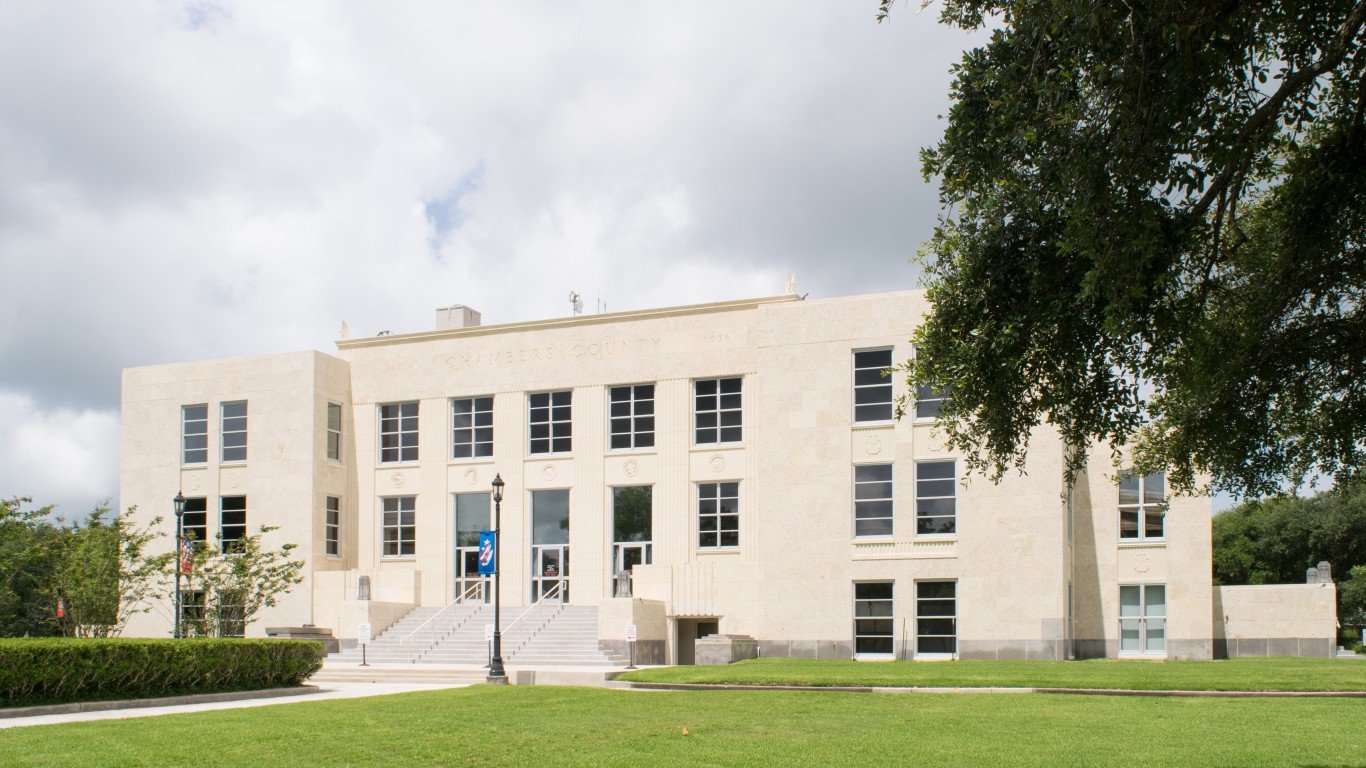
- County seat: Anahuac, Texas
26. Loudoun County, VA
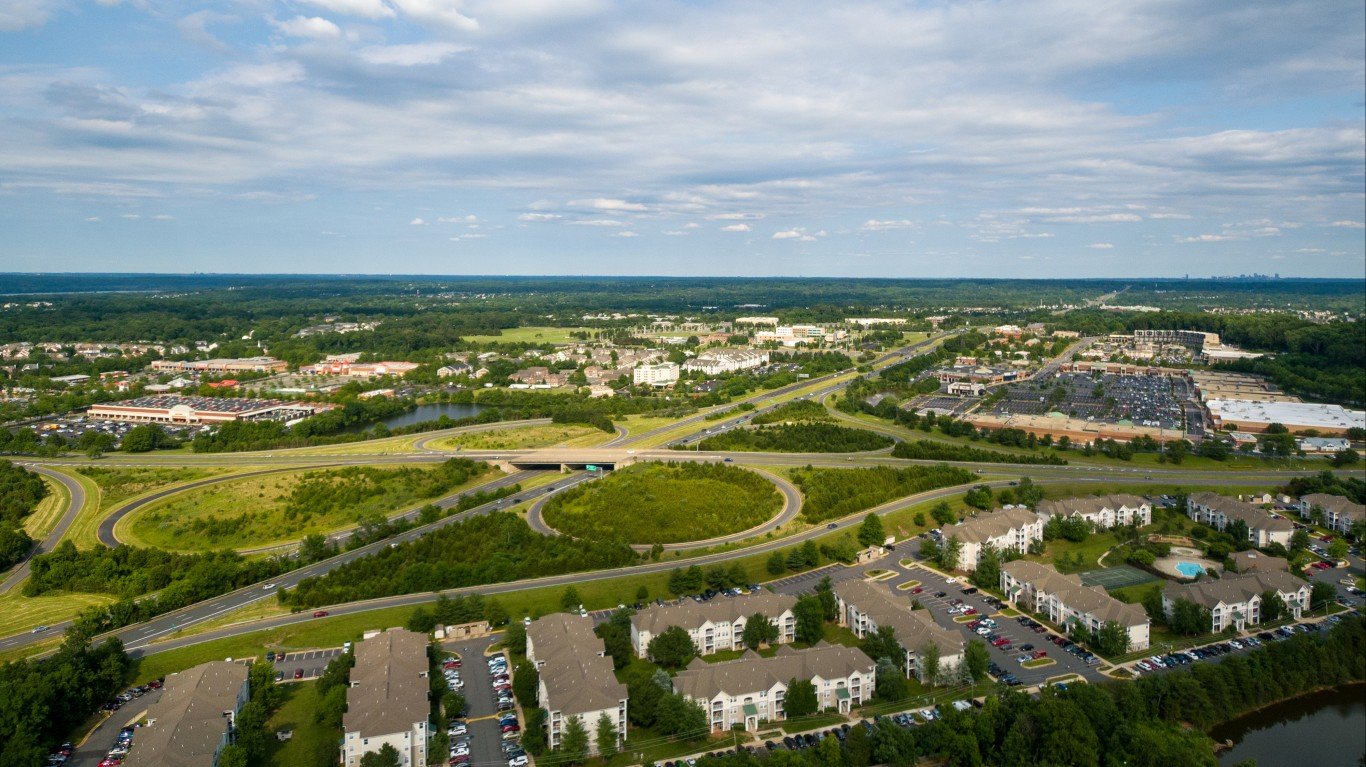
- 10-yr. population growth: 31.3% (+98,594 people)
- Total population by year: 413,574 in 2021; 314,980 in 2012
- 10-yr. change in median home value: +26.8% (+$120,400)
- Median home value by year: $569,100 in 2021; $448,700 in 2012
- 10-yr. change in employment: +23.0% (+40,888 jobs)
- Avg. unemployment rate by year: 3.1% in 2021; 4.4% in 2012
- County seat: Leesburg, Virginia
25. Williamson County, TN
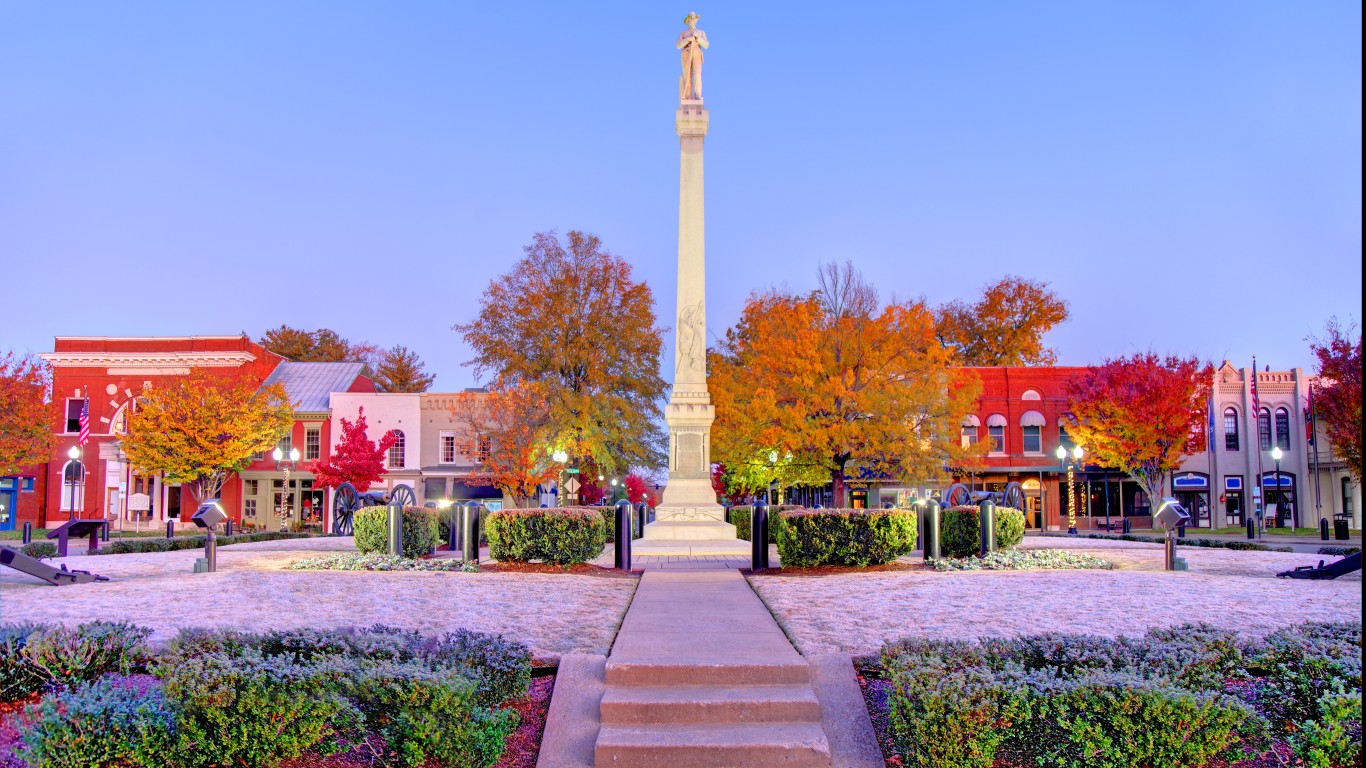
- 10-yr. population growth: 31.6% (+58,161 people)
- Total population by year: 242,386 in 2021; 184,225 in 2012
- 10-yr. change in median home value: +47.6% (+$160,500)
- Median home value by year: $497,500 in 2021; $337,000 in 2012
- 10-yr. change in employment: +38.6% (+36,211 jobs)
- Avg. unemployment rate by year: 2.6% in 2021; 5.0% in 2012
- County seat: Franklin, Tennessee
24. Collin County, TX

- 10-yr. population growth: 31.9% (+251,232 people)
- Total population by year: 1,039,812 in 2021; 788,580 in 2012
- 10-yr. change in median home value: +73.3% (+$150,200)
- Median home value by year: $355,100 in 2021; $204,900 in 2012
- 10-yr. change in employment: +37.0% (+155,186 jobs)
- Avg. unemployment rate by year: 4.4% in 2021; 5.9% in 2012
- County seat: McKinney, Texas
23. Denton County, TX
- 10-yr. population growth: 32.5% (+217,078 people)
- Total population by year: 885,012 in 2021; 667,934 in 2012
- 10-yr. change in median home value: +76.2% (+$138,800)
- Median home value by year: $321,000 in 2021; $182,200 in 2012
- 10-yr. change in employment: +38.5% (+140,935 jobs)
- Avg. unemployment rate by year: 4.4% in 2021; 5.7% in 2012
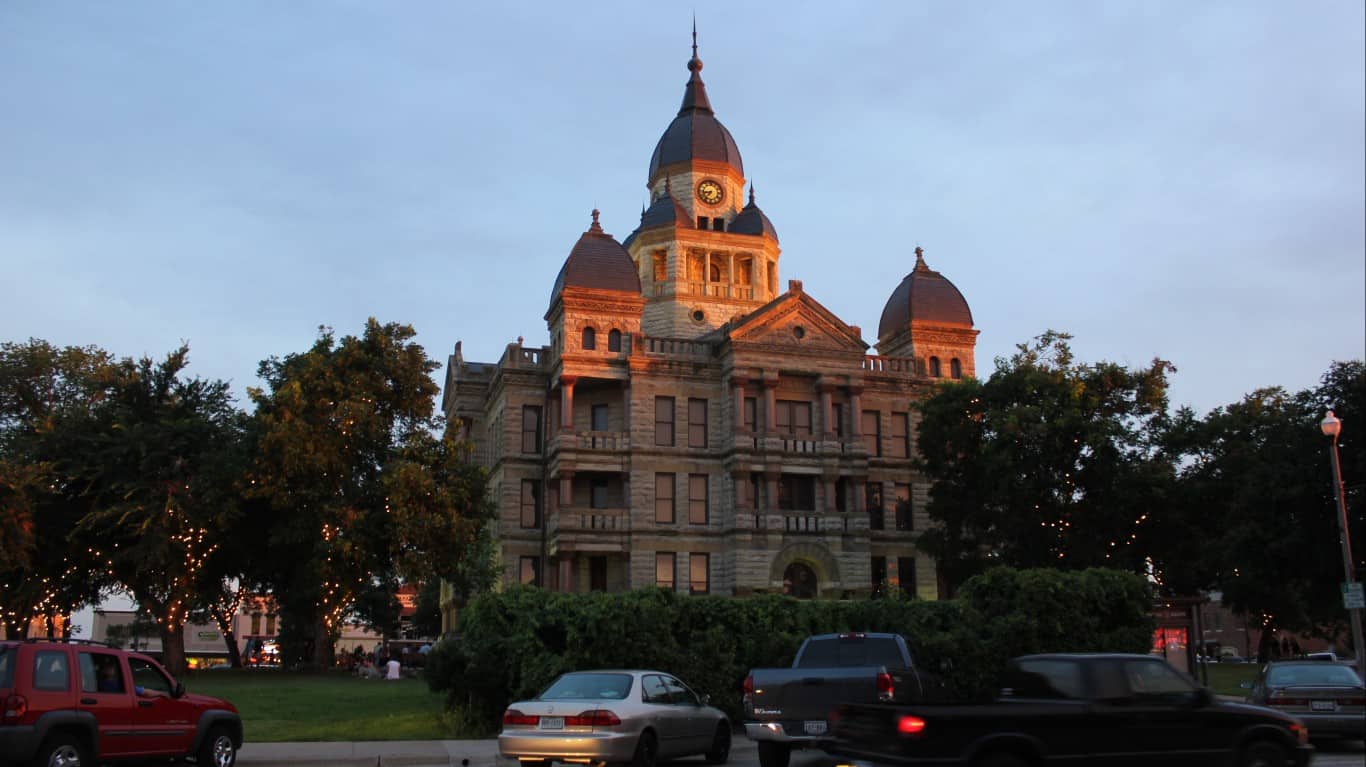
- County seat: Denton, Texas
22. Stark County, ND
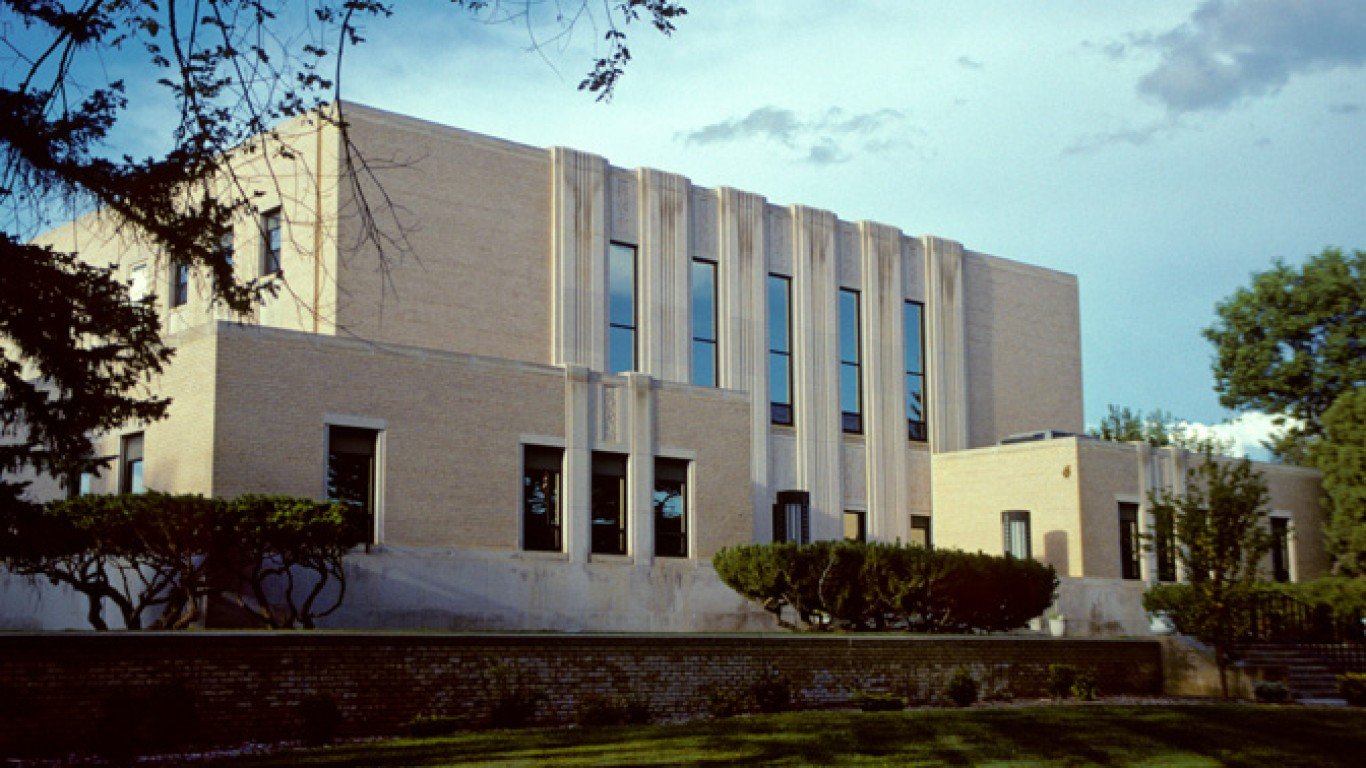
- 10-yr. population growth: 32.5% (+8,028 people)
- Total population by year: 32,710 in 2021; 24,682 in 2012
- 10-yr. change in median home value: +60.0% (+$89,500)
- Median home value by year: $238,700 in 2021; $149,200 in 2012
- 10-yr. change in employment: -5.2% (-923 jobs)
- Avg. unemployment rate by year: 3.9% in 2021; 1.7% in 2012
- County seat: Dickinson, North Dakota
21. Montgomery County, TX
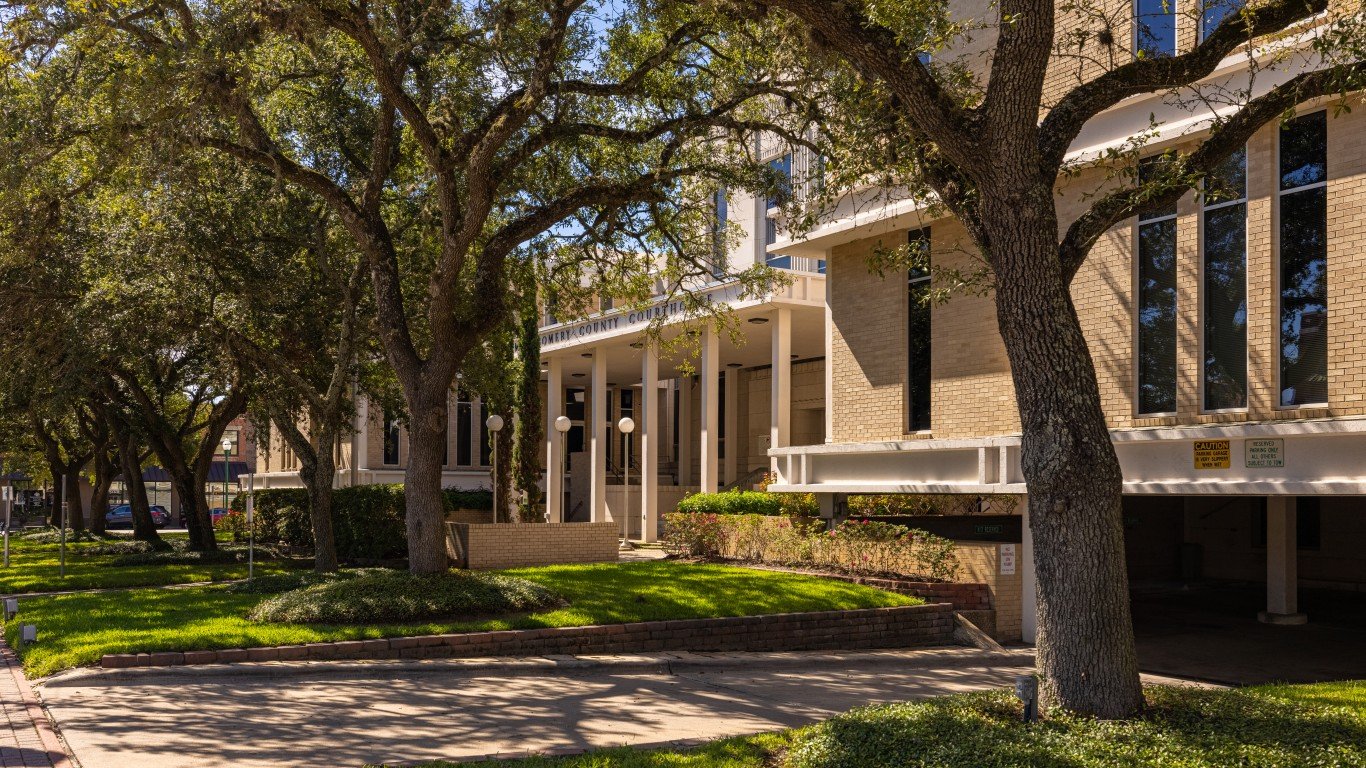
- 10-yr. population growth: 32.7% (+149,660 people)
- Total population by year: 607,999 in 2021; 458,339 in 2012
- 10-yr. change in median home value: +56.9% (+$93,500)
- Median home value by year: $257,700 in 2021; $164,200 in 2012
- 10-yr. change in employment: +23.9% (+53,730 jobs)
- Avg. unemployment rate by year: 5.8% in 2021; 5.9% in 2012
- County seat: Conroe, Texas
20. Walton County, FL

- 10-yr. population growth: 32.7% (+18,107 people)
- Total population by year: 73,456 in 2021; 55,349 in 2012
- 10-yr. change in median home value: +67.2% (+$110,300)
- Median home value by year: $274,500 in 2021; $164,200 in 2012
- 10-yr. change in employment: +35.3% (+8,527 jobs)
- Avg. unemployment rate by year: 3.6% in 2021; 7.5% in 2012
- County seat: DeFuniak Springs, Florida
19. Rockwall County, TX

- 10-yr. population growth: 33.6% (+26,478 people)
- Total population by year: 105,227 in 2021; 78,749 in 2012
- 10-yr. change in median home value: +54.7% (+$106,200)
- Median home value by year: $300,200 in 2021; $194,000 in 2012
- 10-yr. change in employment: +41.0% (+15,809 jobs)
- Avg. unemployment rate by year: 4.4% in 2021; 6.1% in 2012
- County seat: Rockwall, Texas
18. Sumter County, FL
- 10-yr. population growth: 35.1% (+33,095 people)
- Total population by year: 127,335 in 2021; 94,240 in 2012
- 10-yr. change in median home value: +49.3% (+$92,500)
- Median home value by year: $280,100 in 2021; $187,600 in 2012
- 10-yr. change in employment: +39.0% (+9,275 jobs)
- Avg. unemployment rate by year: 5.4% in 2021; 10.9% in 2012
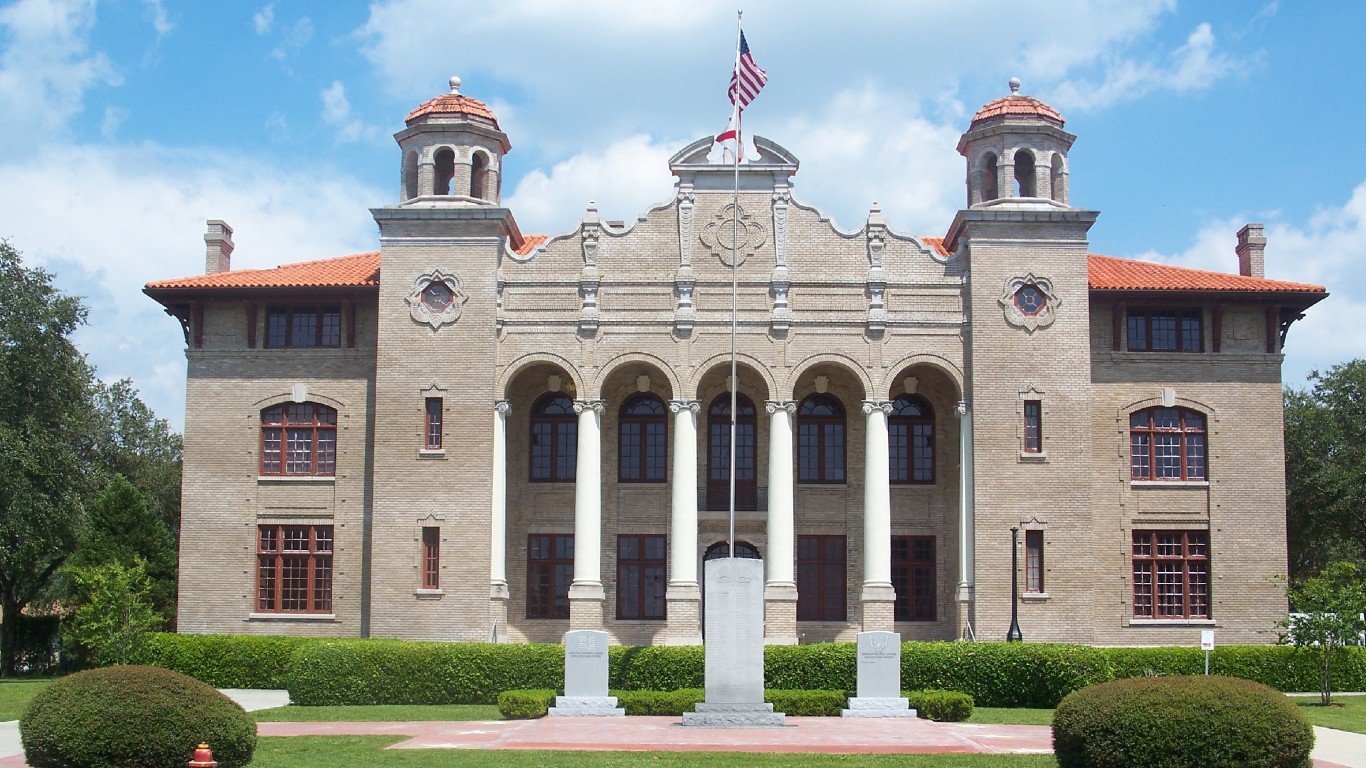
- County seat: Bushnell, Florida
17. Nantucket County, MA

- 10-yr. population growth: 35.3% (+3,601 people)
- Total population by year: 13,795 in 2021; 10,194 in 2012
- 10-yr. change in median home value: +14.7% (+$138,800)
- Median home value by year: $1,082,900 in 2021; $944,100 in 2012
- 10-yr. change in employment: +21.6% (+1,277 jobs)
- Avg. unemployment rate by year: 7.4% in 2021; 7.9% in 2012
- County seat: Nantucket, Massachusetts
16. Kaufman County, TX
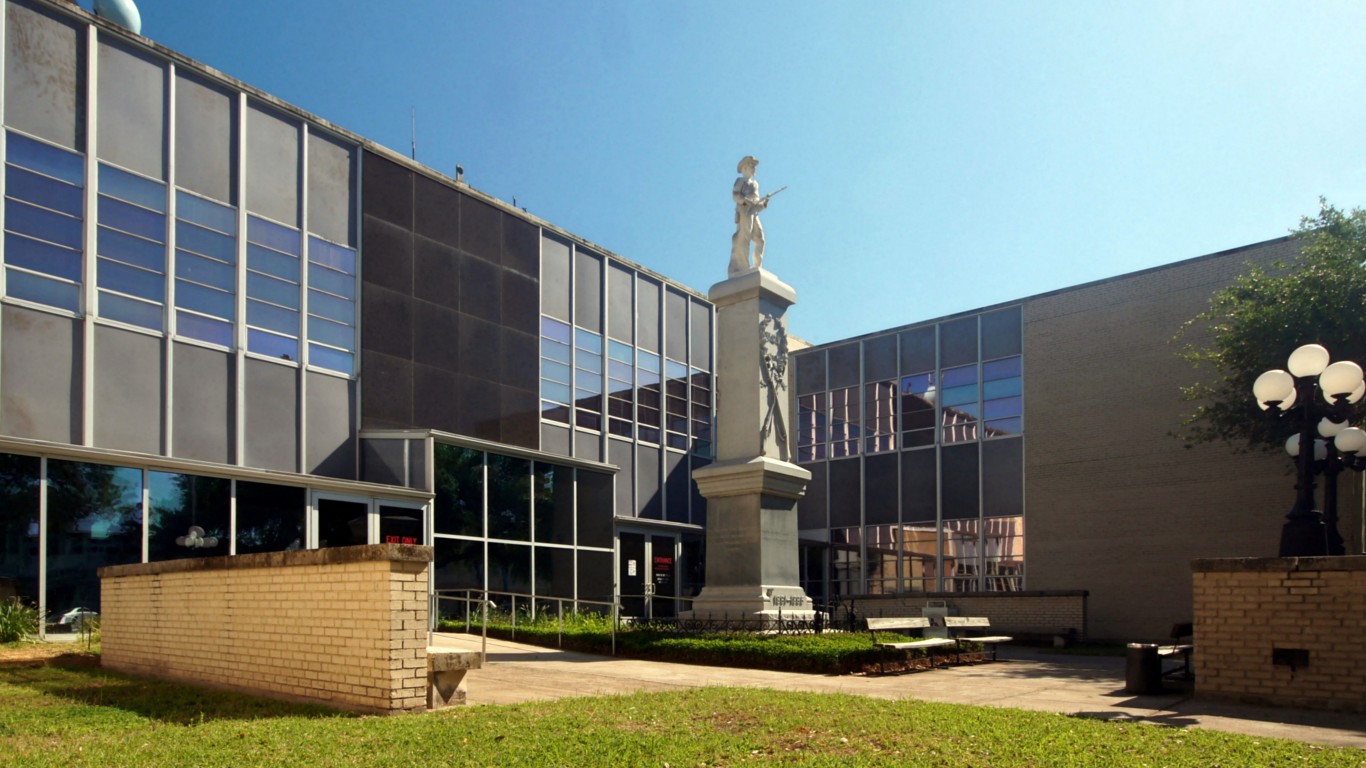
- 10-yr. population growth: 35.6% (+36,760 people)
- Total population by year: 140,145 in 2021; 103,385 in 2012
- 10-yr. change in median home value: +69.2% (+$88,500)
- Median home value by year: $216,300 in 2021; $127,800 in 2012
- 10-yr. change in employment: +43.1% (+20,653 jobs)
- Avg. unemployment rate by year: 4.9% in 2021; 6.9% in 2012
- County seat: Kaufman, Texas
15. Madison County, ID

- 10-yr. population growth: 36.6% (+13,668 people)
- Total population by year: 50,979 in 2021; 37,311 in 2012
- 10-yr. change in median home value: +51.9% (+$89,000)
- Median home value by year: $260,600 in 2021; $171,600 in 2012
- 10-yr. change in employment: +29.7% (+5,243 jobs)
- Avg. unemployment rate by year: 2.2% in 2021; 4.7% in 2012
- County seat: Rexburg, Idaho
14. Fort Bend County, TX
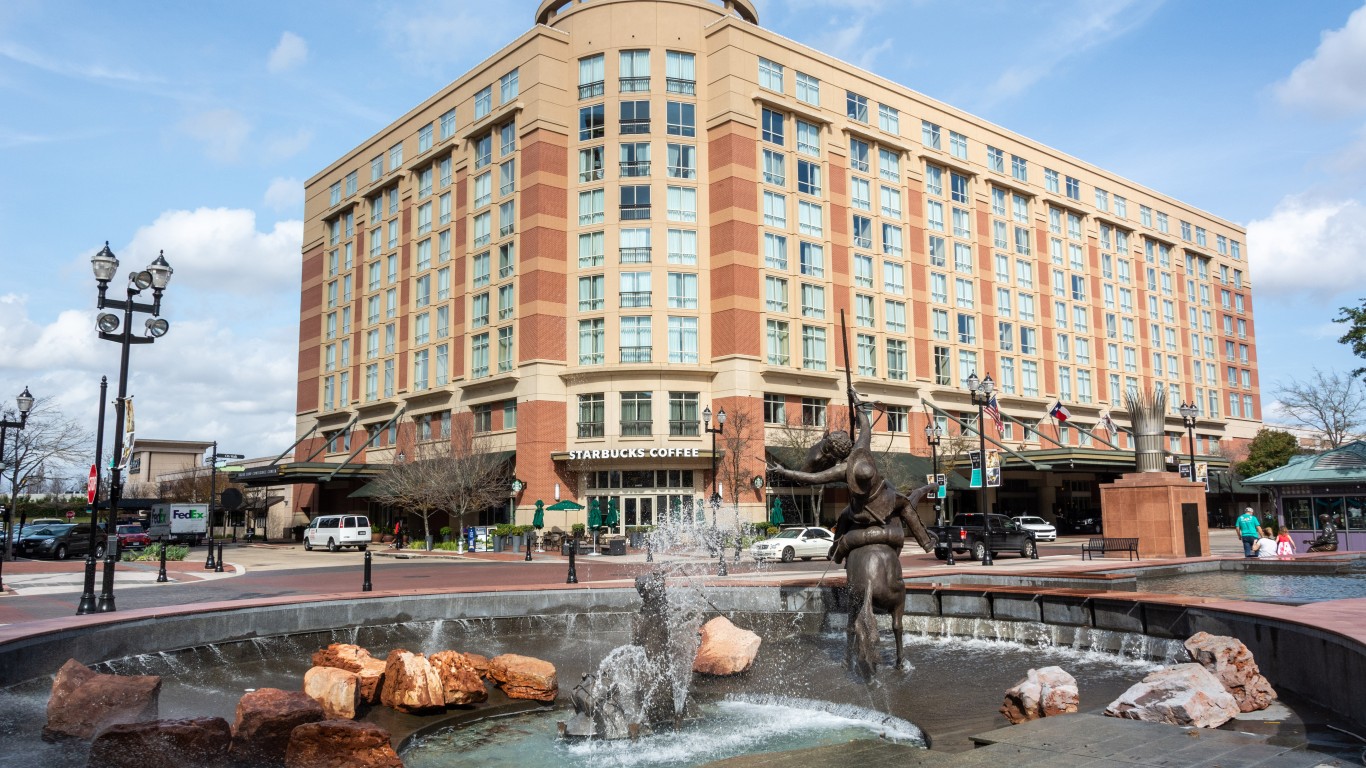
- 10-yr. population growth: 37.2% (+218,831 people)
- Total population by year: 806,497 in 2021; 587,666 in 2012
- 10-yr. change in median home value: +59.9% (+$107,700)
- Median home value by year: $287,500 in 2021; $179,800 in 2012
- 10-yr. change in employment: +28.8% (+86,150 jobs)
- Avg. unemployment rate by year: 5.9% in 2021; 5.9% in 2012
- County seat: Richmond, Texas
13. St. Johns County, FL

- 10-yr. population growth: 38.8% (+74,229 people)
- Total population by year: 265,724 in 2021; 191,495 in 2012
- 10-yr. change in median home value: +36.0% (+$92,100)
- Median home value by year: $348,100 in 2021; $256,000 in 2012
- 10-yr. change in employment: +43.6% (+42,053 jobs)
- Avg. unemployment rate by year: 3.1% in 2021; 6.7% in 2012
- County seat: St. Augustine, Florida
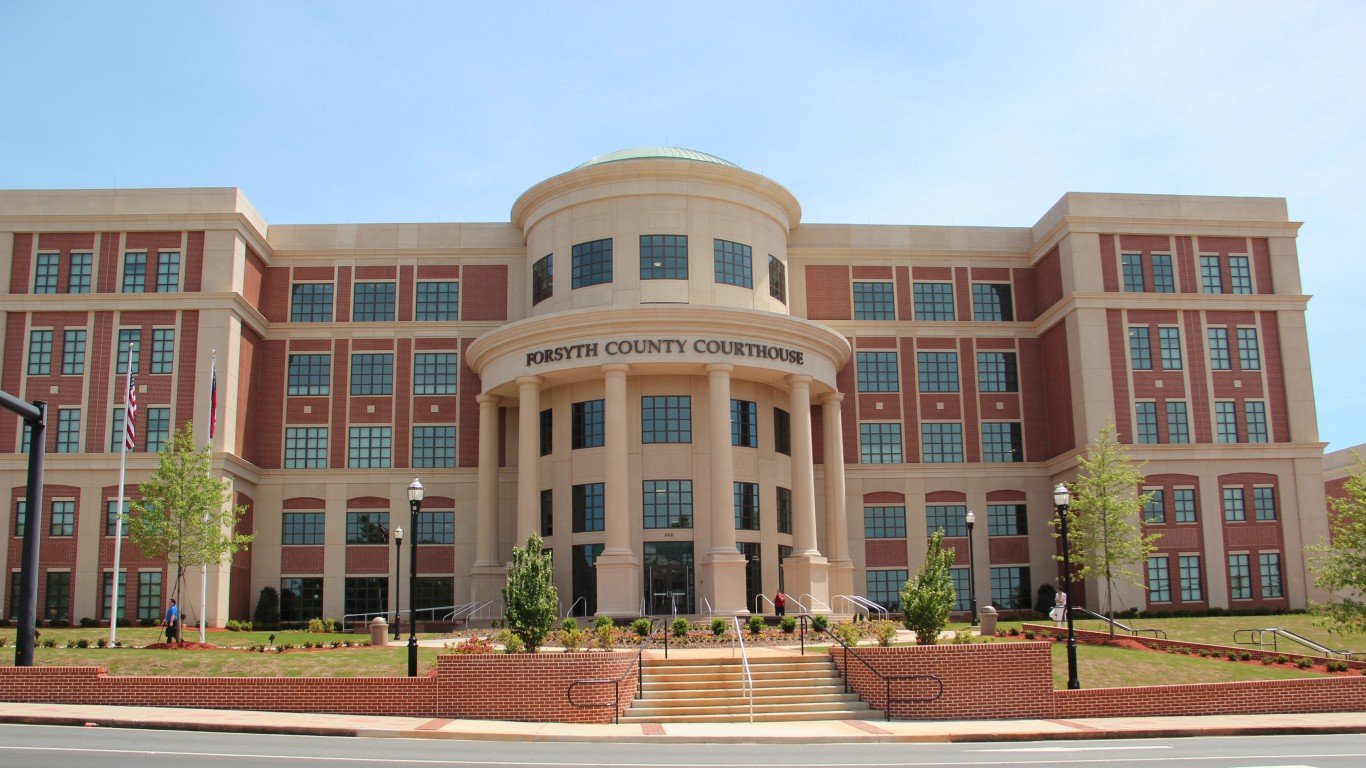
12. Forsyth County, GA
- 10-yr. population growth: 38.8% (+68,651 people)
- Total population by year: 245,754 in 2021; 177,103 in 2012
- 10-yr. change in median home value: +45.0% (+$119,700)
- Median home value by year: $385,600 in 2021; $265,900 in 2012
- 10-yr. change in employment: +42.0% (+36,734 jobs)
- Avg. unemployment rate by year: 2.5% in 2021; 6.5% in 2012
- County seat: Cumming, Georgia
11. Williamson County, TX
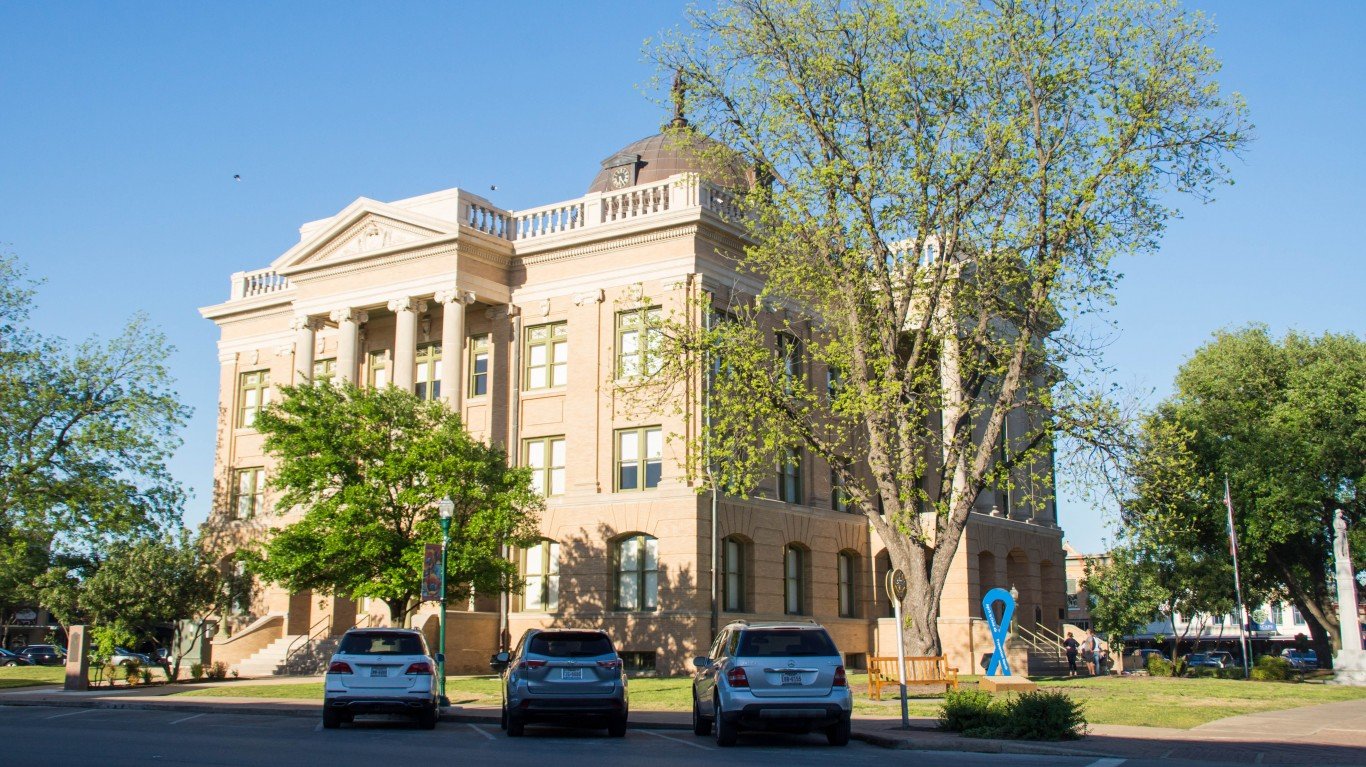
- 10-yr. population growth: 38.8% (+165,463 people)
- Total population by year: 591,759 in 2021; 426,296 in 2012
- 10-yr. change in median home value: +74.2% (+$131,400)
- Median home value by year: $308,400 in 2021; $177,000 in 2012
- 10-yr. change in employment: +48.0% (+107,087 jobs)
- Avg. unemployment rate by year: 4.0% in 2021; 5.8% in 2012
- County seat: Georgetown, Texas
10. Osceola County, FL
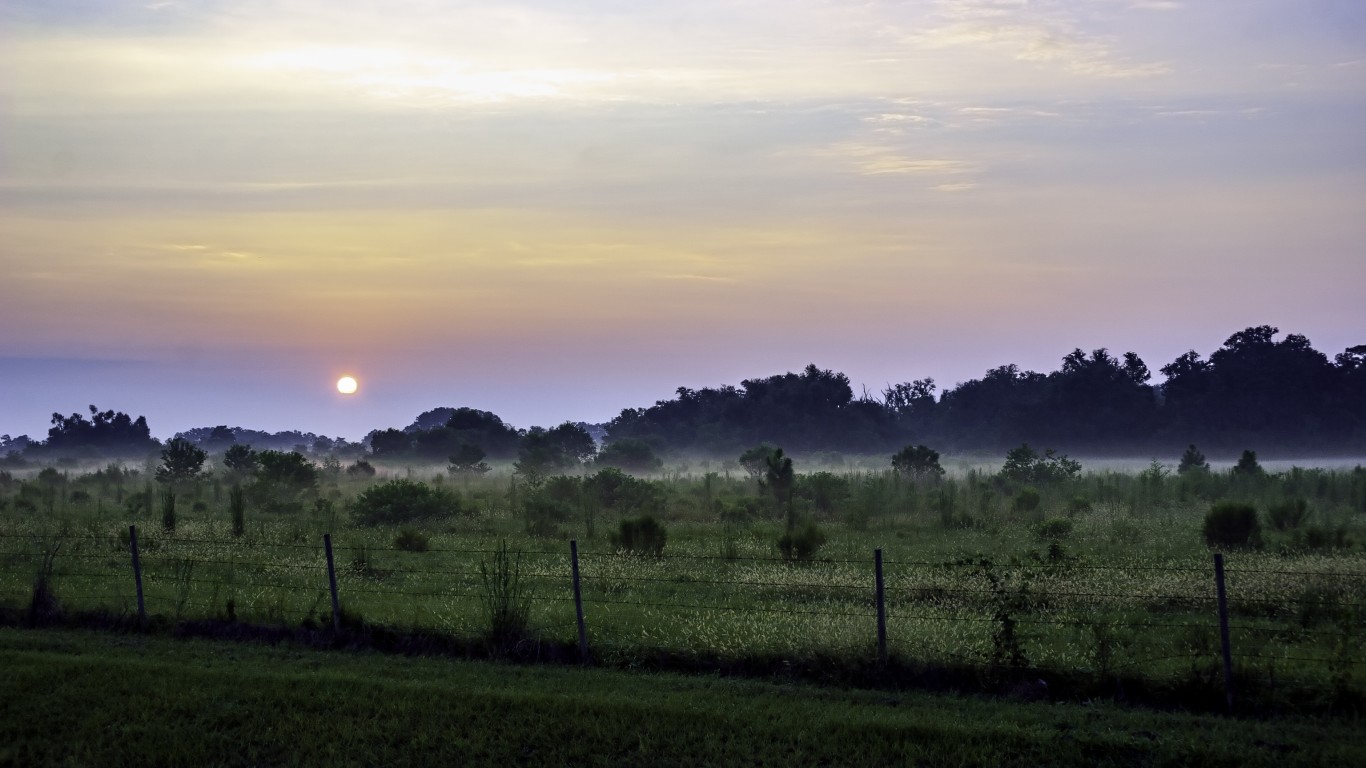
- 10-yr. population growth: 39.6% (+107,976 people)
- Total population by year: 380,331 in 2021; 272,355 in 2012
- 10-yr. change in median home value: +63.3% (+$92,500)
- Median home value by year: $238,700 in 2021; $146,200 in 2012
- 10-yr. change in employment: +35.9% (+46,255 jobs)
- Avg. unemployment rate by year: 6.2% in 2021; 9.7% in 2012
- County seat: Kissimmee, Florida
9. Lincoln County, SD
- 10-yr. population growth: 40.3% (+18,178 people)
- Total population by year: 63,233 in 2021; 45,055 in 2012
- 10-yr. change in median home value: +36.7% (+$66,700)
- Median home value by year: $248,600 in 2021; $181,900 in 2012
- 10-yr. change in employment: +32.7% (+8,905 jobs)
- Avg. unemployment rate by year: 2.1% in 2021; 3.1% in 2012
- County seat: Canton, South Dakota
8. Bryan County, GA

- 10-yr. population growth: 41.4% (+12,662 people)
- Total population by year: 43,278 in 2021; 30,616 in 2012
- 10-yr. change in median home value: +28.9% (+$54,700)
- Median home value by year: $243,800 in 2021; $189,100 in 2012
- 10-yr. change in employment: +38.9% (+5,400 jobs)
- Avg. unemployment rate by year: 2.9% in 2021; 8.2% in 2012
- County seat: Pembroke, Georgia
7. Comal County, TX
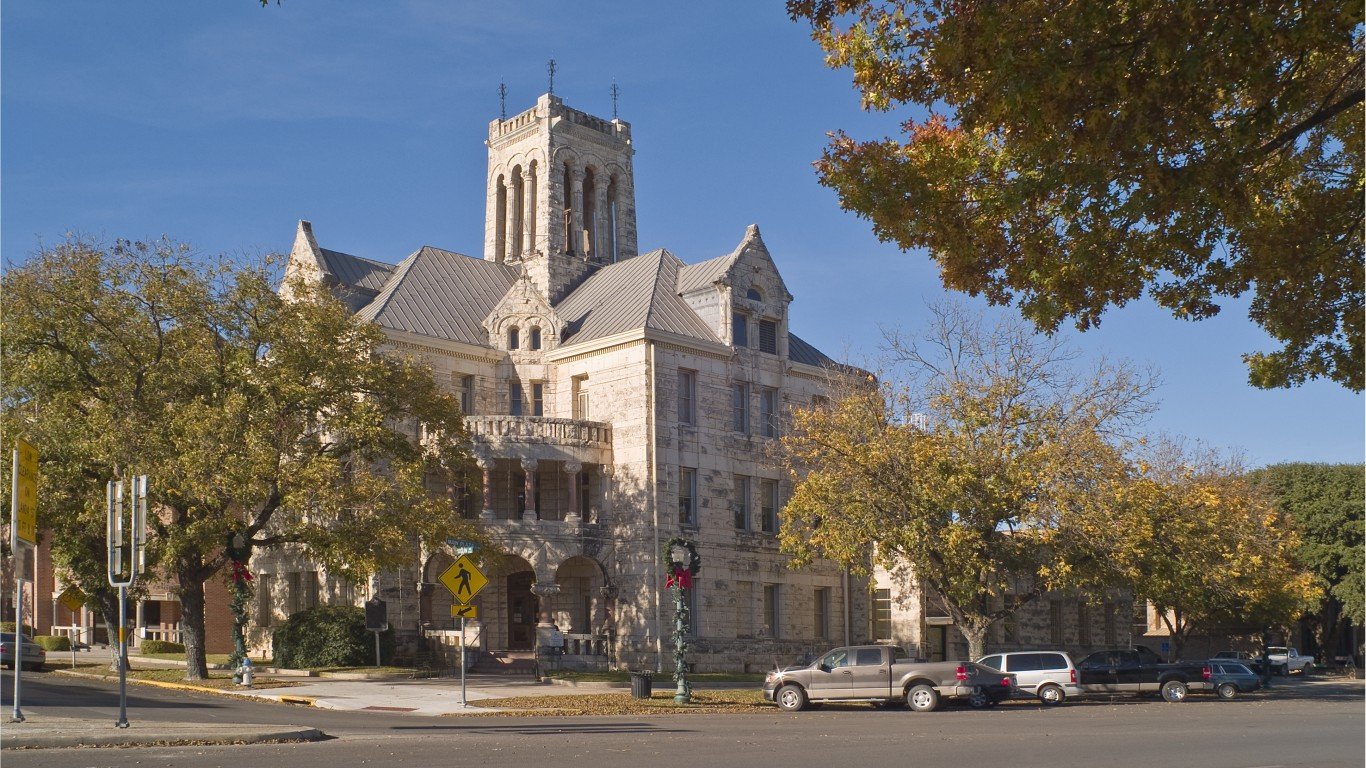
- 10-yr. population growth: 43.4% (+47,272 people)
- Total population by year: 156,257 in 2021; 108,985 in 2012
- 10-yr. change in median home value: +53.8% (+$108,700)
- Median home value by year: $310,900 in 2021; $202,200 in 2012
- 10-yr. change in employment: +45.2% (+23,683 jobs)
- Avg. unemployment rate by year: 4.6% in 2021; 6.0% in 2012
- County seat: New Braunfels, Texas
6. Wasatch County, UT

- 10-yr. population growth: 43.8% (+10,367 people)
- Total population by year: 34,028 in 2021; 23,661 in 2012
- 10-yr. change in median home value: +56.3% (+$176,600)
- Median home value by year: $490,500 in 2021; $313,900 in 2012
- 10-yr. change in employment: +52.2% (+5,671 jobs)
- Avg. unemployment rate by year: 2.9% in 2021; 5.1% in 2012
- County seat: Heber City, Utah
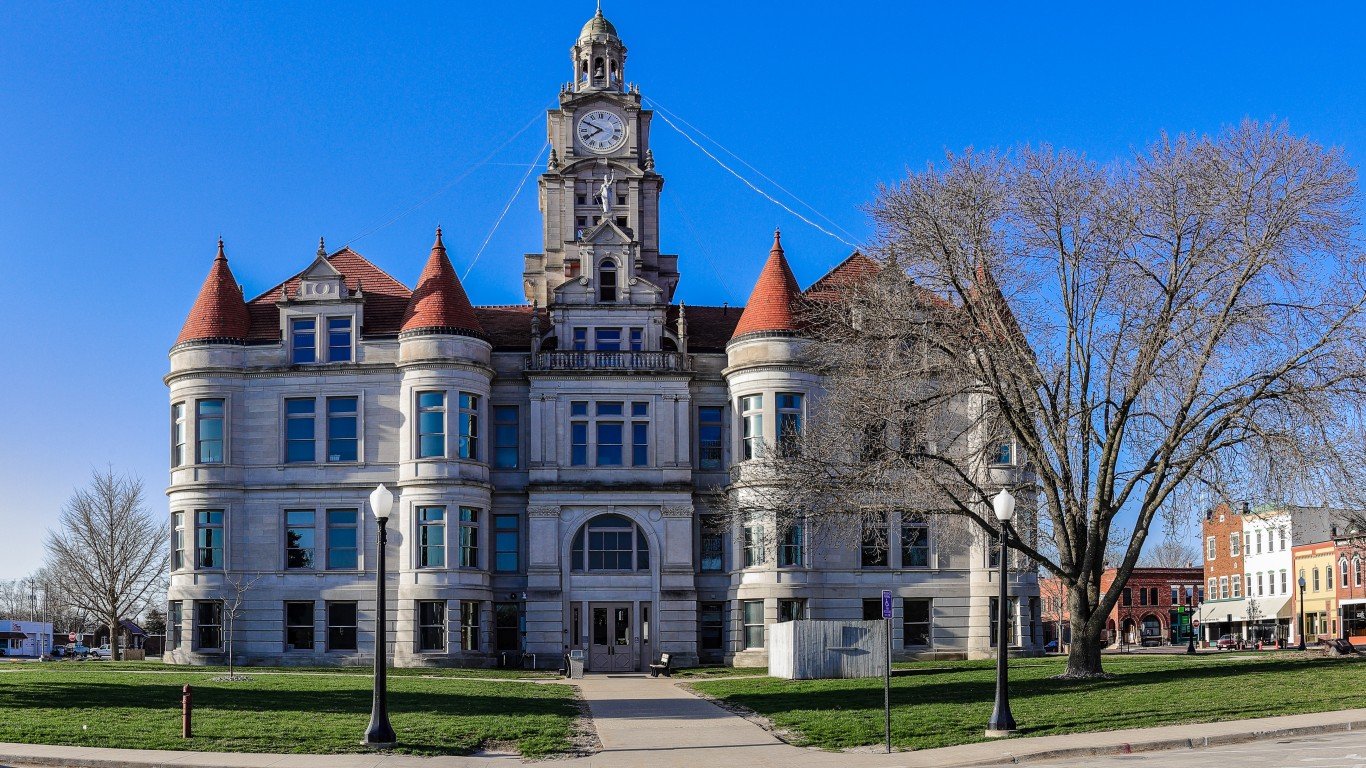
5. Dallas County, IA
- 10-yr. population growth: 44.2% (+29,607 people)
- Total population by year: 96,604 in 2021; 66,997 in 2012
- 10-yr. change in median home value: +49.9% (+$91,100)
- Median home value by year: $273,800 in 2021; $182,700 in 2012
- 10-yr. change in employment: +35.1% (+13,250 jobs)
- Avg. unemployment rate by year: 2.6% in 2021; 3.9% in 2012
- County seat: Adel, Iowa
4. Trousdale County, TN
- 10-yr. population growth: 46.5% (+3,636 people)
- Total population by year: 11,463 in 2021; 7,827 in 2012
- 10-yr. change in median home value: +52.6% (+$61,400)
- Median home value by year: $178,200 in 2021; $116,800 in 2012
- 10-yr. change in employment: +59.4% (+1,994 jobs)
- Avg. unemployment rate by year: 3.9% in 2021; 8.8% in 2012
- County seat: Hartsville, Tennessee
3. Hays County, TX
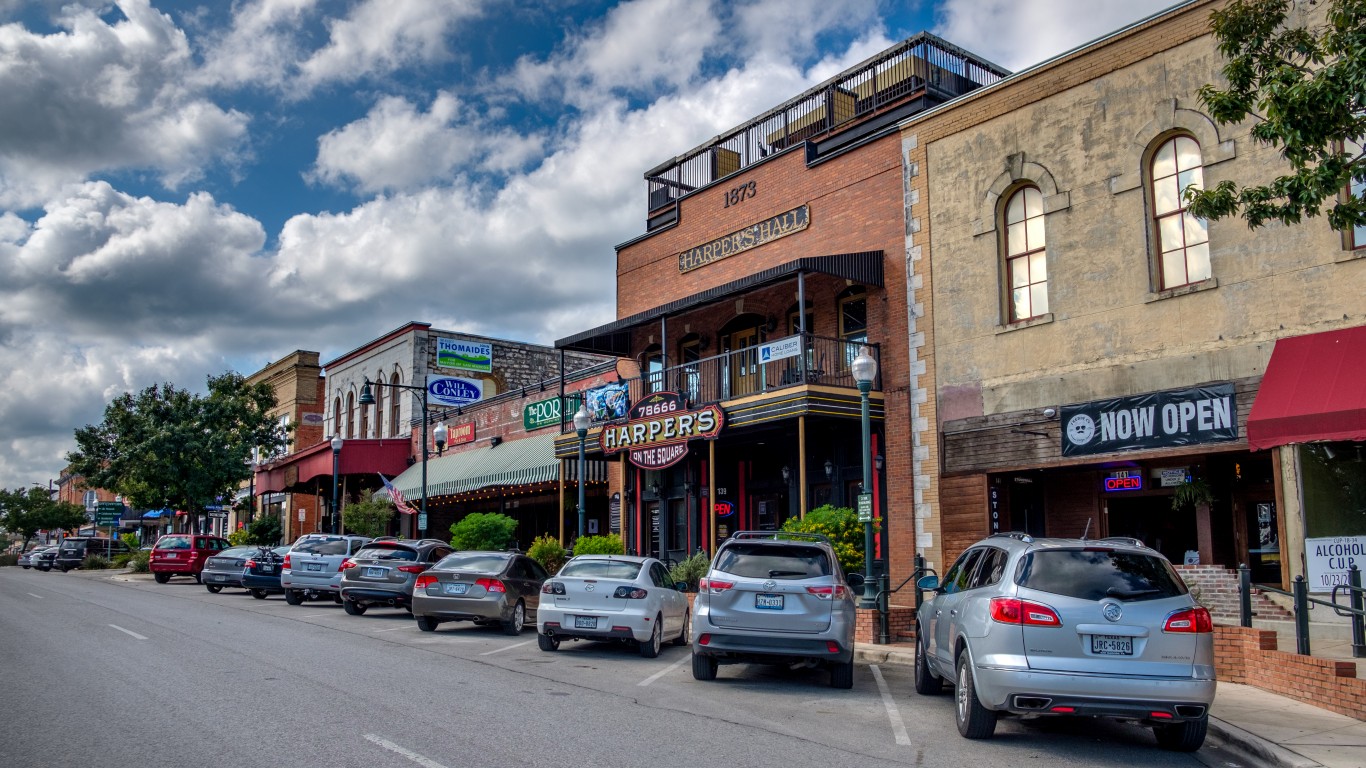
- 10-yr. population growth: 48.0% (+76,109 people)
- Total population by year: 234,573 in 2021; 158,464 in 2012
- 10-yr. change in median home value: +59.7% (+$103,900)
- Median home value by year: $278,000 in 2021; $174,100 in 2012
- 10-yr. change in employment: +55.6% (+44,851 jobs)
- Avg. unemployment rate by year: 4.1% in 2021; 5.8% in 2012
- County seat: San Marcos, Texas
2. Williams County, ND
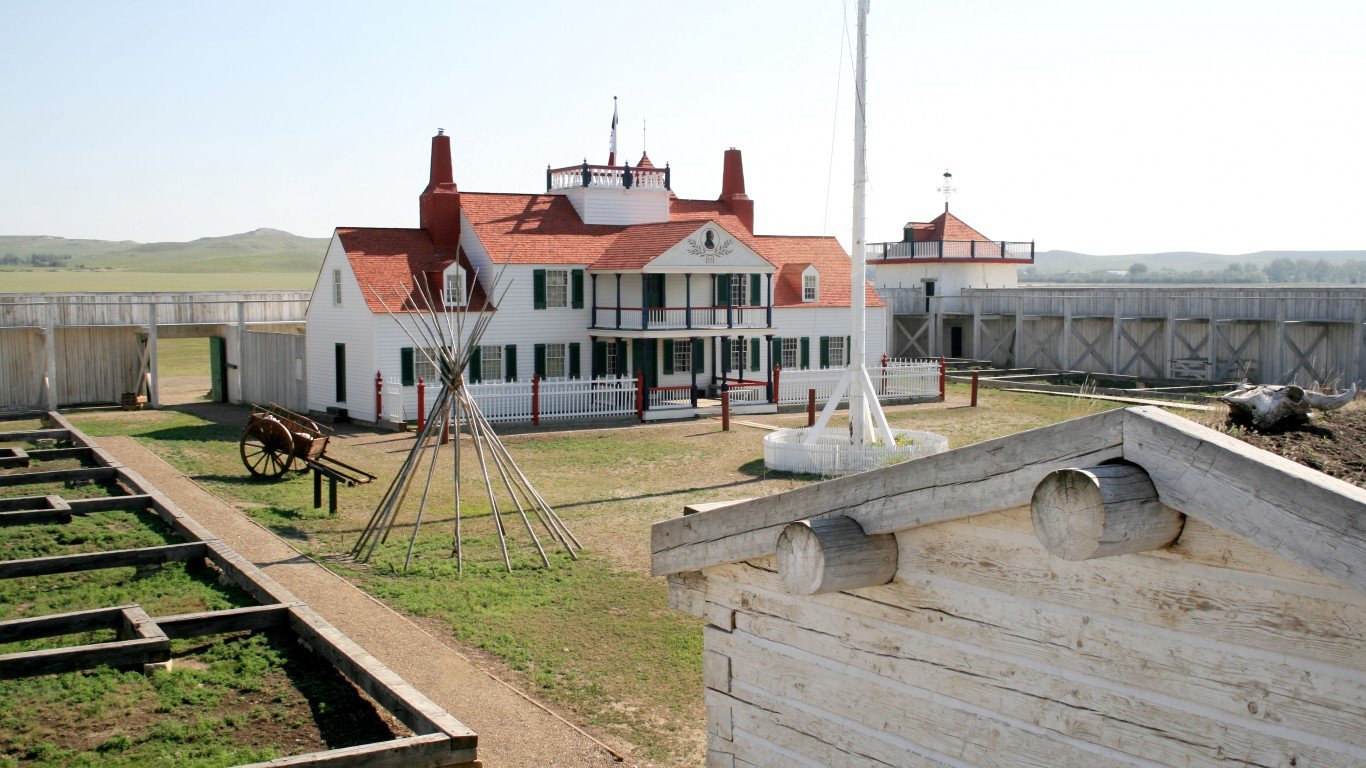
- 10-yr. population growth: 65.2% (+15,173 people)
- Total population by year: 38,460 in 2021; 23,287 in 2012
- 10-yr. change in median home value: +90.3% (+$114,200)
- Median home value by year: $240,700 in 2021; $126,500 in 2012
- 10-yr. change in employment: -25.8% (-6,883 jobs)
- Avg. unemployment rate by year: 5.4% in 2021; 1.1% in 2012
- County seat: Williston, North Dakota
1. McKenzie County, ND
- 10-yr. population growth: 105.6% (+7,070 people)
- Total population by year: 13,762 in 2021; 6,692 in 2012
- 10-yr. change in median home value: +196.4% (+$205,000)
- Median home value by year: $309,400 in 2021; $104,400 in 2012
- 10-yr. change in employment: +38.5% (+2,301 jobs)
- Avg. unemployment rate by year: 4.5% in 2021; 1.5% in 2012
- County seat: Watford City, North Dakota
ALERT: Take This Retirement Quiz Now (Sponsored)
Take the quiz below to get matched with a financial advisor today.
Each advisor has been vetted by SmartAsset and is held to a fiduciary standard to act in your best interests.
Here’s how it works:
1. Answer SmartAsset advisor match quiz
2. Review your pre-screened matches at your leisure. Check out the advisors’ profiles.
3. Speak with advisors at no cost to you. Have an introductory call on the phone or introduction in person and choose whom to work with in the future
Take the retirement quiz right here.
Thank you for reading! Have some feedback for us?
Contact the 24/7 Wall St. editorial team.


