
One of the main ways to accumulate wealth is through home buying. While homeowners were pleased to see their home equity rise during the pandemic housing boom, inflation and mortgage rates hikes put a damper on the housing market, and many homeowners watched with concern as their home equity was in jeopardy of dwindling.
Well, good news for homeowners. After the first two quarters of last year, when home equity nationwide declined, the third quarter of 2023 saw a reversal in the trend. According to property data provider Corelogic’s Homeowner Equity Report, home equity of U.S. homeowners with mortgages (which account for about 63% of all properties) increased by 6.8% year over year, or slightly more than $20,000 per borrower, on average, since the third quarter of 2022. With a total gain of $1.1 billion, the total amount of U.S. home equity for mortgaged properties now stands at $16.97 trillion.
Equity is “determined by comparing the estimated current value of the property against the mortgage debt outstanding,” CoreLogic explains. And with steady increases in house prices in the third quarter and fewer mortgage originations, home equity rose.
But of course, the housing market is not uniform nationwide, and in some states home equity declined compared to the same quarter in 2022. The question is, then, homeowners in which state can breathe a sigh of relief?
To determine the states where people are getting rich on their homes, 24/7 Wall St. reviewed a report from global property information and solutions provider CoreLogic: Homeowner Equity Insights — Q3 2023. States and the District of Columbia were ranked on their average equity gain from the third quarter of 2022 to the third quarter of 2023. CoreLogic also provided the percent of homeowners with negative equity on their homes — those who owe more on their mortgages than their homes are worth — in the third quarter of 2023. Data was not available for Mississippi, South Dakota, Vermont, and West Virginia. 24/7 Wall St. added median listing price as of January 2024 from Realtor.com Economic Research and median household income for 2022 from the Census Bureau’s American Community Survey.
In 16 state housing markets, home equity gains were at or above the national $20,000 average, with seven of them posting over $40,000 in equity gains. Among the seven are five Northeastern states: Massachusetts, Rhode Island, Connecticut, New Hampshire, and Maine. The top two states are California and Hawaii. Only three states and the District of Columbia saw a decline in home equity.
Unfortunately, some borrowers, in all states, have negative equity, also referred to as underwater mortgages. These borrowers owe more on their mortgages than their homes are currently worth. As of the third quarter of 2023, 1.8% of all mortgaged properties nationwide had negative equity. Louisiana is the state with the highest share of homeowners with negative equity, while California is the state with the smallest share.
47. Texas
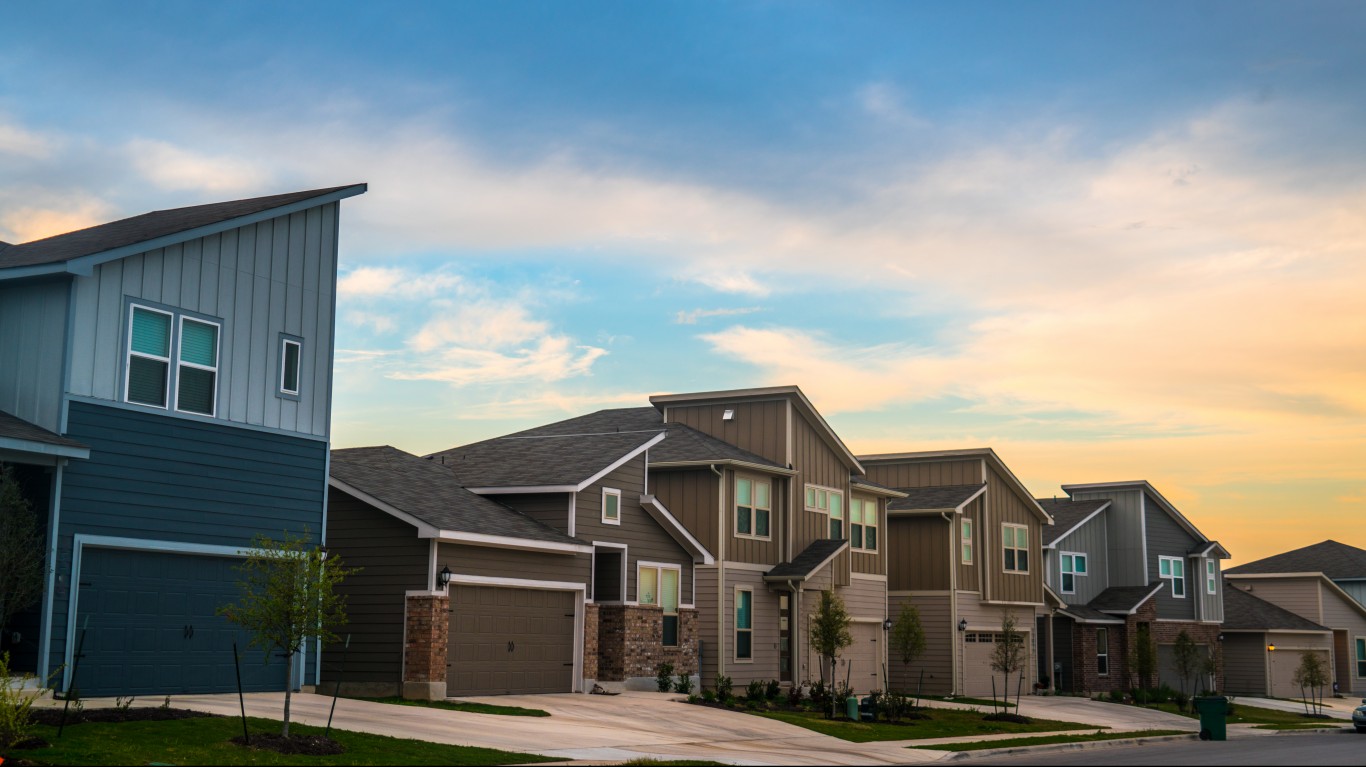
Source: RoschetzkyIstockPhoto / iStock via Getty Images
- Avg. equity gain, Q3 2022 to Q3 2023: -$8,683
- Pct. of homeowners who owe more than their home is worth: 1.8% (22nd lowest of 46 states and DC)
- Median listing price, Jan 2024: $359,945 (18th lowest of 46 states and DC)
- Median household income, 2022: $72,284 (24th highest of 46 states and DC)
- Population, 2022: 30,029,572
46. New York

Source: DebraMillet / iStock via Getty Images
- Avg. equity gain, Q3 2022 to Q3 2023: -$7,525
- Pct. of homeowners who owe more than their home is worth: 3.3% (6th highest of 46 states and DC)
- Median listing price, Jan 2024: $644,000 (4th highest of 46 states and DC)
- Median household income, 2022: $79,557 (17th highest of 46 states and DC)
- Population, 2022: 19,677,151
45. Utah

Source: georgeclerk / iStock via Getty Images
- Avg. equity gain, Q3 2022 to Q3 2023: -$873
- Pct. of homeowners who owe more than their home is worth: 1.6% (15th lowest of 46 states and DC)
- Median listing price, Jan 2024: $595,950 (8th highest of 46 states and DC)
- Median household income, 2022: $89,168 (10th highest of 46 states and DC)
- Population, 2022: 3,380,800
44. District of Columbia

Source: schuminweb / Flickr
- Avg. equity gain, Q3 2022 to Q3 2023: -$783
- Pct. of homeowners who owe more than their home is worth: 2.7% (10th highest of 46 states and DC)
- Median listing price, Jan 2024: $619,900 (5th highest of 46 states and DC)
- Median household income, 2022: $101,027 (the highest of 46 states and DC)
- Population, 2022: 671,803
43. Louisiana

Source: Kruck20 / iStock via Getty Images
- Avg. equity gain, Q3 2022 to Q3 2023: +$3,265
- Pct. of homeowners who owe more than their home is worth: 6.1% (the highest of 46 states and DC)
- Median listing price, Jan 2024: $275,000 (3rd lowest of 46 states and DC)
- Median household income, 2022: $55,416 (the lowest of 46 states and DC)
- Population, 2022: 4,590,241
42. Oklahoma
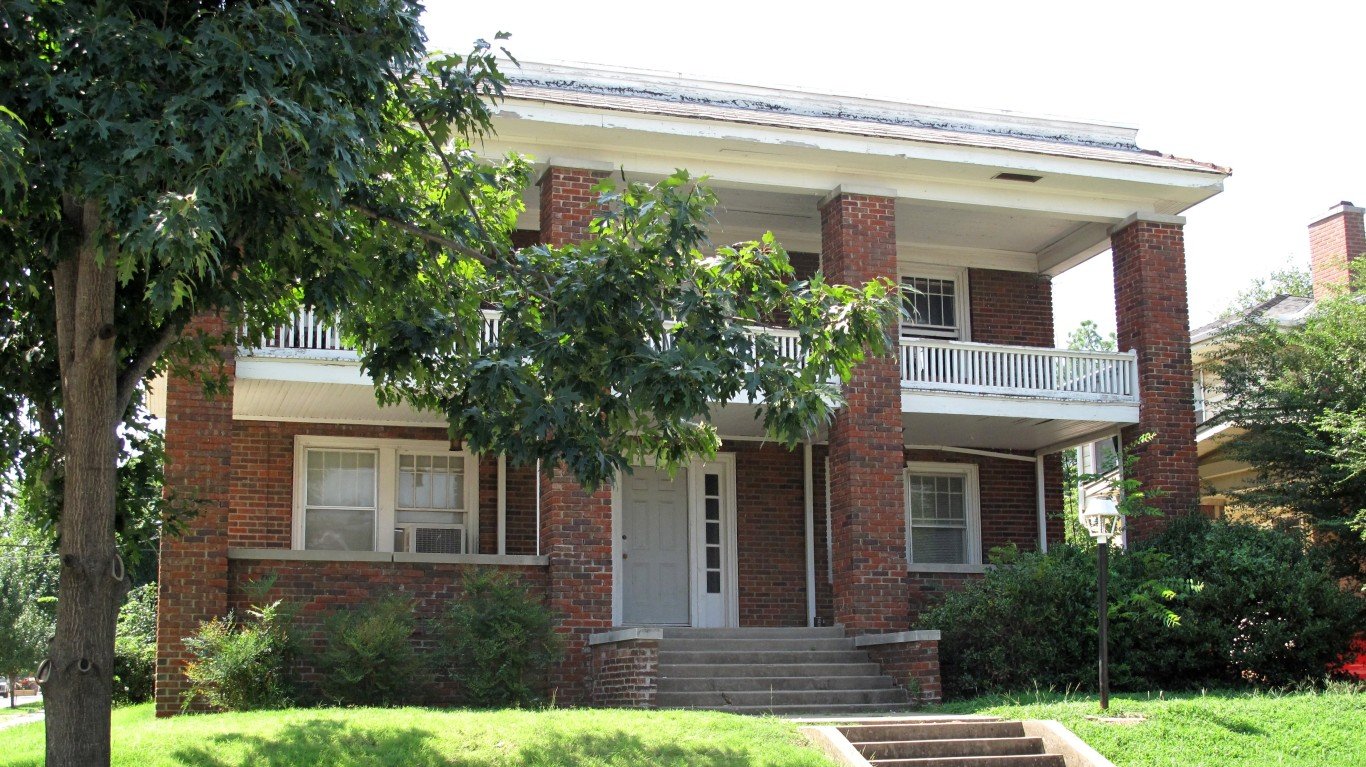
Source: rutlo / Flickr
- Avg. equity gain, Q3 2022 to Q3 2023: +$3,555
- Pct. of homeowners who owe more than their home is worth: 4.1% (3rd highest of 46 states and DC)
- Median listing price, Jan 2024: $295,000 (10th lowest of 46 states and DC)
- Median household income, 2022: $59,673 (4th lowest of 46 states and DC)
- Population, 2022: 4,019,800
41. Idaho

Source: Strekoza2 / iStock Editorial via Getty Images
- Avg. equity gain, Q3 2022 to Q3 2023: +$3,800
- Pct. of homeowners who owe more than their home is worth: 2.1% (21st highest of 46 states and DC)
- Median listing price, Jan 2024: $555,000 (10th highest of 46 states and DC)
- Median household income, 2022: $72,785 (22nd highest of 46 states and DC)
- Population, 2022: 1,939,033
40. Alaska

Source: filo / E+ via Getty Images
- Avg. equity gain, Q3 2022 to Q3 2023: +$5,749
- Pct. of homeowners who owe more than their home is worth: 1.5% (13th lowest of 46 states and DC)
- Median listing price, Jan 2024: $392,000 (23rd lowest of 46 states and DC)
- Median household income, 2022: $88,121 (12th highest of 46 states and DC)
- Population, 2022: 733,583
39. Montana

Source: peeterv / iStock via Getty Images
- Avg. equity gain, Q3 2022 to Q3 2023: +$5,875
- Pct. of homeowners who owe more than their home is worth: 1.7% (18th lowest of 46 states and DC)
- Median listing price, Jan 2024: $599,900 (7th highest of 46 states and DC)
- Median household income, 2022: $67,631 (14th lowest of 46 states and DC)
- Population, 2022: 1,122,867
38. Alabama
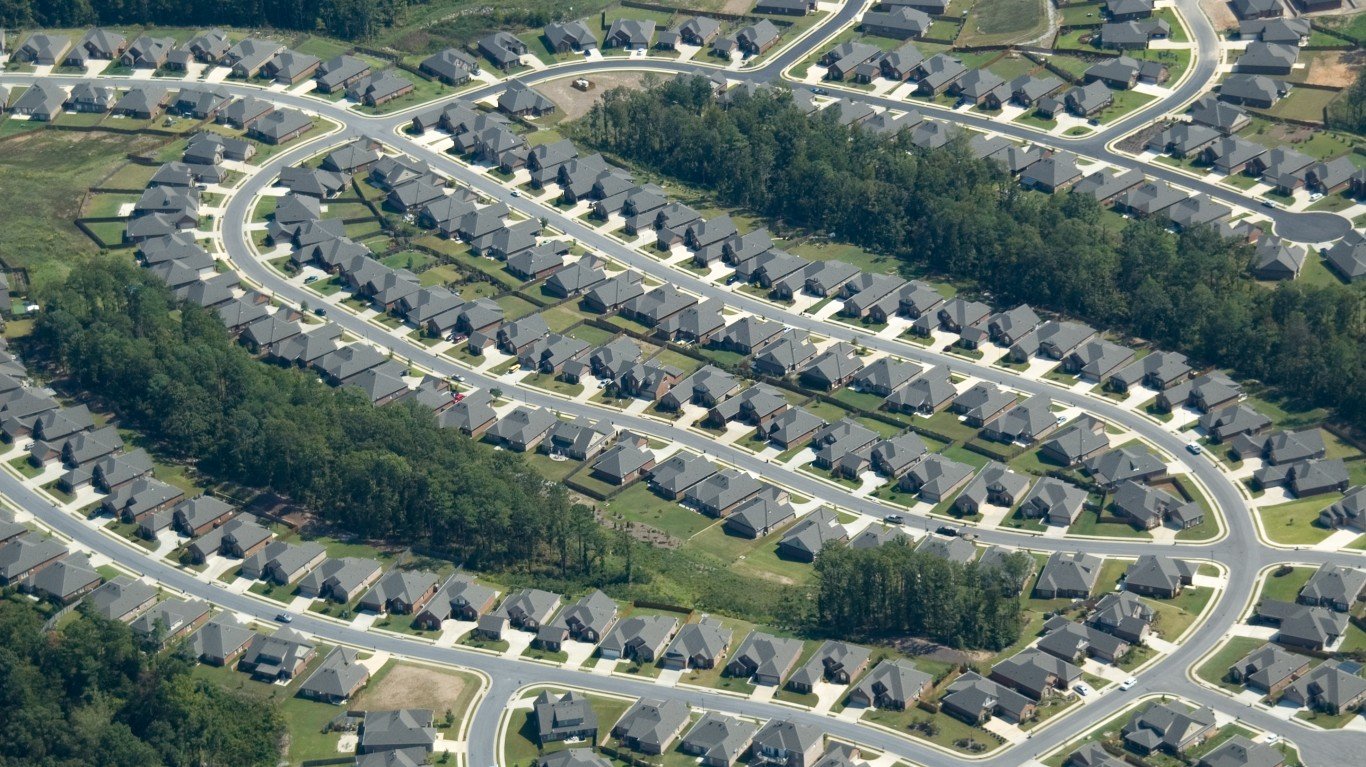
Source: toddmedia / Getty Images
- Avg. equity gain, Q3 2022 to Q3 2023: +$5,946
- Pct. of homeowners who owe more than their home is worth: 2.5% (13th highest of 46 states and DC)
- Median listing price, Jan 2024: $319,800 (13th lowest of 46 states and DC)
- Median household income, 2022: $59,674 (5th lowest of 46 states and DC)
- Population, 2022: 5,074,296
37. Oregon

Source: benedek / iStock via Getty Images
- Avg. equity gain, Q3 2022 to Q3 2023: +$7,075
- Pct. of homeowners who owe more than their home is worth: 1.3% (8th lowest of 46 states and DC)
- Median listing price, Jan 2024: $549,450 (12th highest of 46 states and DC)
- Median household income, 2022: $75,657 (19th highest of 46 states and DC)
- Population, 2022: 4,240,137
36. North Dakota

Source: Jacob Boomsma / iStock via Getty Images
- Avg. equity gain, Q3 2022 to Q3 2023: +$8,088
- Pct. of homeowners who owe more than their home is worth: 3.7% (4th highest of 46 states and DC)
- Median listing price, Jan 2024: $332,025 (14th lowest of 46 states and DC)
- Median household income, 2022: $71,970 (23rd lowest of 46 states and DC)
- Population, 2022: 779,261
35. Nevada

Source: Bill_Dally / iStock via Getty Images
- Avg. equity gain, Q3 2022 to Q3 2023: +$8,277
- Pct. of homeowners who owe more than their home is worth: 0.7% (2nd lowest of 46 states and DC)
- Median listing price, Jan 2024: $479,980 (17th highest of 46 states and DC)
- Median household income, 2022: $72,333 (23rd highest of 46 states and DC)
- Population, 2022: 3,177,772
34. Arkansas

Source: Sean Pavone / iStock via Getty Images
- Avg. equity gain, Q3 2022 to Q3 2023: +$11,739
- Pct. of homeowners who owe more than their home is worth: 3.3% (6th highest of 46 states and DC)
- Median listing price, Jan 2024: $295,000 (10th lowest of 46 states and DC)
- Median household income, 2022: $55,432 (2nd lowest of 46 states and DC)
- Population, 2022: 3,045,637
33. Arizona

Source: stockphoto52 / iStock via Getty Images
- Avg. equity gain, Q3 2022 to Q3 2023: +$12,120
- Pct. of homeowners who owe more than their home is worth: 0.8% (3rd lowest of 46 states and DC)
- Median listing price, Jan 2024: $499,000 (14th highest of 46 states and DC)
- Median household income, 2022: $74,568 (20th highest of 46 states and DC)
- Population, 2022: 7,359,197
32. Minnesota

Source: akaplummer / iStock via Getty Images
- Avg. equity gain, Q3 2022 to Q3 2023: +$12,295
- Pct. of homeowners who owe more than their home is worth: 2.1% (20th highest of 46 states and DC)
- Median listing price, Jan 2024: $377,000 (19th lowest of 46 states and DC)
- Median household income, 2022: $82,338 (14th highest of 46 states and DC)
- Population, 2022: 5,717,184
31. Tennessee

Source: sframephoto / iStock via Getty Images
- Avg. equity gain, Q3 2022 to Q3 2023: +$12,496
- Pct. of homeowners who owe more than their home is worth: 2.5% (12th highest of 46 states and DC)
- Median listing price, Jan 2024: $429,995 (21st highest of 46 states and DC)
- Median household income, 2022: $65,254 (9th lowest of 46 states and DC)
- Population, 2022: 7,051,339
30. New Mexico

Source: Sean Pavone / iStock via Getty Images
- Avg. equity gain, Q3 2022 to Q3 2023: +$12,643
- Pct. of homeowners who owe more than their home is worth: 2.2% (18th highest of 46 states and DC)
- Median listing price, Jan 2024: $387,000 (21st lowest of 46 states and DC)
- Median household income, 2022: $59,726 (6th lowest of 46 states and DC)
- Population, 2022: 2,113,344
29. Wyoming

Source: Paola Giannoni / iStock via Getty Images
- Avg. equity gain, Q3 2022 to Q3 2023: +$12,791
- Pct. of homeowners who owe more than their home is worth: 2.4% (15th highest of 46 states and DC)
- Median listing price, Jan 2024: $434,900 (20th highest of 46 states and DC)
- Median household income, 2022: $70,042 (20th lowest of 46 states and DC)
- Population, 2022: 581,381
28. Iowa
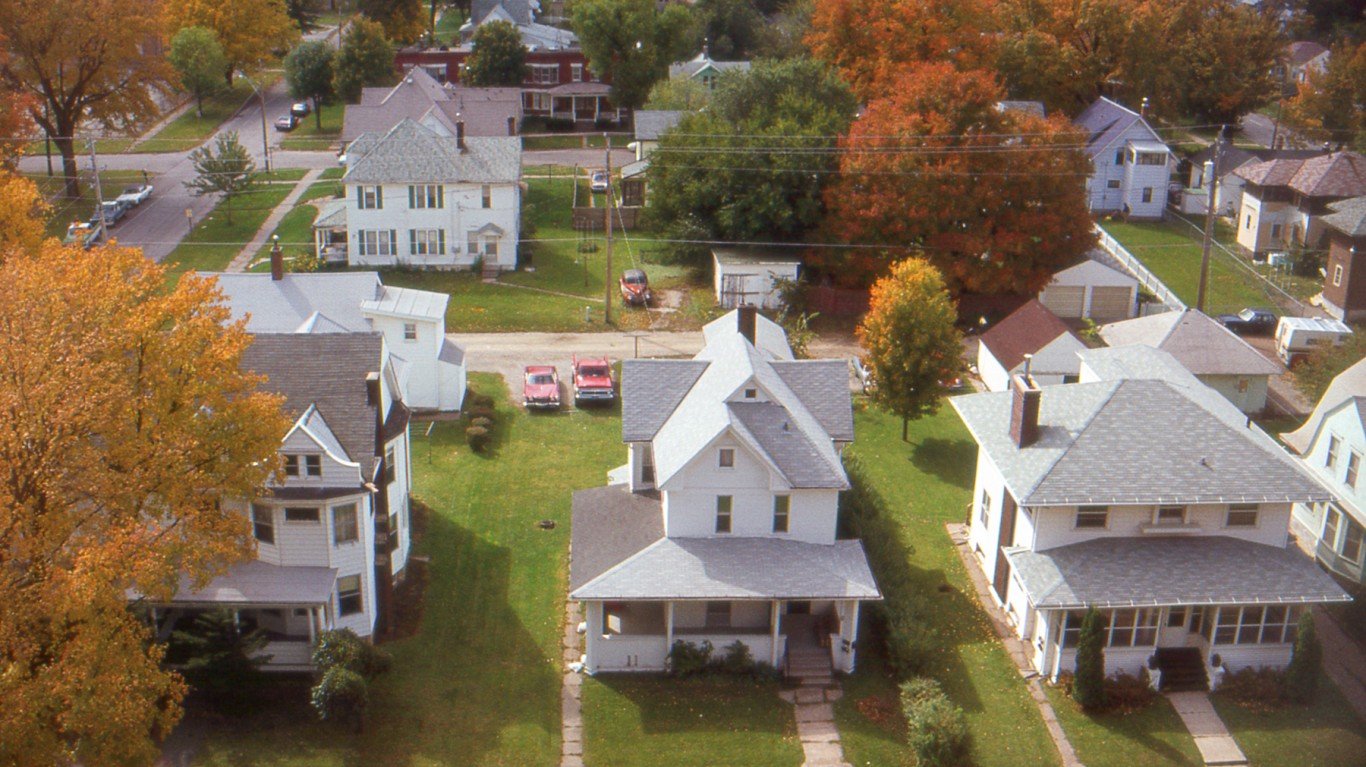
Source: NNehring / E+ via Getty Images
- Avg. equity gain, Q3 2022 to Q3 2023: +$12,975
- Pct. of homeowners who owe more than their home is worth: 4.9% (2nd highest of 46 states and DC)
- Median listing price, Jan 2024: $286,250 (6th lowest of 46 states and DC)
- Median household income, 2022: $69,588 (18th lowest of 46 states and DC)
- Population, 2022: 3,200,517
27. Nebraska
Source: Thinkstock / Stockbyte via Getty Images
- Avg. equity gain, Q3 2022 to Q3 2023: +$13,187
- Pct. of homeowners who owe more than their home is worth: 3.1% (8th highest of 46 states and DC)
- Median listing price, Jan 2024: $347,000 (15th lowest of 46 states and DC)
- Median household income, 2022: $69,597 (19th lowest of 46 states and DC)
- Population, 2022: 1,967,923
26. Kentucky

Source: Davel5957 / iStock via Getty Images
- Avg. equity gain, Q3 2022 to Q3 2023: +$13,464
- Pct. of homeowners who owe more than their home is worth: 3.4% (5th highest of 46 states and DC)
- Median listing price, Jan 2024: $296,250 (11th lowest of 46 states and DC)
- Median household income, 2022: $59,341 (3rd lowest of 46 states and DC)
- Population, 2022: 4,512,310
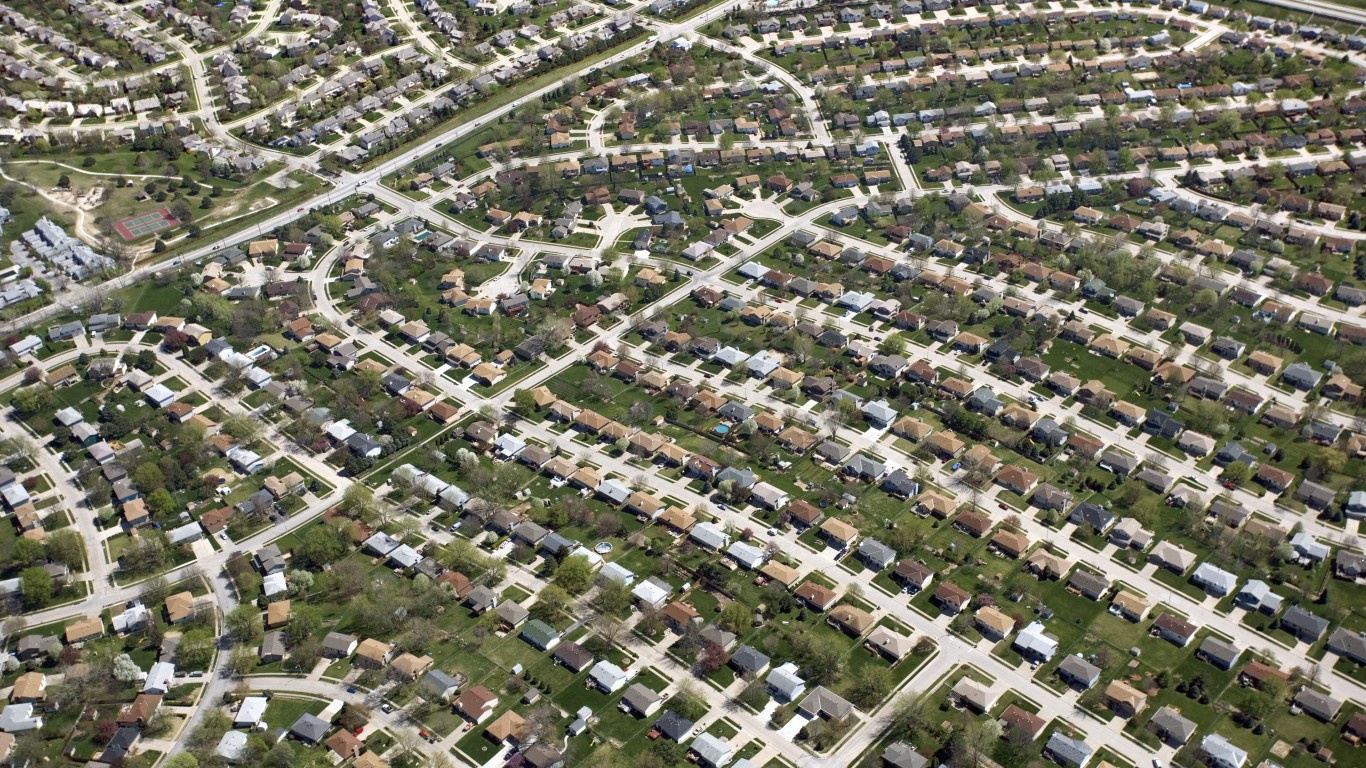
25. Illinois
Source: davidwilson1949 / Flickr
- Avg. equity gain, Q3 2022 to Q3 2023: +$14,247
- Pct. of homeowners who owe more than their home is worth: 3.0% (9th highest of 46 states and DC)
- Median listing price, Jan 2024: $290,000 (8th lowest of 46 states and DC)
- Median household income, 2022: $76,708 (18th highest of 46 states and DC)
- Population, 2022: 12,582,032
24. Indiana

Source: alexeys / iStock via Getty Images
- Avg. equity gain, Q3 2022 to Q3 2023: +$14,526
- Pct. of homeowners who owe more than their home is worth: 1.4% (9th lowest of 46 states and DC)
- Median listing price, Jan 2024: $276,850 (4th lowest of 46 states and DC)
- Median household income, 2022: $66,785 (11th lowest of 46 states and DC)
- Population, 2022: 6,833,037
23. Kansas

Source: walencienne / iStock via Getty Images
- Avg. equity gain, Q3 2022 to Q3 2023: +$17,853
- Pct. of homeowners who owe more than their home is worth: 1.4% (11th lowest of 46 states and DC)
- Median listing price, Jan 2024: $296,900 (12th lowest of 46 states and DC)
- Median household income, 2022: $68,925 (15th lowest of 46 states and DC)
- Population, 2022: 2,937,150
22. Washington
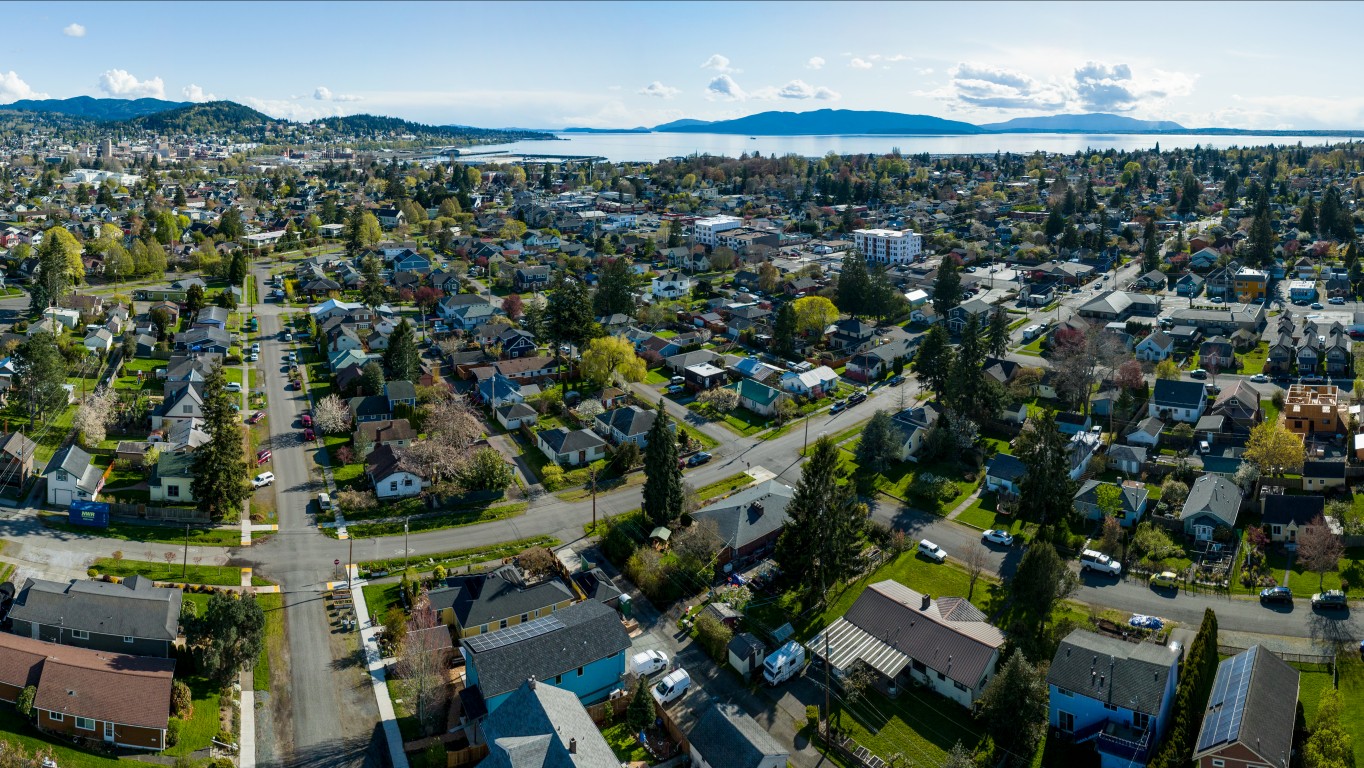
Source: SEASTOCK / iStock via Getty Images
- Avg. equity gain, Q3 2022 to Q3 2023: +$18,705
- Pct. of homeowners who owe more than their home is worth: 1.9% (23rd lowest of 46 states and DC)
- Median listing price, Jan 2024: $610,950 (6th highest of 46 states and DC)
- Median household income, 2022: $91,306 (7th highest of 46 states and DC)
- Population, 2022: 7,785,786
21. Missouri

Source: eyecrave / E+ via Getty Images
- Avg. equity gain, Q3 2022 to Q3 2023: +$19,065
- Pct. of homeowners who owe more than their home is worth: 2.5% (13th highest of 46 states and DC)
- Median listing price, Jan 2024: $289,050 (7th lowest of 46 states and DC)
- Median household income, 2022: $64,811 (8th lowest of 46 states and DC)
- Population, 2022: 6,177,957
20. Georgia

Source: Sean Pavone / iStock via Getty Images
- Avg. equity gain, Q3 2022 to Q3 2023: +$19,130
- Pct. of homeowners who owe more than their home is worth: 1.7% (20th lowest of 46 states and DC)
- Median listing price, Jan 2024: $384,730 (20th lowest of 46 states and DC)
- Median household income, 2022: $72,837 (21st highest of 46 states and DC)
- Population, 2022: 10,912,876
19. Ohio
Source: photovs / iStock via Getty Images
- Avg. equity gain, Q3 2022 to Q3 2023: +$19,167
- Pct. of homeowners who owe more than their home is worth: 2.1% (23rd highest of 46 states and DC)
- Median listing price, Jan 2024: $245,000 (the lowest of 46 states and DC)
- Median household income, 2022: $65,720 (10th lowest of 46 states and DC)
- Population, 2022: 11,756,058
18. Michigan
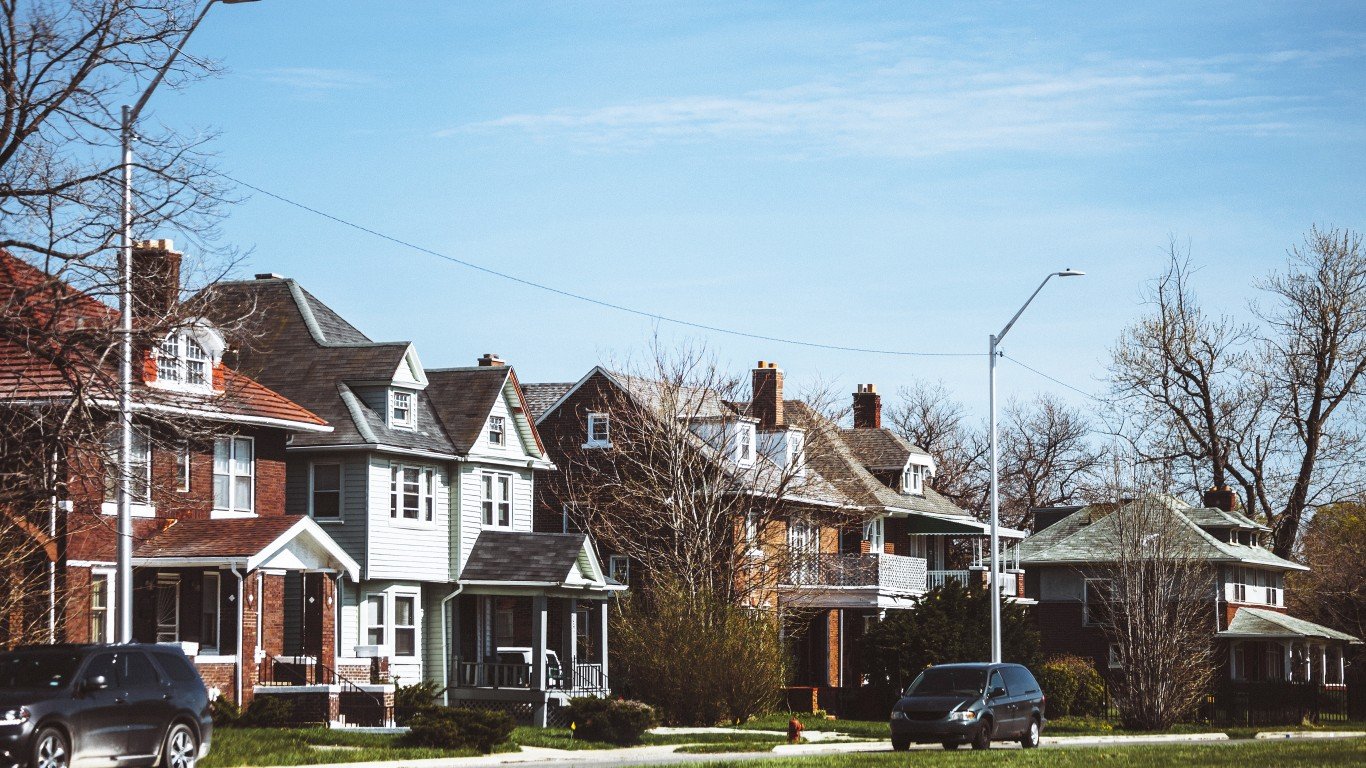
Source: peeterv / iStock via Getty Images
- Avg. equity gain, Q3 2022 to Q3 2023: +$19,401
- Pct. of homeowners who owe more than their home is worth: 2.3% (17th highest of 46 states and DC)
- Median listing price, Jan 2024: $257,000 (2nd lowest of 46 states and DC)
- Median household income, 2022: $66,986 (12th lowest of 46 states and DC)
- Population, 2022: 10,034,118
17. Pennsylvania
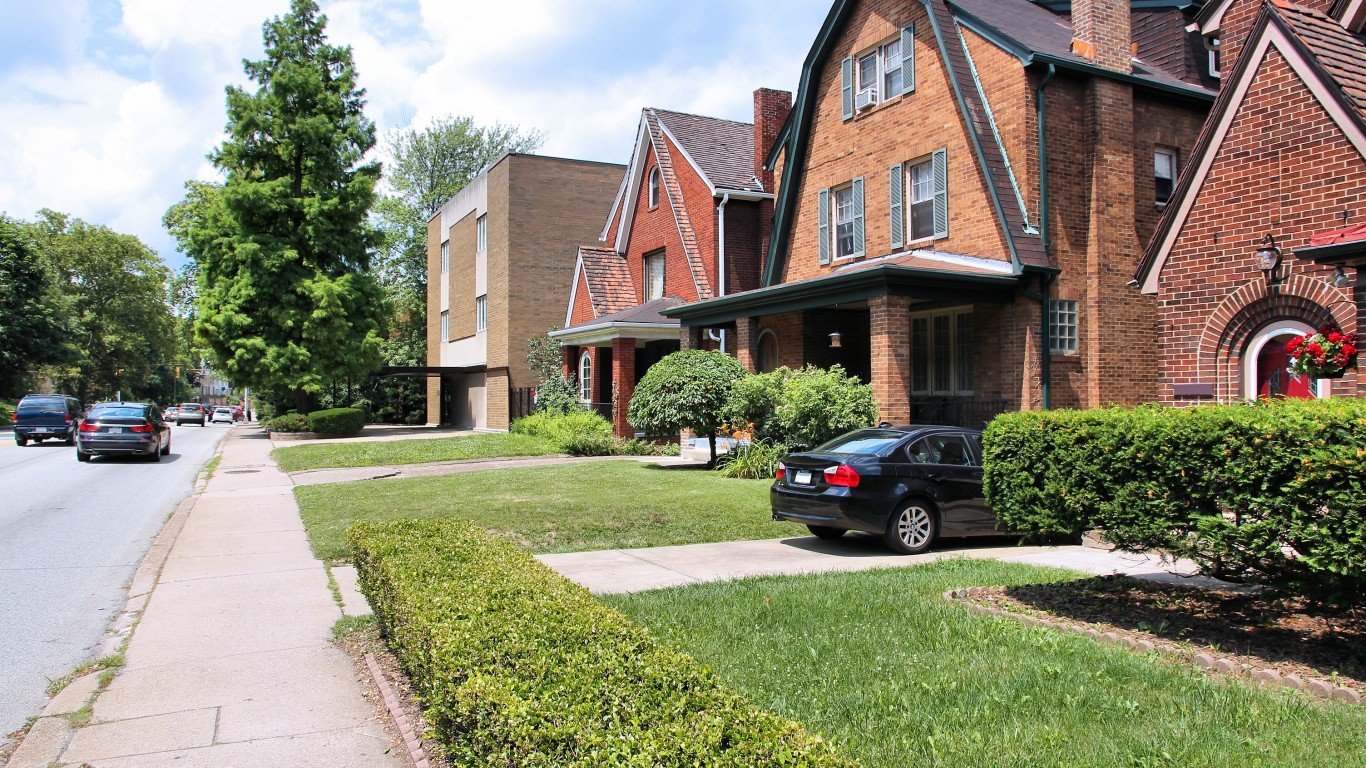
Source: tupungato / iStock via Getty Images
- Avg. equity gain, Q3 2022 to Q3 2023: +$20,318
- Pct. of homeowners who owe more than their home is worth: 2.1% (22nd highest of 46 states and DC)
- Median listing price, Jan 2024: $280,000 (5th lowest of 46 states and DC)
- Median household income, 2022: $71,798 (22nd lowest of 46 states and DC)
- Population, 2022: 12,972,008
16. Virginia

Source: traveler1116 / E+ via Getty Images
- Avg. equity gain, Q3 2022 to Q3 2023: +$25,275
- Pct. of homeowners who owe more than their home is worth: 1.4% (10th lowest of 46 states and DC)
- Median listing price, Jan 2024: $415,000 (22nd highest of 46 states and DC)
- Median household income, 2022: $85,873 (13th highest of 46 states and DC)
- Population, 2022: 8,683,619
15. South Carolina
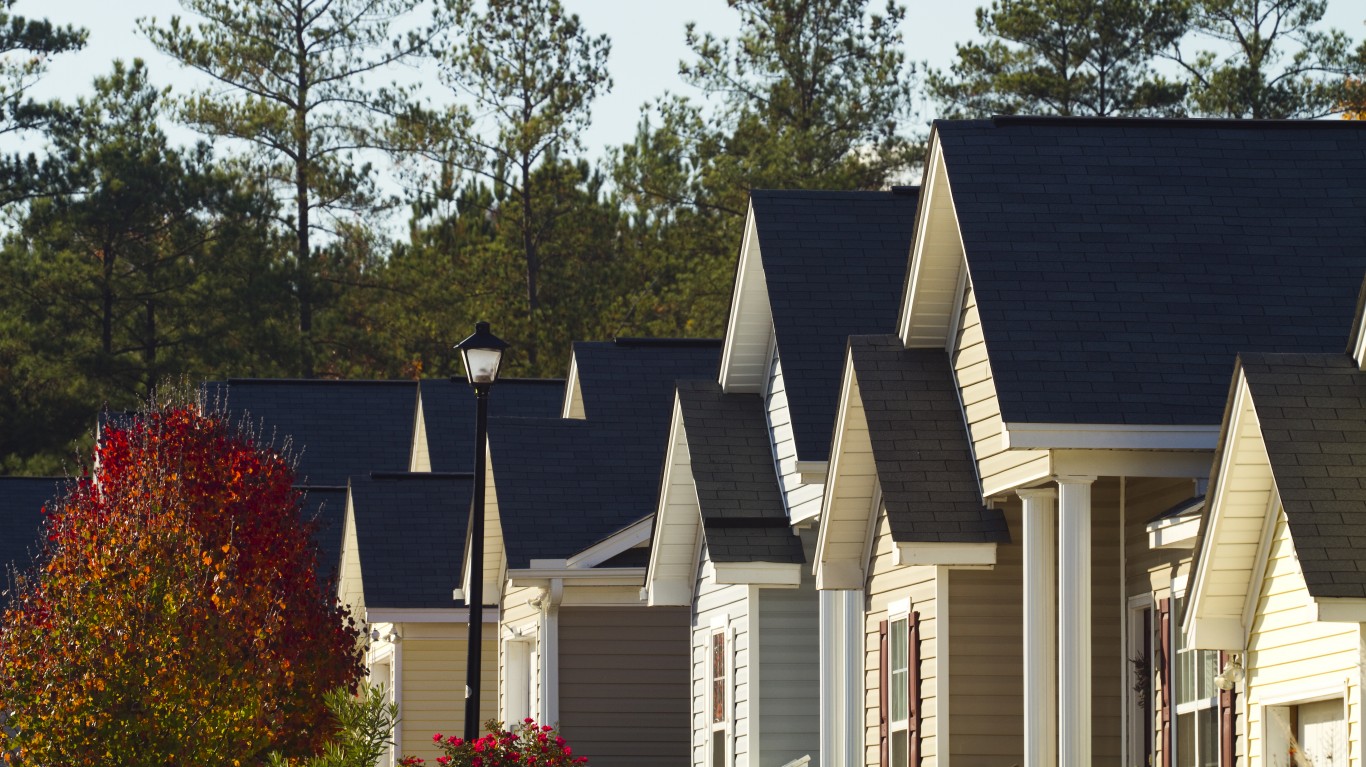
Source: ScottNodine / iStock via Getty Images
- Avg. equity gain, Q3 2022 to Q3 2023: +$25,657
- Pct. of homeowners who owe more than their home is worth: 1.9% (24th highest of 46 states and DC)
- Median listing price, Jan 2024: $349,992 (16th lowest of 46 states and DC)
- Median household income, 2022: $64,115 (7th lowest of 46 states and DC)
- Population, 2022: 5,282,634
14. Maryland

Source: krblokhin / iStock via Getty Images
- Avg. equity gain, Q3 2022 to Q3 2023: +$25,890
- Pct. of homeowners who owe more than their home is worth: 1.7% (19th lowest of 46 states and DC)
- Median listing price, Jan 2024: $390,000 (22nd lowest of 46 states and DC)
- Median household income, 2022: $94,991 (3rd highest of 46 states and DC)
- Population, 2022: 6,164,660
13. Delaware

Source: aimintang / iStock via Getty Images
- Avg. equity gain, Q3 2022 to Q3 2023: +$26,665
- Pct. of homeowners who owe more than their home is worth: 2.2% (19th highest of 46 states and DC)
- Median listing price, Jan 2024: $477,450 (18th highest of 46 states and DC)
- Median household income, 2022: $82,174 (15th highest of 46 states and DC)
- Population, 2022: 1,018,396
12. North Carolina

Source: KenWiedemann / E+ via Getty Images
- Avg. equity gain, Q3 2022 to Q3 2023: +$27,090
- Pct. of homeowners who owe more than their home is worth: 1.6% (17th lowest of 46 states and DC)
- Median listing price, Jan 2024: $394,950 (24th highest of 46 states and DC)
- Median household income, 2022: $67,481 (13th lowest of 46 states and DC)
- Population, 2022: 10,698,973
11. Colorado

Source: Juli Scalzi / iStock via Getty Images
- Avg. equity gain, Q3 2022 to Q3 2023: +$27,195
- Pct. of homeowners who owe more than their home is worth: 1.5% (12th lowest of 46 states and DC)
- Median listing price, Jan 2024: $585,000 (9th highest of 46 states and DC)
- Median household income, 2022: $89,302 (9th highest of 46 states and DC)
- Population, 2022: 5,839,926
10. Florida

Source: Gusgraph / iStock via Getty Images
- Avg. equity gain, Q3 2022 to Q3 2023: +$27,914
- Pct. of homeowners who owe more than their home is worth: 1.0% (4th lowest of 46 states and DC)
- Median listing price, Jan 2024: $459,945 (19th highest of 46 states and DC)
- Median household income, 2022: $69,303 (16th lowest of 46 states and DC)
- Population, 2022: 22,244,823
9. Wisconsin

Source: James Brey / iStock via Getty Images
- Avg. equity gain, Q3 2022 to Q3 2023: +$30,057
- Pct. of homeowners who owe more than their home is worth: 2.6% (11th highest of 46 states and DC)
- Median listing price, Jan 2024: $359,900 (17th lowest of 46 states and DC)
- Median household income, 2022: $70,996 (21st lowest of 46 states and DC)
- Population, 2022: 5,892,539
8. Maine
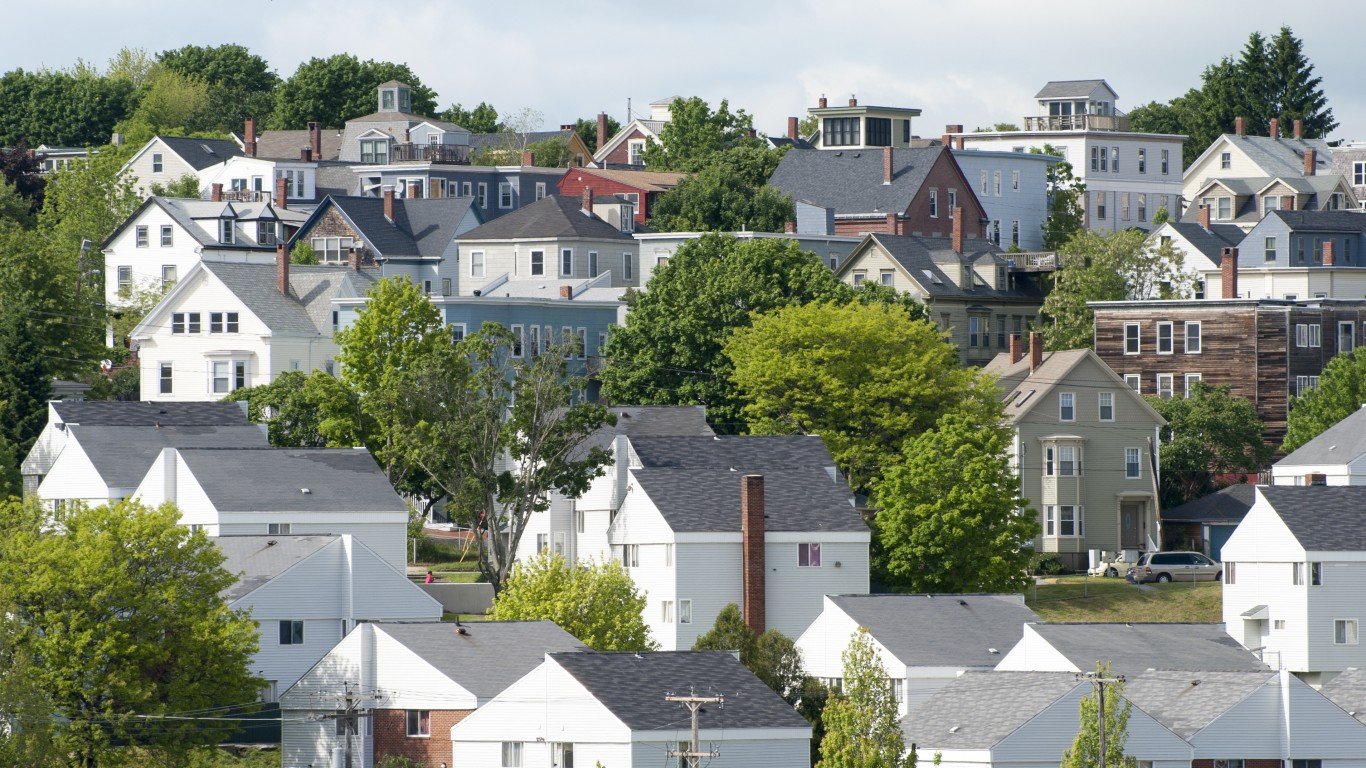
Source: virsuziglis / iStock via Getty Images
- Avg. equity gain, Q3 2022 to Q3 2023: +$33,740
- Pct. of homeowners who owe more than their home is worth: 2.3% (16th highest of 46 states and DC)
- Median listing price, Jan 2024: $402,475 (23rd highest of 46 states and DC)
- Median household income, 2022: $69,543 (17th lowest of 46 states and DC)
- Population, 2022: 1,385,340
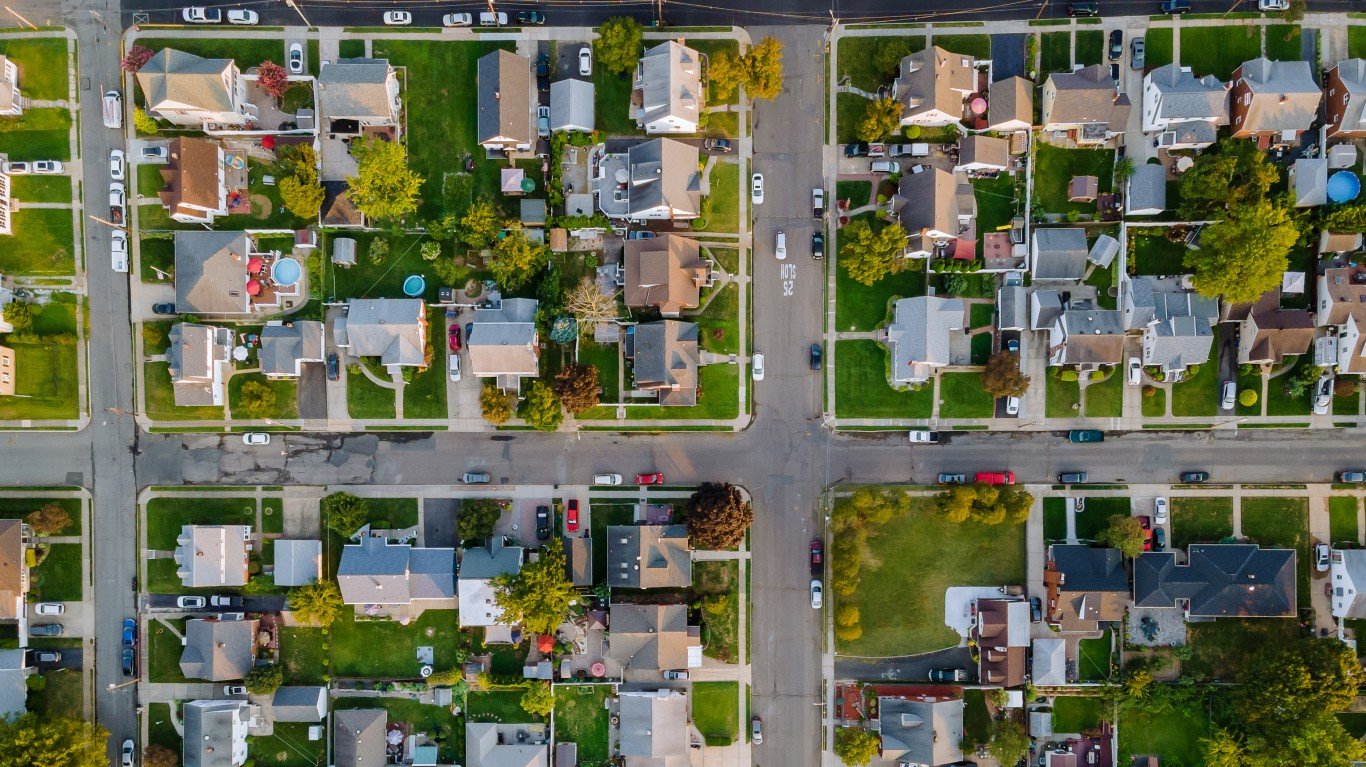
7. New Jersey
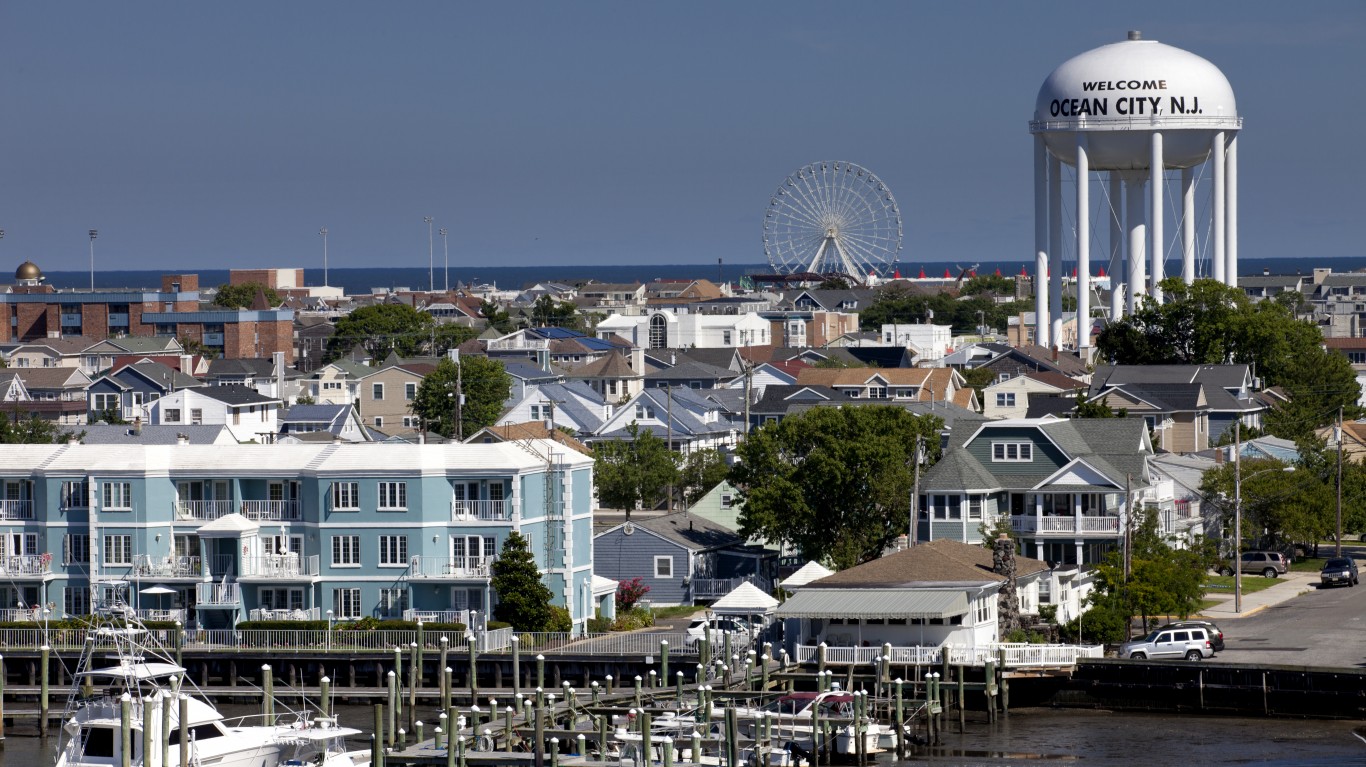
Source: Aneese / iStock via Getty Images
- Avg. equity gain, Q3 2022 to Q3 2023: +$40,514
- Pct. of homeowners who owe more than their home is worth: 1.6% (16th lowest of 46 states and DC)
- Median listing price, Jan 2024: $524,950 (13th highest of 46 states and DC)
- Median household income, 2022: $96,346 (2nd highest of 46 states and DC)
- Population, 2022: 9,261,699
6. New Hampshire

Source: Wirestock / iStock via Getty Images
- Avg. equity gain, Q3 2022 to Q3 2023: +$40,729
- Pct. of homeowners who owe more than their home is worth: 1.6% (14th lowest of 46 states and DC)
- Median listing price, Jan 2024: $554,950 (11th highest of 46 states and DC)
- Median household income, 2022: $89,992 (8th highest of 46 states and DC)
- Population, 2022: 1,395,231
5. Connecticut

Source: JayLazarin / E+ via Getty Images
- Avg. equity gain, Q3 2022 to Q3 2023: +$41,474
- Pct. of homeowners who owe more than their home is worth: 1.8% (21st lowest of 46 states and DC)
- Median listing price, Jan 2024: $491,419 (15th highest of 46 states and DC)
- Median household income, 2022: $88,429 (11th highest of 46 states and DC)
- Population, 2022: 3,626,205
4. Rhode Island
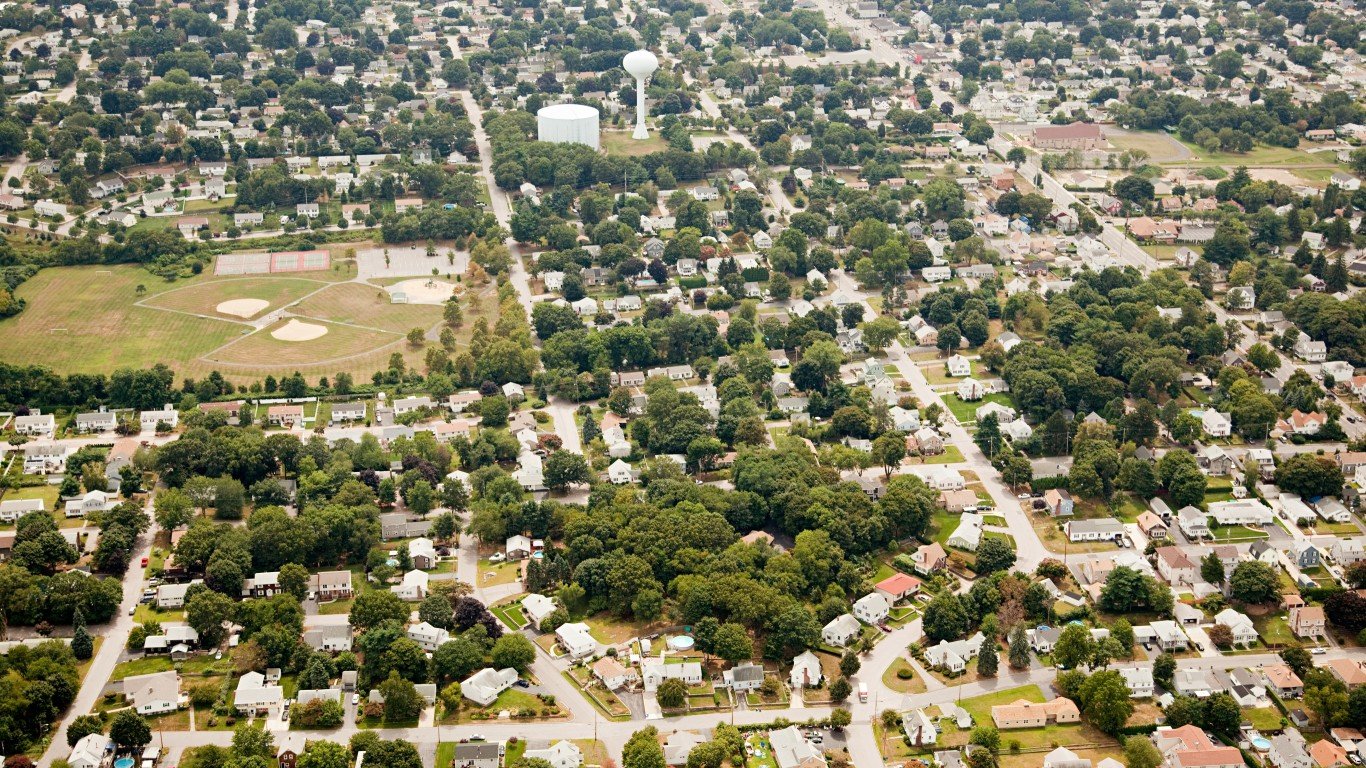
Source: Image Source / Image Source via Getty Images
- Avg. equity gain, Q3 2022 to Q3 2023: +$42,546
- Pct. of homeowners who owe more than their home is worth: 1.2% (7th lowest of 46 states and DC)
- Median listing price, Jan 2024: $489,000 (16th highest of 46 states and DC)
- Median household income, 2022: $81,854 (16th highest of 46 states and DC)
- Population, 2022: 1,093,734
3. Massachusetts

Source: KenWiedemann / iStock via Getty Images
- Avg. equity gain, Q3 2022 to Q3 2023: +$44,616
- Pct. of homeowners who owe more than their home is worth: 1.1% (5th lowest of 46 states and DC)
- Median listing price, Jan 2024: $749,450 (2nd highest of 46 states and DC)
- Median household income, 2022: $94,488 (4th highest of 46 states and DC)
- Population, 2022: 6,981,974
2. California
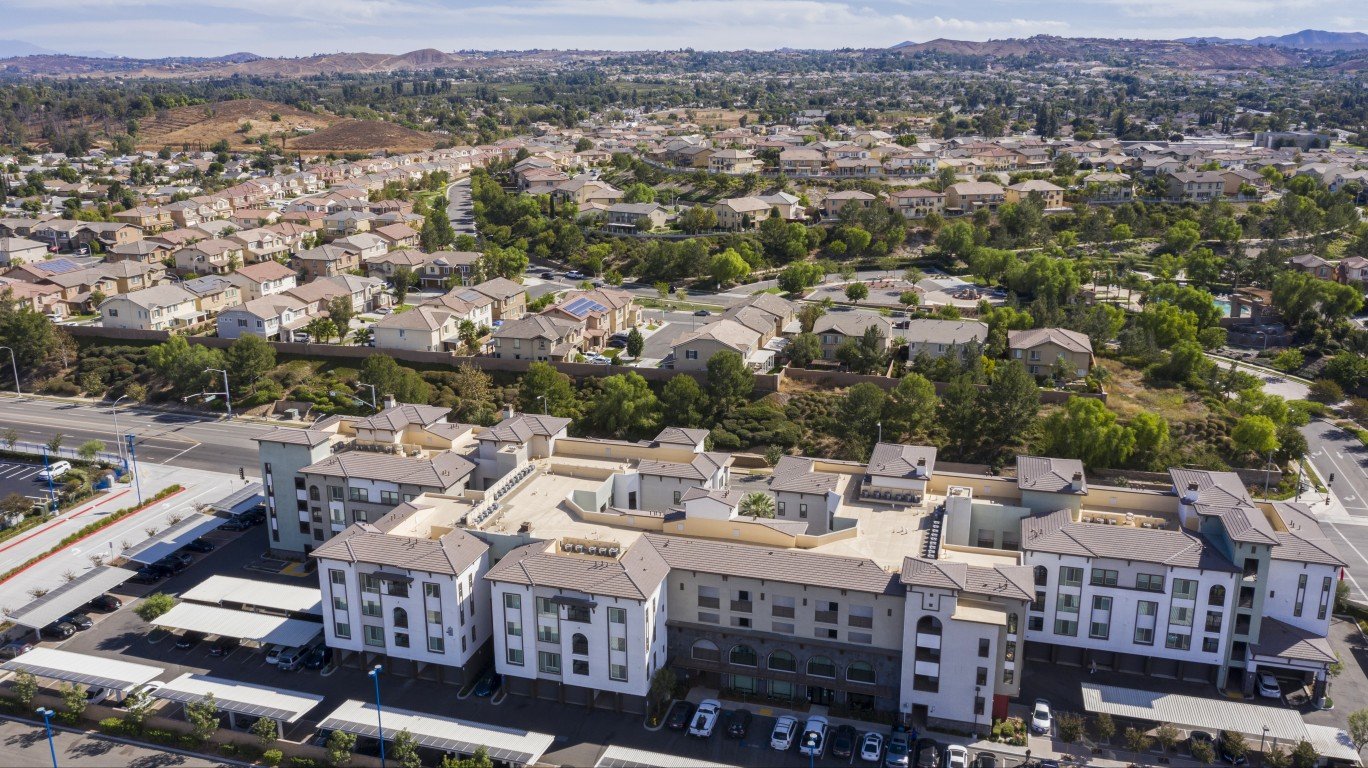
Source: MattGush / iStock via Getty Images
- Avg. equity gain, Q3 2022 to Q3 2023: +$51,281
- Pct. of homeowners who owe more than their home is worth: 0.6% (the lowest of 46 states and DC)
- Median listing price, Jan 2024: $713,389 (3rd highest of 46 states and DC)
- Median household income, 2022: $91,551 (6th highest of 46 states and DC)
- Population, 2022: 39,029,342
1. Hawaii

Source: ejs9 / E+ via Getty Images
- Avg. equity gain, Q3 2022 to Q3 2023: +$63,559
- Pct. of homeowners who owe more than their home is worth: 1.2% (6th lowest of 46 states and DC)
- Median listing price, Jan 2024: $851,250 (the highest of 46 states and DC)
- Median household income, 2022: $92,458 (5th highest of 46 states and DC)
- Population, 2022: 1,440,196
Take This Retirement Quiz To Get Matched With An Advisor Now (Sponsored)
Are you ready for retirement? Planning for retirement can be overwhelming, that’s why it could be a good idea to speak to a fiduciary financial advisor about your goals today.
Start by taking this retirement quiz right here from SmartAsset that will match you with up to 3 financial advisors that serve your area and beyond in 5 minutes. Smart Asset is now matching over 50,000 people a month.
Click here now to get started.
Thank you for reading! Have some feedback for us?
Contact the 24/7 Wall St. editorial team.
Editors' Picks