
With a $27.4 trillion economy, the United States is by far the wealthiest country in the world. Even adjusting for population, U.S. GDP per capita is over $76,300, higher than in all but nine other countries, according to the World Bank. (Here is a look at the countries with the most millionaires.)
Still, by several other key measures, the U.S. lags behind many other countries with similar democratic, free market values. For example, life expectancy at birth has fallen for two consecutive years in the U.S., according to the Organization for Economic Cooperation and Development. At just 76 years as of 2021, life expectancy in the U.S. is the seventh lowest among the 38 OECD member states.
The Human Development Index is another, more holistic measure, that shows the U.S. lags behind many of its peers globally. The HDI, created by the United Nations Development Programme, is made up of three components: educational attainment, financial stability, and life expectancy, and is designed to capture a country’s development potential and overall quality of life.
According to the latest HDI report, the U.S. ranks behind 19 other countries, including Australia, Belgium, Canada, Ireland, the United Arab Emirates, and the United Kingdom. However, when applied to geographies within the U.S., the HDI reveals that in many parts of the country, quality of life is on par with some of the highest ranking nations in the U.N.’s report.
Using an index inspired by the HDI, 24/7 Wall St. identified the 40 best U.S. counties to live in. Counties and county equivalents, including independent cities, are ranked on a combination of three measures – average life expectancy at birth, the share of adults with a bachelor’s degree or higher, and the poverty rate. Data used to calculate rankings are from the U.S. Census Bureau’s 2022 American Community Survey and County Health Rankings & Roadmaps, a joint program of the Robert Wood Johnson Foundation and the University of Wisconsin Population Health Institute. All ACS data are five-year averages. Counties with incomplete data were excluded from analysis. To avoid geographic clustering, we only included one county per metropolitan statistical area.
The 40 counties and county equivalents on this list are spread across the country, including five in the Northeast, six in the Midwest, 11 in the South, and 18 in the West. Colorado alone is home to nine of these counties, followed by Virginia and California, which each have three counties or county equivalents on this list.
In each of these 40 counties, average life expectancy at birth exceeds the national average by at least two years, according to data from County Health Rankings & Roadmaps. Most of these places also have poverty rates that are at least 4 percentage points below the 12.5% U.S. poverty rate, and in all but six of these counties, over half of all adults have a bachelor’s degree or higher, compared to only about one-third of all adults nationwide.
Most of these places also have relatively high-earning populations. Even though income was not considered in the ranking, in every county but one on this list, the typical household earns more than the national median household income of $75,149 — in most cases, by tens of thousands of dollars. (Here is a look at the richest town in every state.)
These are the 40 best U.S. counties to live in.
40. Kendall County, Texas
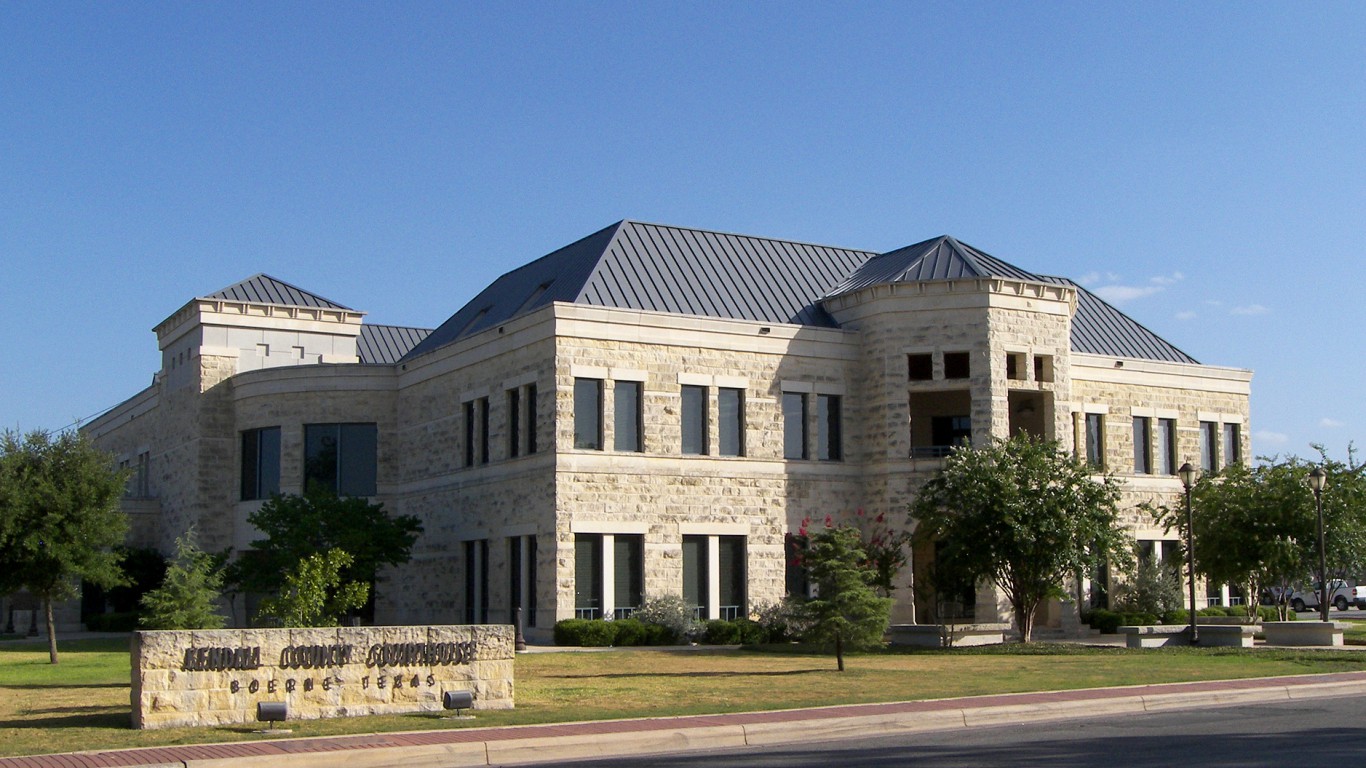
Source: Larry D. Moore / Wikimedia Commons
- Avg. life expectancy at birth: 81.5 years (2.9 years above U.S. avg.)
- Poverty rate: 5.1% (7.4 ppt. below U.S. avg.)
- Adults with a bachelor’s degree: 48.5% (14.2 ppt. above U.S. avg.)
- Median household income: $104,196 ($29,047 more than U.S. median)
- Population: 45,376
- County seat: Boerne
39. Newport County, Rhode Island

Source: DenisTangneyJr / E+ via Getty Images
- Avg. life expectancy at birth: 82.0 years (3.5 years above U.S. avg.)
- Poverty rate: 7.8% (4.8 ppt. below U.S. avg.)
- Adults with a bachelor’s degree: 52.1% (17.8 ppt. above U.S. avg.)
- Median household income: $96,319 ($21,170 more than U.S. median)
- Population: 85,442
- County seat: Newport
38. Routt County, Colorado
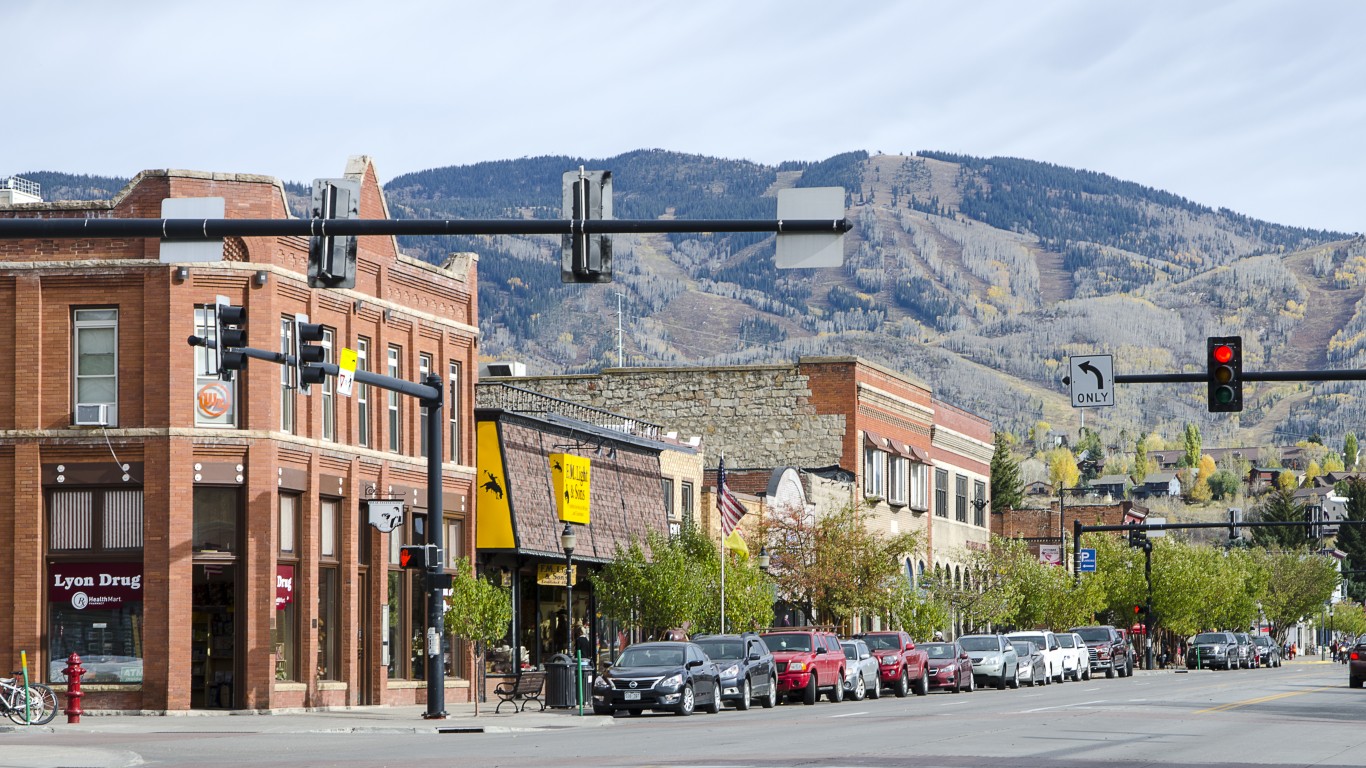
Source: bauhaus1000 / Getty Images
- Avg. life expectancy at birth: 84.1 years (5.6 years above U.S. avg.)
- Poverty rate: 8.0% (4.6 ppt. below U.S. avg.)
- Adults with a bachelor’s degree: 50.0% (15.7 ppt. above U.S. avg.)
- Median household income: $95,144 ($19,995 more than U.S. median)
- Population: 24,944
- County seat: Steamboat Springs
37. York County, Virginia

Source: zrfphoto / iStock via Getty Images
- Avg. life expectancy at birth: 81.5 years (3.0 years above U.S. avg.)
- Poverty rate: 4.7% (7.8 ppt. below U.S. avg.)
- Adults with a bachelor’s degree: 49.5% (15.2 ppt. above U.S. avg.)
- Median household income: $105,154 ($30,005 more than U.S. median)
- Population: 70,238
- County seat: Yorktown
36. DuPage County, Illinois

Source: DenisTangneyJr / iStock via Getty Images
- Avg. life expectancy at birth: 81.9 years (3.4 years above U.S. avg.)
- Poverty rate: 6.3% (6.3 ppt. below U.S. avg.)
- Adults with a bachelor’s degree: 51.1% (16.8 ppt. above U.S. avg.)
- Median household income: $107,035 ($31,886 more than U.S. median)
- Population: 930,559
- County seat: Wheaton
35. Dallas County, Iowa
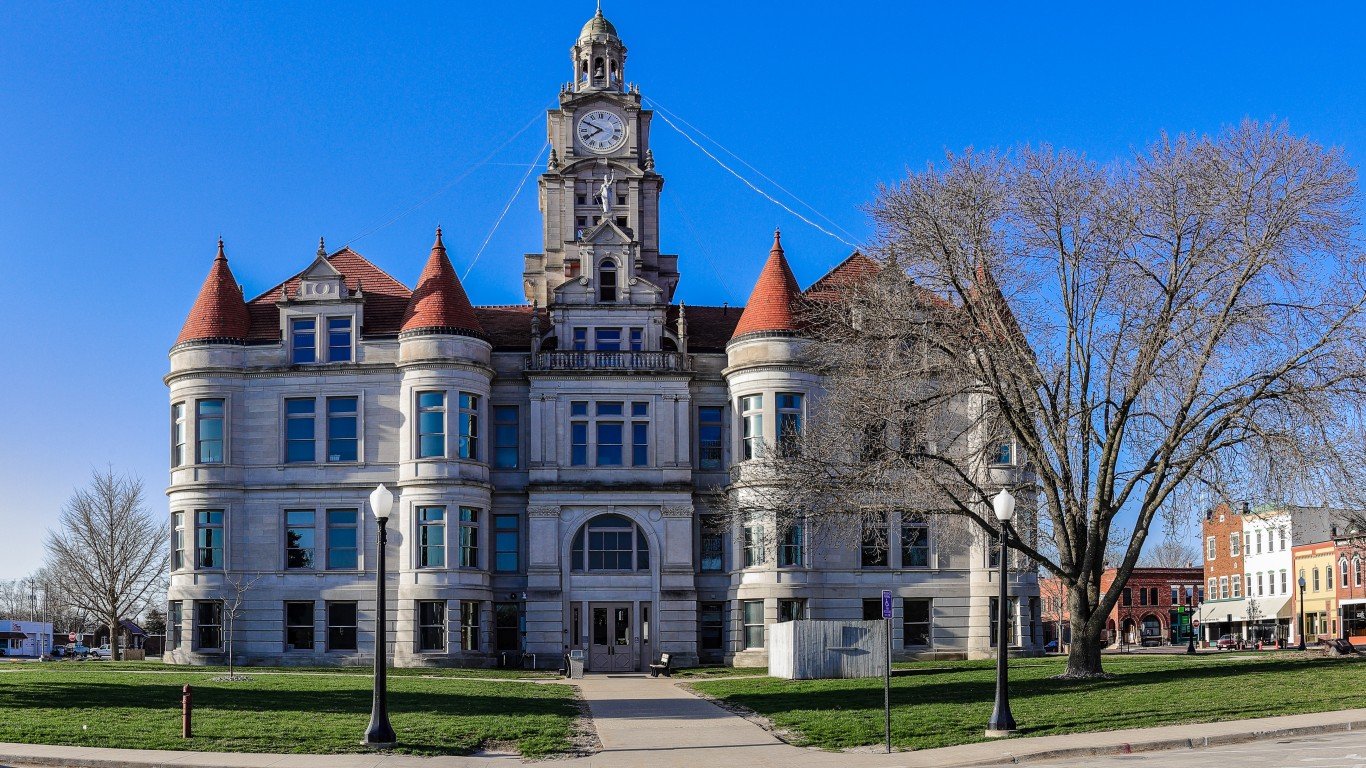
Source: iip-photo-archive / Flickr
- Avg. life expectancy at birth: 81.8 years (3.2 years above U.S. avg.)
- Poverty rate: 5.7% (6.9 ppt. below U.S. avg.)
- Adults with a bachelor’s degree: 51.5% (17.2 ppt. above U.S. avg.)
- Median household income: $99,533 ($24,384 more than U.S. median)
- Population: 100,367
- County seat: Adel
34. Aleutians East Borough, Alaska

Source: Vipersniper / iStock via Getty Images
- Avg. life expectancy at birth: 112.5 years (34.0 years above U.S. avg.)
- Poverty rate: 12.6% (0.1 ppt. above U.S. avg.)
- Adults with a bachelor’s degree: 16.9% (17.4 ppt. below U.S. avg.)
- Median household income: $79,961 ($4,812 more than U.S. median)
- Population: 3,407
- Borough seat: Sand Point
33. King County, Washington

Source: aiisha5 / iStock via Getty Images
- Avg. life expectancy at birth: 82.3 years (3.8 years above U.S. avg.)
- Poverty rate: 8.4% (4.1 ppt. below U.S. avg.)
- Adults with a bachelor’s degree: 54.8% (20.5 ppt. above U.S. avg.)
- Median household income: $116,340 ($41,191 more than U.S. median)
- Population: 2,254,371
- County seat: Seattle
32. San Juan County, Washington

Source: Colleen Michaels / iStock via Getty Images
- Avg. life expectancy at birth: 86.3 years (7.7 years above U.S. avg.)
- Poverty rate: 11.0% (1.5 ppt. below U.S. avg.)
- Adults with a bachelor’s degree: 52.6% (18.3 ppt. above U.S. avg.)
- Median household income: $76,745 ($1,596 more than U.S. median)
- Population: 18,001
- County seat: Friday Harbor
31. Wake County, North Carolina

Source: Kruck20 / iStock via Getty Images
- Avg. life expectancy at birth: 81.6 years (3.1 years above U.S. avg.)
- Poverty rate: 8.2% (4.3 ppt. below U.S. avg.)
- Adults with a bachelor’s degree: 55.7% (21.3 ppt. above U.S. avg.)
- Median household income: $96,734 ($21,585 more than U.S. median)
- Population: 1,132,103
- County seat: Raleigh
30. Orange County, North Carolina

Source: Mx. Granger / Getty Images
- Avg. life expectancy at birth: 82.1 years (3.6 years above U.S. avg.)
- Poverty rate: 12.3% (0.3 ppt. below U.S. avg.)
- Adults with a bachelor’s degree: 61.7% (27.4 ppt. above U.S. avg.)
- Median household income: $85,785 ($10,636 more than U.S. median)
- Population: 145,919
- County seat: Hillsborough
29. Oconee County, Georgia

Source: BOB WESTON / iStock via Getty Images
- Avg. life expectancy at birth: 80.6 years (2.0 years above U.S. avg.)
- Poverty rate: 4.5% (8.1 ppt. below U.S. avg.)
- Adults with a bachelor’s degree: 53.5% (19.1 ppt. above U.S. avg.)
- Median household income: $116,221 ($41,072 more than U.S. median)
- Population: 41,978
- County seat: Watkinsville
28. Collin County, Texas

Source: Gary Fink / iStock via Getty Images
- Avg. life expectancy at birth: 82.2 years (3.7 years above U.S. avg.)
- Poverty rate: 6.3% (6.2 ppt. below U.S. avg.)
- Adults with a bachelor’s degree: 54.3% (20.0 ppt. above U.S. avg.)
- Median household income: $113,255 ($38,106 more than U.S. median)
- Population: 1,079,153
- County seat: McKinney
27. Carver County, Minnesota

Source: Jacob Boomsma / iStock via Getty Images
- Avg. life expectancy at birth: 83.2 years (4.6 years above U.S. avg.)
- Poverty rate: 3.8% (8.8 ppt. below U.S. avg.)
- Adults with a bachelor’s degree: 49.8% (15.5 ppt. above U.S. avg.)
- Median household income: $116,308 ($41,159 more than U.S. median)
- Population: 107,216
- County seat: Chaska
26. Chester County, Pennsylvania

Source: DenisTangneyJr / iStock via Getty Images
- Avg. life expectancy at birth: 81.2 years (2.7 years above U.S. avg.)
- Poverty rate: 6.0% (6.6 ppt. below U.S. avg.)
- Adults with a bachelor’s degree: 56.1% (21.8 ppt. above U.S. avg.)
- Median household income: $118,574 ($43,425 more than U.S. median)
- Population: 536,474
- County seat: West Chester
25. Mono County, California

Source: Nikolay Tsuguliev / iStock via Getty Images
- Avg. life expectancy at birth: 103.3 years (24.8 years above U.S. avg.)
- Poverty rate: 11.3% (1.2 ppt. below U.S. avg.)
- Adults with a bachelor’s degree: 31.7% (2.6 ppt. below U.S. avg.)
- Median household income: $82,038 ($6,889 more than U.S. median)
- Population: 13,219
- County seat: Bridgeport
24. Gunnison County, Colorado

Source: ablokhin / iStock via Getty Images
- Avg. life expectancy at birth: 83.9 years (5.4 years above U.S. avg.)
- Poverty rate: 10.8% (1.7 ppt. below U.S. avg.)
- Adults with a bachelor’s degree: 59.3% (25.0 ppt. above U.S. avg.)
- Median household income: $76,538 ($1,389 more than U.S. median)
- Population: 17,018
- County seat: Gunnison
23. Middlesex County, Massachusetts

Source: DenisTangneyJr / iStock via Getty Images
- Avg. life expectancy at birth: 81.9 years (3.4 years above U.S. avg.)
- Poverty rate: 7.4% (5.1 ppt. below U.S. avg.)
- Adults with a bachelor’s degree: 58.5% (24.2 ppt. above U.S. avg.)
- Median household income: $121,304 ($46,155 more than U.S. median)
- Population: 1,623,109
- County seat: Cambridge
22. Ouray County, Colorado

Source: milda79 / Getty Images
- Avg. life expectancy at birth: 85.7 years (7.2 years above U.S. avg.)
- Poverty rate: 4.8% (7.7 ppt. below U.S. avg.)
- Adults with a bachelor’s degree: 49.6% (15.2 ppt. above U.S. avg.)
- Median household income: $78,750 ($3,601 more than U.S. median)
- Population: 4,936
- County seat: Ouray
21. Johnson County, Kansas

Source: Ayodeji Afolabi / iStock via Getty Images
- Avg. life expectancy at birth: 81.4 years (2.9 years above U.S. avg.)
- Poverty rate: 5.3% (7.3 ppt. below U.S. avg.)
- Adults with a bachelor’s degree: 56.7% (22.4 ppt. above U.S. avg.)
- Median household income: $103,644 ($28,495 more than U.S. median)
- Population: 610,742
- County seat: Olathe
20. Boulder County, Colorado

Source: geewhypics / Flickr
- Avg. life expectancy at birth: 82.6 years (4.1 years above U.S. avg.)
- Poverty rate: 11.3% (1.3 ppt. below U.S. avg.)
- Adults with a bachelor’s degree: 63.2% (28.9 ppt. above U.S. avg.)
- Median household income: $99,770 ($24,621 more than U.S. median)
- Population: 328,658
- County seat: Boulder
19. Santa Clara County, California

Source: yhelfman / iStock via Getty Images
- Avg. life expectancy at birth: 84.7 years (6.1 years above U.S. avg.)
- Poverty rate: 6.9% (5.7 ppt. below U.S. avg.)
- Adults with a bachelor’s degree: 55.3% (21.0 ppt. above U.S. avg.)
- Median household income: $153,792 ($78,643 more than U.S. median)
- Population: 1,916,831
- County seat: San Jose
18. Forsyth County, Georgia
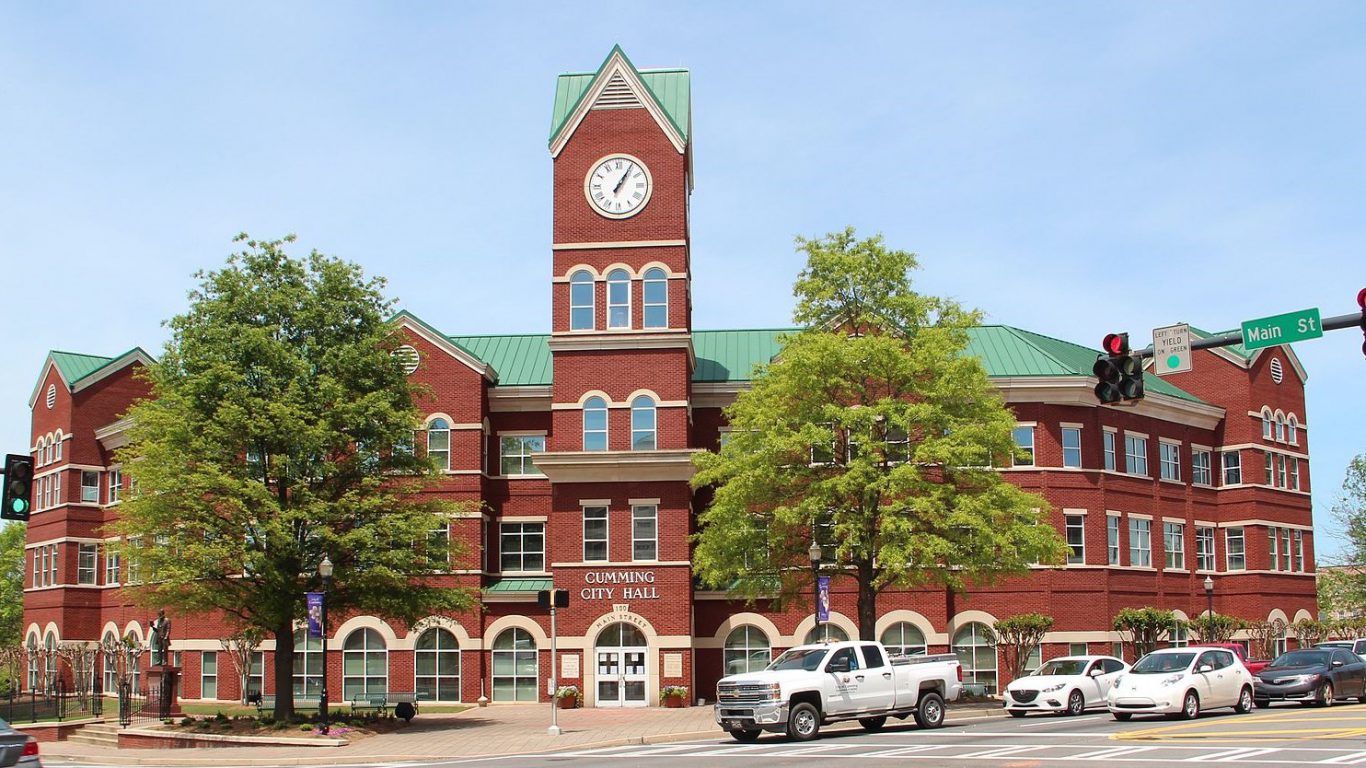
Source: Thomson200 / Wikimedia Commons / Public Domain
- Avg. life expectancy at birth: 82.3 years (3.7 years above U.S. avg.)
- Poverty rate: 4.6% (7.9 ppt. below U.S. avg.)
- Adults with a bachelor’s degree: 56.2% (21.9 ppt. above U.S. avg.)
- Median household income: $131,660 ($56,511 more than U.S. median)
- Population: 253,225
- County seat: Cumming
17. Albemarle County, Virginia

Source: BrianPIrwin / iStock Editorial via Getty Images
- Avg. life expectancy at birth: 82.3 years (3.7 years above U.S. avg.)
- Poverty rate: 7.1% (5.4 ppt. below U.S. avg.)
- Adults with a bachelor’s degree: 60.1% (25.8 ppt. above U.S. avg.)
- Median household income: $97,708 ($22,559 more than U.S. median)
- Population: 112,513
- County seat: Charlottesville
16. Delaware County, Ohio
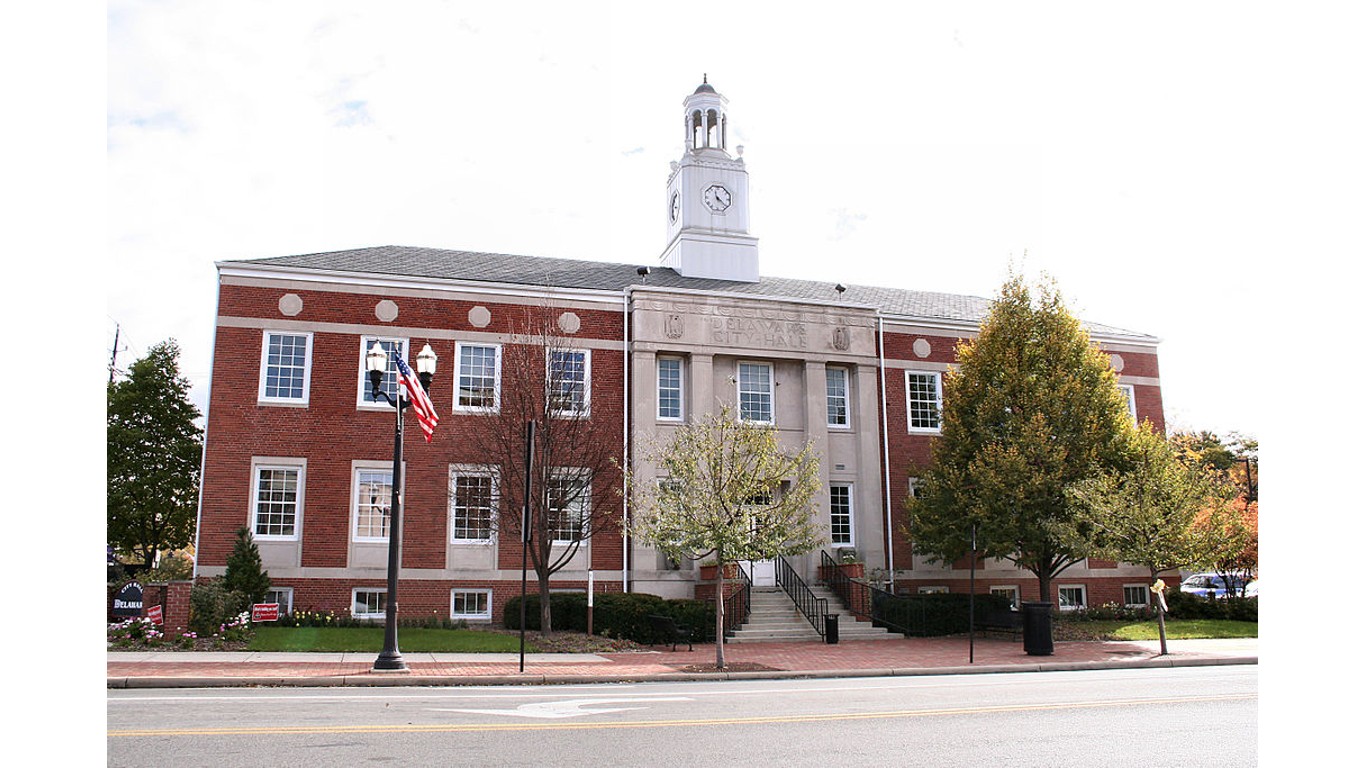
Source: Public Domain / Wikimedia Commons
- Avg. life expectancy at birth: 81.7 years (3.2 years above U.S. avg.)
- Poverty rate: 4.5% (8.0 ppt. below U.S. avg.)
- Adults with a bachelor’s degree: 57.4% (23.1 ppt. above U.S. avg.)
- Median household income: $123,995 ($48,846 more than U.S. median)
- Population: 216,074
- County seat: Delaware
15. Nantucket County, Massachusetts

Source: OlegAlbinsky / E+ via Getty Images
- Avg. life expectancy at birth: 83.0 years (4.5 years above U.S. avg.)
- Poverty rate: 4.9% (7.6 ppt. below U.S. avg.)
- Adults with a bachelor’s degree: 57.4% (23.1 ppt. above U.S. avg.)
- Median household income: $135,590 ($60,441 more than U.S. median)
- Population: 14,065
- County seat: Nantucket
14. Hunterdon County, New Jersey
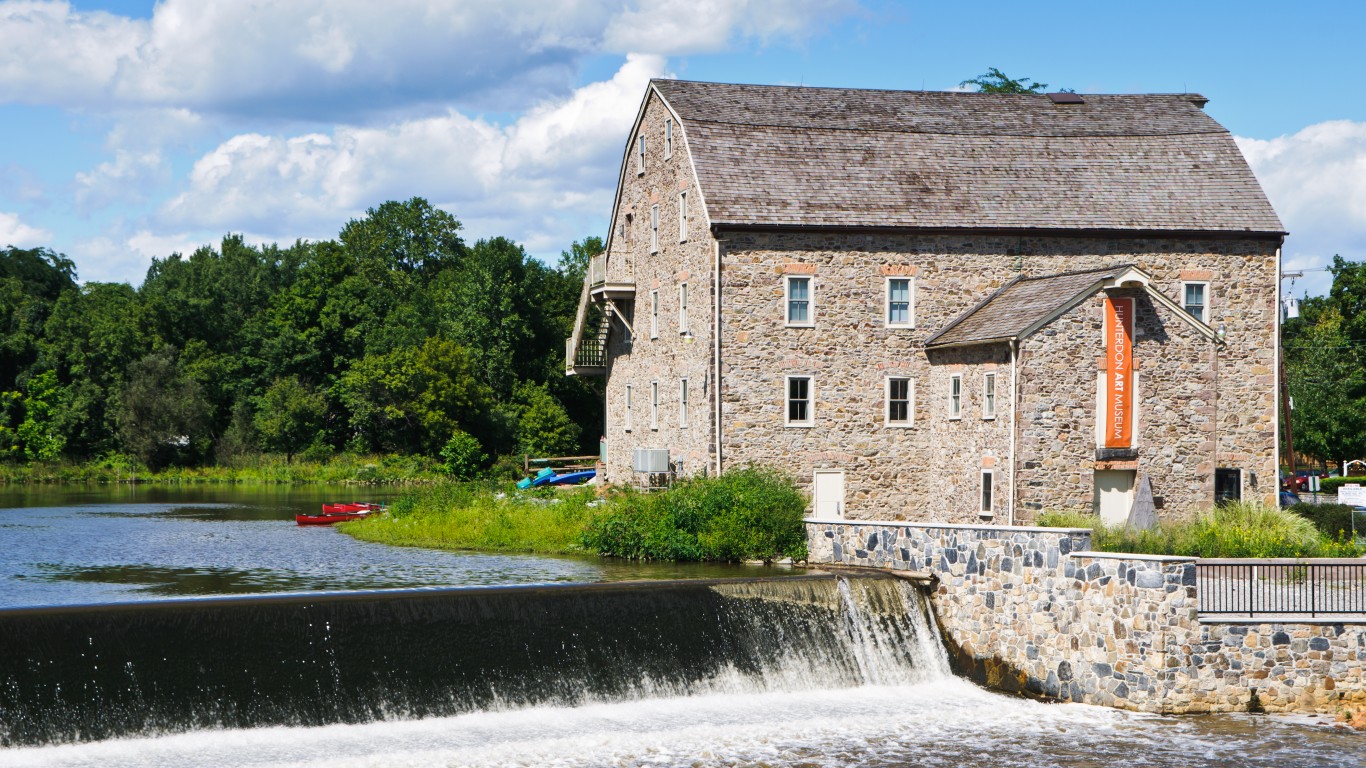
Source: KenWiedemann / Getty Images
- Avg. life expectancy at birth: 83.2 years (4.6 years above U.S. avg.)
- Poverty rate: 3.7% (8.8 ppt. below U.S. avg.)
- Adults with a bachelor’s degree: 55.5% (21.2 ppt. above U.S. avg.)
- Median household income: $133,534 ($58,385 more than U.S. median)
- Population: 129,099
- County seat: Flemington
13. Eagle County, Colorado

Source: Kruck20 / iStock via Getty Images
- Avg. life expectancy at birth: 91.4 years (12.8 years above U.S. avg.)
- Poverty rate: 8.0% (4.5 ppt. below U.S. avg.)
- Adults with a bachelor’s degree: 51.8% (17.5 ppt. above U.S. avg.)
- Median household income: $98,887 ($23,738 more than U.S. median)
- Population: 55,650
- County seat: Eagle
12. Hamilton County, Indiana

Source: Jose A Perez / Getty Images
- Avg. life expectancy at birth: 81.6 years (3.0 years above U.S. avg.)
- Poverty rate: 4.2% (8.3 ppt. below U.S. avg.)
- Adults with a bachelor’s degree: 60.8% (26.5 ppt. above U.S. avg.)
- Median household income: $114,866 ($39,717 more than U.S. median)
- Population: 349,527
- County seat: Noblesville
11. Summit County, Utah

Source: Sean Pavone / iStock via Getty Images
- Avg. life expectancy at birth: 85.6 years (7.0 years above U.S. avg.)
- Poverty rate: 5.2% (7.3 ppt. below U.S. avg.)
- Adults with a bachelor’s degree: 57.4% (23.1 ppt. above U.S. avg.)
- Median household income: $126,392 ($51,243 more than U.S. median)
- Population: 42,524
- County seat: Coalville
10. Williamson County, Tennessee
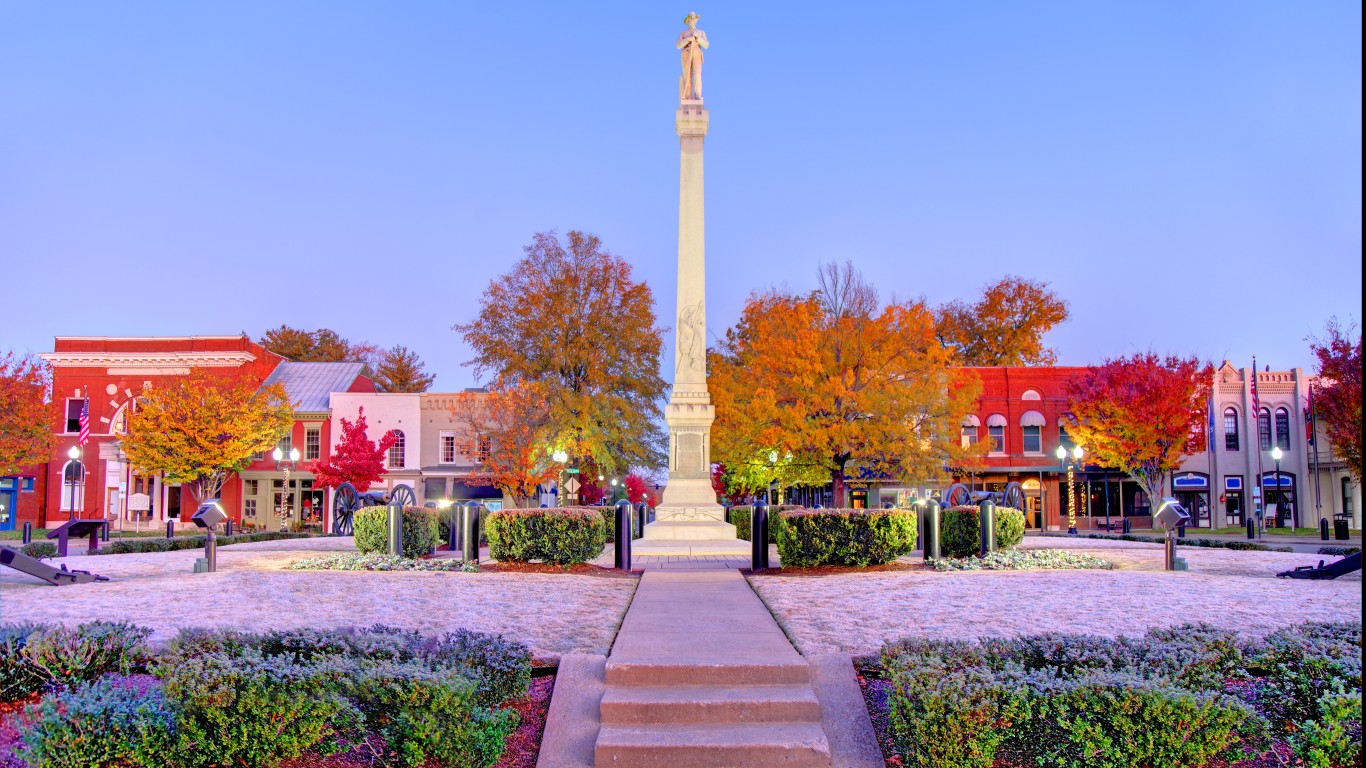
Source: DenisTangneyJr / iStock via Getty Images
- Avg. life expectancy at birth: 81.5 years (3.0 years above U.S. avg.)
- Poverty rate: 4.2% (8.4 ppt. below U.S. avg.)
- Adults with a bachelor’s degree: 62.0% (27.7 ppt. above U.S. avg.)
- Median household income: $125,943 ($50,794 more than U.S. median)
- Population: 248,897
- County seat: Franklin
9. Marin County, California

Source: Darren415 / iStock via Getty Images
- Avg. life expectancy at birth: 85.3 years (6.7 years above U.S. avg.)
- Poverty rate: 7.0% (5.6 ppt. below U.S. avg.)
- Adults with a bachelor’s degree: 61.1% (26.8 ppt. above U.S. avg.)
- Median household income: $142,019 ($66,870 more than U.S. median)
- Population: 260,485
- County seat: San Rafael
8. Teton County, Wyoming

Source: Zachary Joing / iStock via Getty Images
- Avg. life expectancy at birth: 86.7 years (8.2 years above U.S. avg.)
- Poverty rate: 6.9% (5.6 ppt. below U.S. avg.)
- Adults with a bachelor’s degree: 60.3% (26.0 ppt. above U.S. avg.)
- Median household income: $108,279 ($33,130 more than U.S. median)
- Population: 23,346
- County seat: Jackson
7. Howard County, Maryland

Source: Amy Sparwasser / iStock via Getty Images
- Avg. life expectancy at birth: 82.7 years (4.2 years above U.S. avg.)
- Poverty rate: 5.4% (7.2 ppt. below U.S. avg.)
- Adults with a bachelor’s degree: 64.0% (29.7 ppt. above U.S. avg.)
- Median household income: $140,971 ($65,822 more than U.S. median)
- Population: 332,011
- County seat: Ellicott City
6. Douglas County, Colorado

Source: Adam-Springer / iStock via Getty Images
- Avg. life expectancy at birth: 83.4 years (4.9 years above U.S. avg.)
- Poverty rate: 3.0% (9.5 ppt. below U.S. avg.)
- Adults with a bachelor’s degree: 60.0% (25.7 ppt. above U.S. avg.)
- Median household income: $139,010 ($63,861 more than U.S. median)
- Population: 360,206
- County seat: Castle Rock
5. Summit County, Colorado

Source: skibreck / iStock via Getty Images
- Avg. life expectancy at birth: 93.5 years (15.0 years above U.S. avg.)
- Poverty rate: 7.4% (5.1 ppt. below U.S. avg.)
- Adults with a bachelor’s degree: 52.3% (17.9 ppt. above U.S. avg.)
- Median household income: $100,611 ($25,462 more than U.S. median)
- Population: 30,955
- County seat: Breckenridge
4. San Miguel County, Colorado
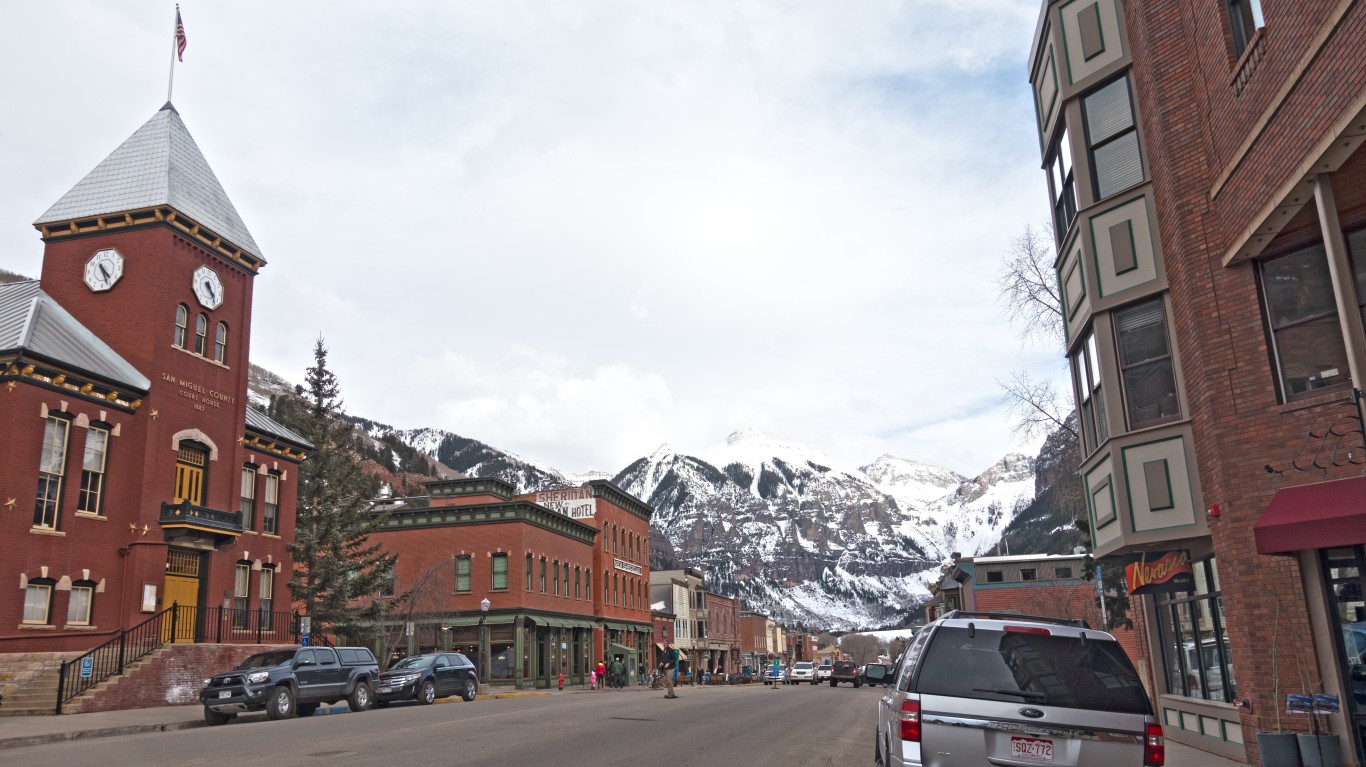
Source: SEASTOCK / iStock Editorial via Getty Images
- Avg. life expectancy at birth: 93.6 years (15.1 years above U.S. avg.)
- Poverty rate: 8.5% (4.1 ppt. below U.S. avg.)
- Adults with a bachelor’s degree: 62.2% (27.8 ppt. above U.S. avg.)
- Median household income: $72,829 ($2,320 less than U.S. median)
- Population: 8,082
- County seat: Telluride
3. Los Alamos County, New Mexico

Source: MonaMakela / iStock via Getty Images
- Avg. life expectancy at birth: 83.9 years (5.3 years above U.S. avg.)
- Poverty rate: 3.7% (8.8 ppt. below U.S. avg.)
- Adults with a bachelor’s degree: 69.7% (35.4 ppt. above U.S. avg.)
- Median household income: $135,801 ($60,652 more than U.S. median)
- Population: 19,253
- County seat: Los Alamos
2. Pitkin County, Colorado

Source: Jonathan Ross / iStock via Getty Images
- Avg. life expectancy at birth: 92.5 years (14.0 years above U.S. avg.)
- Poverty rate: 6.7% (5.9 ppt. below U.S. avg.)
- Adults with a bachelor’s degree: 63.1% (28.8 ppt. above U.S. avg.)
- Median household income: $96,123 ($20,974 more than U.S. median)
- Population: 17,325
- County seat: Aspen
1. Falls Church, Virginia (independent city)
Source: krblokhin / iStock Editorial via Getty Images
- Avg. life expectancy at birth: 80.6 years (2.1 years above U.S. avg.)
- Poverty rate: 2.3% (10.2 ppt. below U.S. avg.)
- Adults with a bachelor’s degree: 78.9% (44.6 ppt. above U.S. avg.)
- Median household income: $164,536 ($89,387 more than U.S. median)
- Population: 14,576
- County seat: None
Take This Retirement Quiz To Get Matched With A Financial Advisor (Sponsored)
Take the quiz below to get matched with a financial advisor today.
Each advisor has been vetted by SmartAsset and is held to a fiduciary standard to act in your best interests.
Here’s how it works:
1. Answer SmartAsset advisor match quiz
2. Review your pre-screened matches at your leisure. Check out the
advisors’ profiles.
3. Speak with advisors at no cost to you. Have an introductory call on the phone or introduction in person and choose whom to work with in the future
Take the retirement quiz right here.
Thank you for reading! Have some feedback for us?
Contact the 24/7 Wall St. editorial team.