The world economy is more interconnected than ever before. Still, wealth remains highly concentrated. Only four countries — China, Germany, Japan, and the United States — generated over half of global economic output in 2022, according to the World Bank. This imbalance is also evident at the household and individual level, as some countries are home to far larger affluent populations than others.
The Zurich-based investment bank Credit Suisse estimates that there are nearly 62.5 million adults worldwide with over $1 million in wealth. According to the bank’s 2022 Global Wealth Report, over 95% of them reside in one of only 39 countries — and nearly half live in either the U.S. or China.
Using data from Credit Suisse, 24/7 Wall St. identified the countries with the most millionaires. We ranked all 39 countries covered in the latest Global Wealth Report on the estimated number of millionaires for every 1,000 people with population data from the World Bank. For Taiwan, economic and population data are the latest available estimates from the CIA Factbook.
These countries span six continents, including 22 in Europe, 11 in Asia and the Pacific, and five in the Americas. Worldwide, there are about eight millionaires for every 1,000 people. Among the 39 countries on this list, 24 have more millionaires per capita than than the global average.
Indeed, not all countries on this list are particularly wealthy. According to the World Bank, gross domestic product per capita in 2022 totalled less than $15,000 in eight countries on this list — including China, which is home to 10% of the world’s millionaires. (Here is a look at the world’s poorest countries.)
However, in the highest ranking countries on this list, financial prosperity appears relatively widespread across the population at large. In each of the 10 highest ranking countries on this list, there are over 50 millionaires for every 1,000 people. In these same places, total wealth — including both financial and non-financial assets — exceeds $400,000 per adult, according to the Credit Suisse report. (Here is a look at the richest countries in the world.)
39. India

- > Millionaires in 2021: 0.6 per 1,000 people (796,000 total)
- > India as share world population: 1.3% of millionaires globally; 17.8% of global population
- > Gross wealth per adult, 2021: $16,953 ($3,926 financial assets; $13,027 non-financial assets)
- > Gross domestic product, 2022: $3.4 trillion (3.4% of global economy)
- > GDP per capita, 2022: $2,389 ($10,259 below global avg.)
38. Indonesia

- > Millionaires in 2021: 0.7 per 1,000 people (191,000 total)
- > Indonesia as share world population: 0.3% of millionaires globally; 3.5% of global population
- > Gross wealth per adult, 2021: $19,654 ($6,883 financial assets; $12,770 non-financial assets)
- > Gross domestic product, 2022: $1.3 trillion (1.3% of global economy)
- > GDP per capita, 2022: $4,788 ($7,860 below global avg.)
37. Colombia
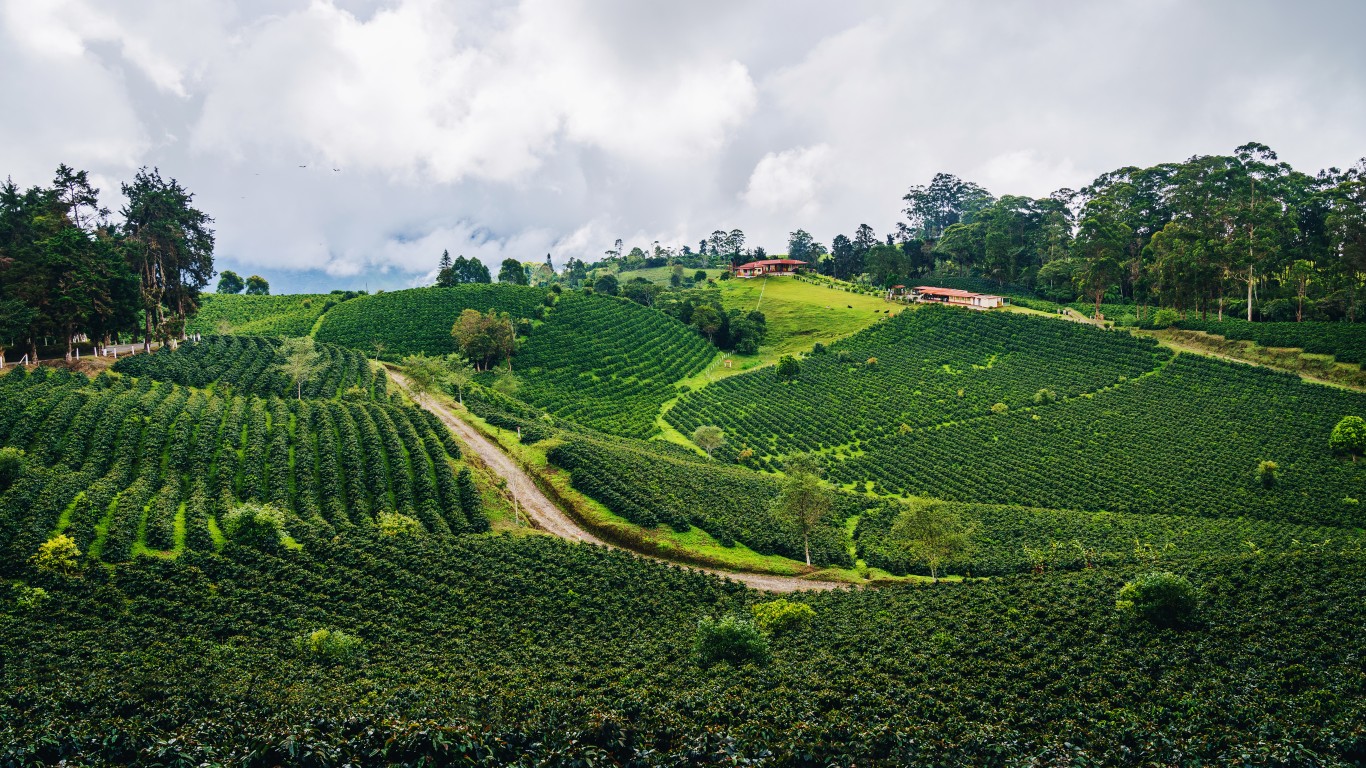
- > Millionaires in 2021: 0.8 per 1,000 people (39,000 total)
- > Colombia as share world population: 0.1% of millionaires globally; 0.7% of global population
- > Gross wealth per adult, 2021: $20,318 ($9,434 financial assets; $10,883 non-financial assets)
- > Gross domestic product, 2022: $343.9 billion (0.3% of global economy)
- > GDP per capita, 2022: $6,630 ($6,017 below global avg.)
36. Turkey

- > Millionaires in 2021: 0.9 per 1,000 people (73,000 total)
- > Turkey as share world population: 0.1% of millionaires globally; 1.1% of global population
- > Gross wealth per adult, 2021: $20,936 ($5,486 financial assets; $15,450 non-financial assets)
- > Gross domestic product, 2022: $906.0 billion (0.9% of global economy)
- > GDP per capita, 2022: $10,616 ($2,031 below global avg.)
35. Thailand

- > Millionaires in 2021: 1.1 per 1,000 people (82,000 total)
- > Thailand as share world population: 0.1% of millionaires globally; 0.9% of global population
- > Gross wealth per adult, 2021: $30,231 ($10,027 financial assets; $20,205 non-financial assets)
- > Gross domestic product, 2022: $495.3 billion (0.5% of global economy)
- > GDP per capita, 2022: $6,909 ($5,739 below global avg.)
34. South Africa

- > Millionaires in 2021: 1.4 per 1,000 people (86,000 total)
- > South Africa as share world population: 0.1% of millionaires globally; 0.8% of global population
- > Gross wealth per adult, 2021: $28,871 ($19,999 financial assets; $8,872 non-financial assets)
- > Gross domestic product, 2022: $405.9 billion (0.4% of global economy)
- > GDP per capita, 2022: $6,776 ($5,871 below global avg.)
33. Romania

- > Millionaires in 2021: 1.9 per 1,000 people (37,000 total)
- > Romania as share world population: 0.1% of millionaires globally; 0.2% of global population
- > Gross wealth per adult, 2021: $45,965 ($13,795 financial assets; $32,171 non-financial assets)
- > Gross domestic product, 2022: $301.3 billion (0.3% of global economy)
- > GDP per capita, 2022: $15,892 ($3,245 above global avg.)
32. Russia

- > Millionaires in 2021: 2.5 per 1,000 people (353,000 total)
- > Russia as share world population: 0.6% of millionaires globally; 1.8% of global population
- > Gross wealth per adult, 2021: $37,390 ($13,683 financial assets; $23,707 non-financial assets)
- > Gross domestic product, 2022: $2.2 trillion (2.2% of global economy)
- > GDP per capita, 2022: $15,345 ($2,698 above global avg.)
31. Mexico
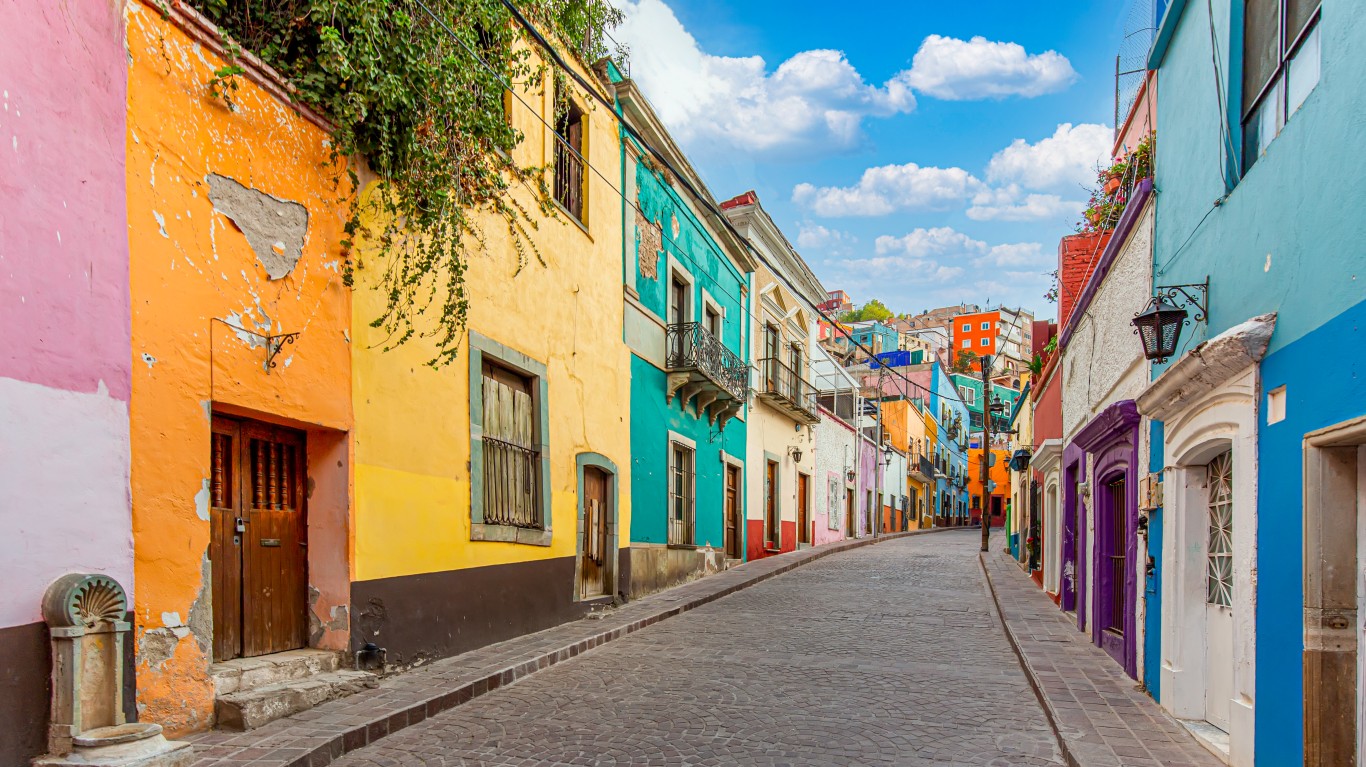
- > Millionaires in 2021: 2.5 per 1,000 people (318,000 total)
- > Mexico as share world population: 0.5% of millionaires globally; 1.6% of global population
- > Gross wealth per adult, 2021: $50,948 ($19,061 financial assets; $31,886 non-financial assets)
- > Gross domestic product, 2022: $1.4 trillion (1.4% of global economy)
- > GDP per capita, 2022: $11,091 ($1,556 below global avg.)
30. Poland
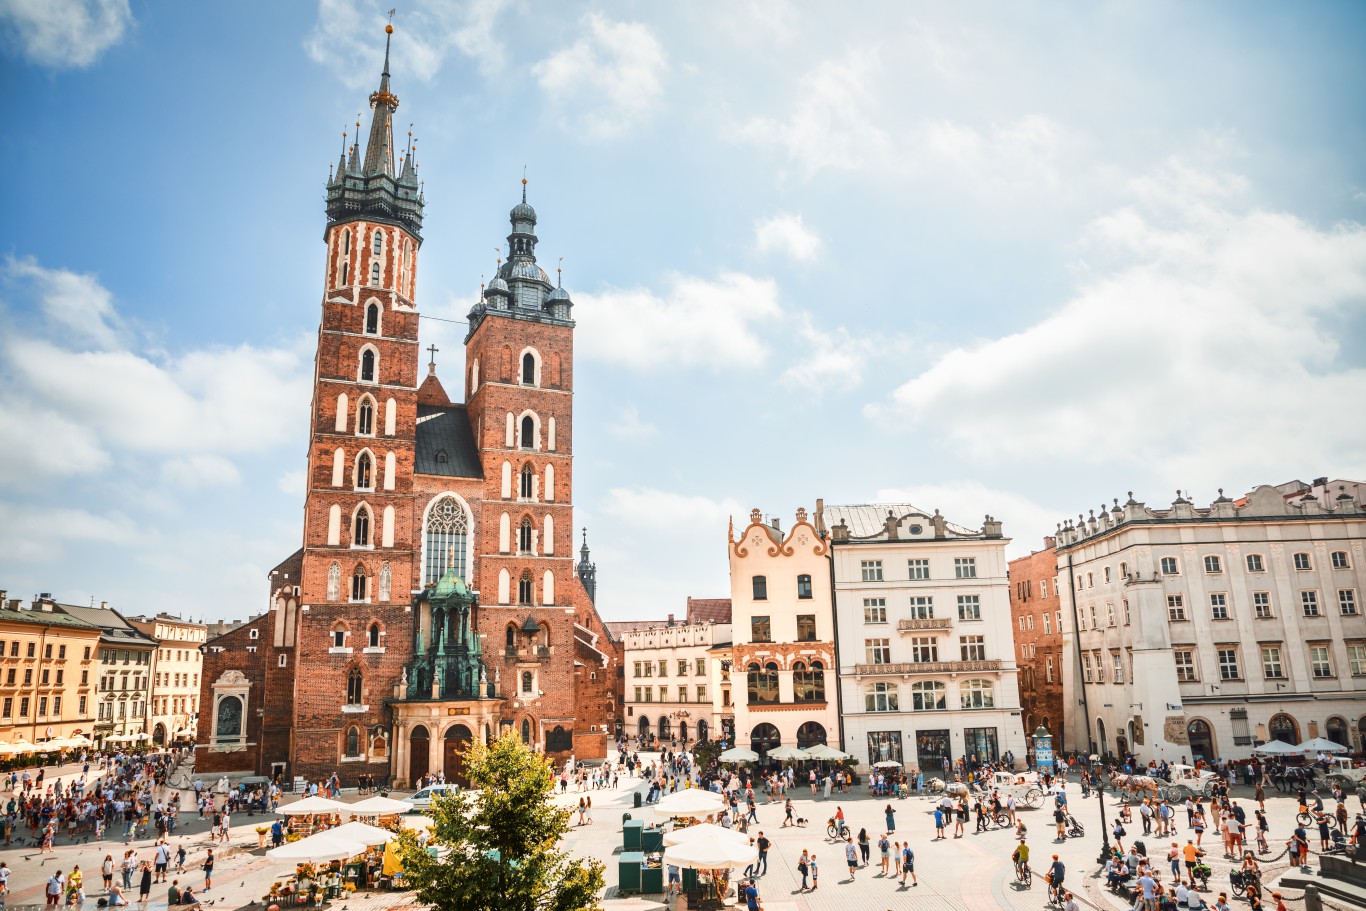
- > Millionaires in 2021: 2.6 per 1,000 people (100,000 total)
- > Poland as share world population: 0.2% of millionaires globally; 0.5% of global population
- > Gross wealth per adult, 2021: $57,428 ($22,817 financial assets; $34,611 non-financial assets)
- > Gross domestic product, 2022: $688.2 billion (0.7% of global economy)
- > GDP per capita, 2022: $18,321 ($5,674 above global avg.)
29. Hungary

- > Millionaires in 2021: 3.3 per 1,000 people (32,000 total)
- > Hungary as share world population: 0.1% of millionaires globally; 0.1% of global population
- > Gross wealth per adult, 2021: $76,464 ($33,098 financial assets; $43,366 non-financial assets)
- > Gross domestic product, 2022: $178.8 billion (0.2% of global economy)
- > GDP per capita, 2022: $18,463 ($5,816 above global avg.)
28. Chile

- > Millionaires in 2021: 3.4 per 1,000 people (66,000 total)
- > Chile as share world population: 0.1% of millionaires globally; 0.2% of global population
- > Gross wealth per adult, 2021: $65,041 ($38,878 financial assets; $26,163 non-financial assets)
- > Gross domestic product, 2022: $301.0 billion (0.3% of global economy)
- > GDP per capita, 2022: $15,356 ($2,708 above global avg.)
27. China

- > Millionaires in 2021: 4.4 per 1,000 people (6,190,000 total)
- > China as share world population: 9.9% of millionaires globally; 17.8% of global population
- > Gross wealth per adult, 2021: $85,630 ($38,248 financial assets; $47,382 non-financial assets)
- > Gross domestic product, 2022: $18.0 trillion (17.9% of global economy)
- > GDP per capita, 2022: $12,720 ($73 above global avg.)
26. Czechia

- > Millionaires in 2021: 6.5 per 1,000 people (68,000 total)
- > Czechia as share world population: 0.1% of millionaires globally; 0.1% of global population
- > Gross wealth per adult, 2021: $96,221 ($47,594 financial assets; $48,628 non-financial assets)
- > Gross domestic product, 2022: $290.9 billion (0.3% of global economy)
- > GDP per capita, 2022: $27,638 ($14,991 above global avg.)
25. Greece

- > Millionaires in 2021: 7.6 per 1,000 people (81,000 total)
- > Greece as share world population: 0.1% of millionaires globally; 0.1% of global population
- > Gross wealth per adult, 2021: $123,277 ($40,073 financial assets; $83,204 non-financial assets)
- > Gross domestic product, 2022: $219.1 billion (0.2% of global economy)
- > GDP per capita, 2022: $20,732 ($8,085 above global avg.)
24. Portugal

- > Millionaires in 2021: 15.4 per 1,000 people (159,000 total)
- > Portugal as share world population: 0.3% of millionaires globally; 0.1% of global population
- > Gross wealth per adult, 2021: $175,420 ($62,019 financial assets; $113,402 non-financial assets)
- > Gross domestic product, 2022: $252.0 billion (0.3% of global economy)
- > GDP per capita, 2022: $24,275 ($11,627 above global avg.)
23. Finland

- > Millionaires in 2021: 18.2 per 1,000 people (101,000 total)
- > Finland as share world population: 0.2% of millionaires globally; 0.1% of global population
- > Gross wealth per adult, 2021: $238,213 ($99,964 financial assets; $138,249 non-financial assets)
- > Gross domestic product, 2022: $280.8 billion (0.3% of global economy)
- > GDP per capita, 2022: $50,537 ($37,889 above global avg.)
22. Israel
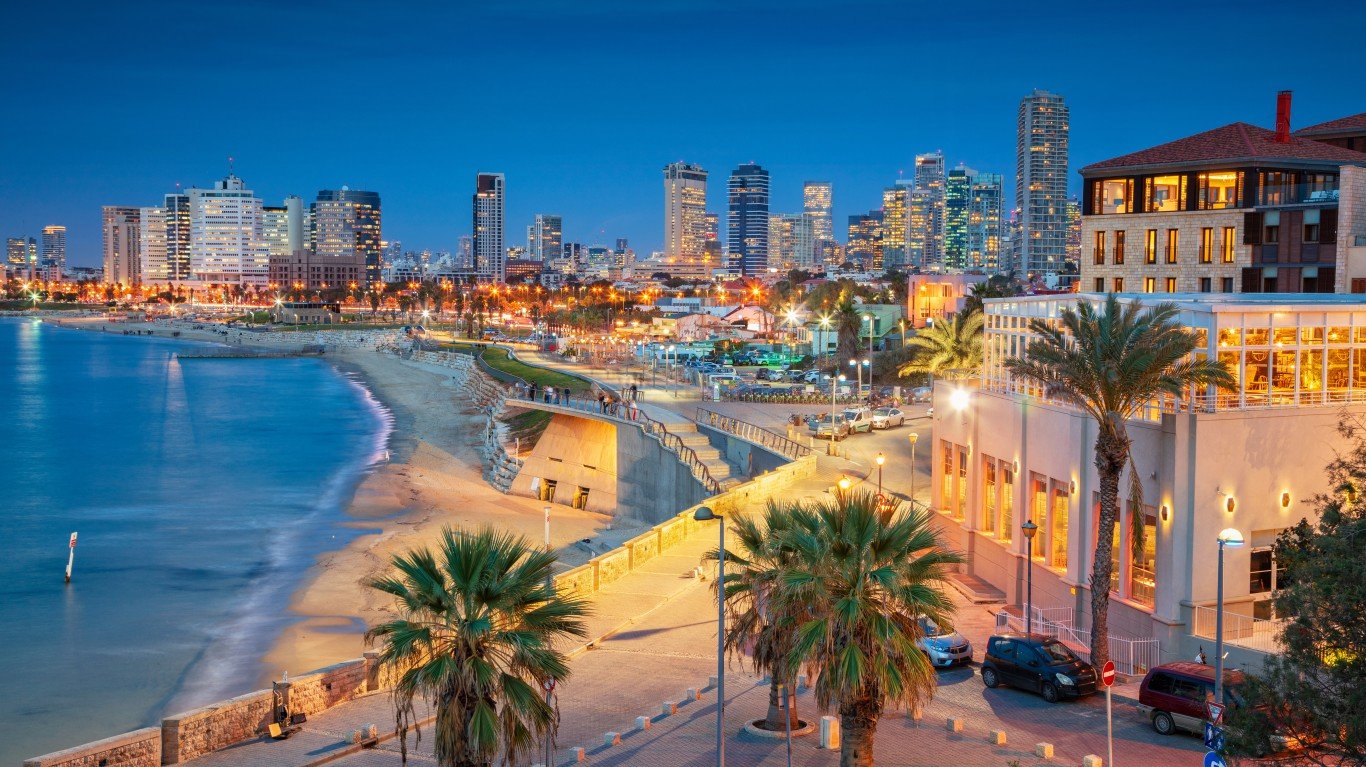
- > Millionaires in 2021: 21.8 per 1,000 people (204,000 total)
- > Israel as share world population: 0.3% of millionaires globally; 0.1% of global population
- > Gross wealth per adult, 2021: $318,012 ($233,869 financial assets; $84,143 non-financial assets)
- > Gross domestic product, 2022: $522.0 billion (0.5% of global economy)
- > GDP per capita, 2022: $54,660 ($42,012 above global avg.)
21. Spain

- > Millionaires in 2021: 23.9 per 1,000 people (1,132,000 total)
- > Spain as share world population: 1.8% of millionaires globally; 0.6% of global population
- > Gross wealth per adult, 2021: $245,805 ($79,259 financial assets; $166,546 non-financial assets)
- > Gross domestic product, 2022: $1.4 trillion (1.4% of global economy)
- > GDP per capita, 2022: $29,350 ($16,703 above global avg.)
20. Italy
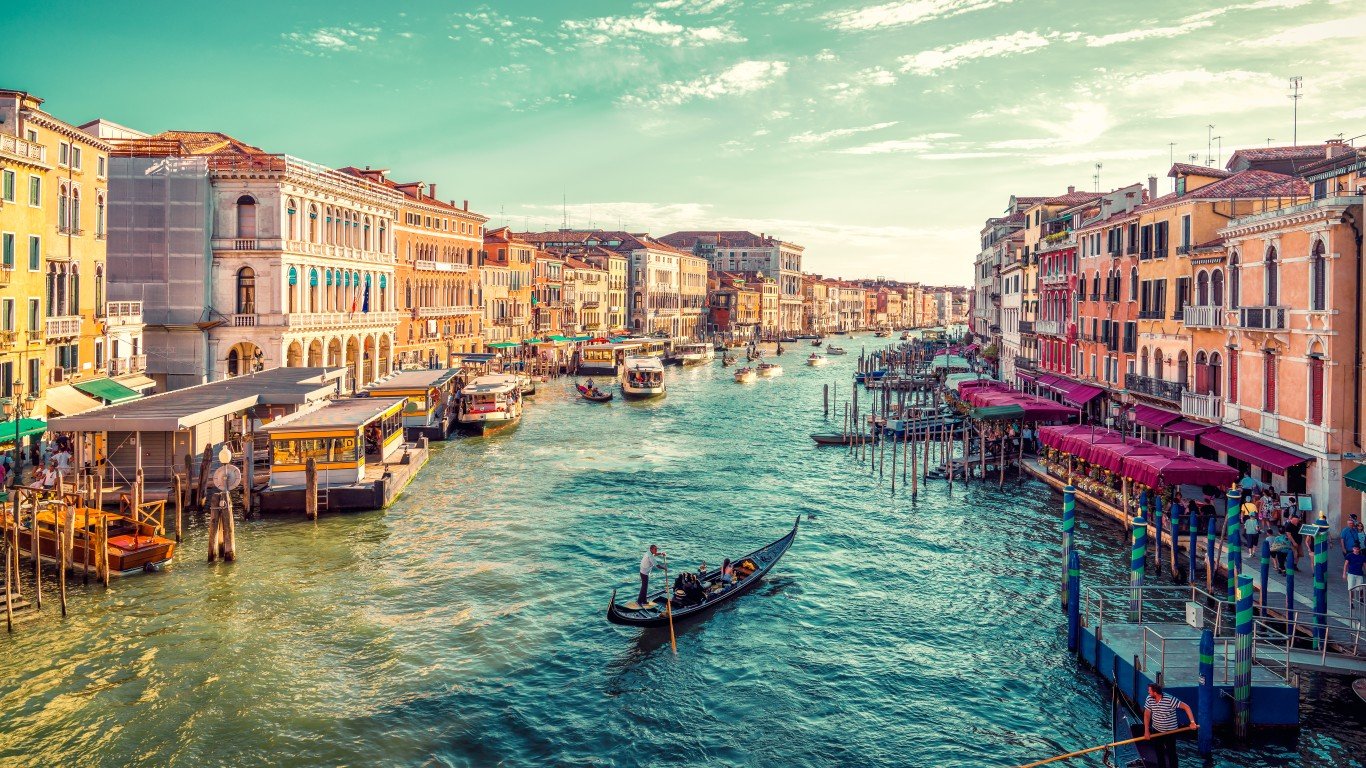
- > Millionaires in 2021: 23.9 per 1,000 people (1,413,000 total)
- > Italy as share world population: 2.3% of millionaires globally; 0.7% of global population
- > Gross wealth per adult, 2021: $253,965 ($115,335 financial assets; $138,630 non-financial assets)
- > Gross domestic product, 2022: $2.0 trillion (2.0% of global economy)
- > GDP per capita, 2022: $34,158 ($21,511 above global avg.)
19. Korea

- > Millionaires in 2021: 24.9 per 1,000 people (1,290,000 total)
- > Korea as share world population: 2.1% of millionaires globally; 0.6% of global population
- > Gross wealth per adult, 2021: $281,953 ($97,177 financial assets; $184,775 non-financial assets)
- > Gross domestic product, 2022: $1.7 trillion (1.7% of global economy)
- > GDP per capita, 2022: $32,255 ($19,607 above global avg.)
18. Japan

- > Millionaires in 2021: 26.8 per 1,000 people (3,366,000 total)
- > Japan as share world population: 5.4% of millionaires globally; 1.6% of global population
- > Gross wealth per adult, 2021: $274,471 ($169,080 financial assets; $105,391 non-financial assets)
- > Gross domestic product, 2022: $4.2 trillion (4.2% of global economy)
- > GDP per capita, 2022: $33,815 ($21,168 above global avg.)
17. Austria

- > Millionaires in 2021: 30.3 per 1,000 people (271,000 total)
- > Austria as share world population: 0.4% of millionaires globally; 0.1% of global population
- > Gross wealth per adult, 2021: $283,120 ($125,124 financial assets; $157,996 non-financial assets)
- > Gross domestic product, 2022: $471.4 billion (0.5% of global economy)
- > GDP per capita, 2022: $52,131 ($39,484 above global avg.)
16. Germany

- > Millionaires in 2021: 32.2 per 1,000 people (2,683,000 total)
- > Germany as share world population: 4.3% of millionaires globally; 1.1% of global population
- > Gross wealth per adult, 2021: $290,978 ($126,775 financial assets; $164,203 non-financial assets)
- > Gross domestic product, 2022: $4.1 trillion (4.0% of global economy)
- > GDP per capita, 2022: $48,432 ($35,785 above global avg.)
15. Ireland

- > Millionaires in 2021: 35.0 per 1,000 people (176,000 total)
- > Ireland as share world population: 0.3% of millionaires globally; 0.1% of global population
- > Gross wealth per adult, 2021: $294,549 ($155,982 financial assets; $138,568 non-financial assets)
- > Gross domestic product, 2022: $529.2 billion (0.5% of global economy)
- > GDP per capita, 2022: $104,039 ($91,392 above global avg.)
14. Taiwan

- > Millionaires in 2021: 36.8 per 1,000 people (869,000 total)
- > Taiwan as share world population: 1.4% of millionaires globally; 0.3% of global population
- > Gross wealth per adult, 2021: $335,168 ($232,920 financial assets; $102,249 non-financial assets)
- > Gross domestic product, 2022: $1.1 trillion (1.1% of global economy)
- > GDP per capita, 2022: $48,456 ($35,808 above global avg.)
13. France

- > Millionaires in 2021: 41.3 per 1,000 people (2,796,000 total)
- > France as share world population: 4.5% of millionaires globally; 0.9% of global population
- > Gross wealth per adult, 2021: $364,944 ($146,424 financial assets; $218,521 non-financial assets)
- > Gross domestic product, 2022: $2.8 trillion (2.8% of global economy)
- > GDP per capita, 2022: $40,964 ($28,316 above global avg.)
12. United Kingdom

- > Millionaires in 2021: 42.5 per 1,000 people (2,849,000 total)
- > United Kingdom as share world population: 4.6% of millionaires globally; 0.8% of global population
- > Gross wealth per adult, 2021: $361,618 ($189,915 financial assets; $171,704 non-financial assets)
- > Gross domestic product, 2022: $3.1 trillion (3.1% of global economy)
- > GDP per capita, 2022: $45,850 ($33,203 above global avg.)
11. Norway

- > Millionaires in 2021: 43.6 per 1,000 people (236,000 total)
- > Norway as share world population: 0.4% of millionaires globally; 0.1% of global population
- > Gross wealth per adult, 2021: $450,133 ($160,983 financial assets; $289,150 non-financial assets)
- > Gross domestic product, 2022: $579.3 billion (0.6% of global economy)
- > GDP per capita, 2022: $106,149 ($93,501 above global avg.)
10. Belgium

- > Millionaires in 2021: 50.8 per 1,000 people (589,000 total)
- > Belgium as share world population: 0.9% of millionaires globally; 0.1% of global population
- > Gross wealth per adult, 2021: $422,567 ($192,517 financial assets; $230,050 non-financial assets)
- > Gross domestic product, 2022: $578.6 billion (0.6% of global economy)
- > GDP per capita, 2022: $49,583 ($36,935 above global avg.)
9. Singapore

- > Millionaires in 2021: 54.8 per 1,000 people (299,000 total)
- > Singapore as share world population: 0.5% of millionaires globally; 0.1% of global population
- > Gross wealth per adult, 2021: $412,736 ($238,070 financial assets; $174,666 non-financial assets)
- > Gross domestic product, 2022: $466.8 billion (0.5% of global economy)
- > GDP per capita, 2022: $82,808 ($70,160 above global avg.)
8. Sweden
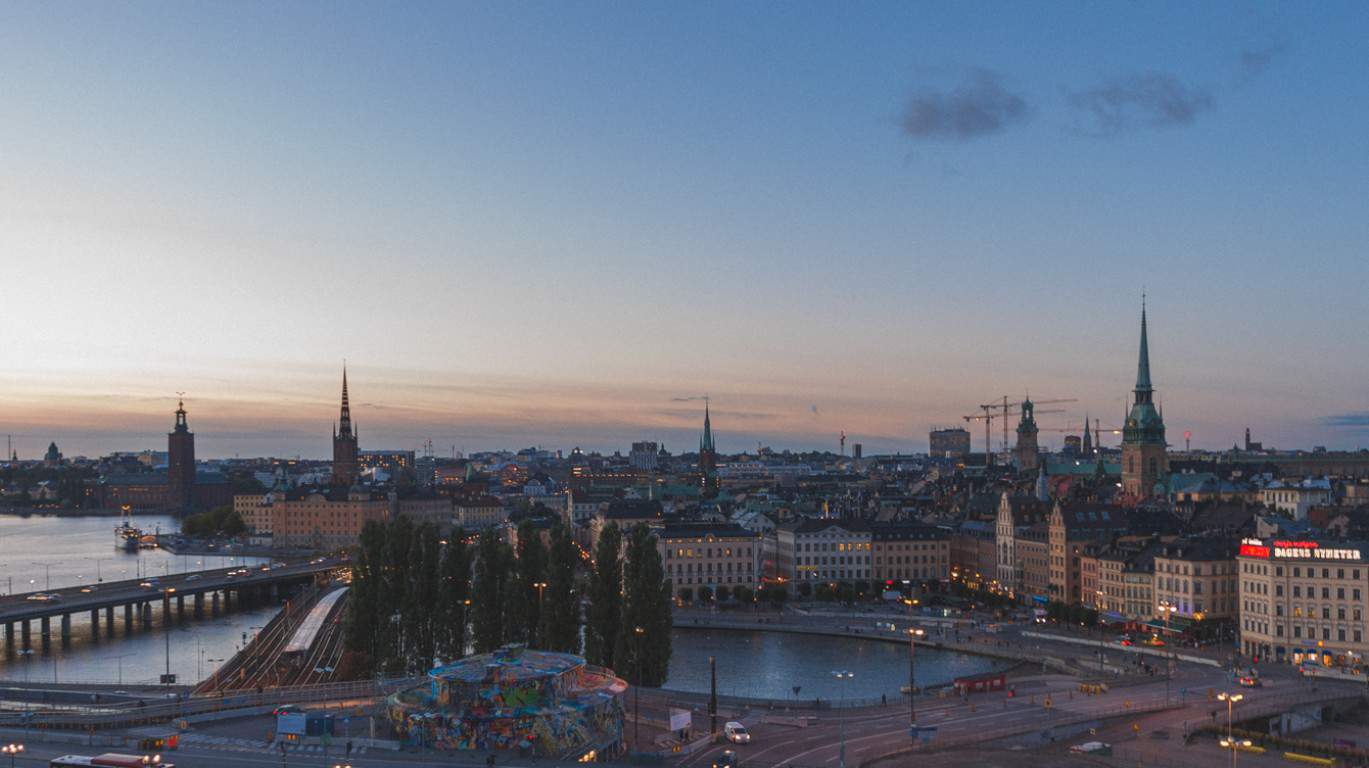
- > Millionaires in 2021: 58.6 per 1,000 people (610,000 total)
- > Sweden as share world population: 1.0% of millionaires globally; 0.1% of global population
- > Gross wealth per adult, 2021: $455,726 ($292,931 financial assets; $162,796 non-financial assets)
- > Gross domestic product, 2022: $585.9 billion (0.6% of global economy)
- > GDP per capita, 2022: $55,873 ($43,226 above global avg.)
7. Canada

- > Millionaires in 2021: 59.9 per 1,000 people (2,291,000 total)
- > Canada as share world population: 3.7% of millionaires globally; 0.5% of global population
- > Gross wealth per adult, 2021: $478,620 ($241,785 financial assets; $236,835 non-financial assets)
- > Gross domestic product, 2022: $2.1 trillion (2.1% of global economy)
- > GDP per capita, 2022: $54,966 ($42,319 above global avg.)
6. Netherlands

- > Millionaires in 2021: 65.5 per 1,000 people (1,149,000 total)
- > Netherlands as share world population: 1.8% of millionaires globally; 0.2% of global population
- > Gross wealth per adult, 2021: $477,379 ($257,224 financial assets; $220,155 non-financial assets)
- > Gross domestic product, 2022: $991.1 billion (1.0% of global economy)
- > GDP per capita, 2022: $55,985 ($43,338 above global avg.)
5. Denmark
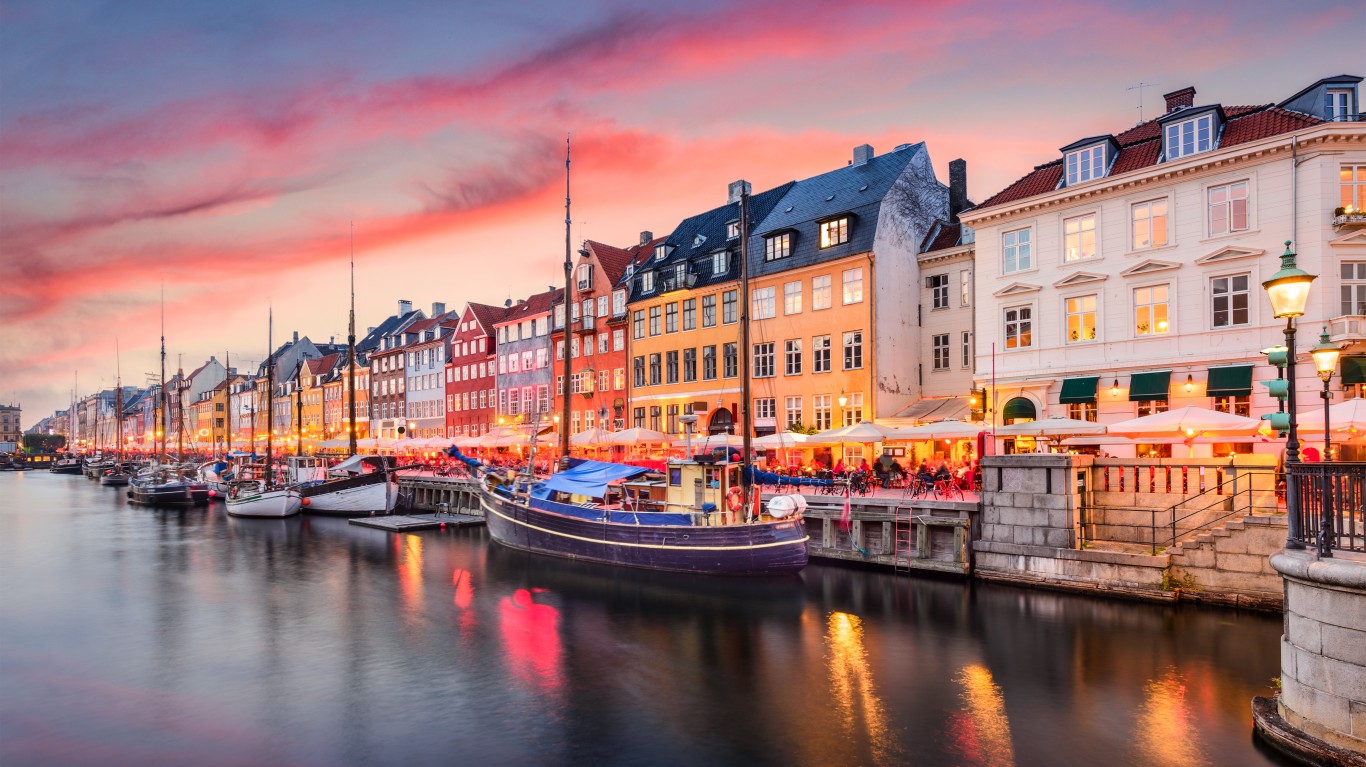
- > Millionaires in 2021: 65.7 per 1,000 people (385,000 total)
- > Denmark as share world population: 0.6% of millionaires globally; 0.1% of global population
- > Gross wealth per adult, 2021: $515,969 ($350,452 financial assets; $165,517 non-financial assets)
- > Gross domestic product, 2022: $395.4 billion (0.4% of global economy)
- > GDP per capita, 2022: $66,983 ($54,336 above global avg.)
4. New Zealand

- > Millionaires in 2021: 67.9 per 1,000 people (347,000 total)
- > New Zealand as share world population: 0.6% of millionaires globally; 0.1% of global population
- > Gross wealth per adult, 2021: $525,110 ($272,410 financial assets; $252,700 non-financial assets)
- > Gross domestic product, 2022: $247.2 billion (0.2% of global economy)
- > GDP per capita, 2022: $48,249 ($35,602 above global avg.)
3. United States

- > Millionaires in 2021: 73.7 per 1,000 people (24,480,000 total)
- > United States as share world population: 39.2% of millionaires globally; 4.2% of global population
- > Gross wealth per adult, 2021: $648,585 ($468,295 financial assets; $180,290 non-financial assets)
- > Gross domestic product, 2022: $25.5 trillion (25.3% of global economy)
- > GDP per capita, 2022: $76,399 ($63,751 above global avg.)
2. Australia

- > Millionaires in 2021: 84.7 per 1,000 people (2,177,000 total)
- > Australia as share world population: 3.5% of millionaires globally; 0.3% of global population
- > Gross wealth per adult, 2021: $652,667 ($254,419 financial assets; $398,248 non-financial assets)
- > Gross domestic product, 2022: $1.7 trillion (1.7% of global economy)
- > GDP per capita, 2022: $64,491 ($51,844 above global avg.)
1. Switzerland

- > Millionaires in 2021: 132.4 per 1,000 people (1,152,000 total)
- > Switzerland as share world population: 1.8% of millionaires globally; 0.1% of global population
- > Gross wealth per adult, 2021: $847,834 ($475,140 financial assets; $372,694 non-financial assets)
- > Gross domestic product, 2022: $807.7 billion (0.8% of global economy)
- > GDP per capita, 2022: $92,101 ($79,454 above global avg.)
Contact [email protected] for any questions or corrections.