The Emancipation Proclamation, freeing all enslaved individuals following the North’s victory in the Civil War, did not reach the town of Galveston in the southernmost parts of Texas until June 1865, 2 years after it was passed. As it became the last known stronghold of slaves, their celebration of freedom has lasted for the years that have followed generation after generation. It was not until 2021 that Juneteenth or June 19 was recognized nationally as a federal holiday.
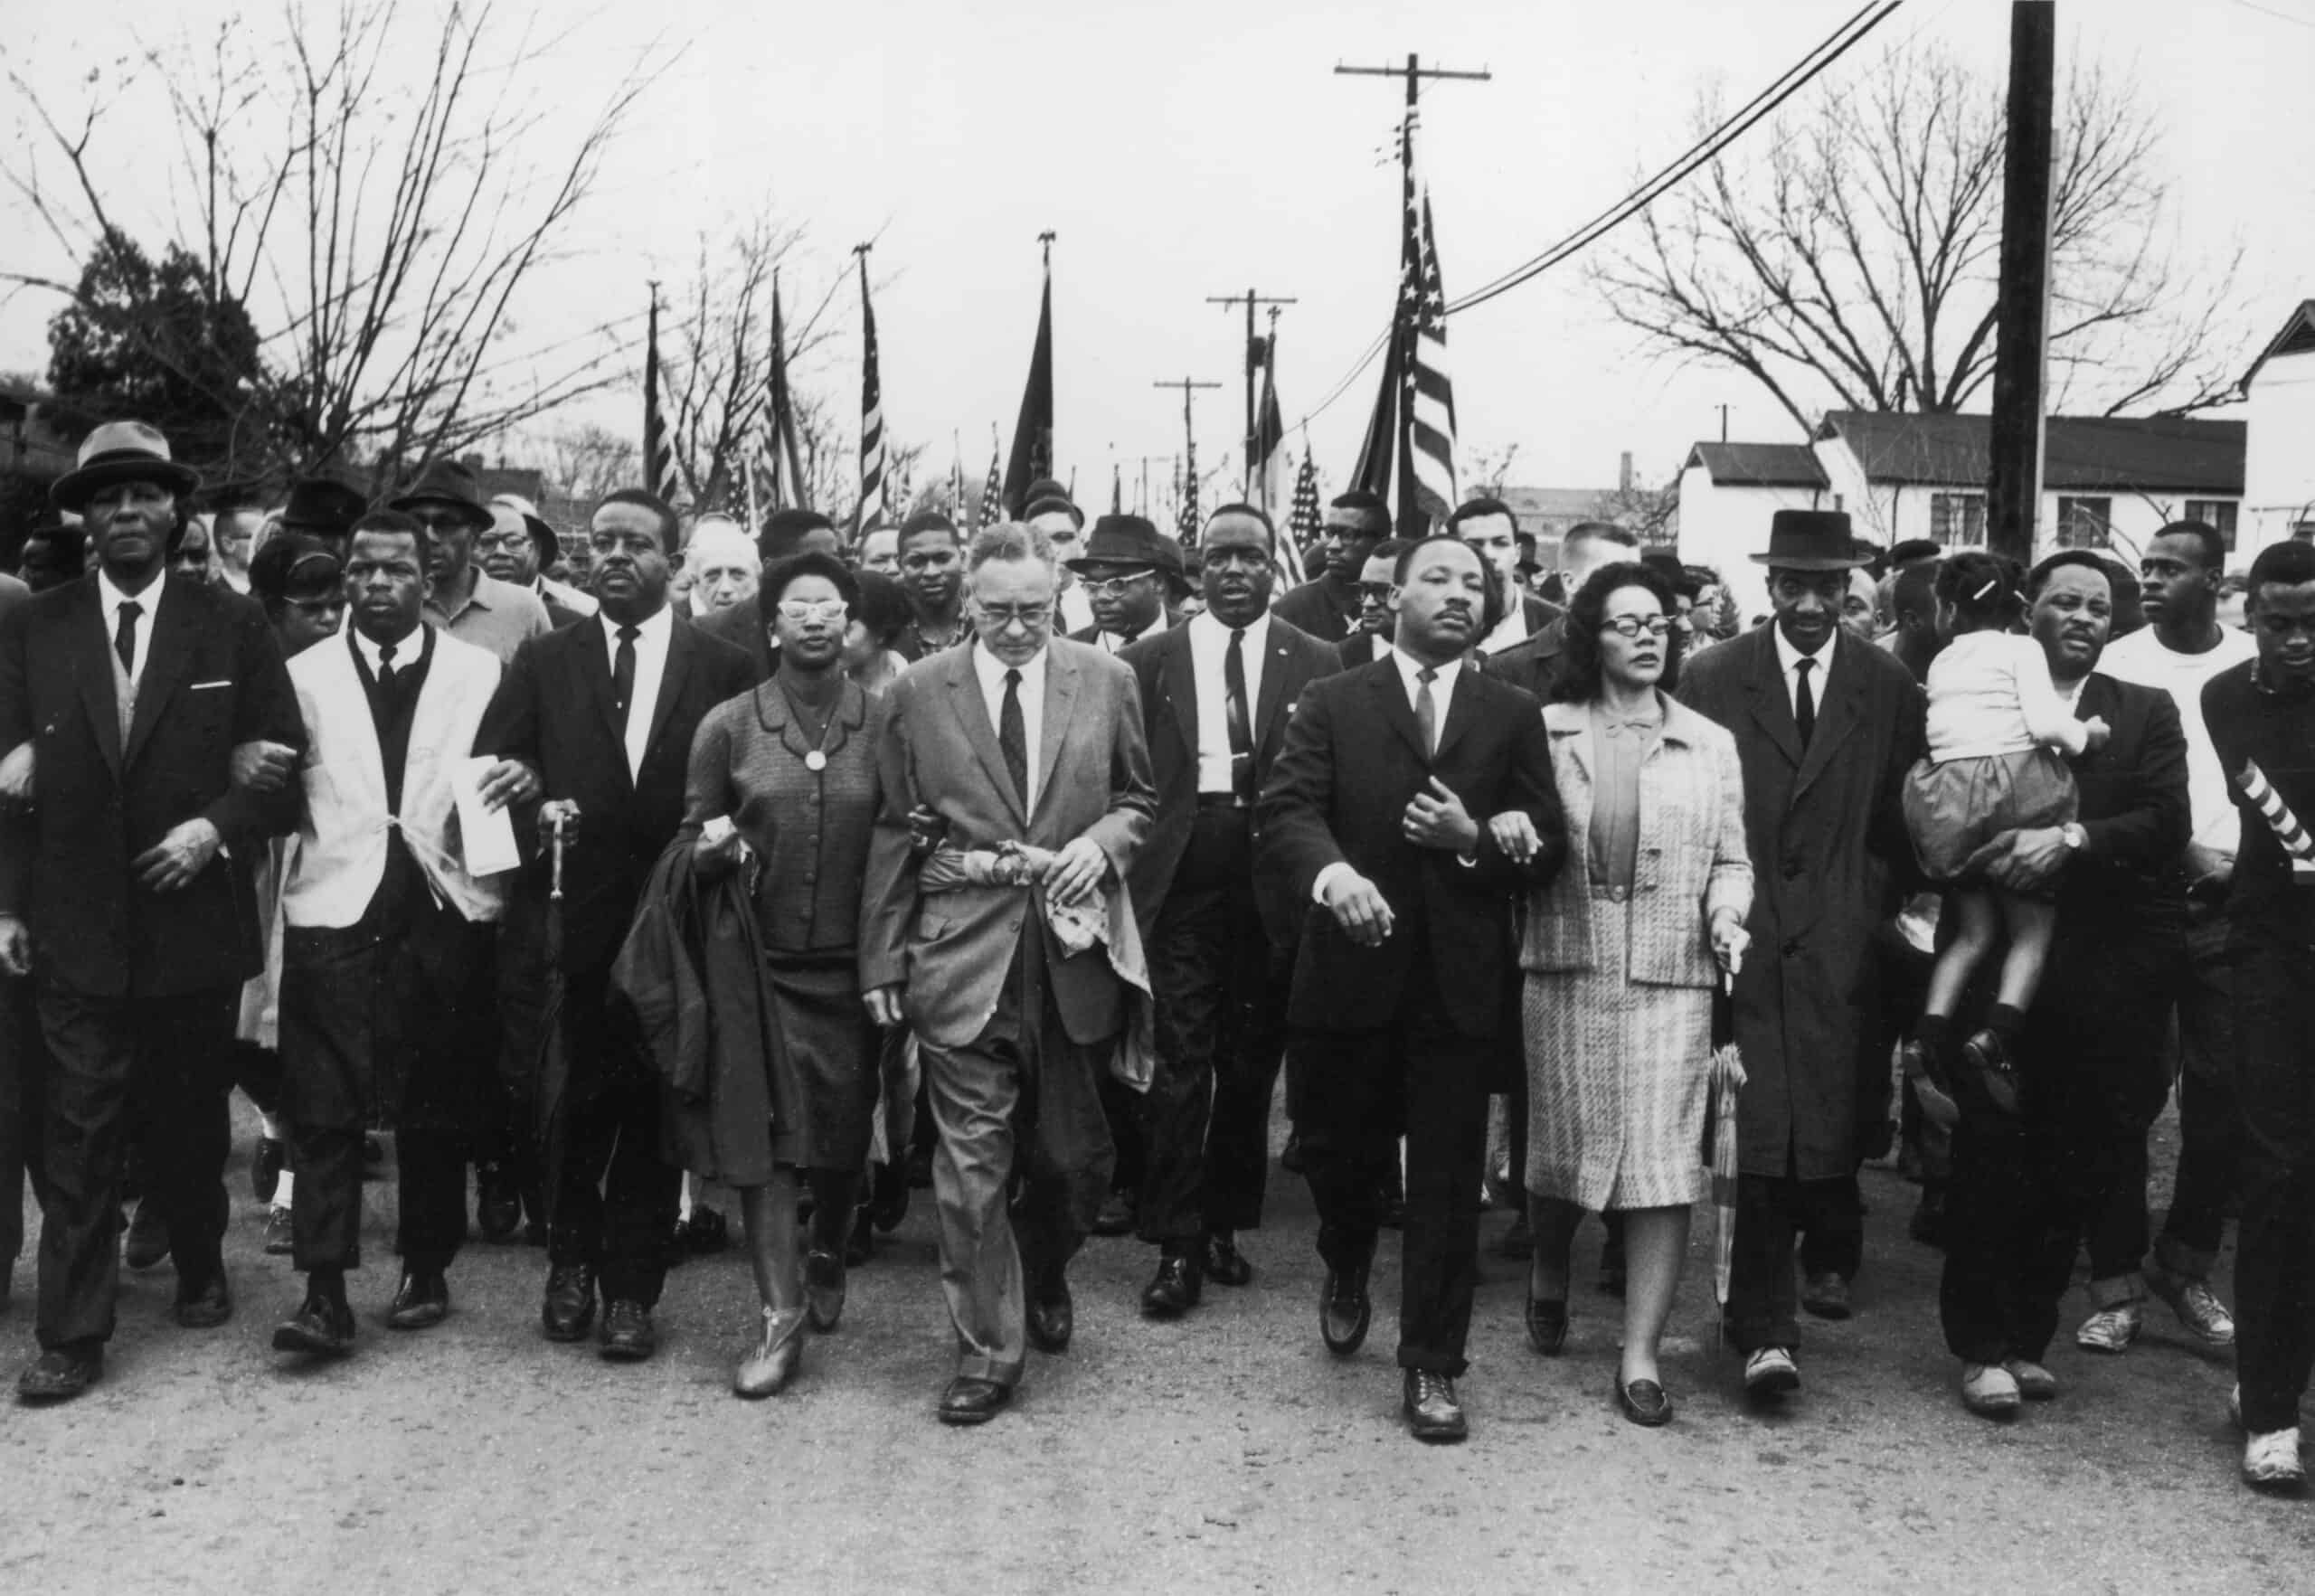
The sense of freedom did not seem to last long, though, as Black Americans went on to endure many roadblocks to equal treatment and true freedom. The post-Civil War era Jim Crow Laws created dangerous conditions for many in the South. They faced deeply enforced segregation, limited opportunities, threats, and violence at the hands of their white neighbors. From 1865 – 1954, the nation watched as the treatment remained untenable and became worse in many cities. The civil rights movement was a grass-roots effort led, most notably by Martin Luther King, Jr., to bring attention to the country’s social disparities, injustices, and discrimination. It gained traction beginning in 1954 and led to The Civil Rights Act of 1964 and the Voting Rights Act of 1965, originating with President John F. Kennedy and signed into law following his assignation by President Lyndon Johnson. Yet, the inhumane treatment, acts of violence, and deep-seated beliefs, behaviors, and policies had already left a legacy and taken deep root in many cities in the South and across America.
According to the U.S. Department of the Treasury, racial disparity or inequality is “the unequal distribution of resources, power, and economic opportunity across race in a society. While the discussion of racial inequality in the United States is often focused on economic inequality, racial inequality also manifests itself in a multitude of ways that alone and together impact the well-being of all Americans. This includes racial disparities in wealth, education, employment, housing, mobility, health, rates of incarceration, and more.”
In an effort to escape from these disparities, the largest movement of people in the United States history took place from the 1910s to the 1970s. Now referred to as the Great Migration, Black Americans set out from all parts of the South to places throughout the country unknown to them but bringing promises of equal opportunities and freedom from Jim Crow laws. While many did succeed in finding better jobs and opportunities for their families, they were still faced with injustices that have impacted their race to this day. Tension and prejudice were found as white people had to adjust to demographic changes in their neighborhoods. Those in power set out to implement redlining, which created segregated neighborhoods and is a foundation of some of the greatest wealth disparities faced to this day.
To determine the worst cities for Black Americans, 24/7 Wall St. examined data from eight socioeconomic measures in each of the nation’s 384 metropolitan areas. For each city, we evaluated the gap between White and Black residents in poverty, high school and college education, income, homeownership, unemployment, mortality, and incarceration.
We consulted data from the U.S. Census Bureau’s 2022 American Community Survey, Bureau of Justice Statistics, and Centers For Disease Control and Prevention. These figures were adjusted for population using ACS data. For each measure, we constructed an index of the gaps between Black and White Americans. The index was standardized using min-max normalization. We excluded metro areas where Black residents comprise less than 5% of the population. Because states, rather than metro areas, are responsible for the prison population, incarceration rates are for the state where the metro area is located. If a metro area spans more than one state, we used the state in which the metro area’s principal city is located. We aggregated mortality rates from the county to the metropolitan level using boundary definitions from the Census Bureau. Incarceration and mortality rates are per 100,000 residents.
Why This Matters

Source: Hyejin Kang / Shutterstock.com
25. Decatur, IL

Source: Westhoff / E+ via Getty Images
- Median household income, 2022: $32,570 (Black); $67,048 (White)
- Homeownership rate, 2022: 35.2% (Black); 76.4% (White)
- Unemployment rate, 2022: 18.9% (Black); 5.6% (White)
- Black population, 2022: 17,530 (16.9% of total)
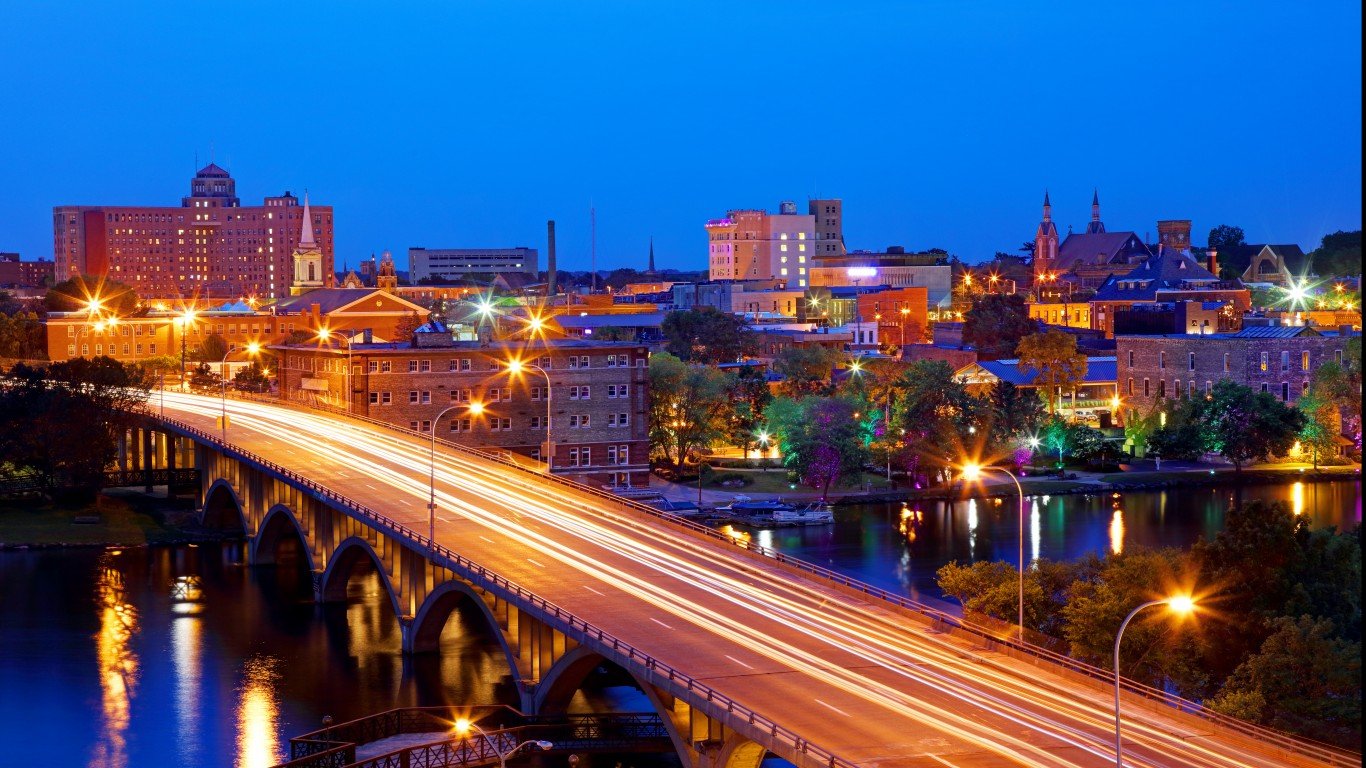
24. Erie, PA
Source: DenisTangneyJr / iStock via Getty Images
- Median household income, 2022: $26,626 (Black); $63,010 (White)
- Homeownership rate, 2022: 33.6% (Black); 71.8% (White)
- Unemployment rate, 2022: 9.3% (Black); 5.2% (White)
- Black population, 2022: 18,087 (6.7% of total)
23. Champaign-Urbana, IL
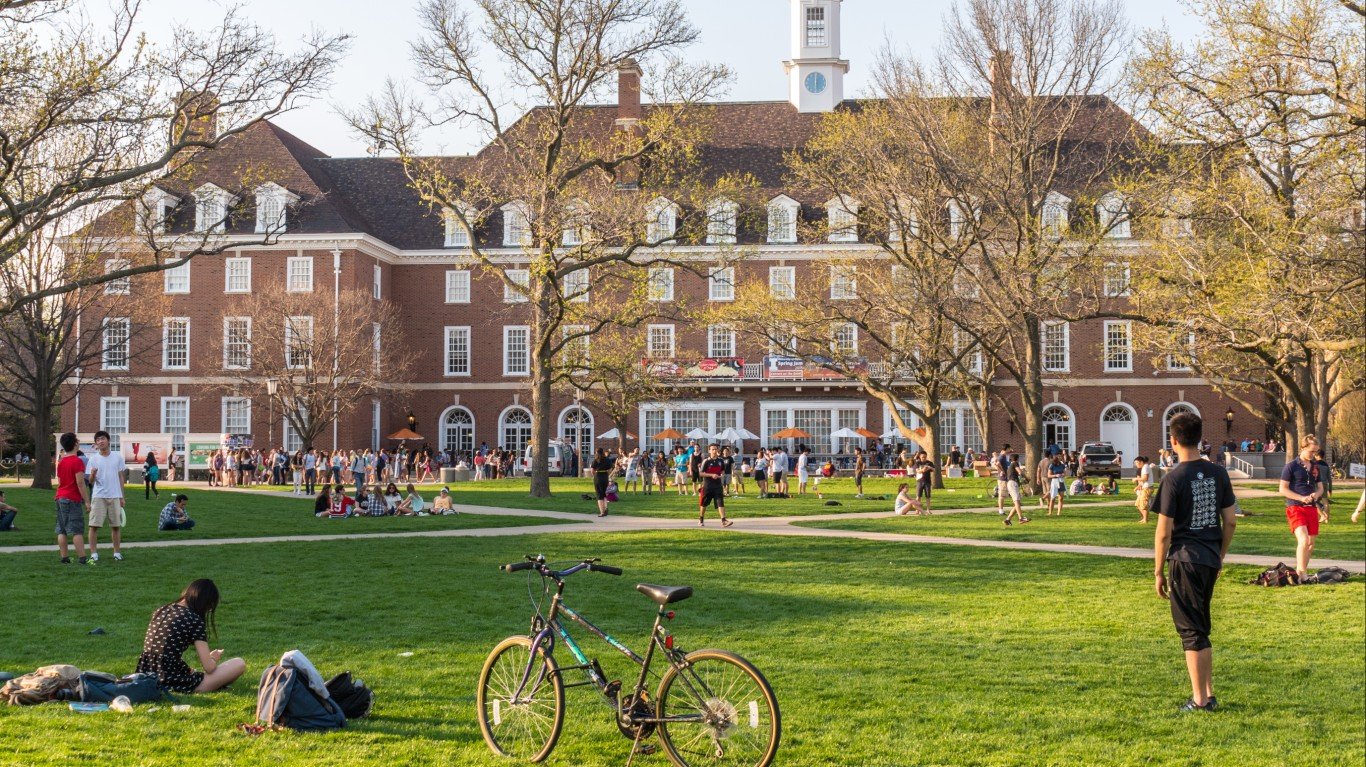
Source: leightrail / iStock Editorial via Getty Images
- Median household income, 2022: $37,241 (Black); $73,120 (White)
- Homeownership rate, 2022: 26.6% (Black); 65.4% (White)
- Unemployment rate, 2022: 12.5% (Black); 4.0% (White)
- Black population, 2022: 27,057 (12.1% of total)
22. Bridgeport-Stamford-Norwalk, CT
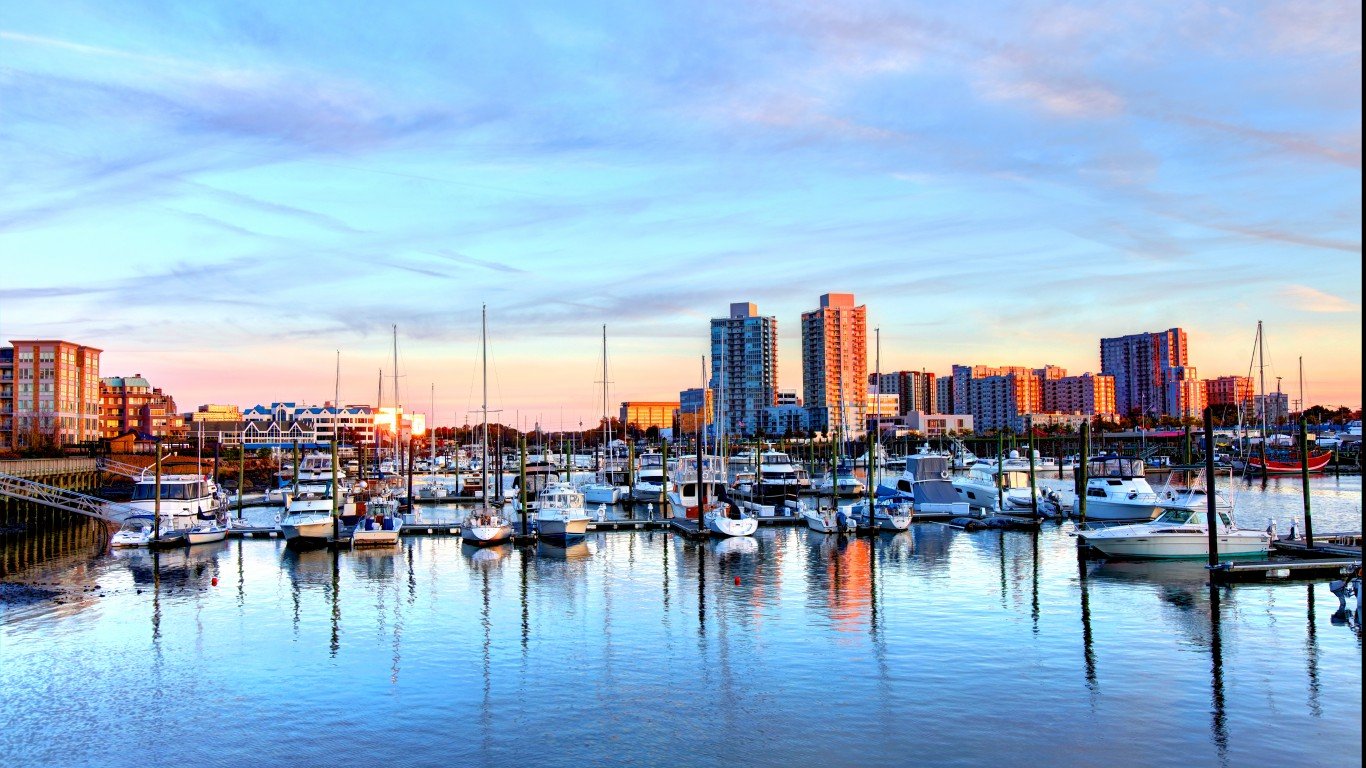
Source: DenisTangneyJr / iStock via Getty Images
- Median household income, 2022: $70,129 (Black); $122,437 (White)
- Homeownership rate, 2022: 40.1% (Black); 74.7% (White)
- Unemployment rate, 2022: 8.5% (Black); 5.7% (White)
- Black population, 2022: 95,447 (10.0% of total)
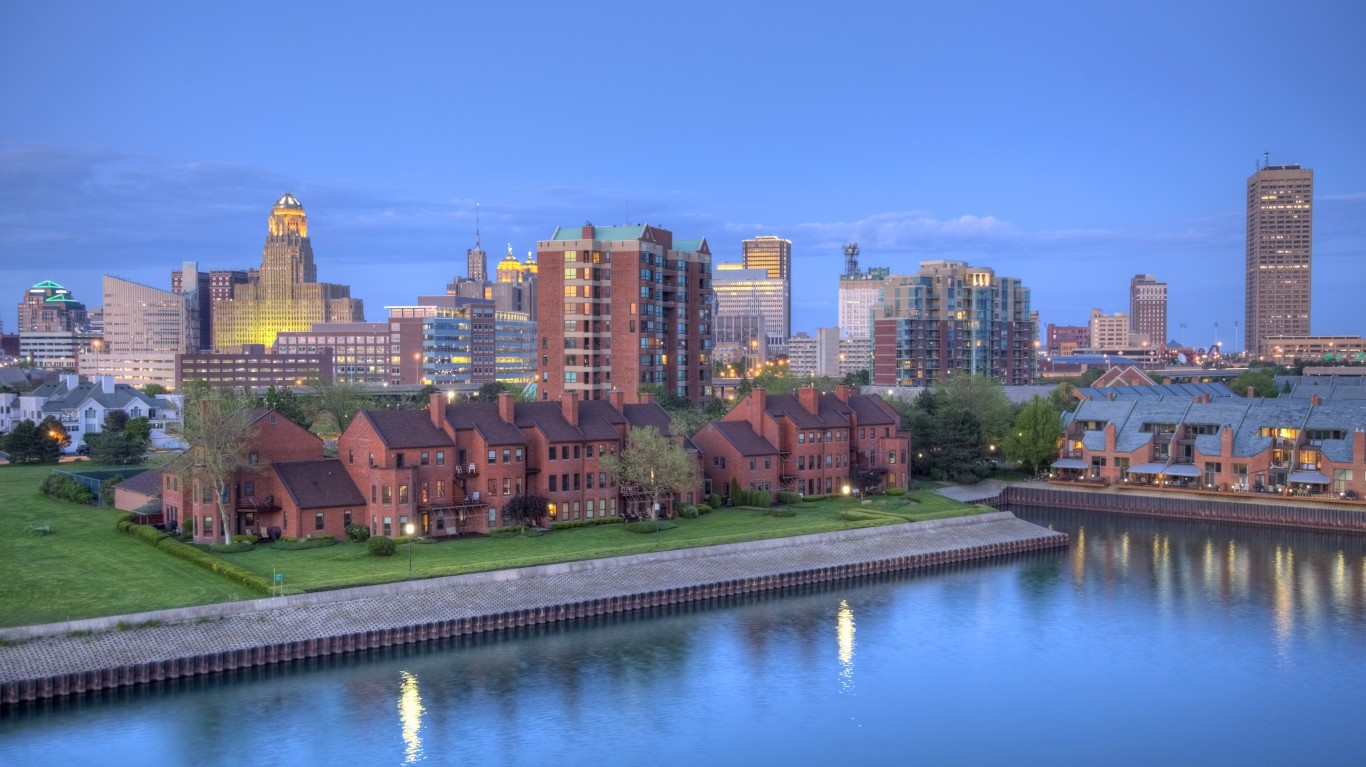
21. Buffalo-Cheektowaga, NY
Source: DenisTangneyJr / E+ via Getty Images
- Median household income, 2022: $39,461 (Black); $74,245 (White)
- Homeownership rate, 2022: 37.6% (Black); 72.2% (White)
- Unemployment rate, 2022: 9.8% (Black); 4.5% (White)
- Black population, 2022: 132,849 (11.4% of total)
20. Rockford, IL
Source: DenisTangneyJr / iStock via Getty Images
- Median household income, 2022: $34,676 (Black); $69,224 (White)
- Homeownership rate, 2022: 28.0% (Black); 74.4% (White)
- Unemployment rate, 2022: 16.5% (Black); 6.6% (White)
- Black population, 2022: 38,033 (11.3% of total)
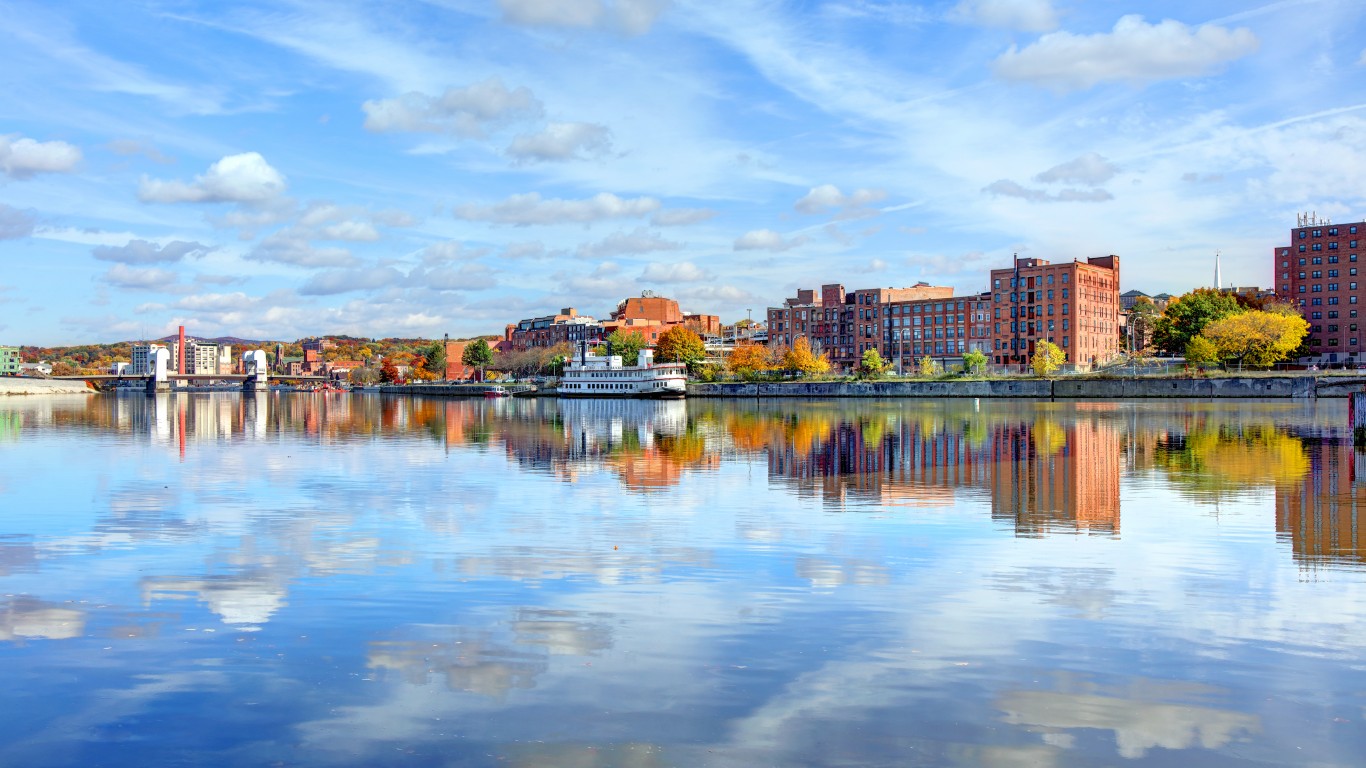
19. Albany-Schenectady-Troy, NY
Source: DenisTangneyJr / iStock via Getty Images
- Median household income, 2022: $45,681 (Black); $88,060 (White)
- Homeownership rate, 2022: 25.1% (Black); 68.9% (White)
- Unemployment rate, 2022: 10.8% (Black); 4.2% (White)
- Black population, 2022: 65,586 (7.3% of total)
18. Omaha-Council Bluffs, NE-IA

- Median household income, 2022: $43,856 (Black); $84,385 (White)
- Homeownership rate, 2022: 31.9% (Black); 70.6% (White)
- Unemployment rate, 2022: 8.8% (Black); 3.0% (White)
- Black population, 2022: 70,849 (7.3% of total)
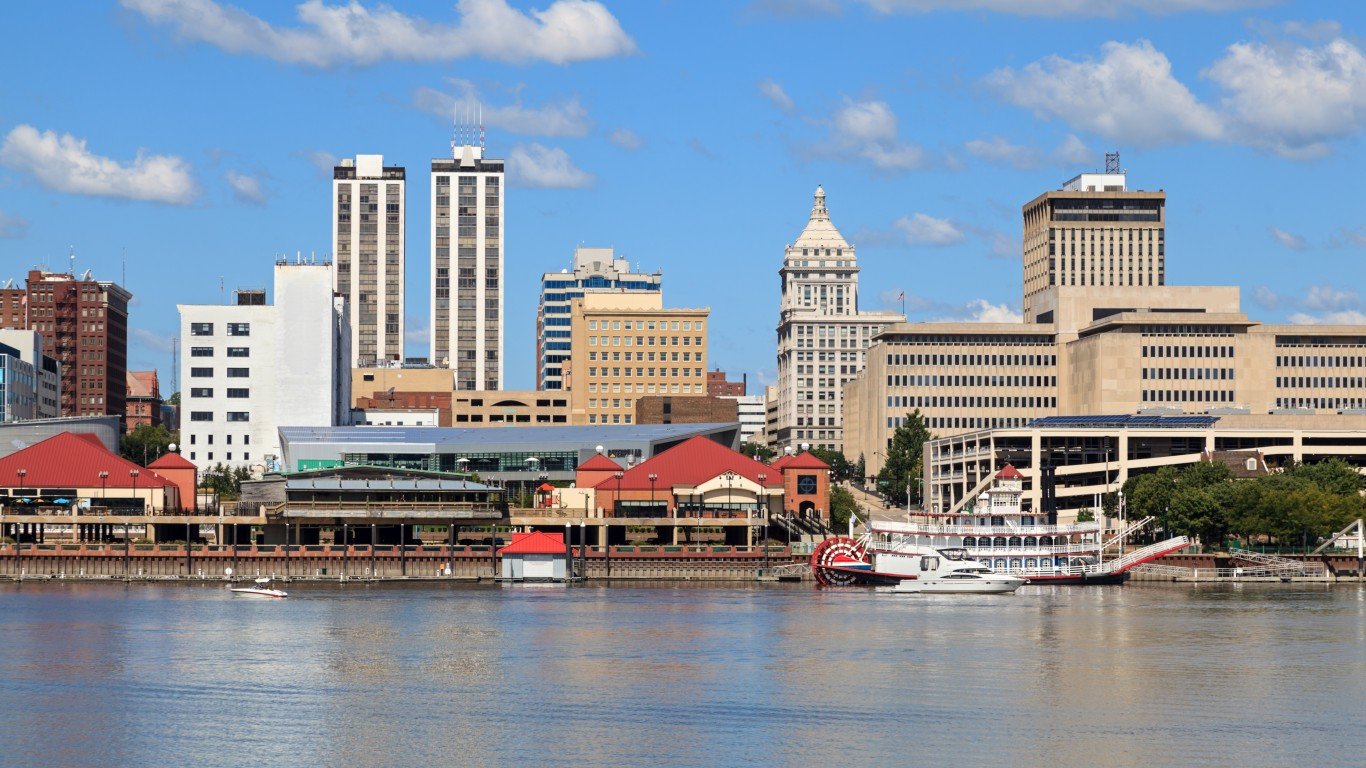
17. Peoria, IL
Source: ghornephoto / iStock via Getty Images
- Median household income, 2022: $34,891 (Black); $70,355 (White)
- Homeownership rate, 2022: 33.4% (Black); 76.5% (White)
- Unemployment rate, 2022: 15.6% (Black); 4.5% (White)
- Black population, 2022: 34,545 (8.6% of total)
16. Minneapolis-St. Paul-Bloomington, MN-WI
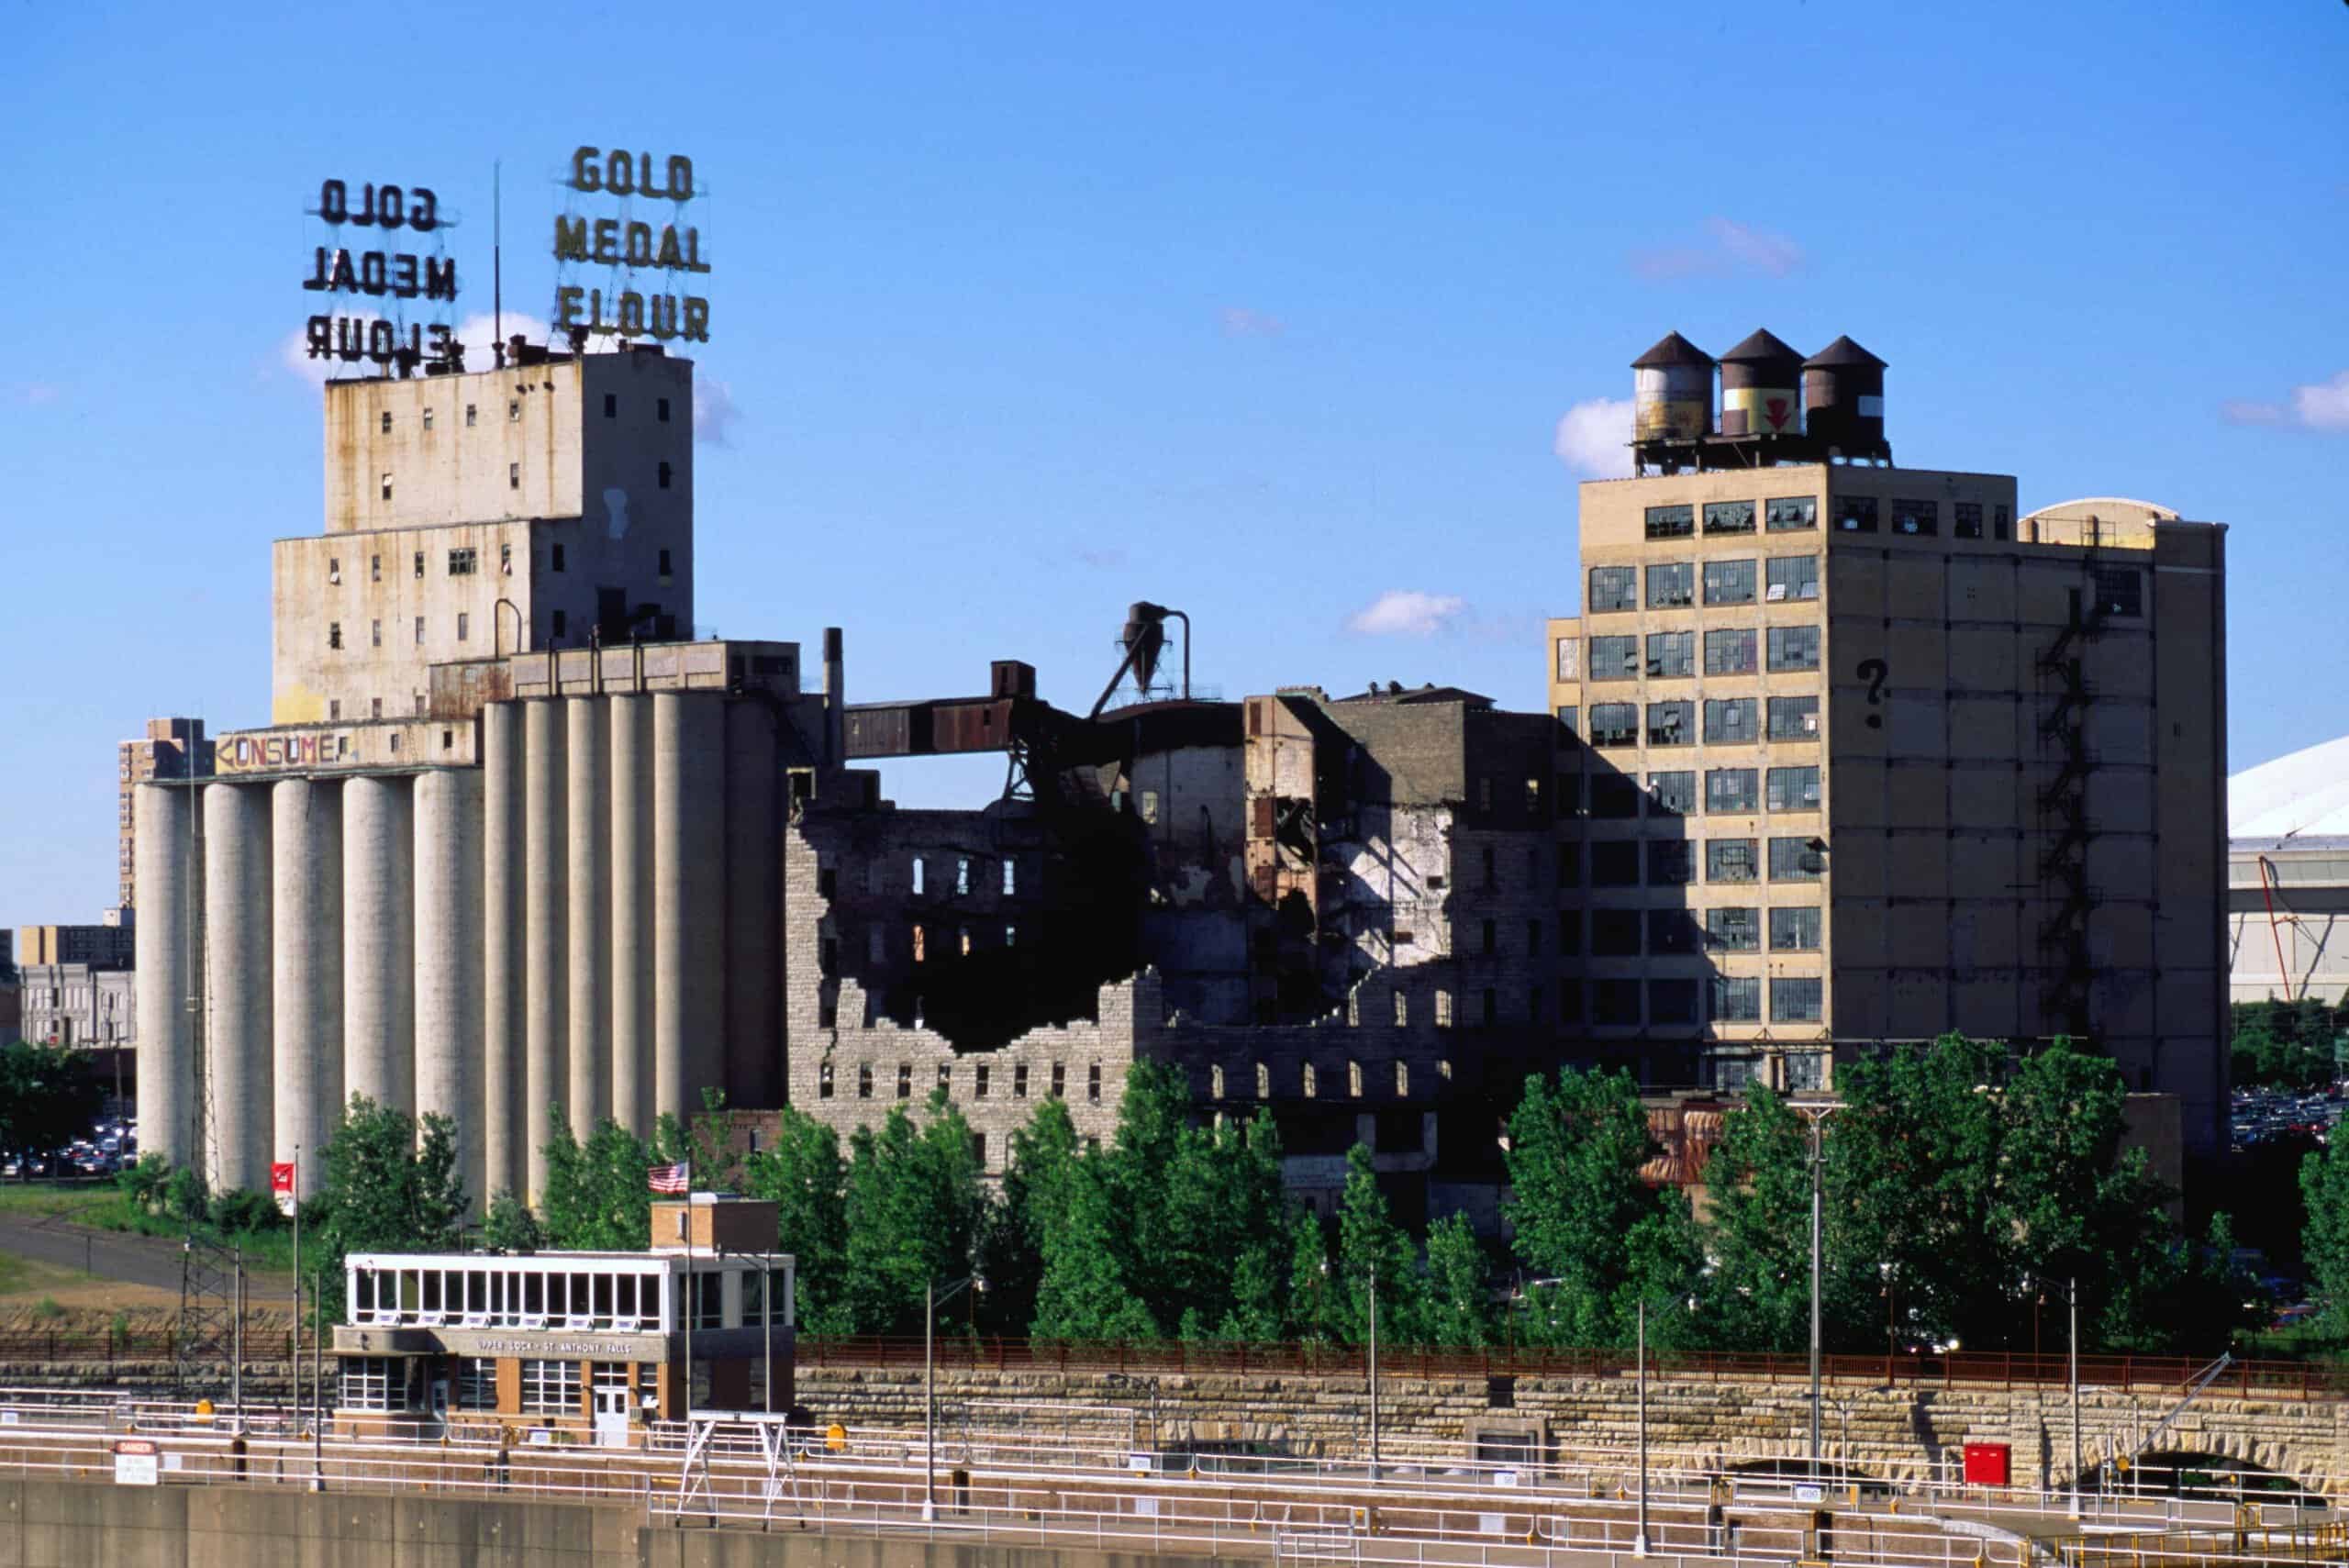
Source: John Elk / The Image Bank via Getty Images
- Median household income, 2022: $51,321 (Black); $100,582 (White)
- Homeownership rate, 2022: 29.9% (Black); 76.4% (White)
- Unemployment rate, 2022: 8.2% (Black); 3.3% (White)
- Black population, 2022: 320,181 (8.7% of total)
15. Niles, MI

- Median household income, 2022: $29,073 (Black); $67,707 (White)
- Homeownership rate, 2022: 38.3% (Black); 79.2% (White)
- Unemployment rate, 2022: 15.4% (Black); 5.0% (White)
- Black population, 2022: 21,433 (13.9% of total)
14. Des Moines-West Des Moines, IA
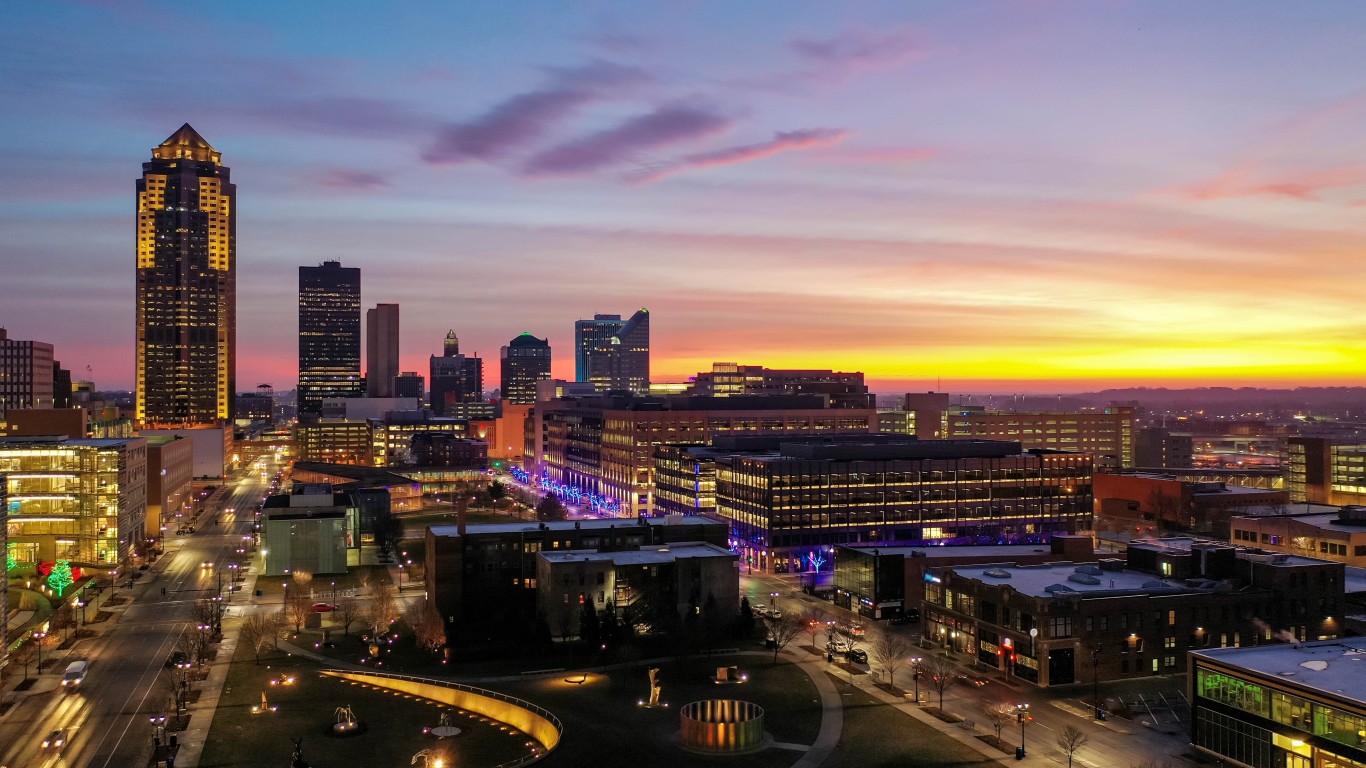
Source: dangarneau / iStock via Getty Images
- Median household income, 2022: $45,529 (Black); $83,994 (White)
- Homeownership rate, 2022: 30.2% (Black); 73.0% (White)
- Unemployment rate, 2022: 8.9% (Black); 3.6% (White)
- Black population, 2022: 38,739 (5.4% of total)
13. Atlantic City-Hammonton, NJ
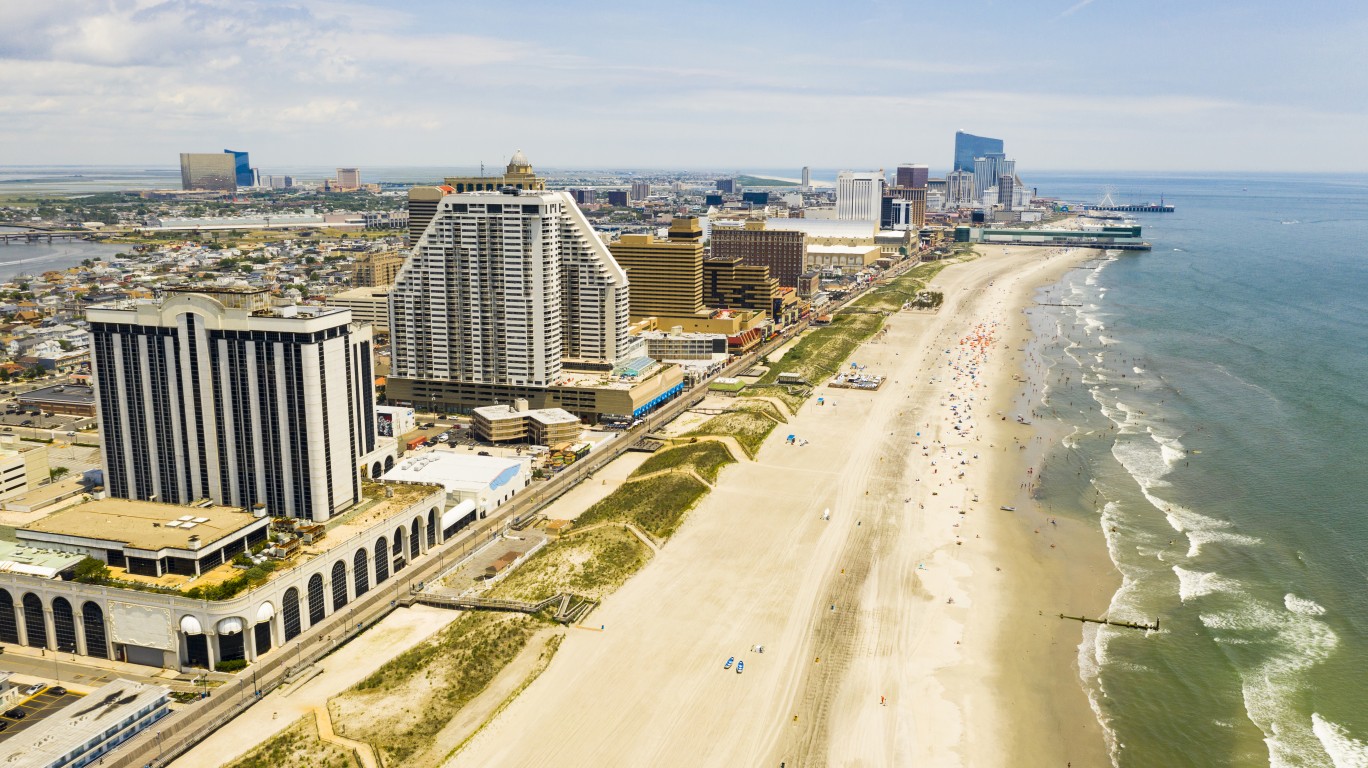
Source: ChrisBoswell / iStock via Getty Images
- Median household income, 2022: $49,658 (Black); $83,877 (White)
- Homeownership rate, 2022: 42.1% (Black); 76.8% (White)
- Unemployment rate, 2022: 11.3% (Black); 6.9% (White)
- Black population, 2022: 35,485 (12.9% of total)
12. Rochester, NY
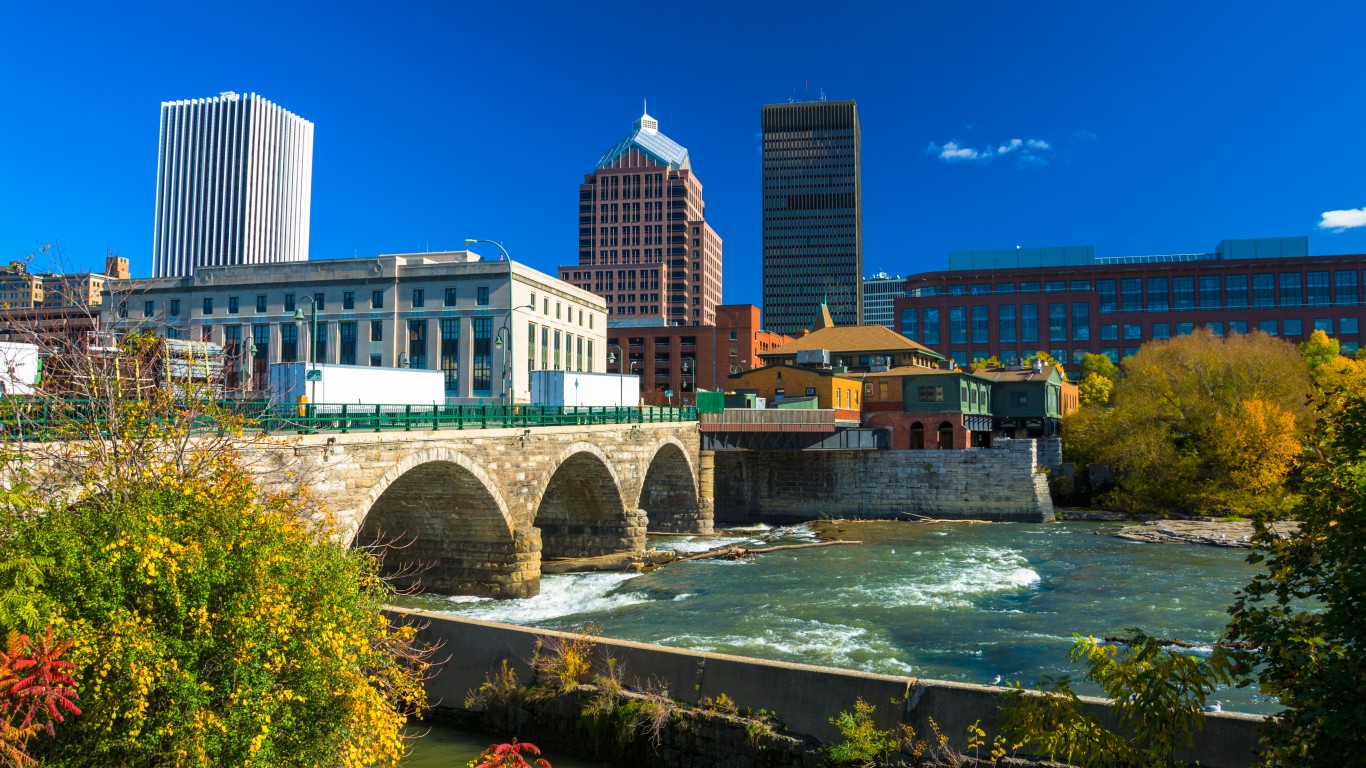
Source: Davel5957 / iStock via Getty Images
- Median household income, 2022: $40,670 (Black); $77,124 (White)
- Homeownership rate, 2022: 35.0% (Black); 73.3% (White)
- Unemployment rate, 2022: 10.7% (Black); 4.1% (White)
- Black population, 2022: 114,029 (10.5% of total)
11. Chicago-Naperville-Elgin, IL-IN-WI
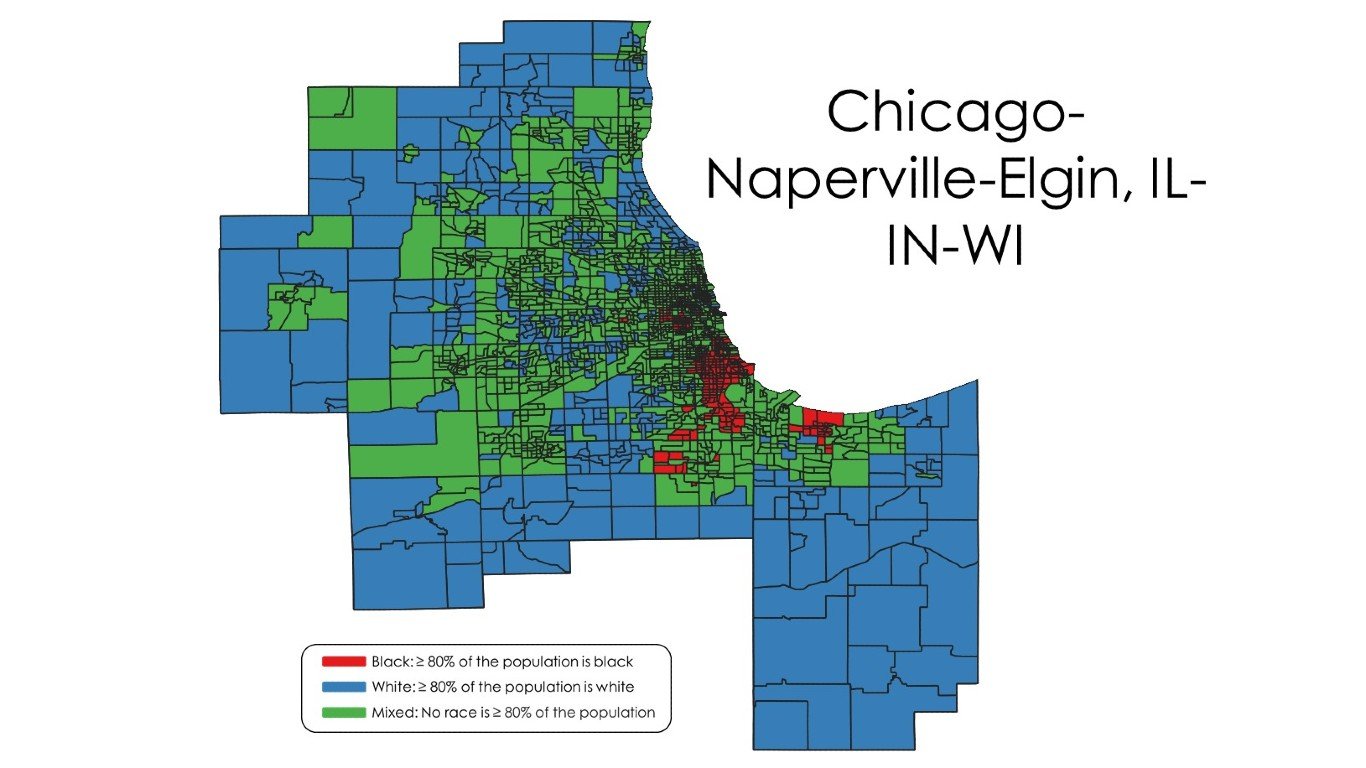
Source: 24/7 Wall St.
- Median household income, 2022: $49,194 (Black); $97,568 (White)
- Homeownership rate, 2022: 41.6% (Black); 73.5% (White)
- Unemployment rate, 2022: 13.7% (Black); 4.8% (White)
- Black population, 2022: 1,522,030 (15.9% of total)
10. Syracuse, NY
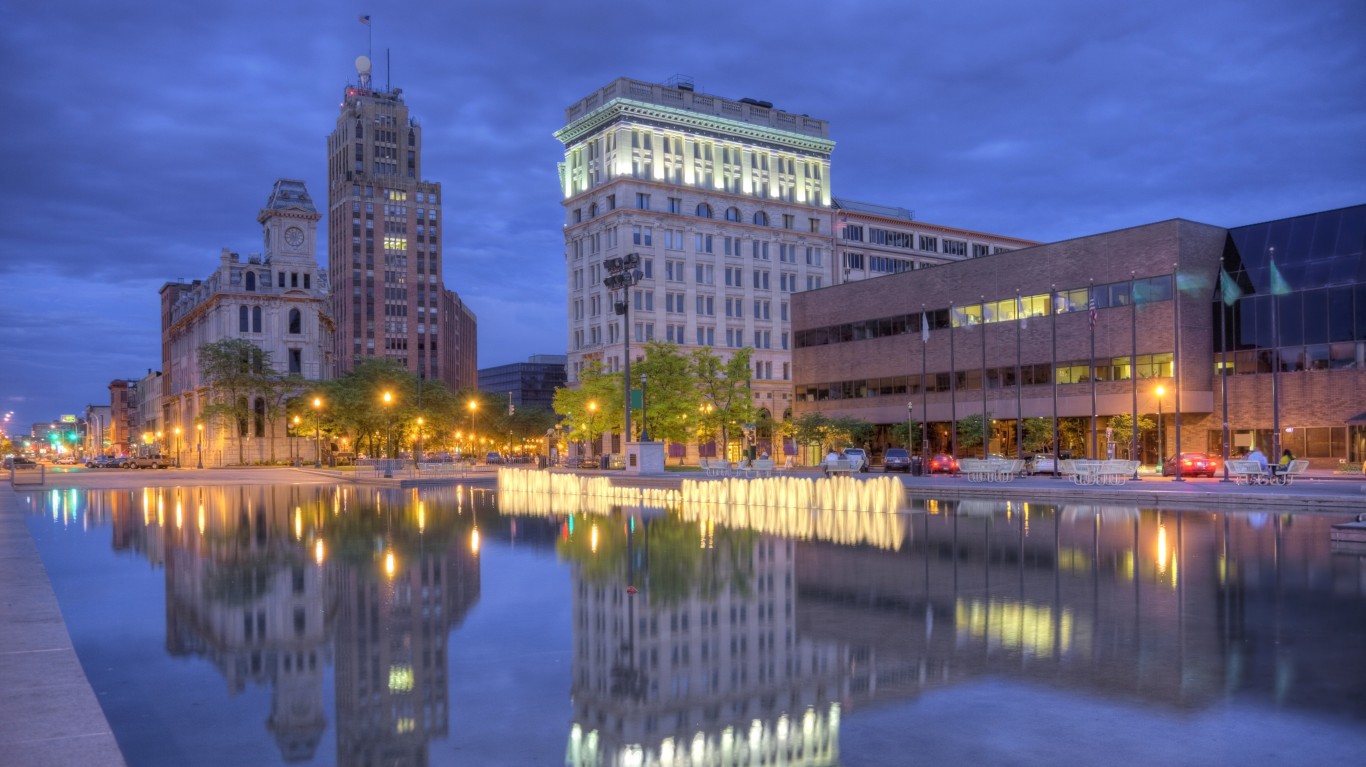
Source: DenisTangneyJr / E+ via Getty Images
- Median household income, 2022: $37,127 (Black); $74,176 (White)
- Homeownership rate, 2022: 30.2% (Black); 72.6% (White)
- Unemployment rate, 2022: 12.5% (Black); 5.3% (White)
- Black population, 2022: 51,468 (7.8% of total)
9. Davenport-Moline-Rock Island, IA-IL
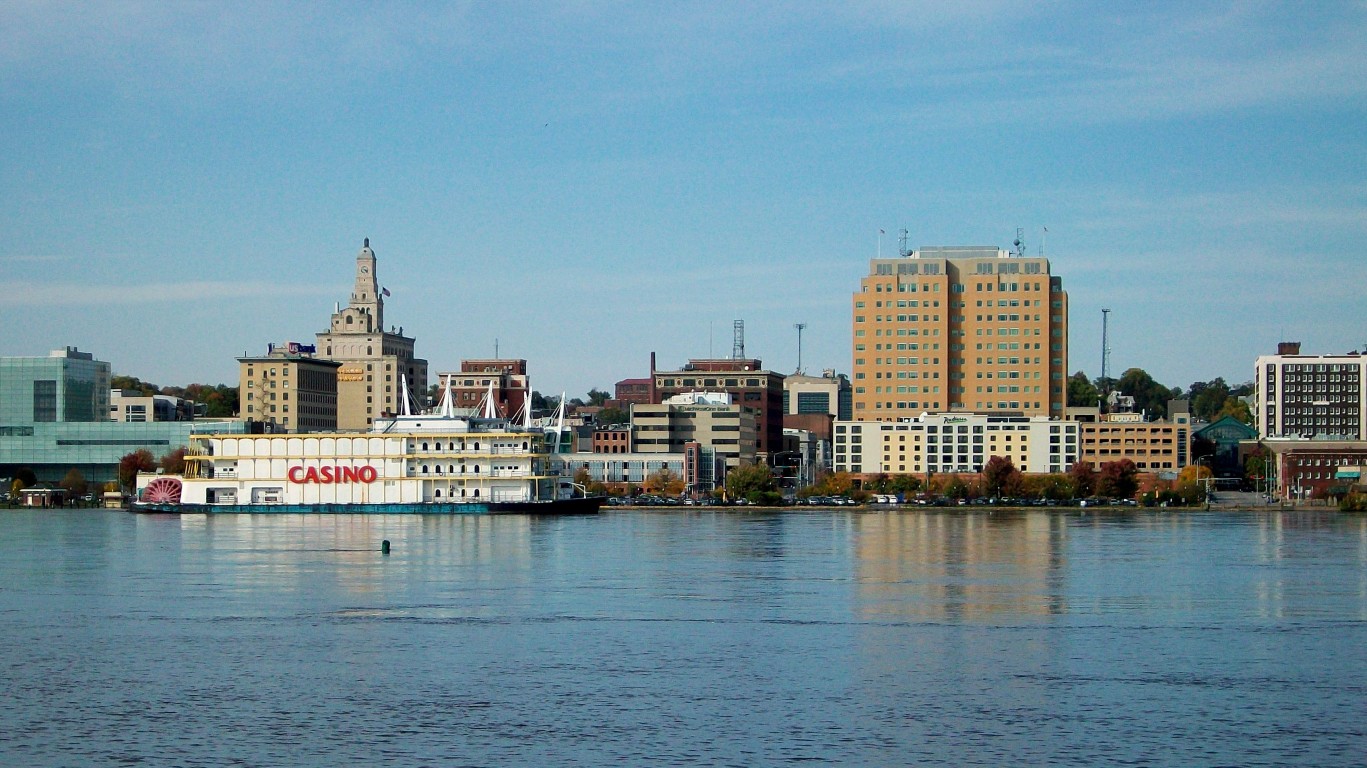
Source: Ctjf83 / Public Domain / Wikimedia Commons
- Median household income, 2022: $40,288 (Black); $71,697 (White)
- Homeownership rate, 2022: 30.9% (Black); 74.6% (White)
- Unemployment rate, 2022: 16.2% (Black); 4.0% (White)
- Black population, 2022: 27,796 (7.3% of total)
8. Waterloo-Cedar Falls, IA

Source: 129679309@N05 / Public Domain / Flickr
- Median household income, 2022: $34,268 (Black); $70,413 (White)
- Homeownership rate, 2022: 31.7% (Black); 73.4% (White)
- Unemployment rate, 2022: 18.1% (Black); 3.4% (White)
- Black population, 2022: 12,996 (7.7% of total)
7. San Francisco-Oakland-Berkeley, CA
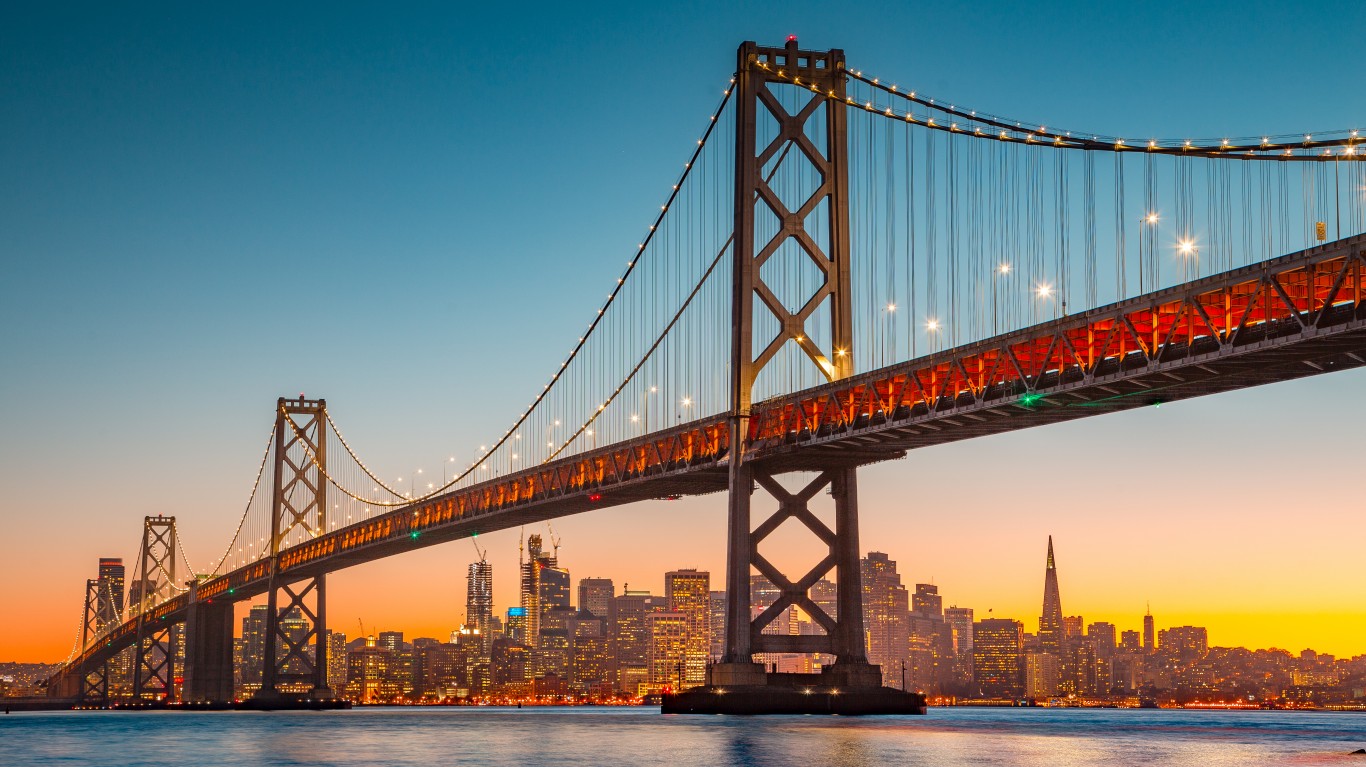
Source: bluejayphoto / iStock via Getty Images
- Median household income, 2022: $70,119 (Black); $145,999 (White)
- Homeownership rate, 2022: 35.1% (Black); 60.0% (White)
- Unemployment rate, 2022: 9.2% (Black); 4.8% (White)
- Black population, 2022: 326,676 (7.0% of total)
6. Trenton-Princeton, NJ
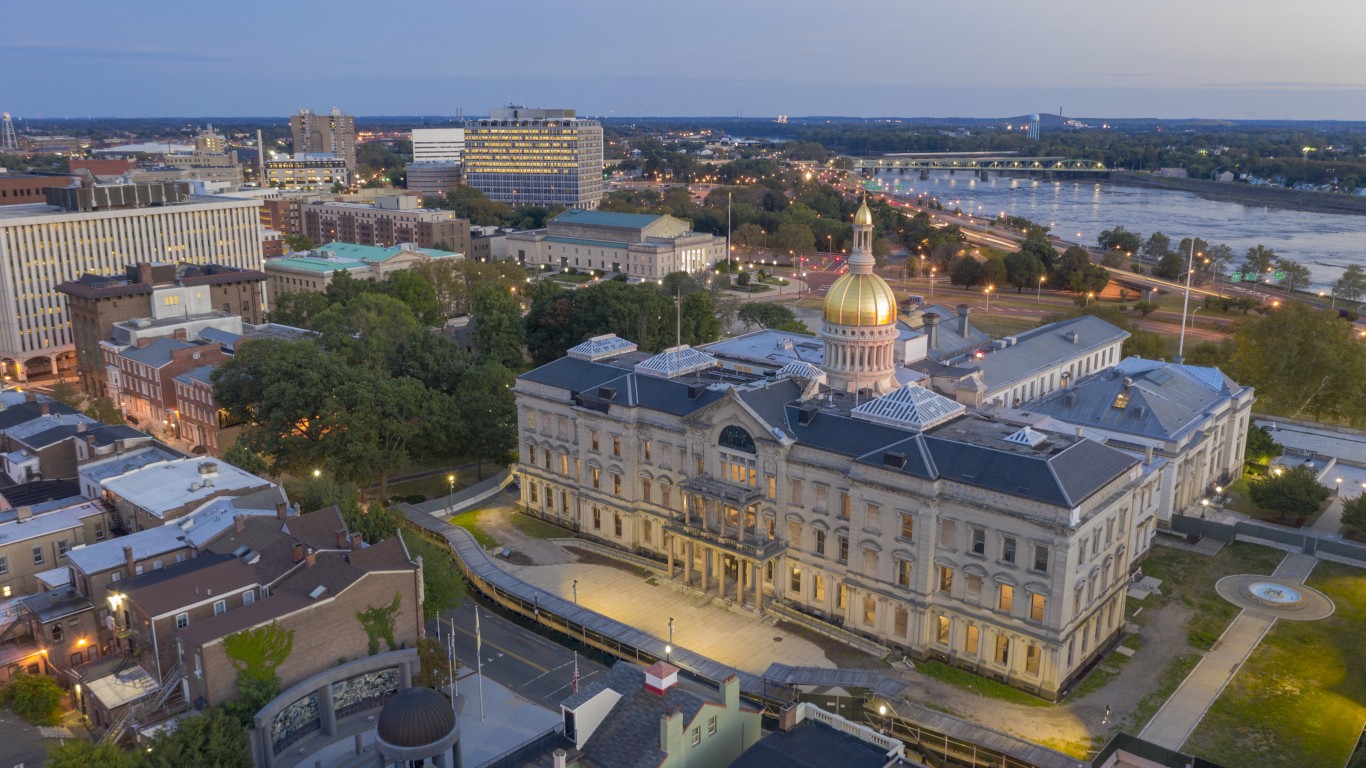
Source: ChrisBoswell / iStock via Getty Images
- Median household income, 2022: $56,828 (Black); $103,481 (White)
- Homeownership rate, 2022: 40.1% (Black); 71.7% (White)
- Unemployment rate, 2022: 10.0% (Black); 5.6% (White)
- Black population, 2022: 73,261 (19.1% of total)
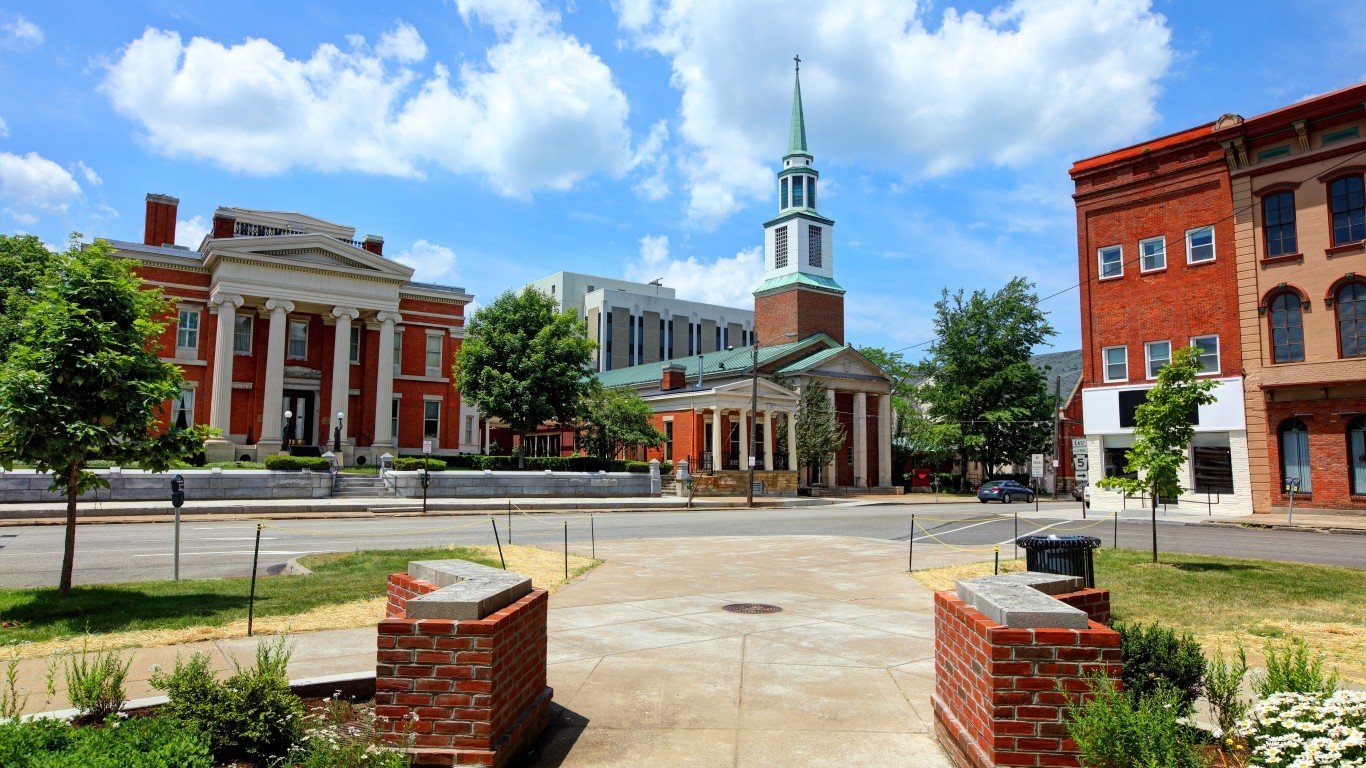
5. Springfield, IL
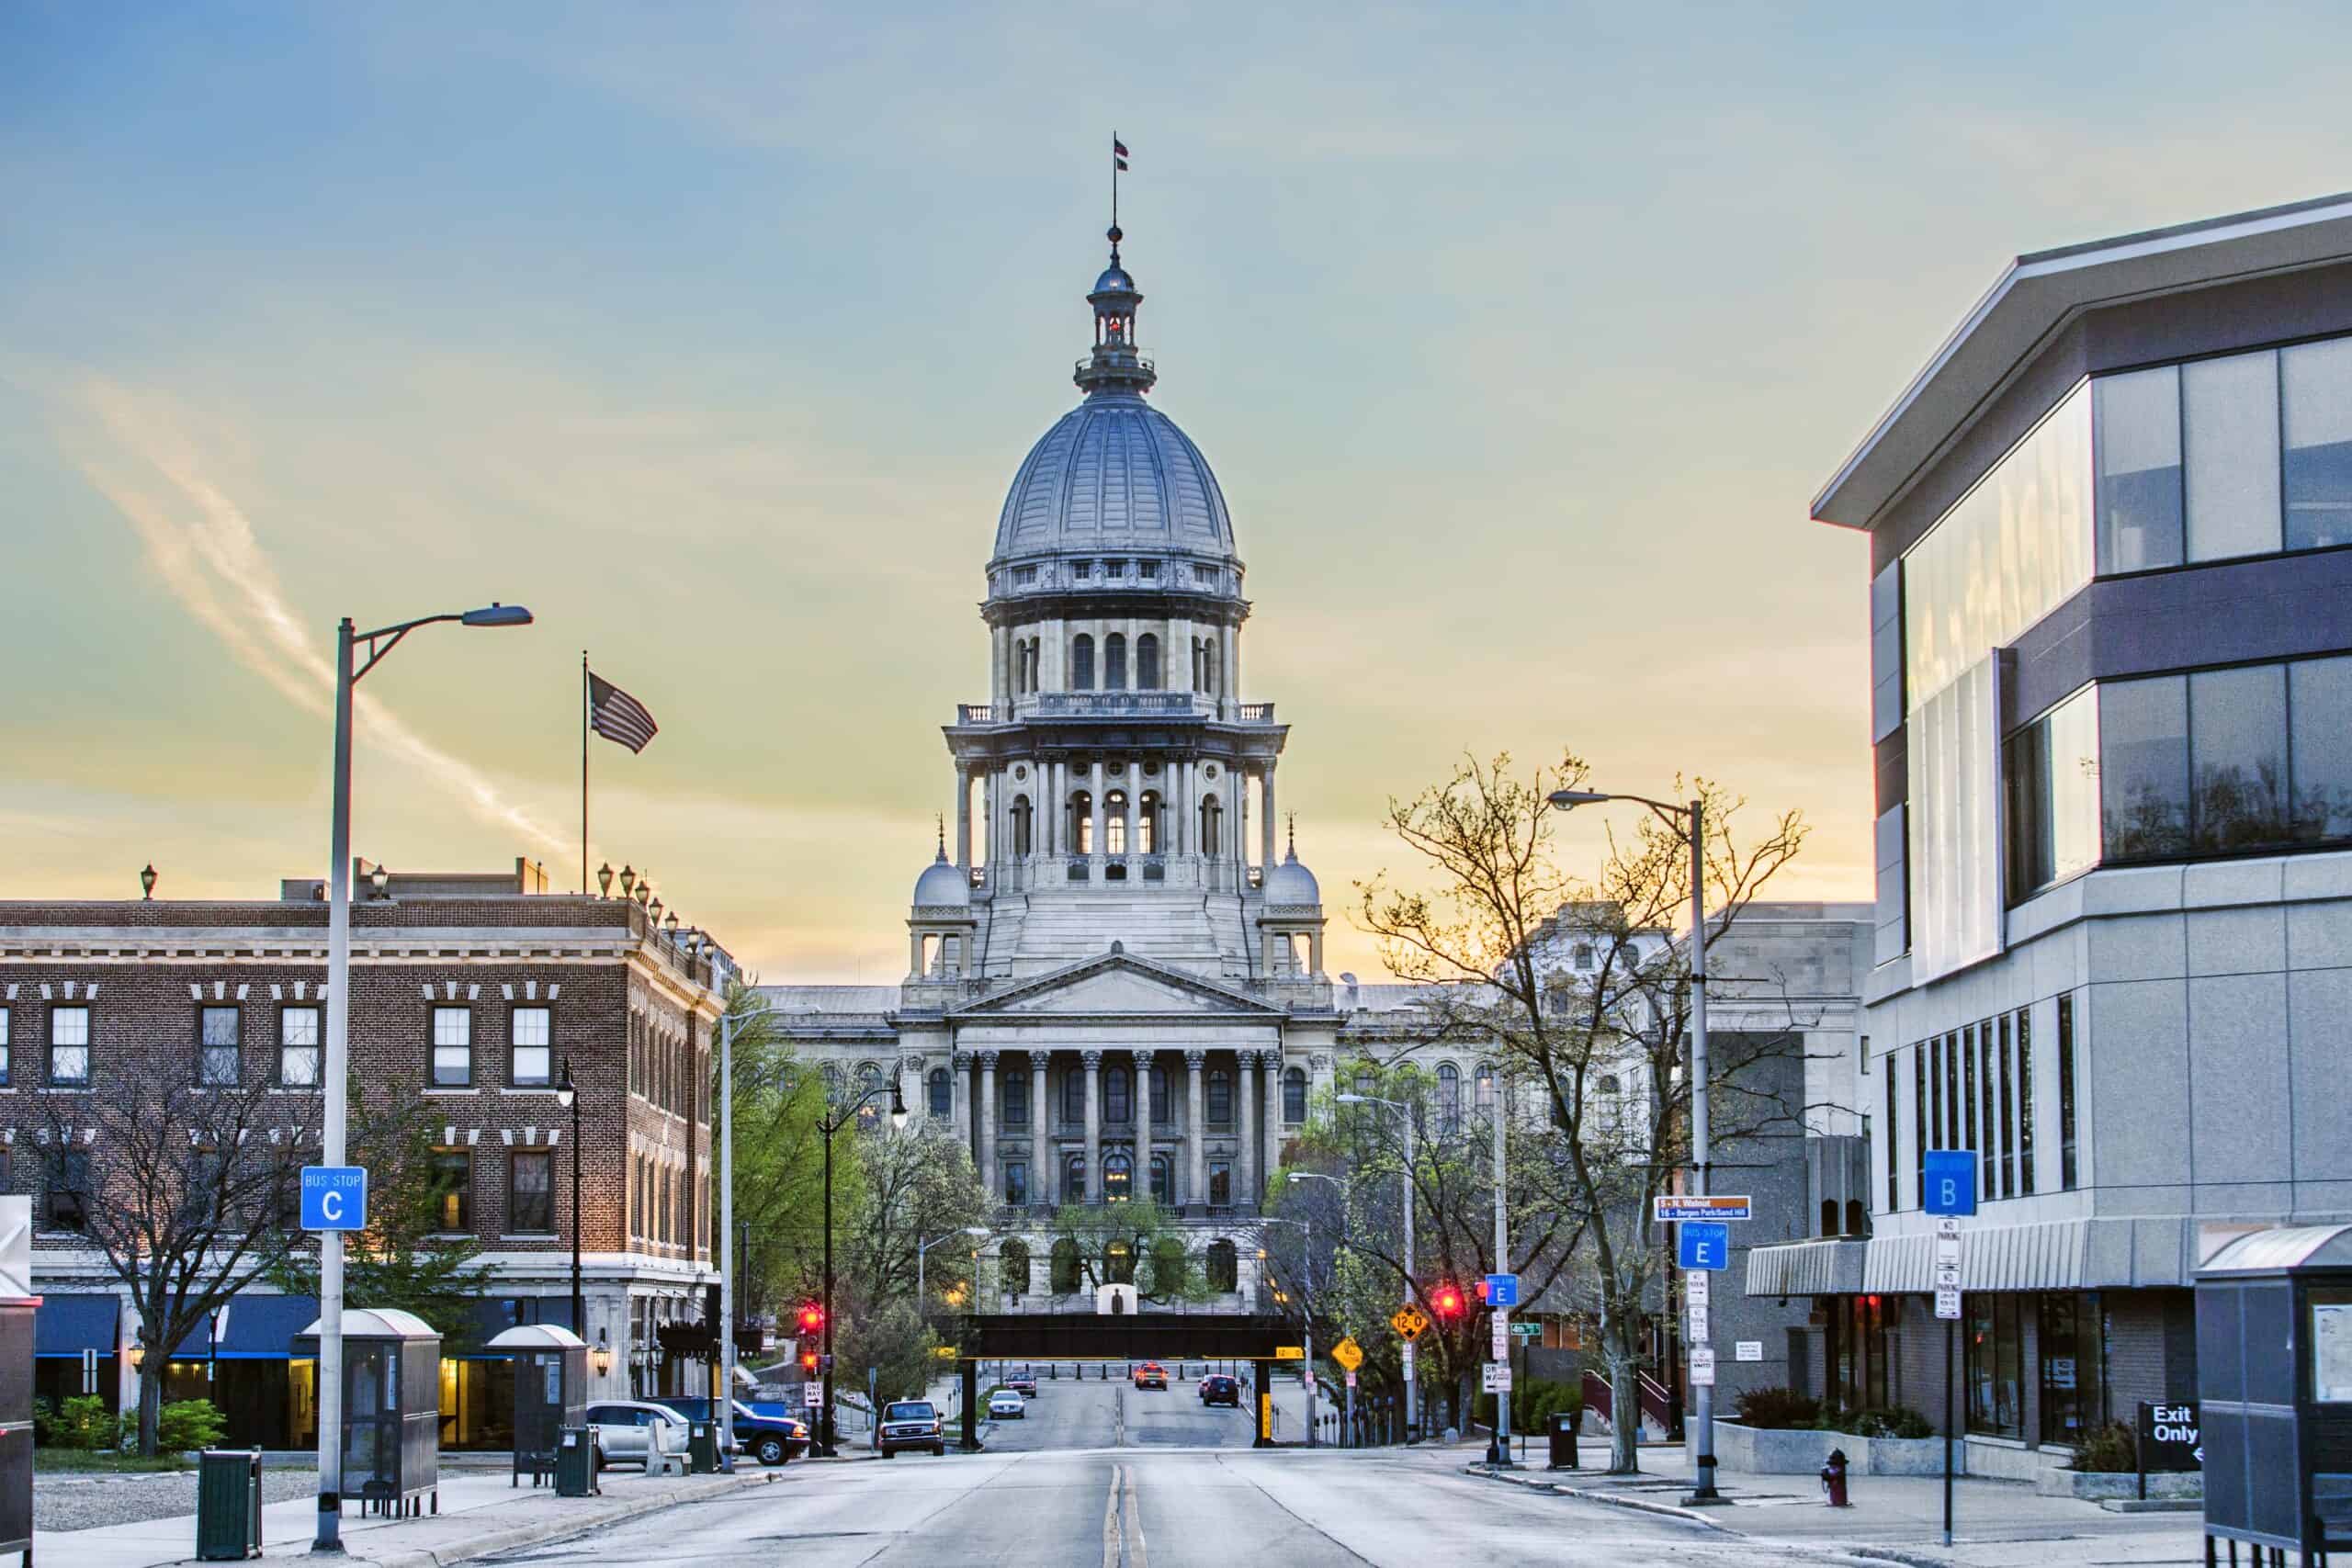
Source: fotoguy22 / iStock via Getty Images
- Median household income, 2022: $29,482 (Black); $78,904 (White)
- Homeownership rate, 2022: 27.8% (Black); 77.3% (White)
- Unemployment rate, 2022: 15.8% (Black); 3.9% (White)
- Black population, 2022: 24,804 (11.9% of total)
4. Racine, WI
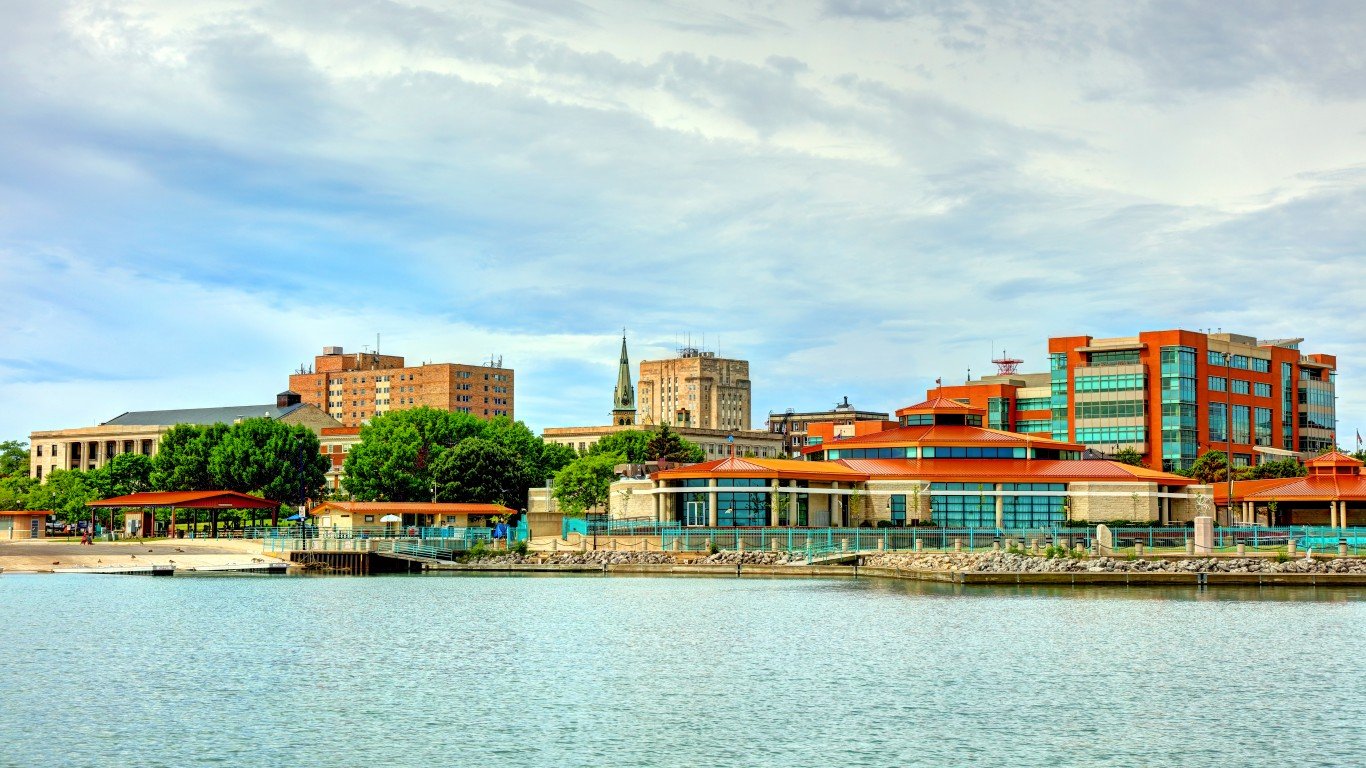
Source: DenisTangneyJr / iStock via Getty Images
- Median household income, 2022: $41,458 (Black); $79,477 (White)
- Homeownership rate, 2022: 29.6% (Black); 76.3% (White)
- Unemployment rate, 2022: 7.6% (Black); 3.4% (White)
- Black population, 2022: 21,090 (10.7% of total)
3. Rochester, MN
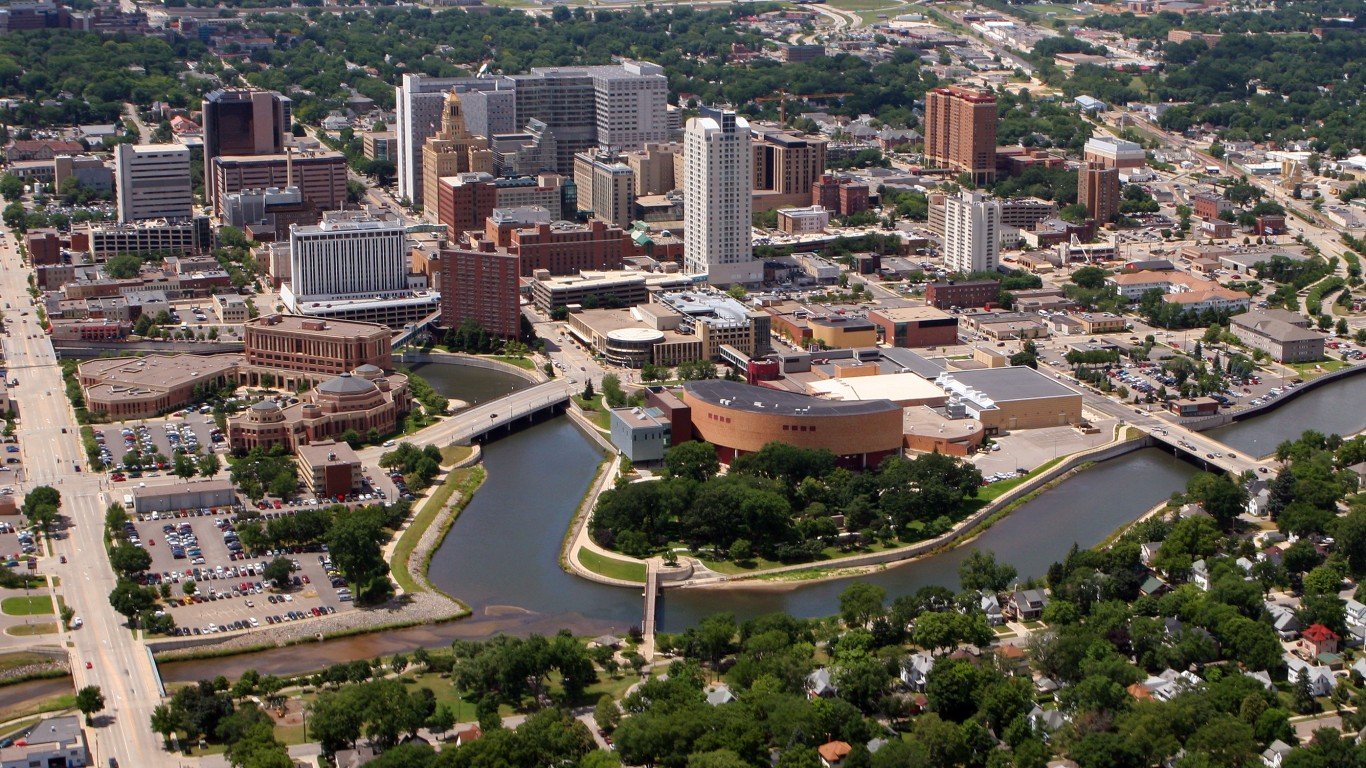
Source: BanksPhotos / E+ via Getty Images
- Median household income, 2022: $38,617 (Black); $90,820 (White)
- Homeownership rate, 2022: 20.8% (Black); 78.1% (White)
- Unemployment rate, 2022: 9.2% (Black); 2.8% (White)
- Black population, 2022: 11,618 (5.1% of total)
2. St. Cloud, MN

Source: Public Domain / Wikimedia Commons
- Median household income, 2022: $44,597 (Black); $76,223 (White)
- Homeownership rate, 2022: 11.5% (Black); 72.5% (White)
- Unemployment rate, 2022: 16.3% (Black); 3.6% (White)
- Black population, 2022: 15,003 (7.5% of total)
1. Milwaukee-Waukesha, WI
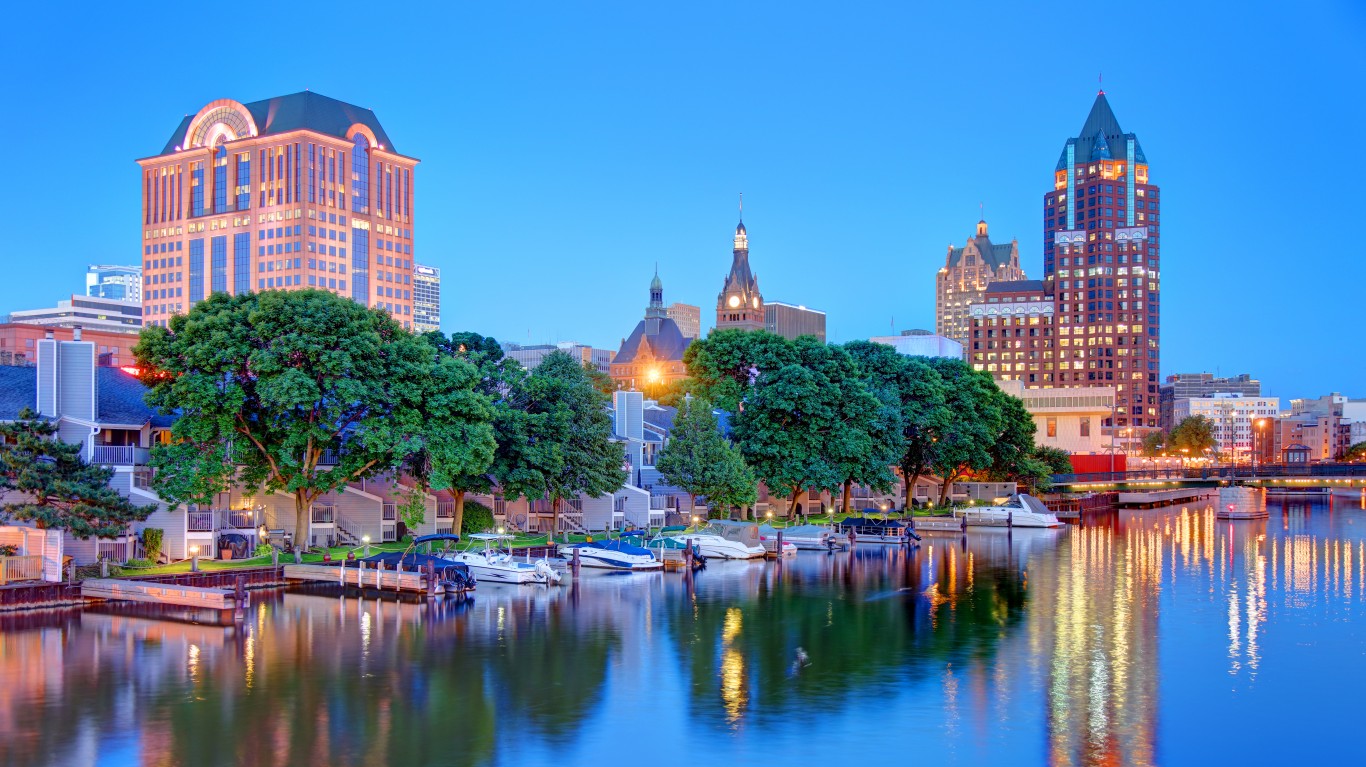
Source: DenisTangneyJr / E+ via Getty Images
- Median household income, 2022: $37,182 (Black); $84,267 (White)
- Homeownership rate, 2022: 27.5% (Black); 69.0% (White)
- Unemployment rate, 2022: 8.5% (Black); 3.0% (White)
- Black population, 2022: 248,989 (15.9% of total)
Thank you for reading! Have some feedback for us?
Contact the 24/7 Wall St. editorial team.
Editors' Picks