
Racial disparity and inequality in the United States today is rooted in long-standing behaviors, beliefs, and policies. Formal and informal inequitable policies, such as Jim Crow laws, enforced segregation and severely limited opportunities for Black Americans and other groups. Though the Civil Rights Act of 1964 and Voting Rights Act of 1965 aimed to address some of these issues, it remains difficult to this day to undo centuries of rooted racism and practices and the resulting enduring racial disparities.
Often, the discussion is centered on economic inequality, but disparity in other factors contributes to gaps in well-being as well. In addition to income and poverty inequality, there are also disparities in education, employment, housing, health, rates of incarceration, and more.
To find out which states are the worst for Black Americans today, 24/7 Wall St. created an index consisting that assess race-based gaps in eight measures: median household income, poverty rate, adult high school and bachelor’s degree attainment rates, homeownership rate, unemployment rate, incarceration rate by race, and age-adjusted mortality rate by race. The index does not rank conditions of Black Americans alone by state, but rather the gaps compared to white state residents.
Nationwide, Black households earn $50,901 annually, or just 63.6% of the $80,042 income white households earn a year. Similarly, Black Americans are more than twice as likely to live below the poverty line (21.5% vs. 10.1%) or be unemployed (9.2% vs. 4.6%) as white Americans and are nearly five times as likely to be incarcerated (1,020.4 per 100,000 Black Americans vs 217.7 per 100,000 white Americans).
In 18 states, Black households earn even less than 63.6% of white households, including in all 10 worst states for Black Americans. In Wisconsin, the Black median household income is just 51.1% of the white median household income — the largest income disparity of any state. And while the poverty rate for white Americans is lower than 10% in 23 states, this is true for Black Americans in only one state, Hawaii.
Many of the lowest ranking states on the list are in the Midwest, where millions of Black Americans moved during the Great Migration of the early 20th century. But redlining — a discriminatory practice of designating neighborhoods as high risk because of race, thus denying residents loans — created segregated neighborhoods, enforcing racial disparity. To this day, the gap in homeownership rates in the worst states for Black Americans is significantly higher than the 28 points gap nationwide (71.7% white homeownership rate vs 43.1% for Blacks). In Minnesota, for example, the gap is 48.4 points. (Also see: America’s Most Diverse Neighborhoods.)
Full Methodology
To determine the worst states for Black Americans, 24/7 Wall St. created an index consisting of eight measures to assess race-based gaps in socioeconomic outcomes. Six of the measures – median household income, poverty, adult high school and bachelor’s degree attainment, homeownership, and unemployment rates – are based on five-year estimates from the U.S. Census Bureau’s 2022 American Community. The seventh measure, prisoners under the jurisdiction of state or federal correctional authorities by race per 100,000 residents, is based on Bureau of Justice Statistics data for 2021. The eighth measure, age-adjusted mortality rate by race, is based on data from 2018 to 2020 from the Centers for Disease Control and Prevention.
For each measure, we constructed an index from the gaps between Black and white Americans. The index was standardized using min-max normalization. Data on population by race came from the ACS.
Why This Matters

Source: Hyejin Kang / Shutterstock.com
50. Hawaii

- Median household income: $80,207 (Black); $93,896 (white)
- Homeownership rate: 28.2% (Black); 57.7% (white)
- Unemployment rate: 12.2% (Black); 5.6% (white)
- Black population: 26,664 (1.8% of total)
49. New Mexico

- Median household income: $48,987 (Black); $63,910 (white)
- Homeownership rate: 37.8% (Black); 70.3% (white)
- Unemployment rate: 9.0% (Black); 6.0% (white)
- Black population: 37,996 (1.8% of total)
48. Texas

Source: Jonathan Ross / iStock via Getty Images
- Median household income: $55,459 (Black); $80,134 (white)
- Homeownership rate: 41.3% (Black); 67.7% (white)
- Unemployment rate: 8.4% (Black); 4.6% (white)
- Black population: 3,449,557 (11.8% of total)
47. Alaska
Source: Jacob Boomsma / iStock via Getty Images
- Median household income: $71,857 (Black); $94,315 (white)
- Homeownership rate: 40.9% (Black); 70.7% (white)
- Unemployment rate: 4.6% (Black); 5.1% (white)
- Black population: 22,400 (3.0% of total)
46. Arizona

- Median household income: $58,184 (Black); $75,939 (white)
- Homeownership rate: 38.4% (Black); 70.3% (white)
- Unemployment rate: 8.3% (Black); 5.0% (white)
- Black population: 307,726 (4.3% of total)
45. West Virginia

- Median household income: $38,004 (Black); $55,826 (white)
- Homeownership rate: 44.5% (Black); 75.8% (white)
- Unemployment rate: 9.8% (Black); 6.2% (white)
- Black population: 60,237 (3.4% of total)
44. Kentucky

- Median household income: $44,196 (Black); $62,242 (white)
- Homeownership rate: 37.9% (Black); 72.1% (white)
- Unemployment rate: 8.6% (Black); 4.9% (white)
- Black population: 355,368 (7.9% of total)
43. Georgia

Source: SeanPavonePhoto / iStock via Getty Images
- Median household income: $55,010 (Black); $81,445 (white)
- Homeownership rate: 49.0% (Black); 74.7% (white)
- Unemployment rate: 8.2% (Black); 4.1% (white)
- Black population: 3,334,095 (31.1% of total)
42. Idaho
.jpg "Spirit Lake, Idaho, as viewed from Mt. Spokane, WA by LibertyLakeAnne")
- Median household income: $54,727 (Black); $71,661 (white)
- Homeownership rate: 36.9% (Black); 73.7% (white)
- Unemployment rate: 6.7% (Black); 3.9% (white)
- Black population: 11,919 (0.6% of total)
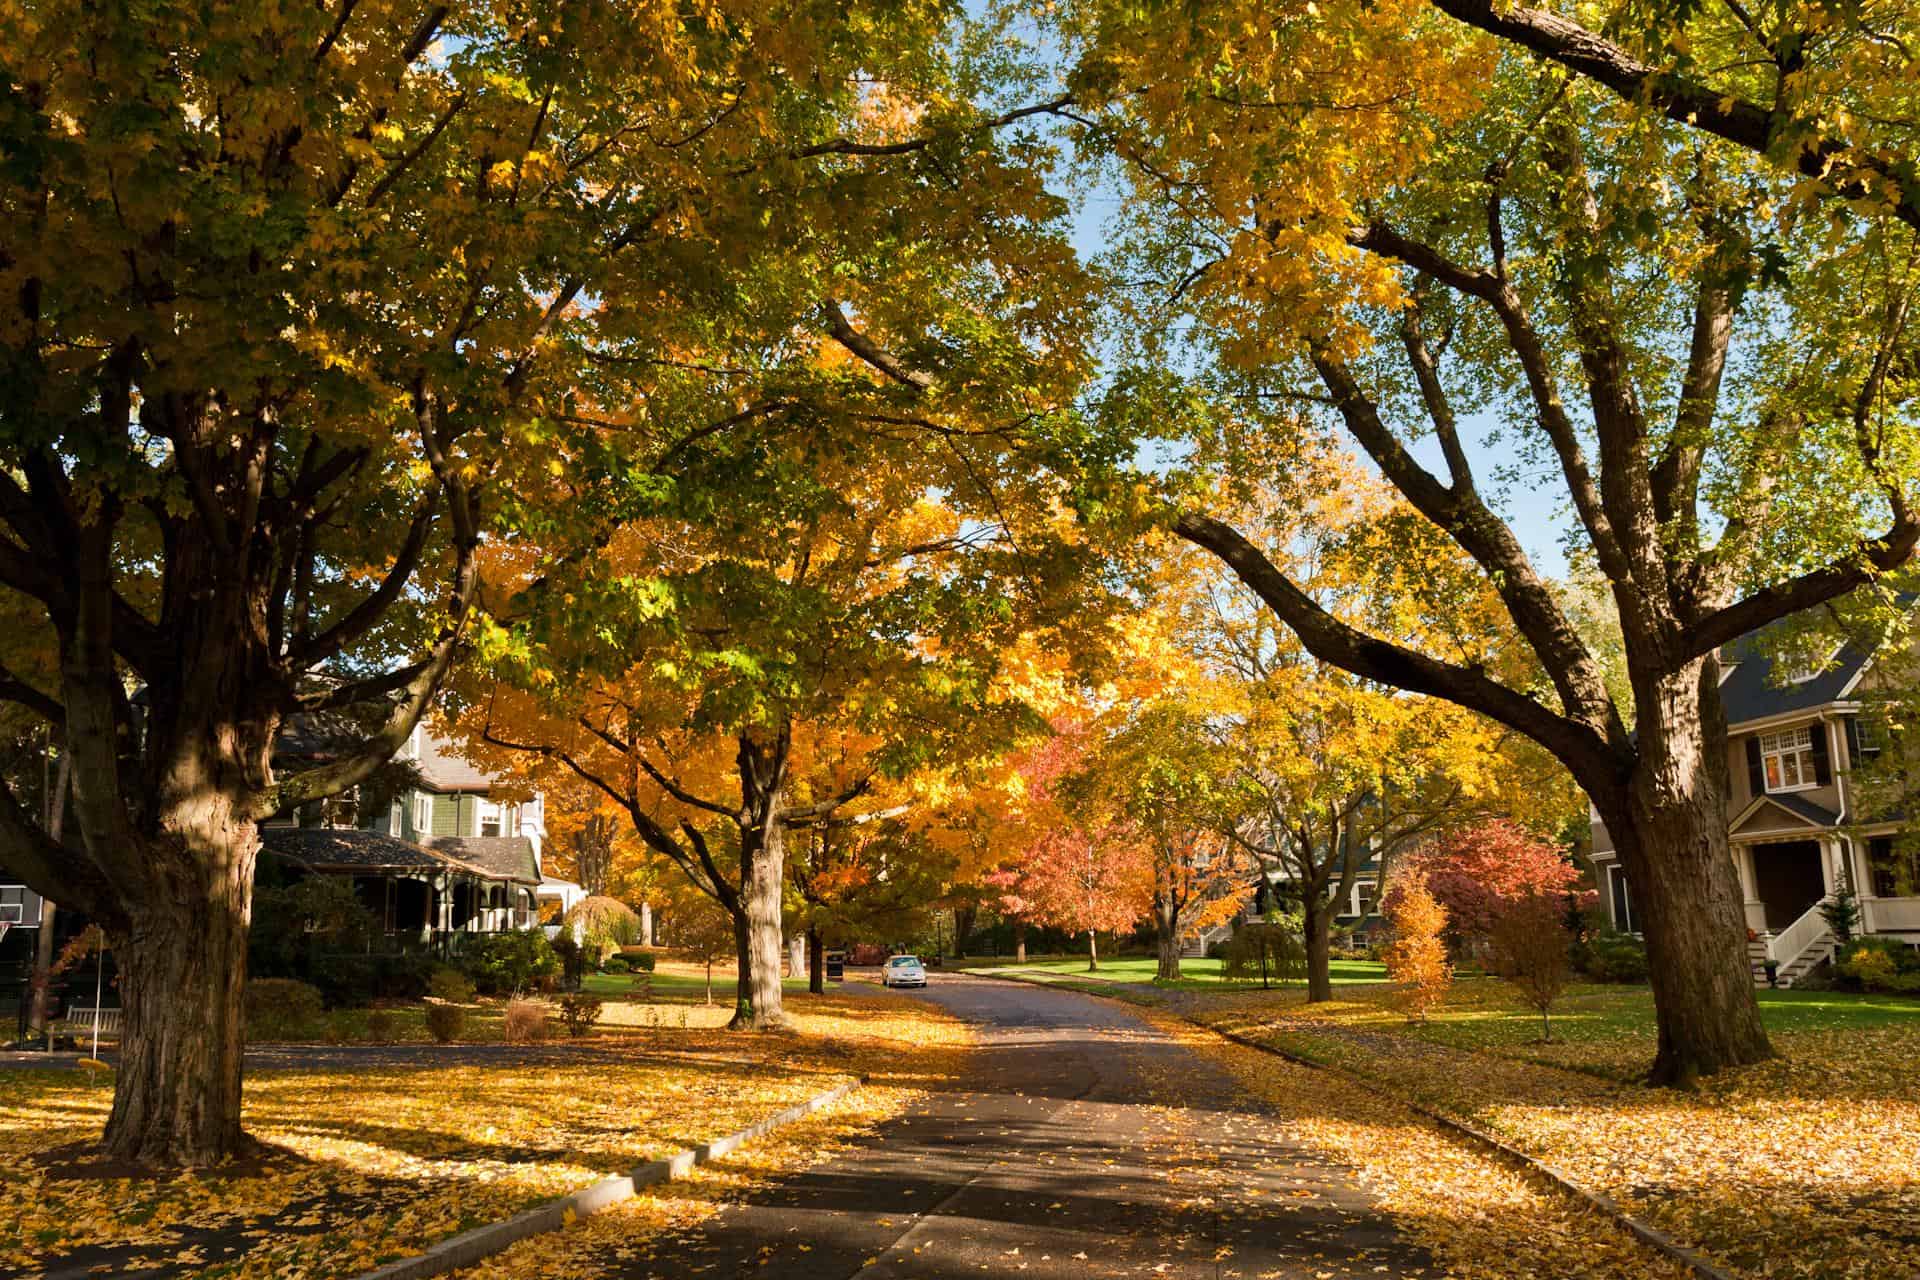
41. Oregon
")
- Median household income: $56,124 (Black); $77,627 (white)
- Homeownership rate: 33.9% (Black); 65.8% (white)
- Unemployment rate: 6.7% (Black); 5.5% (white)
- Black population: 75,790 (1.8% of total)
40. Maryland
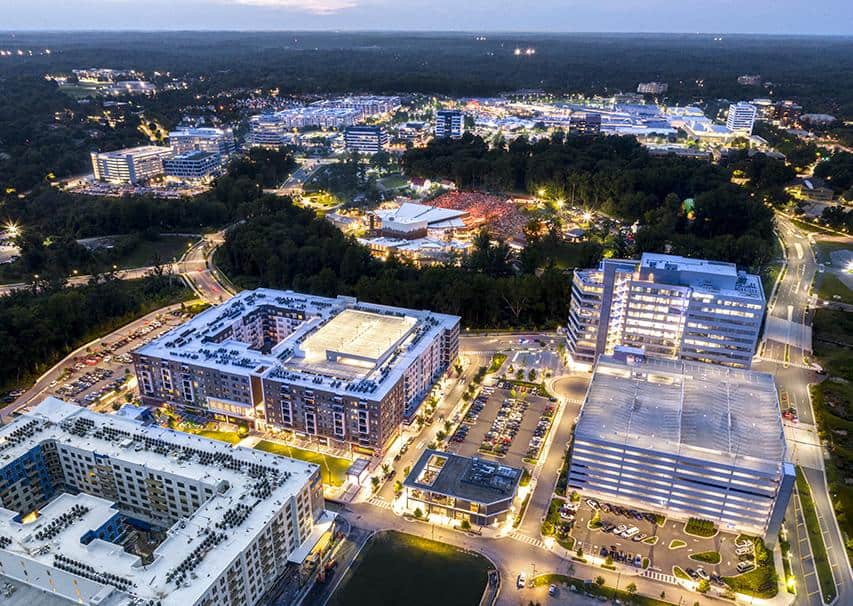
Source: Powerhawk5k / Wikimedia Commons
- Median household income: $79,161 (Black); $109,387 (white)
- Homeownership rate: 52.5% (Black); 76.9% (white)
- Unemployment rate: 7.8% (Black); 4.0% (white)
- Black population: 1,815,877 (29.5% of total)
39. Delaware
")
- Median household income: $58,385 (Black); $86,094 (white)
- Homeownership rate: 51.5% (Black); 80.1% (white)
- Unemployment rate: 8.0% (Black); 4.9% (white)
- Black population: 213,516 (21.5% of total)
38. Wyoming

- Median household income: $56,046 (Black); $73,542 (white)
- Homeownership rate: 38.2% (Black); 73.0% (white)
- Unemployment rate: 11.0% (Black); 3.8% (white)
- Black population: 4,488 (0.8% of total)
37. Tennessee

- Median household income: $46,708 (Black); $68,515 (white)
- Homeownership rate: 43.6% (Black); 73.1% (white)
- Unemployment rate: 9.4% (Black); 4.4% (white)
- Black population: 1,116,871 (16.1% of total)
36. Florida

Source: Sean Pavone / iStock via Getty Images
- Median household income: $51,249 (Black); $72,212 (white)
- Homeownership rate: 47.6% (Black); 72.9% (white)
- Unemployment rate: 8.1% (Black); 4.6% (white)
- Black population: 3,232,871 (14.9% of total)
35. New Hampshire

- Median household income: $72,946 (Black); $91,394 (white)
- Homeownership rate: 36.2% (Black); 74.0% (white)
- Unemployment rate: 7.6% (Black); 3.7% (white)
- Black population: 18,477 (1.3% of total)
34. Washington

Source: aiisha5 / iStock via Getty Images
- Median household income: $65,817 (Black); $91,601 (white)
- Homeownership rate: 34.0% (Black); 67.6% (white)
- Unemployment rate: 8.1% (Black); 4.8% (white)
- Black population: 290,907 (3.8% of total)
33. Rhode Island

- Median household income: $61,614 (Black); $86,467 (white)
- Homeownership rate: 35.1% (Black); 68.3% (white)
- Unemployment rate: 8.2% (Black); 5.3% (white)
- Black population: 58,304 (5.3% of total)
32. Oklahoma

- Median household income: $42,145 (Black); $65,469 (white)
- Homeownership rate: 39.8% (Black); 70.1% (white)
- Unemployment rate: 8.9% (Black); 4.4% (white)
- Black population: 277,702 (7.0% of total)
31. North Carolina

- Median household income: $47,088 (Black); $73,675 (white)
- Homeownership rate: 46.3% (Black); 73.7% (white)
- Unemployment rate: 8.3% (Black); 4.3% (white)
- Black population: 2,161,841 (20.6% of total)
30. Virginia

- Median household income: $60,201 (Black); $93,691 (white)
- Homeownership rate: 48.6% (Black); 73.1% (white)
- Unemployment rate: 7.2% (Black); 3.8% (white)
- Black population: 1,601,668 (18.6% of total)
29. South Dakota

- Median household income: $56,399 (Black); $72,498 (white)
- Homeownership rate: 25.6% (Black); 72.2% (white)
- Unemployment rate: 3.4% (Black); 2.3% (white)
- Black population: 19,172 (2.2% of total)
28. Alabama

- Median household income: $40,661 (Black); $69,042 (white)
- Homeownership rate: 51.3% (Black); 77.4% (white)
- Unemployment rate: 8.9% (Black); 4.1% (white)
- Black population: 1,318,388 (26.2% of total)
27. California
 by Ken Lund")
- Median household income: $64,513 (Black); $97,859 (white)
- Homeownership rate: 35.6% (Black); 60.7% (white)
- Unemployment rate: 10.5% (Black); 6.0% (white)
- Black population: 2,102,510 (5.3% of total)
26. Arkansas

- Median household income: $37,395 (Black); $60,756 (white)
- Homeownership rate: 44.2% (Black); 71.9% (white)
- Unemployment rate: 9.4% (Black); 4.5% (white)
- Black population: 454,728 (15.1% of total)
25. Nevada

- Median household income: $48,022 (Black); $77,786 (white)
- Homeownership rate: 31.6% (Black); 64.4% (white)
- Unemployment rate: 12.5% (Black); 6.2% (white)
- Black population: 278,689 (9.0% of total)
24. Vermont

- Median household income: $52,736 (Black); $74,499 (white)
- Homeownership rate: 27.7% (Black); 74.0% (white)
- Unemployment rate: 6.4% (Black); 3.8% (white)
- Black population: 7,548 (1.2% of total)
23. Maine

- Median household income: $53,407 (Black); $68,783 (white)
- Homeownership rate: 25.9% (Black); 74.4% (white)
- Unemployment rate: 5.6% (Black); 4.2% (white)
- Black population: 21,093 (1.5% of total)
22. Colorado

- Median household income: $61,343 (Black); $91,475 (white)
- Homeownership rate: 41.8% (Black); 69.1% (white)
- Unemployment rate: 7.8% (Black); 4.2% (white)
- Black population: 221,211 (3.8% of total)
21. Missouri

- Median household income: $44,293 (Black); $69,547 (white)
- Homeownership rate: 39.3% (Black); 72.4% (white)
- Unemployment rate: 8.2% (Black); 3.9% (white)
- Black population: 688,219 (11.2% of total)
20. Mississippi

- Median household income: $36,263 (Black); $65,518 (white)
- Homeownership rate: 54.4% (Black); 78.7% (white)
- Unemployment rate: 10.0% (Black); 4.9% (white)
- Black population: 1,098,675 (37.1% of total)
19. South Carolina

Source: MargaretW / iStock via Getty Images
- Median household income: $42,672 (Black); $73,204 (white)
- Homeownership rate: 53.5% (Black); 78.4% (white)
- Unemployment rate: 7.9% (Black); 4.3% (white)
- Black population: 1,316,074 (25.6% of total)
18. Massachusetts
Source: stresstensor / iStock via Getty Images
- Median household income: $67,044 (Black); $102,701 (white)
- Homeownership rate: 36.4% (Black); 68.5% (white)
- Unemployment rate: 8.4% (Black); 4.7% (white)
- Black population: 459,848 (6.6% of total)
17. Indiana
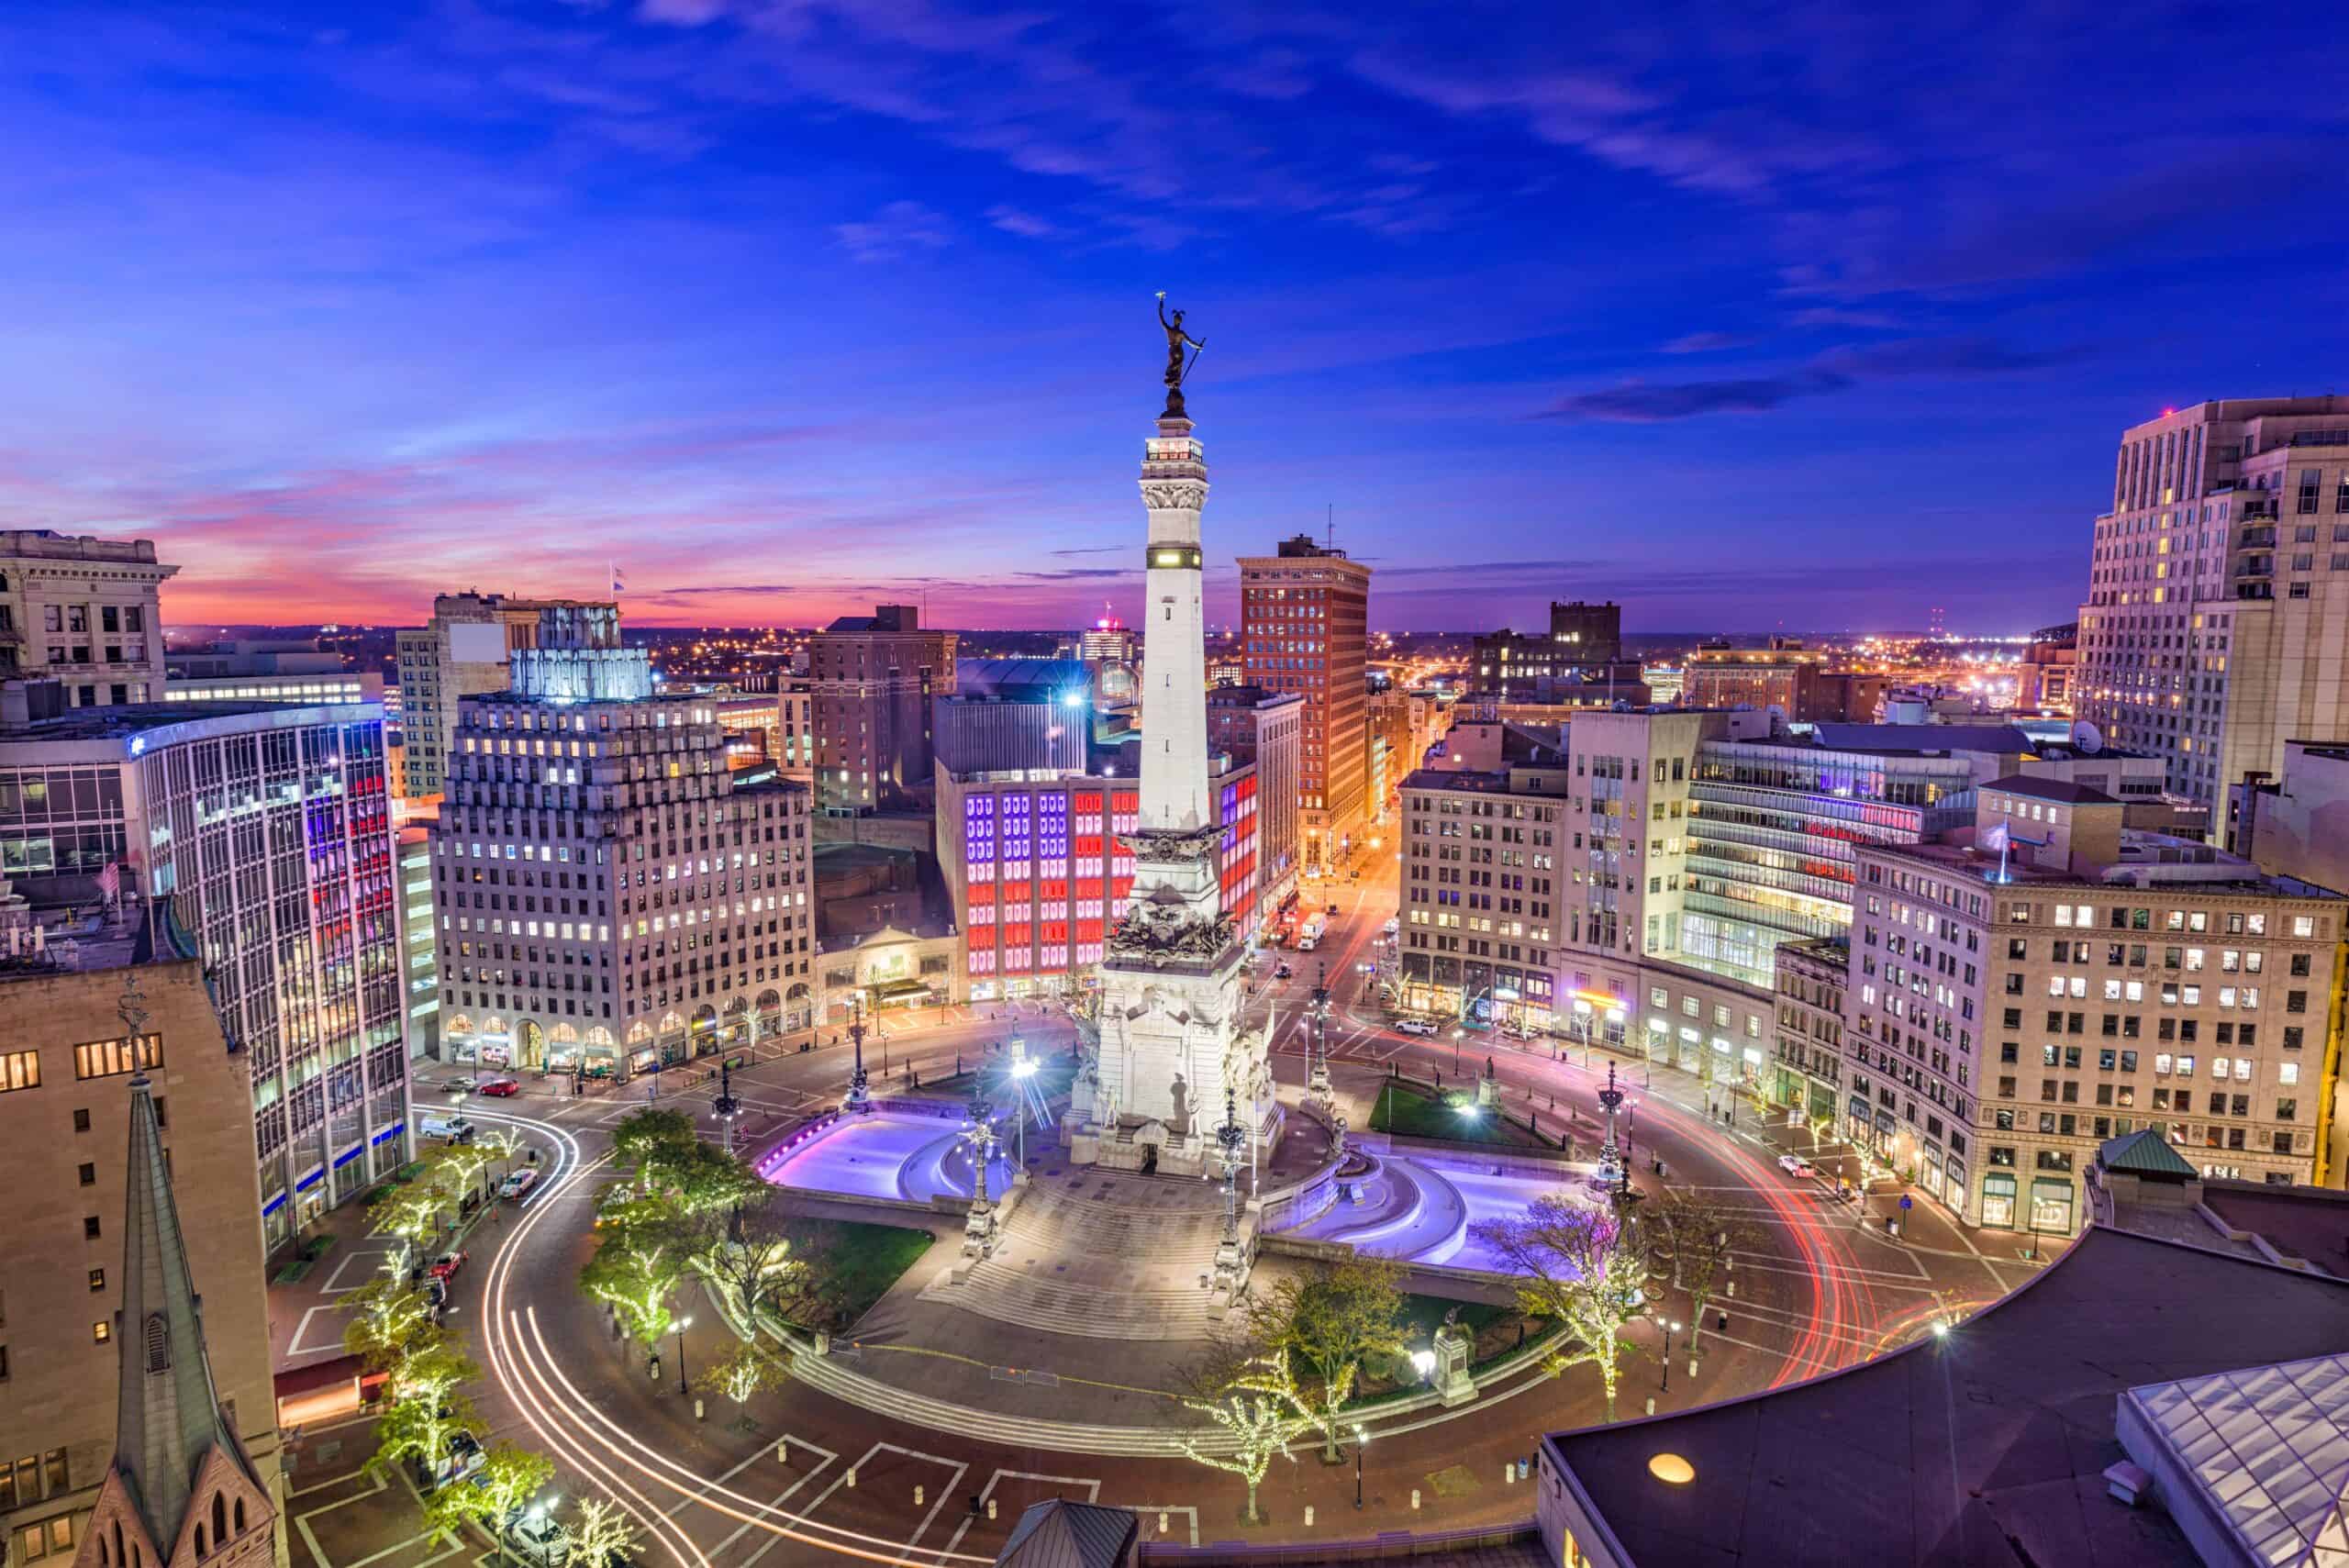
Source: Sean Pavone / iStock via Getty Images
- Median household income: $42,067 (Black); $70,740 (white)
- Homeownership rate: 38.0% (Black); 74.9% (white)
- Unemployment rate: 9.9% (Black); 4.1% (white)
- Black population: 631,919 (9.3% of total)
16. Montana

- Median household income: $50,676 (Black); $68,005 (white)
- Homeownership rate: 27.4% (Black); 70.7% (white)
- Unemployment rate: 11.7% (Black); 3.3% (white)
- Black population: 5,248 (0.5% of total)
15. New York

- Median household income: $58,805 (Black); $90,866 (white)
- Homeownership rate: 32.7% (Black); 64.7% (white)
- Unemployment rate: 9.2% (Black); 5.0% (white)
- Black population: 2,767,223 (13.8% of total)
14. Louisiana

Source: artiste9999 / iStock via Getty Images
- Median household income: $37,015 (Black); $70,270 (white)
- Homeownership rate: 48.9% (Black); 76.9% (white)
- Unemployment rate: 10.4% (Black); 4.9% (white)
- Black population: 1,456,107 (31.4% of total)
13. North Dakota

- Median household income: $49,369 (Black); $77,950 (white)
- Homeownership rate: 11.7% (Black); 67.3% (white)
- Unemployment rate: 7.9% (Black); 2.6% (white)
- Black population: 24,882 (3.2% of total)
12. Utah

Source: Sean Pavone / iStock via Getty Images
- Median household income: $57,433 (Black); $89,462 (white)
- Homeownership rate: 27.4% (Black); 73.2% (white)
- Unemployment rate: 5.8% (Black); 3.2% (white)
- Black population: 34,485 (1.1% of total)
11. Kansas

- Median household income: $46,145 (Black); $72,357 (white)
- Homeownership rate: 36.5% (Black); 70.2% (white)
- Unemployment rate: 9.1% (Black); 3.6% (white)
- Black population: 157,768 (5.4% of total)
10. Connecticut

- Median household income: $59,728 (Black); $98,855 (white)
- Homeownership rate: 40.7% (Black); 73.5% (white)
- Unemployment rate: 8.8% (Black); 5.2% (white)
- Black population: 355,970 (9.9% of total)
9. New Jersey

- Median household income: $65,351 (Black); $105,392 (white)
- Homeownership rate: 39.7% (Black); 73.3% (white)
- Unemployment rate: 9.2% (Black); 5.3% (white)
- Black population: 1,147,770 (12.4% of total)
8. Ohio

Source: Sean Pavone / iStock via Getty Images
- Median household income: $40,499 (Black); $71,843 (white)
- Homeownership rate: 36.1% (Black); 72.7% (white)
- Unemployment rate: 10.6% (Black); 4.3% (white)
- Black population: 1,431,238 (12.2% of total)
7. Pennsylvania

- Median household income: $45,944 (Black); $77,962 (white)
- Homeownership rate: 43.4% (Black); 74.3% (white)
- Unemployment rate: 11.1% (Black); 4.6% (white)
- Black population: 1,347,784 (10.4% of total)
6. Michigan

Source: SolomonCrowe / iStock via Getty Images
- Median household income: $42,171 (Black); $73,039 (white)
- Homeownership rate: 43.3% (Black); 78.4% (white)
- Unemployment rate: 13.1% (Black); 5.0% (white)
- Black population: 1,346,918 (13.4% of total)
5. Nebraska

- Median household income: $45,287 (Black); $74,157 (white)
- Homeownership rate: 29.8% (Black); 70.0% (white)
- Unemployment rate: 8.3% (Black); 2.8% (white)
- Black population: 91,357 (4.7% of total)
4. Illinois

- Median household income: $46,717 (Black); $85,060 (white)
- Homeownership rate: 40.2% (Black); 73.7% (white)
- Unemployment rate: 13.7% (Black); 4.8% (white)
- Black population: 1,744,151 (13.7% of total)
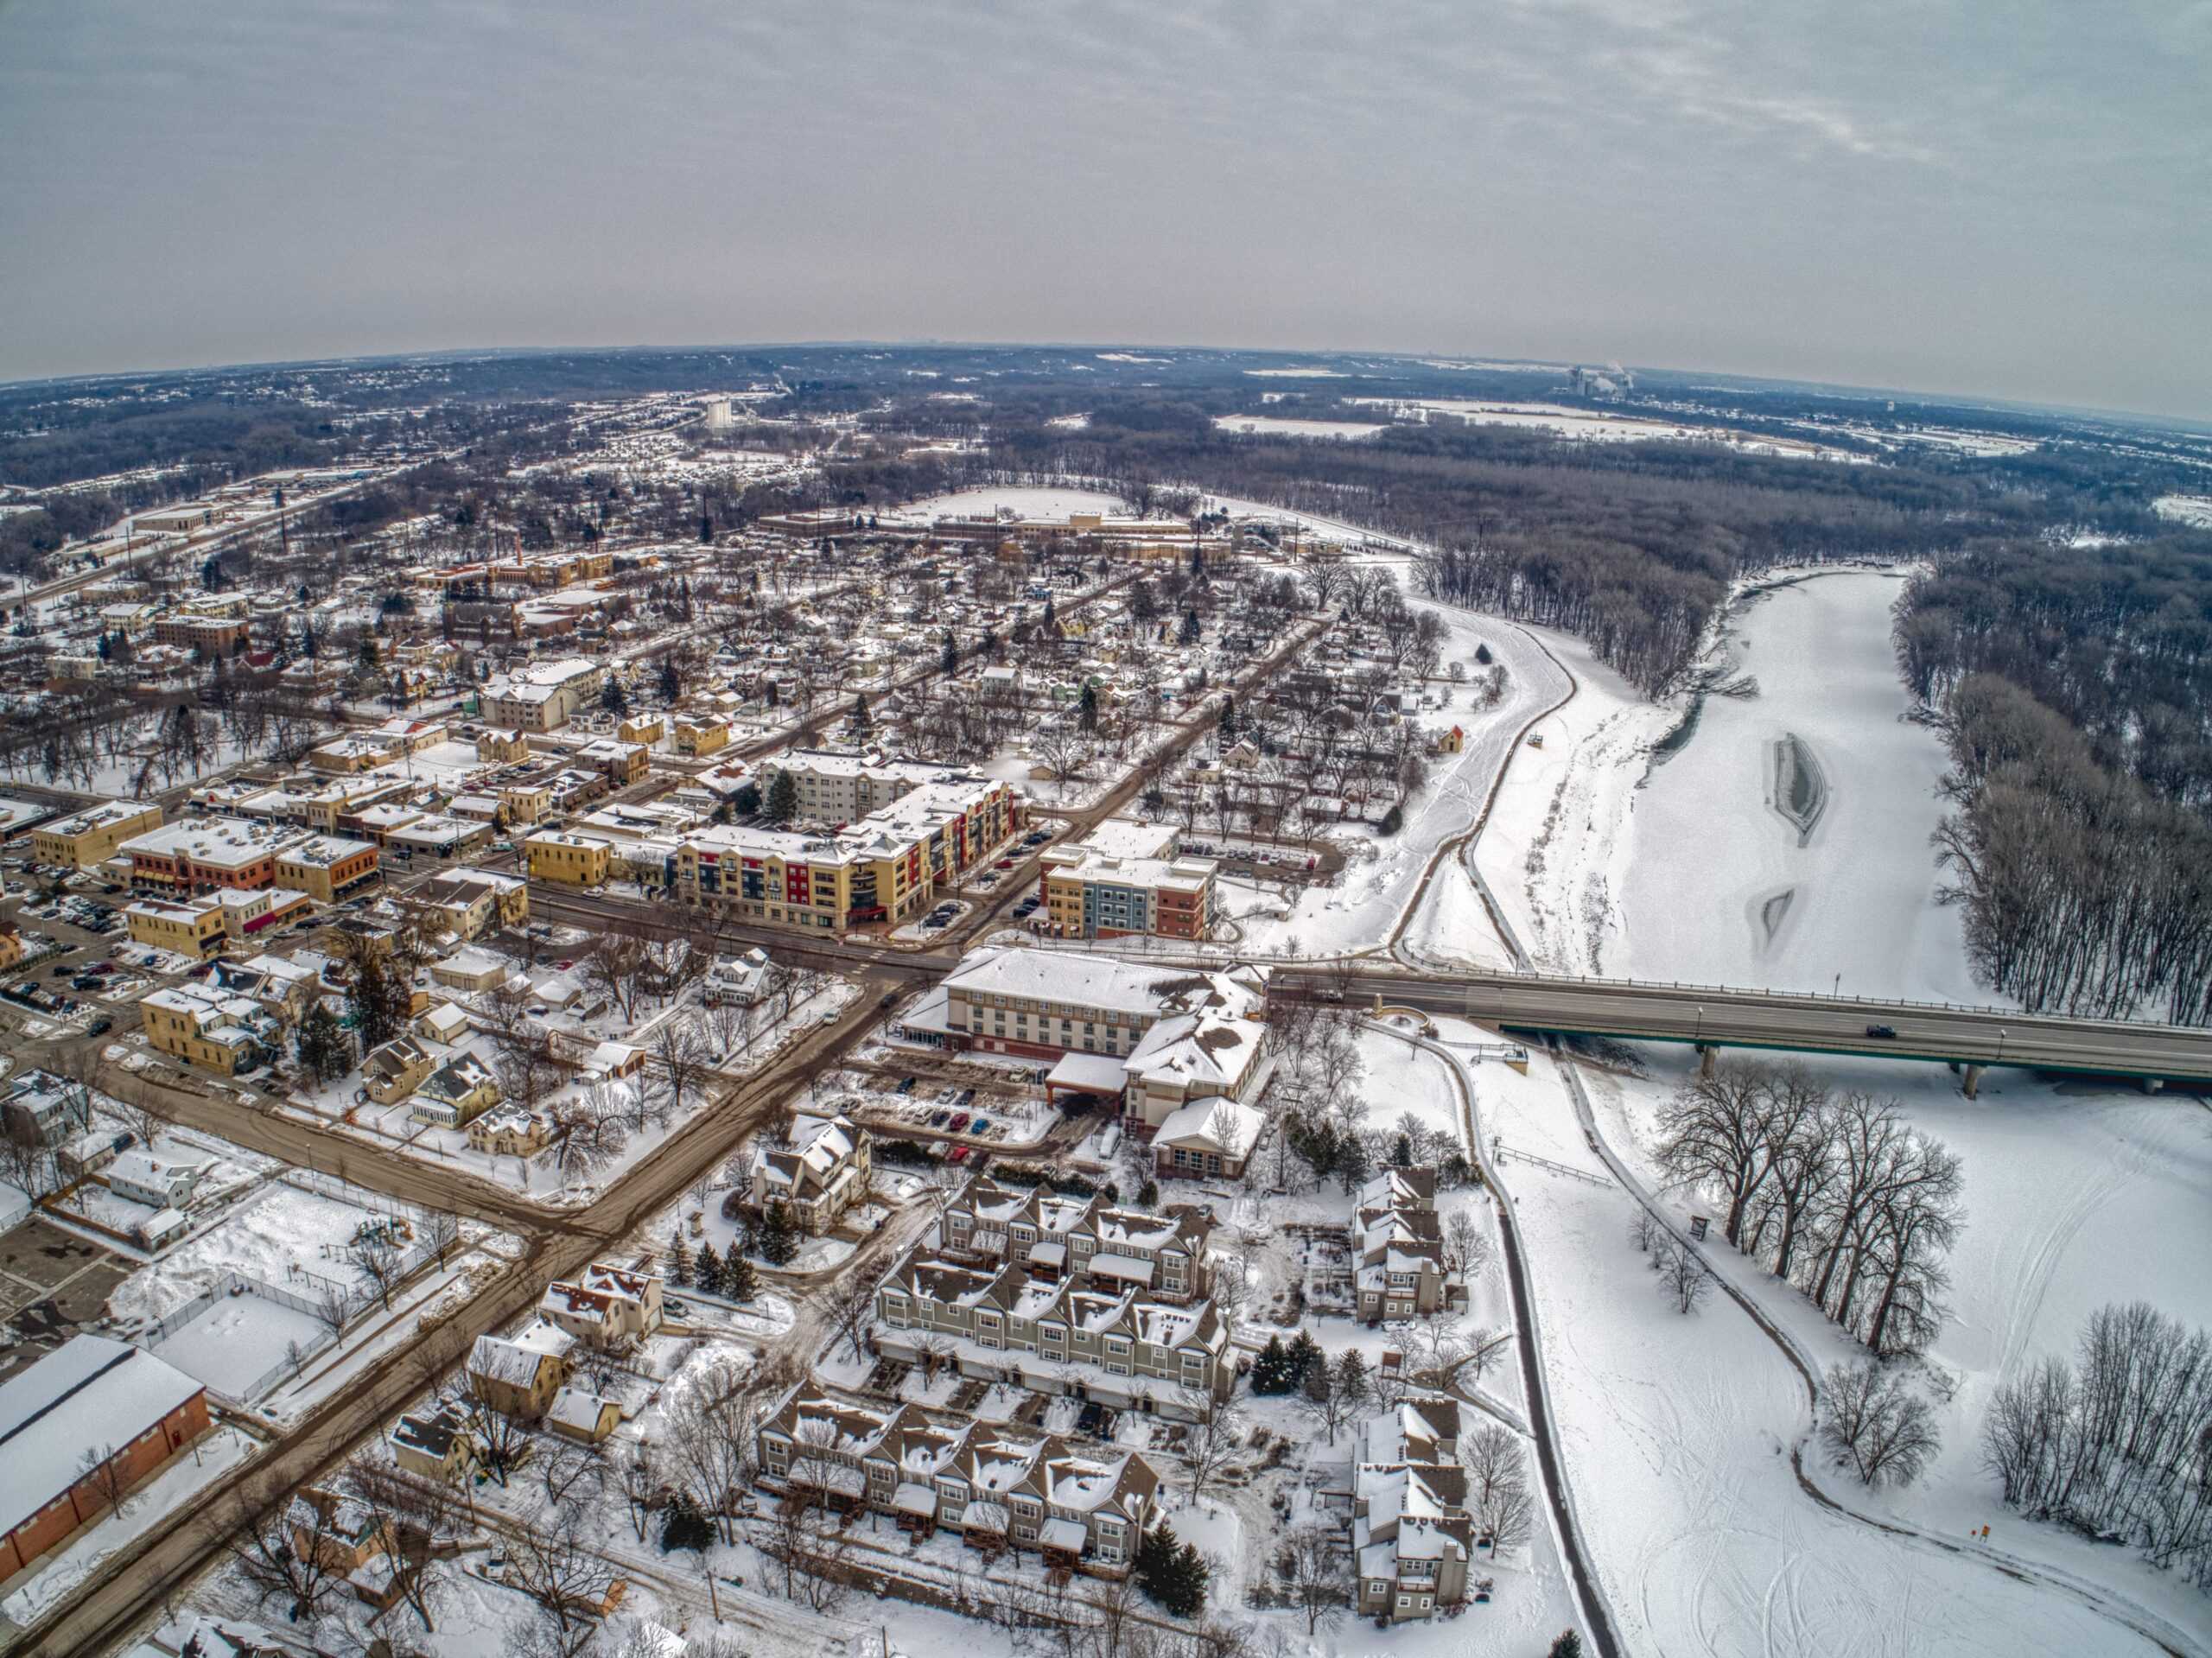
3. Minnesota

- Median household income: $49,738 (Black); $87,692 (white)
- Homeownership rate: 28.4% (Black); 76.8% (white)
- Unemployment rate: 8.6% (Black); 3.4% (white)
- Black population: 377,173 (6.6% of total)
2. Iowa

Source: f11photo / iStock via Getty Images
- Median household income: $40,592 (Black); $72,363 (white)
- Homeownership rate: 27.2% (Black); 74.3% (white)
- Unemployment rate: 11.0% (Black); 3.4% (white)
- Black population: 117,940 (3.7% of total)
1. Wisconsin
Source: Public Domain / Wikimedia Commons
- Median household income: $38,732 (Black); $75,803 (white)
- Homeownership rate: 26.5% (Black); 71.9% (white)
- Unemployment rate: 8.3% (Black); 3.0% (white)
- Black population: 356,150 (6.1% of total)
Smart Investors Are Quietly Loading Up on These “Dividend Legends”
If you want your portfolio to pay you cash like clockwork, it’s time to stop blindly following conventional wisdom like relying on Dividend Aristocrats. There’s a better option, and we want to show you. We’re offering a brand-new report on 2 stocks we believe offer the rare combination of a high dividend yield and significant stock appreciation upside. If you’re tired of feeling one step behind in this market, this free report is a must-read for you.
Click here to download your FREE copy of “2 Dividend Legends to Hold Forever” and start improving your portfolio today.
Thank you for reading! Have some feedback for us?
Contact the 24/7 Wall St. editorial team.
Editors' Picks