 The world of gold and silver has been turned upside down. The market fears that Ben Bernanke’s quantitative easing under the Federal Reserve will end sooner rather than later, and that should lead to increasingly higher interest rates. Gold and silver both fell from grace, but what has stood out in recent days is that silver is outperforming gold to the point that the gold-silver price ratio is soon to look very different on the charts.
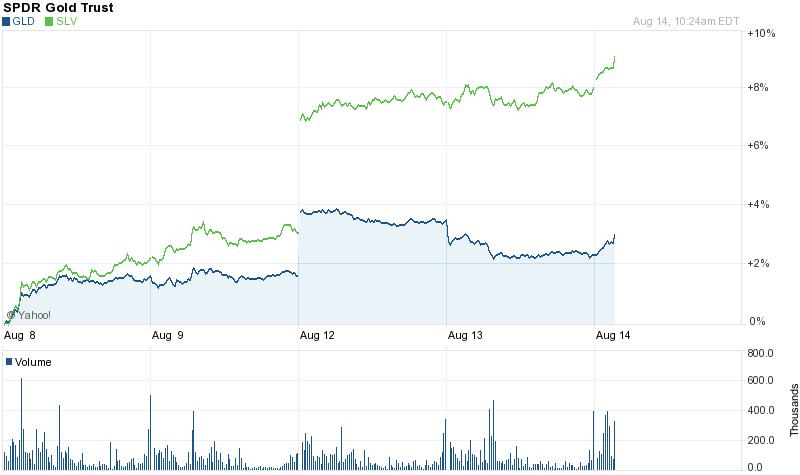
We track the SPDR Gold Shares (NYSEMKT: GLD) and the iShares Silver Trust (NYSEMKT: SLV) for spot comparisons during the day for simplicity. The former is up about 3% in the past five days as gold is trying to remain above $1,300 per ounce. The “latter actually is up almost 9% in the past five days as silver jumped back over $20 and then over $21 per ounce.
Kitco.com tracks the gold-silver price ratio, and this down to about 61.4 as of Wednesday. It has come down sharply in the past 30 days from around 67 in late July as silver has held its own. Now silver has risen, yet again reminding us why it is often known as the “devil’s metal.”
Silver has more industrial use and brighter economic reports seem to fueling the fire that silver demand will tick back up. The recent rise in gold prices also might be sucking silver buyers back into the market as well. We may call silver the devil’s metal, but many speculators treat silver as the “poor man’s gold” as a comparison.
Now that European numbers are signaling an exit (or at least a break from) the recession, demand for industrial metals and silver may trump whatever central banks and speculators are doing in gold. The Yahoo! Finance chart shows the five-day performance of silver over gold.
Contact [email protected] for any questions or corrections.