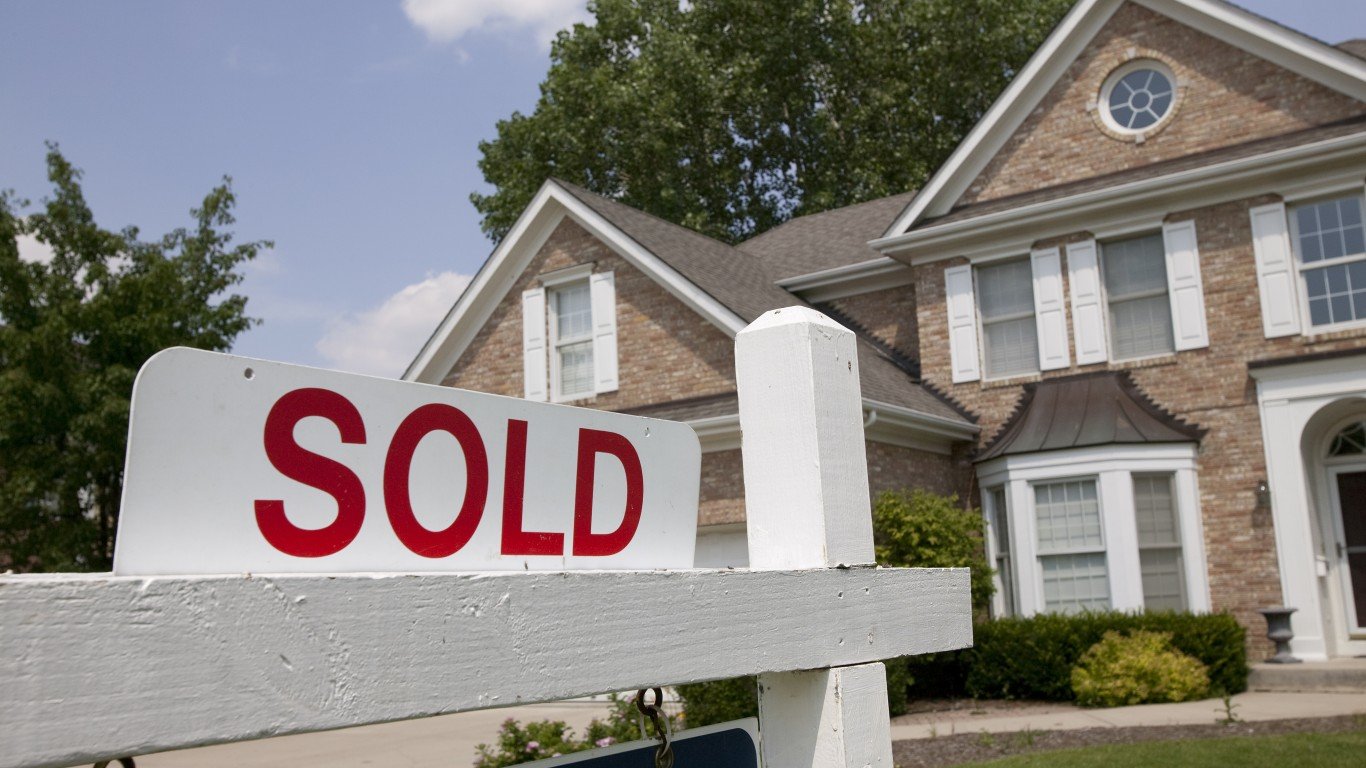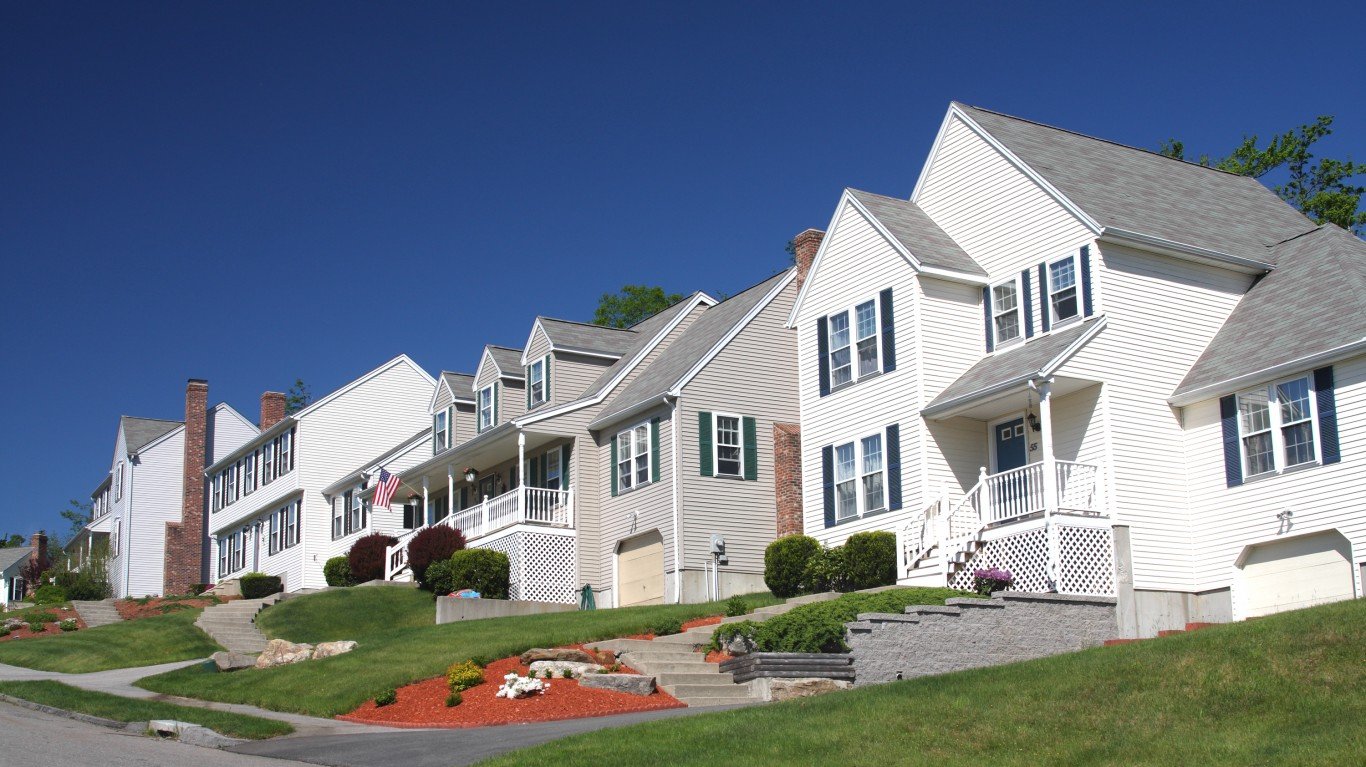
Home prices have reached their highest level in history in a number of markets. Much of this has been driven by people who have relocated from large cities during the pandemic. Many of the housing markets in America have seen a double-digit price increase compared to the same time in 2020. The trend has created a financial bonanza for sellers. This has been compounded by a low supply of homes, brought on because of the buying frenzy.
The premium people get for their homes varies by date. ATTOM Data Solutions, a major supplier of real estate analysis, looked at 40.1 million home sales from 2011 to 2020. It included those calendar days during this period when at least 10,000 homes were sold nationwide. Because of the length of the period, the information shows the trends in years when home prices rose sharply and some in which they did not.
To pick the days when sellers got the best premium on homes over the course of a year, ATTOM Data Solutions modeled the value of homes and compared them against what sellers actually received when they sold homes.
Todd Teta, chief product officer with ATTOM Data Solutions, said: “Among the top five days fetching the biggest home seller premiums, May 23 is the best day of the year to sell a home, producing a premium of 19.3 percent above market value.” It was followed by May 27 (17.4%), May 16 (17.3%), May 20 (16.8%) and May 19 (16.2%).
[nativounit]
The best month of the year was May, when the premium is 13.4%, and then June at 11.7% and July at 11.2%. The worst two months were October and December, each at 8.0%.
These are the 25 best days to sell a house:
| Date | Median Price | Premium |
|---|---|---|
| May 23 | $192,000 | 19.3% |
| May 27 | $195,300 | 17.4% |
| May 16 | $190,000 | 17.3% |
| May 20 | $195,000 | 16.8% |
| May 19 | $196,000 | 16.2% |
| May 21 | $197,492 | 16.2% |
| May 24 | $200,000 | 14.9% |
| May 25 | $197,500 | 14.8% |
| May 22 | $205,000 | 14.7% |
| May 31 | $212,188 | 14.3% |
| July 25 | $197,500 | 14.2% |
| May 28 | $206,000 | 14.1% |
| May 29 | $210,000 | 14.0% |
| May 17 | $196,000 | 13.9% |
| May 30 | $205,708 | 13.7% |
| May 15 | $208,000 | 13.5% |
| June 28 | $213,231 | 13.4% |
| June 21 | $205,000 | 13.3% |
| May 13 | $190,000 | 13.1% |
| June 29 | $213,750 | 13.1% |
| July 15 | $215,000 | 13.0% |
| June 20 | $200,000 | 13.0% |
| July 30 | $212,000 | 12.8% |
| June 22 | $208,587 | 12.7% |
| May 18 | $199,375 | 12.6% |
Click here to read more about the best month to sell a house.
[wallst_email_signup]
Contact [email protected] for any questions or corrections.