Homeownership has long been a cornerstone of the American Dream. But in the current housing market — defined by soaring property values and historically high mortgage rates — the prospect of buying a home is no longer realistic for millions of Americans.
The average interest rate on a 30-year fixed mortgage has been over 6.5% for nearly a year, up from less than 3% as recently as October 2021. Meanwhile, the National Association of Home Builders estimates that the median price of a new home in the U.S. was $495,750 in March 2024, up over 16% from the previous year and nearly 44% higher than in January 2020, before the pandemic.
As they are, market conditions are stacked against buyers — particularly prospective first-time homeowners and those looking for a newly built home. According to a recent report from NAHB, a household would need to have an annual income of nearly $152,000 to be able to afford a new home and not spend more than 28% of their gross income on housing — including property taxes and assuming a 6.5% fixed mortgage rate. Based on this model, 103.5 million households — or 76.9% of all American households — would not be able to comfortably afford a new home.
Of course, both incomes and home prices vary considerably across the country. And while there are places where a new home is still affordable to large shares of the population, there are also many cities where the costs associated with owning a new home are prohibitive for nearly everyone.
Using data from NAHB, 24/7 Wall St. identified the U.S. cities where the most people cannot afford a new home. We reviewed data on over 400 metropolitan areas and ranked those where the largest share of the population do not earn enough to afford a new, median priced home. Metro areas with fewer than 100,000 households were excluded from analysis and some metro areas on this list may overlap with others. Supplemental data on median household income is from the U.S. Census Bureau’s 2022 American Community Survey. A full methodology is available in the NAHB’s March 2024 report.
Among the 45 metro areas on this list, the share of households who cannot afford a typical new home ranges from 87.4% to 94.1%. While the current housing affordability crisis has impacted much of the country, it appears to be especially pronounced in large, Western cities. Of the 45 metro areas on this list, 17 are in the West, including seven in California alone. Meanwhile, the Northeast and the South are each home to 12 cities on this list, while only four of the least affordable housing markets are in the Midwest. (Here is a look at the most affordable housing market in each state.)
In any given area, housing affordability is a product of two factors: income and home prices. Many cities on this list, particularly those along the East or West Coast, tend to have higher earning populations than cities in much of the rest of the country. In these places, however, a new, median priced home is also far more expensive than average. There are 15 cities on this list where most new homes are listed for over $750,000.
Conversely, there are also many cities on this list where the typical household earns far less than a typical American household. Even though new home prices tend to be lower than average in some of these places, few households have the necessary income to afford them. (Here are 11 essential tips for every first-time home buyer.)
Why It Matters

Source: Feverpitched / iStock via Getty Images
Homeownership has historically been a reliable means of building wealth in the United States. However, recent increases in home values and borrowing costs have priced large segments of the population out of the market. The state of the housing market is not only impacting individuals and families, but also the broader economy. Residential investment accounts for as much as 5% of U.S. gross domestic product, and since mid-2020, the volume of new home sales in the U.S. has fallen by 33%.
45. Bremerton-Silverdale-Port Orchard, WA

Source: Ceri Breeze / iStock Editorial via Getty Images
- Households unable to afford a new, median priced home: 87.4% (100,602 total)
- Median new home price: $760,580
- Income needed to afford a typical new home: $224,969
- Median household income: $94,775
44. Portland-Vancouver-Hillsboro, OR-WA

Source: BruceBlock / iStock via Getty Images
- Households unable to afford a new, median priced home: 87.6% (903,247 total)
- Median new home price: $876,183
- Income needed to afford a typical new home: $261,646
- Median household income: $89,312
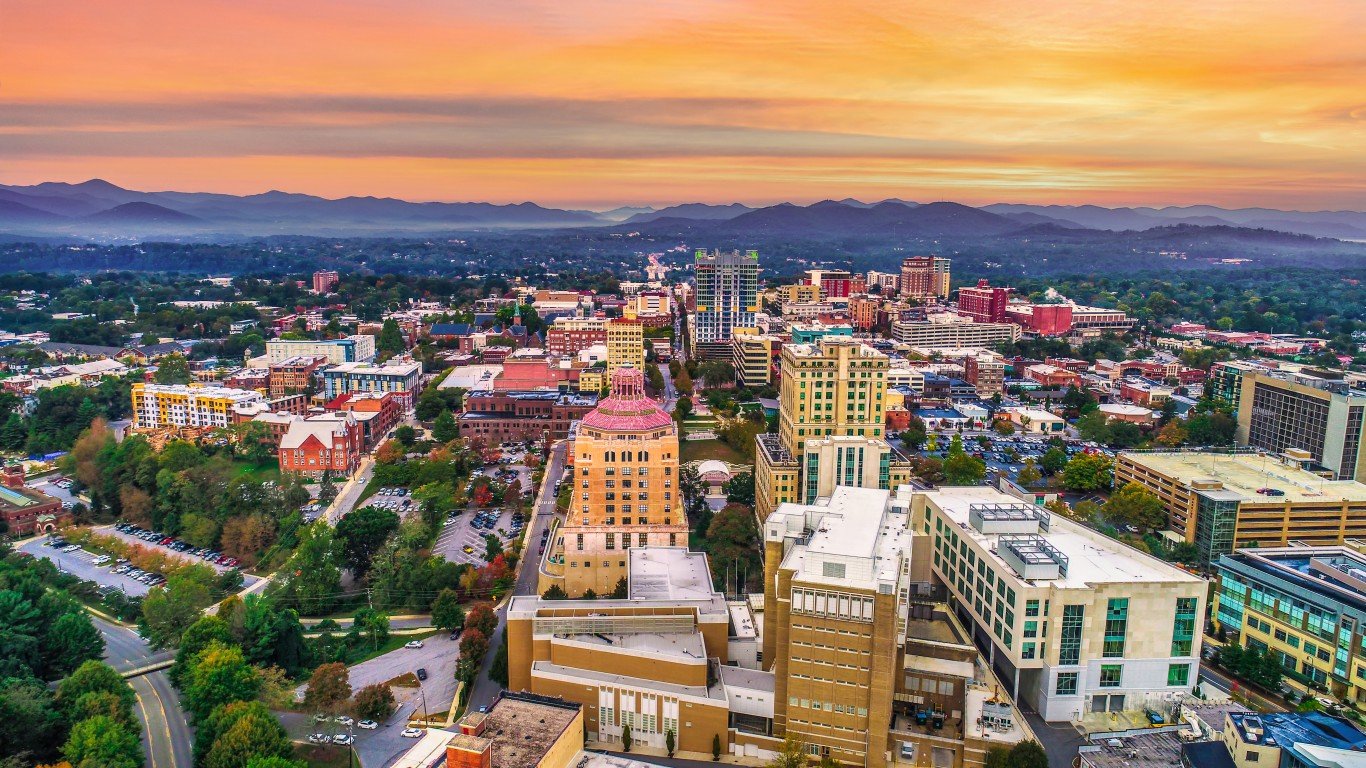
43. Asheville, NC
Source: Kruck20 / iStock via Getty Images
- Households unable to afford a new, median priced home: 87.6% (176,510 total)
- Median new home price: $656,069
- Income needed to afford a typical new home: $191,033
- Median household income: $66,023
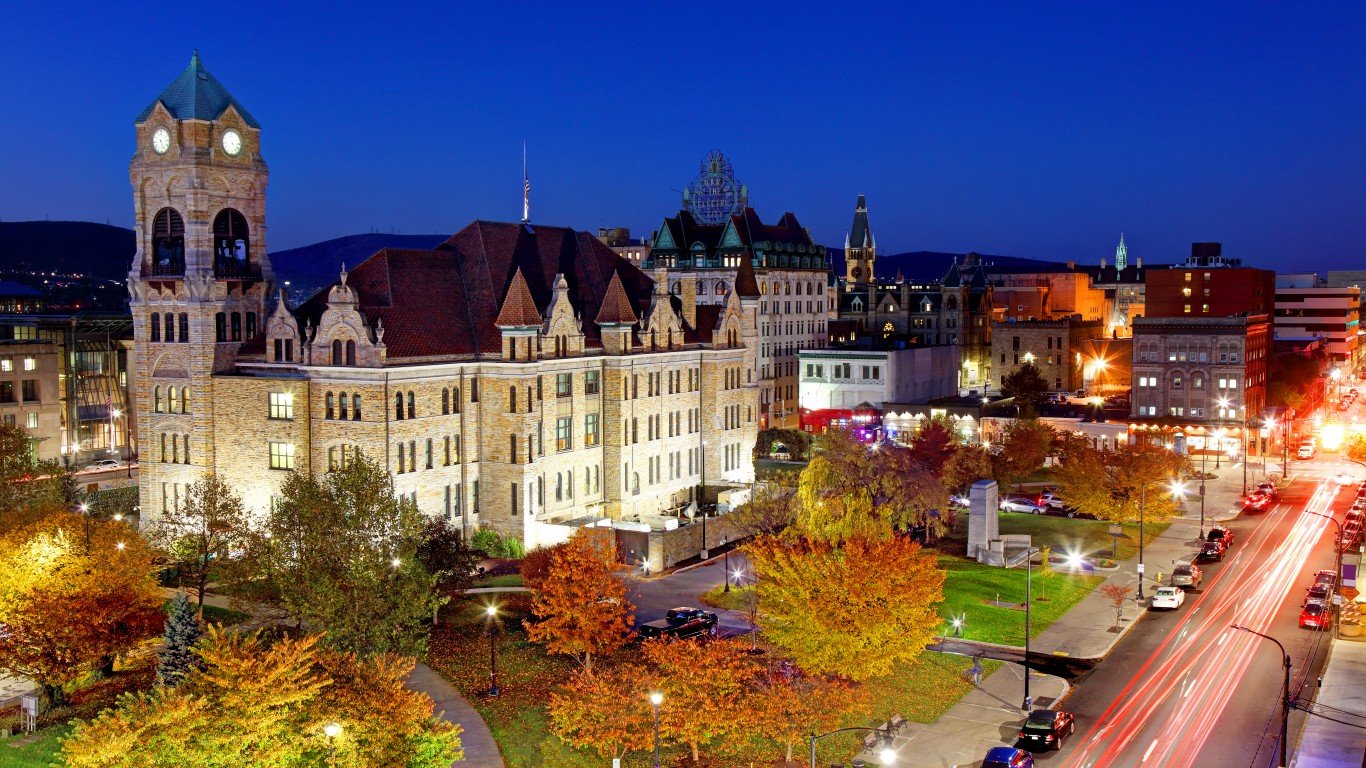
42. Scranton–Wilkes-Barre, PA
Source: DenisTangneyJr / E+ via Getty Images
- Households unable to afford a new, median priced home: 87.7% (209,716 total)
- Median new home price: $563,945
- Income needed to afford a typical new home: $187,680
- Median household income: $60,537
41. Kennewick-Richland, WA
Source: smodj / iStock via Getty Images
- Households unable to afford a new, median priced home: 87.7% (99,995 total)
- Median new home price: $759,380
- Income needed to afford a typical new home: $226,345
- Median household income: $82,961
40. Bridgeport-Stamford-Norwalk, CT

Source: DenisTangneyJr / E+ via Getty Images
- Households unable to afford a new, median priced home: 87.7% (313,550 total)
- Median new home price: $1,164,353
- Income needed to afford a typical new home: $381,322
- Median household income: $105,968
39. York-Hanover, PA
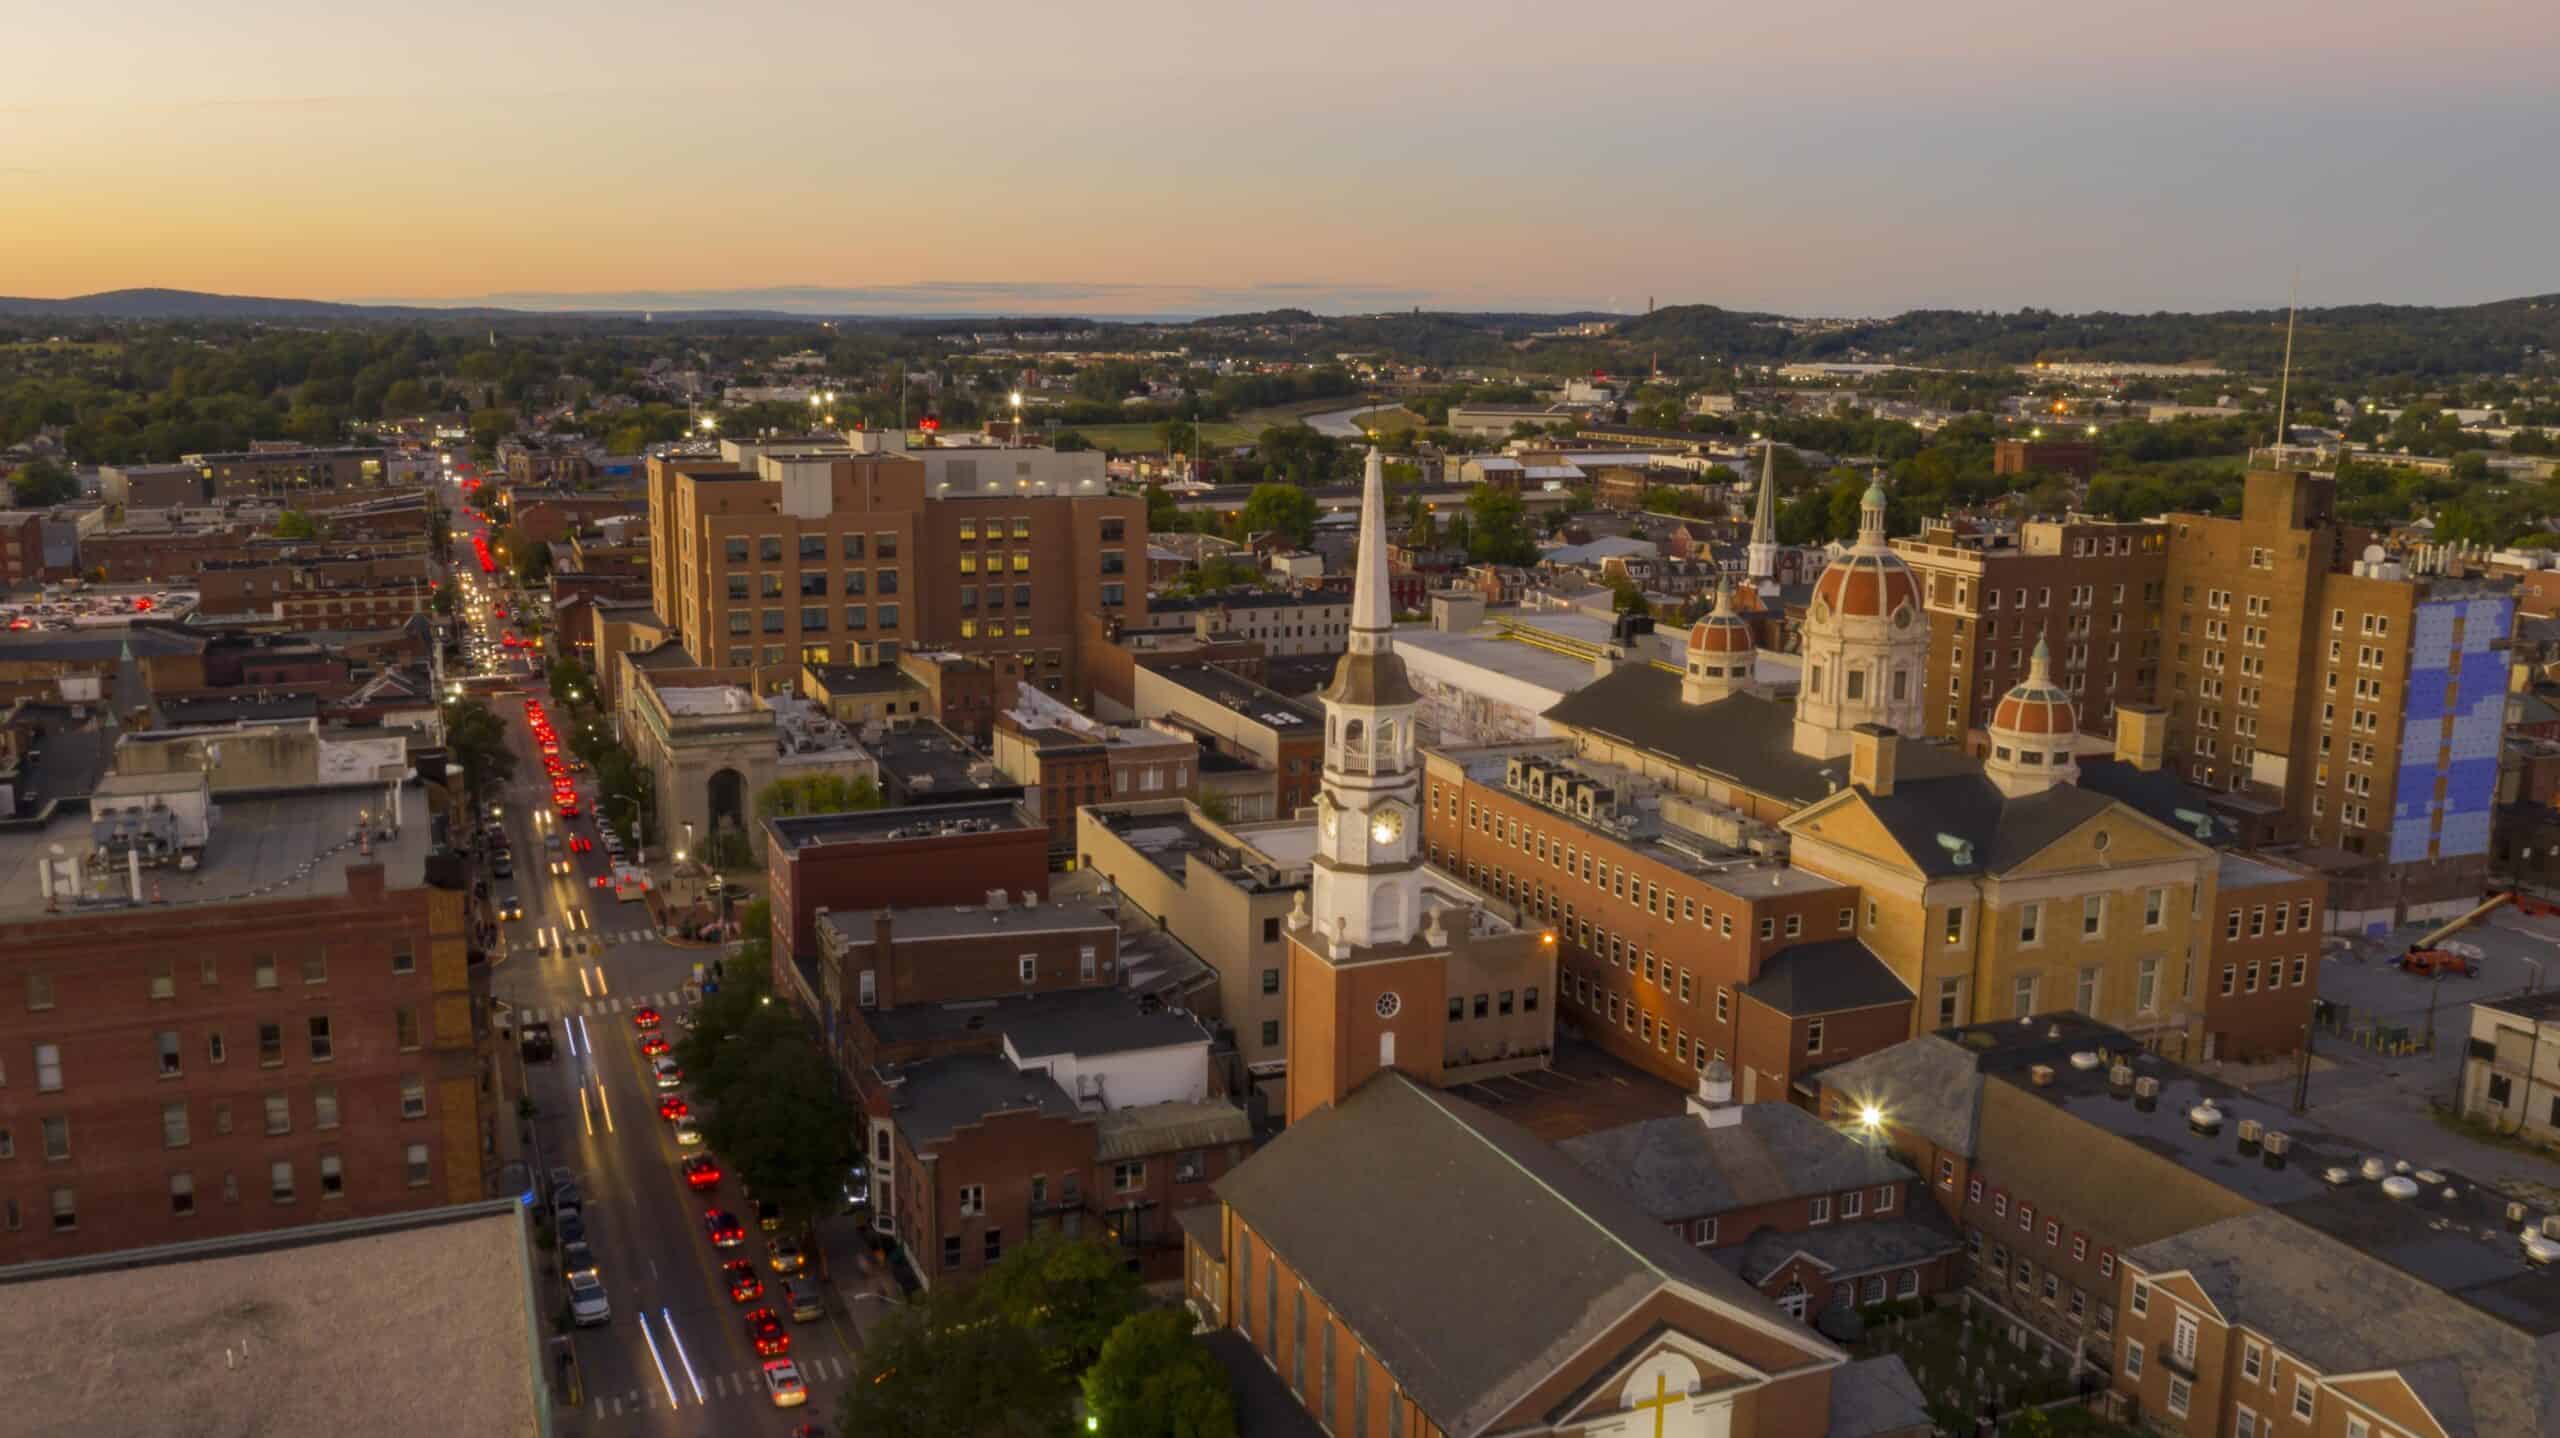
Source: ChrisBoswell / iStock via Getty Images
- Households unable to afford a new, median priced home: 87.8% (170,894 total)
- Median new home price: $542,516
- Income needed to afford a typical new home: $179,201
- Median household income: $80,130
38. San Luis Obispo-Paso Robles, CA
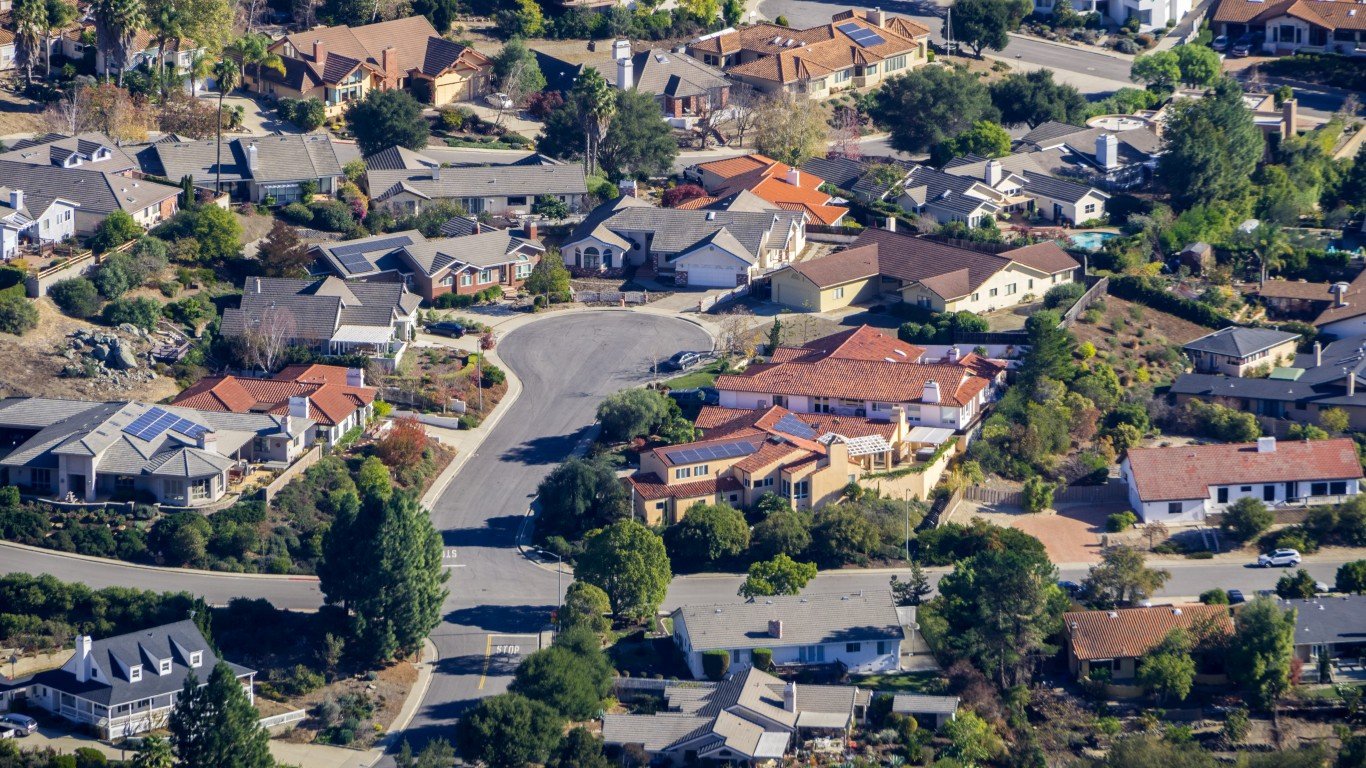
Source: Sundry Photography / iStock via Getty Images
- Households unable to afford a new, median priced home: 87.8% (105,728 total)
- Median new home price: $806,181
- Income needed to afford a typical new home: $235,691
- Median household income: $90,216
37. Visalia, CA

Source: DenisTangneyJr / iStock via Getty Images
- Households unable to afford a new, median priced home: 88.0% (125,276 total)
- Median new home price: $572,325
- Income needed to afford a typical new home: $168,134
- Median household income: $64,722
36. Oklahoma City, OK

Source: Sean Pavone / iStock via Getty Images
- Households unable to afford a new, median priced home: 88.0% (509,194 total)
- Median new home price: $563,481
- Income needed to afford a typical new home: $181,473
- Median household income: $66,301
35. Milwaukee-Waukesha, WI
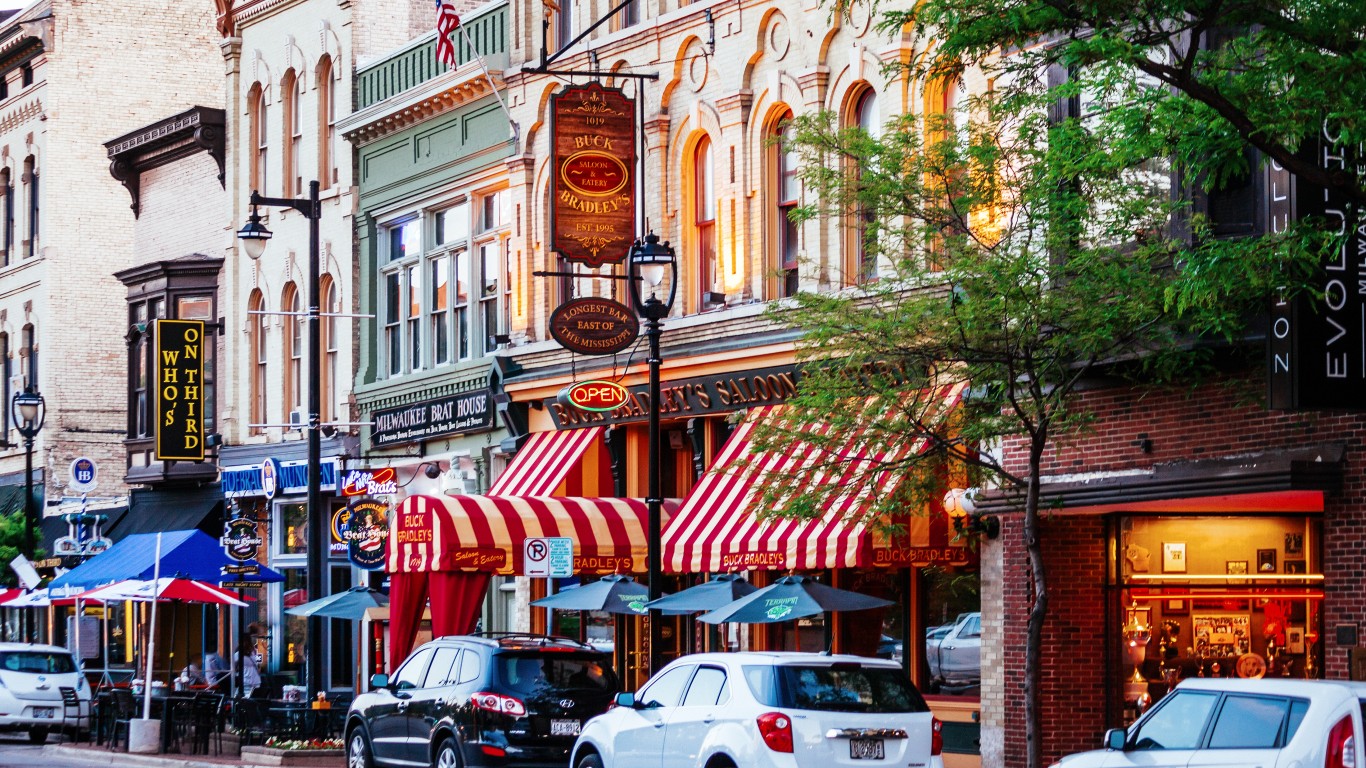
Source: peeterv / iStock via Getty Images
- Households unable to afford a new, median priced home: 88.0% (585,548 total)
- Median new home price: $631,067
- Income needed to afford a typical new home: $204,115
- Median household income: $70,898
34. Eugene-Springfield, OR

Source: Sean Pavone / iStock via Getty Images
- Households unable to afford a new, median priced home: 88.0% (141,400 total)
- Median new home price: $584,170
- Income needed to afford a typical new home: $173,827
- Median household income: $64,069
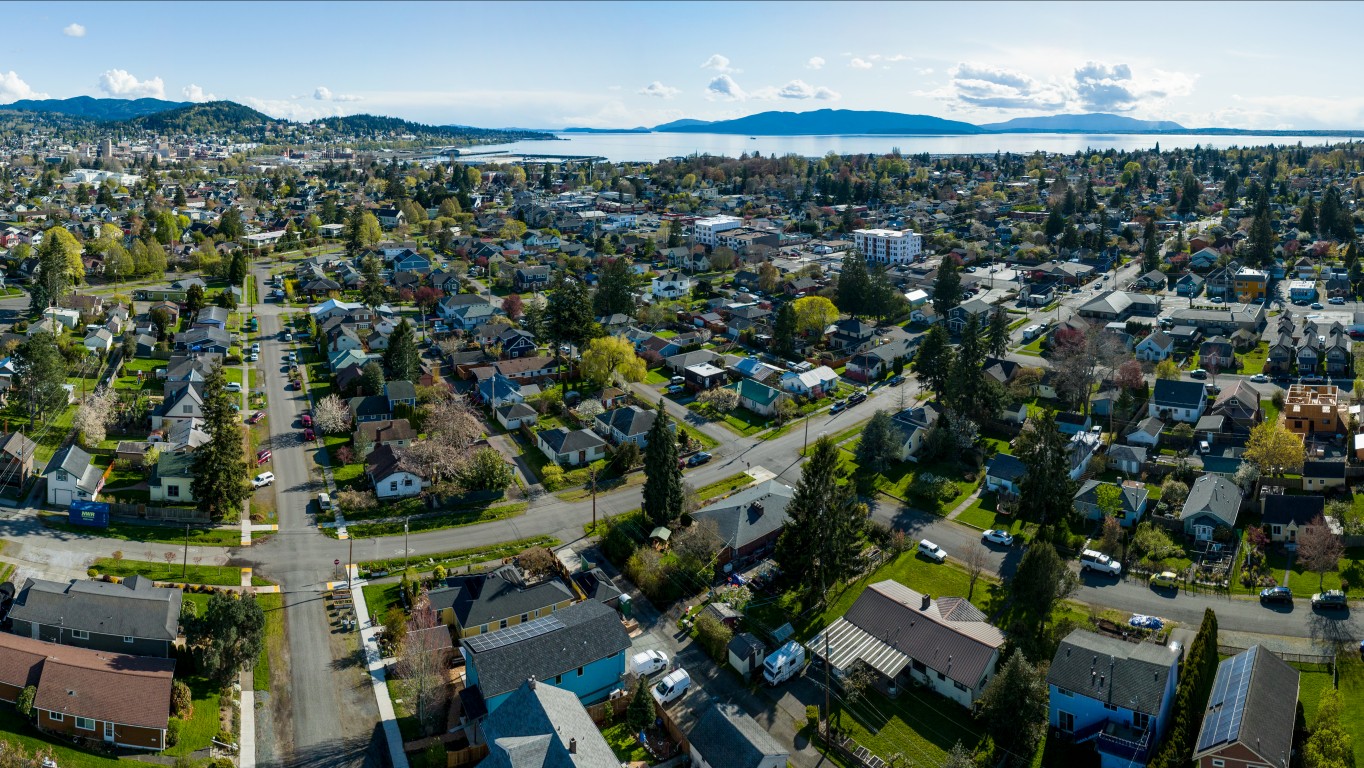
33. Bellingham, WA
Source: SEASTOCK / iStock via Getty Images
- Households unable to afford a new, median priced home: 88.1% (88,341 total)
- Median new home price: $679,288
- Income needed to afford a typical new home: $198,576
- Median household income: $79,220
32. Providence-Warwick, RI-MA

Source: SeanPavonePhoto / iStock via Getty Images
- Households unable to afford a new, median priced home: 88.2% (610,821 total)
- Median new home price: $692,990
- Income needed to afford a typical new home: $219,606
- Median household income: $81,784
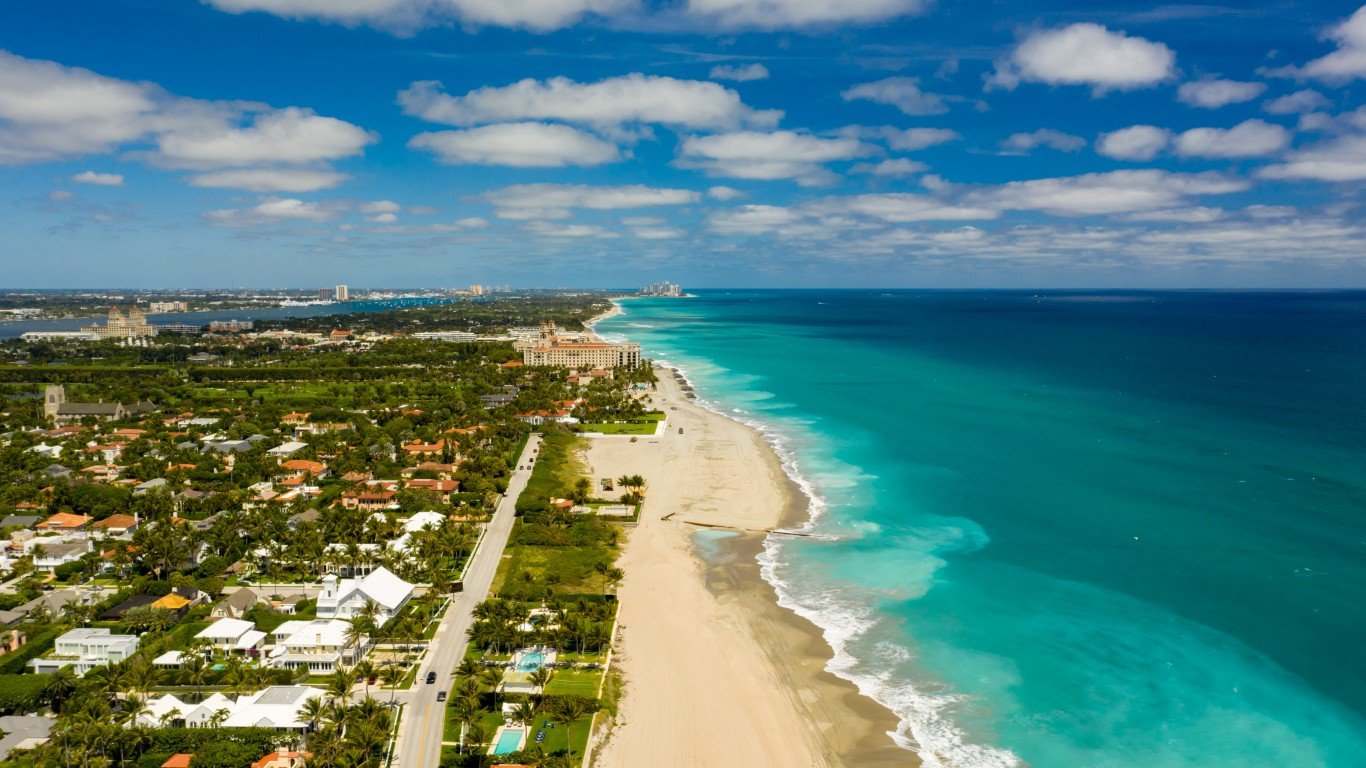
31. West Palm Beach-Boca Raton-Boynton Beach, FL
Source: felixmizioznikov / iStock via Getty Images
- Households unable to afford a new, median priced home: 88.2% (557,764 total)
- Median new home price: $800,968
- Income needed to afford a typical new home: $248,960
- Median household income: N/A
30. El Paso, TX

Source: Sean Pavone / iStock via Getty Images
- Households unable to afford a new, median priced home: 88.4% (270,523 total)
- Median new home price: $448,698
- Income needed to afford a typical new home: $158,426
- Median household income: $53,359
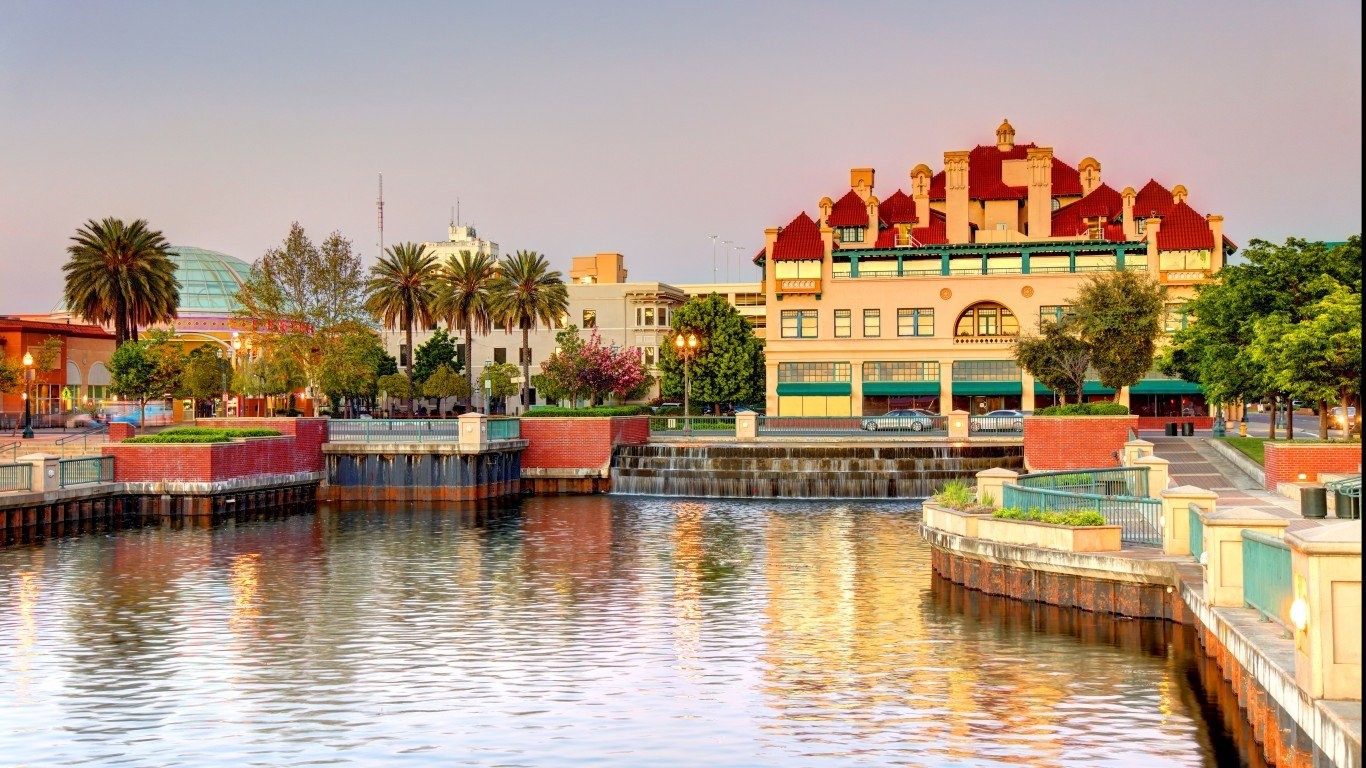
29. Stockton, CA
Source: DenisTangneyJr / iStock via Getty Images
- Households unable to afford a new, median priced home: 88.6% (214,604 total)
- Median new home price: $781,037
- Income needed to afford a typical new home: $229,968
- Median household income: $86,056
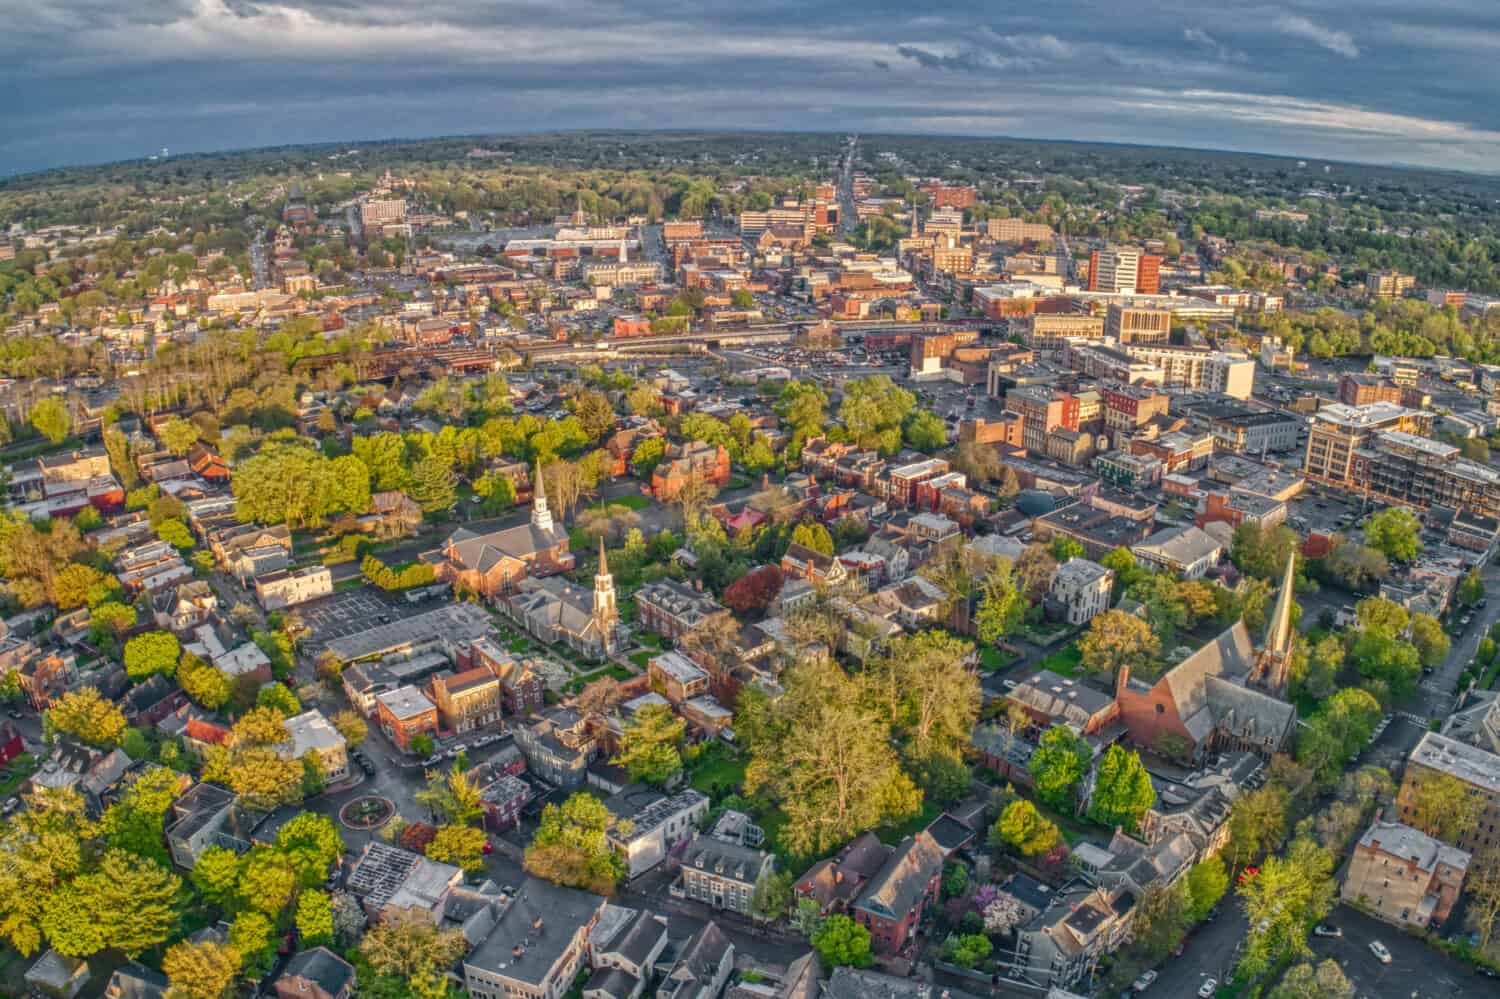
28. Albany-Schenectady-Troy, NY
Source: Jacob Boomsma / Shutterstock.com
- Households unable to afford a new, median priced home: 88.6% (339,779 total)
- Median new home price: $635,072
- Income needed to afford a typical new home: $214,816
- Median household income: $80,970
27. College Station-Bryan, TX

Source: TriciaDaniel / iStock via Getty Images
- Households unable to afford a new, median priced home: 88.8% (116,352 total)
- Median new home price: $444,164
- Income needed to afford a typical new home: $147,869
- Median household income: $60,804
26. Portland-South Portland, ME
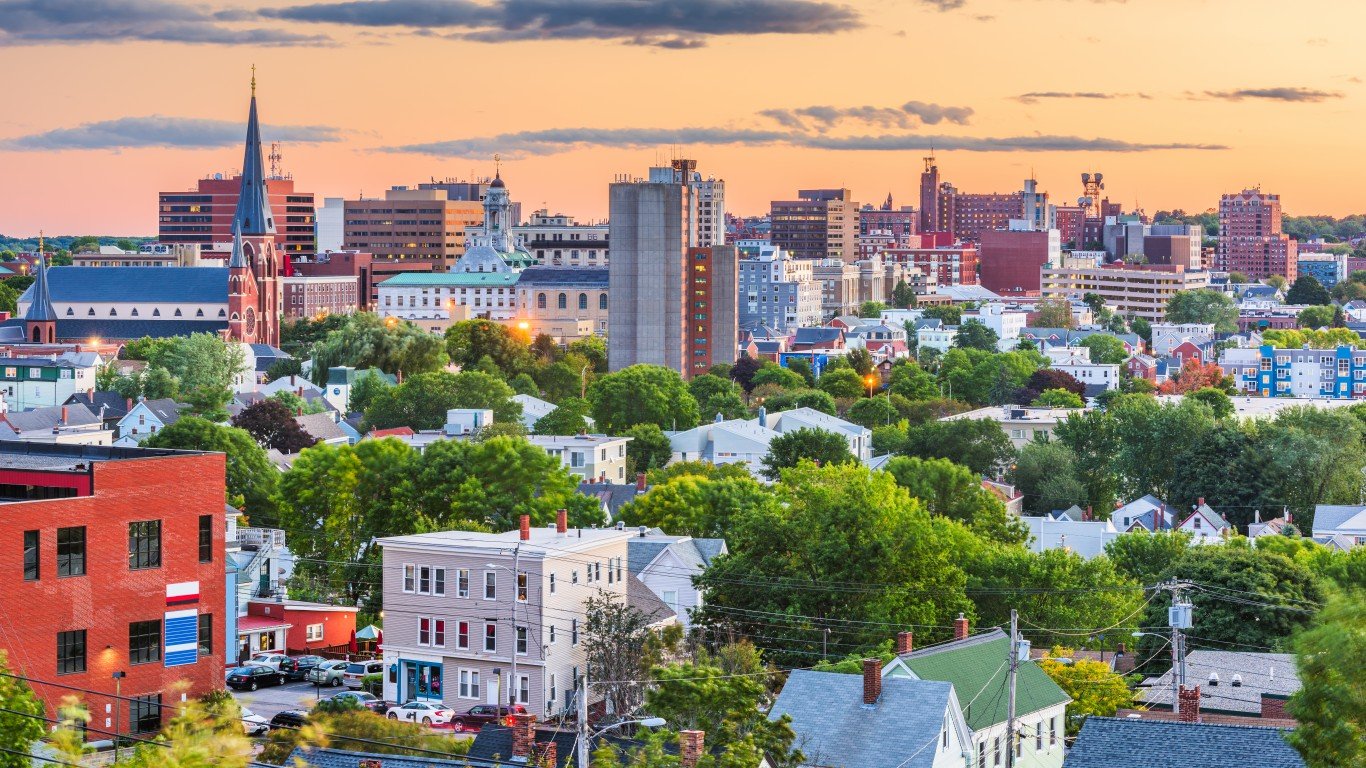
Source: Sean Pavone / iStock via Getty Images
- Households unable to afford a new, median priced home: 88.9% (225,296 total)
- Median new home price: $764,729
- Income needed to afford a typical new home: $233,420
- Median household income: $84,312
25. Deltona-Daytona Beach-Ormond Beach, FL
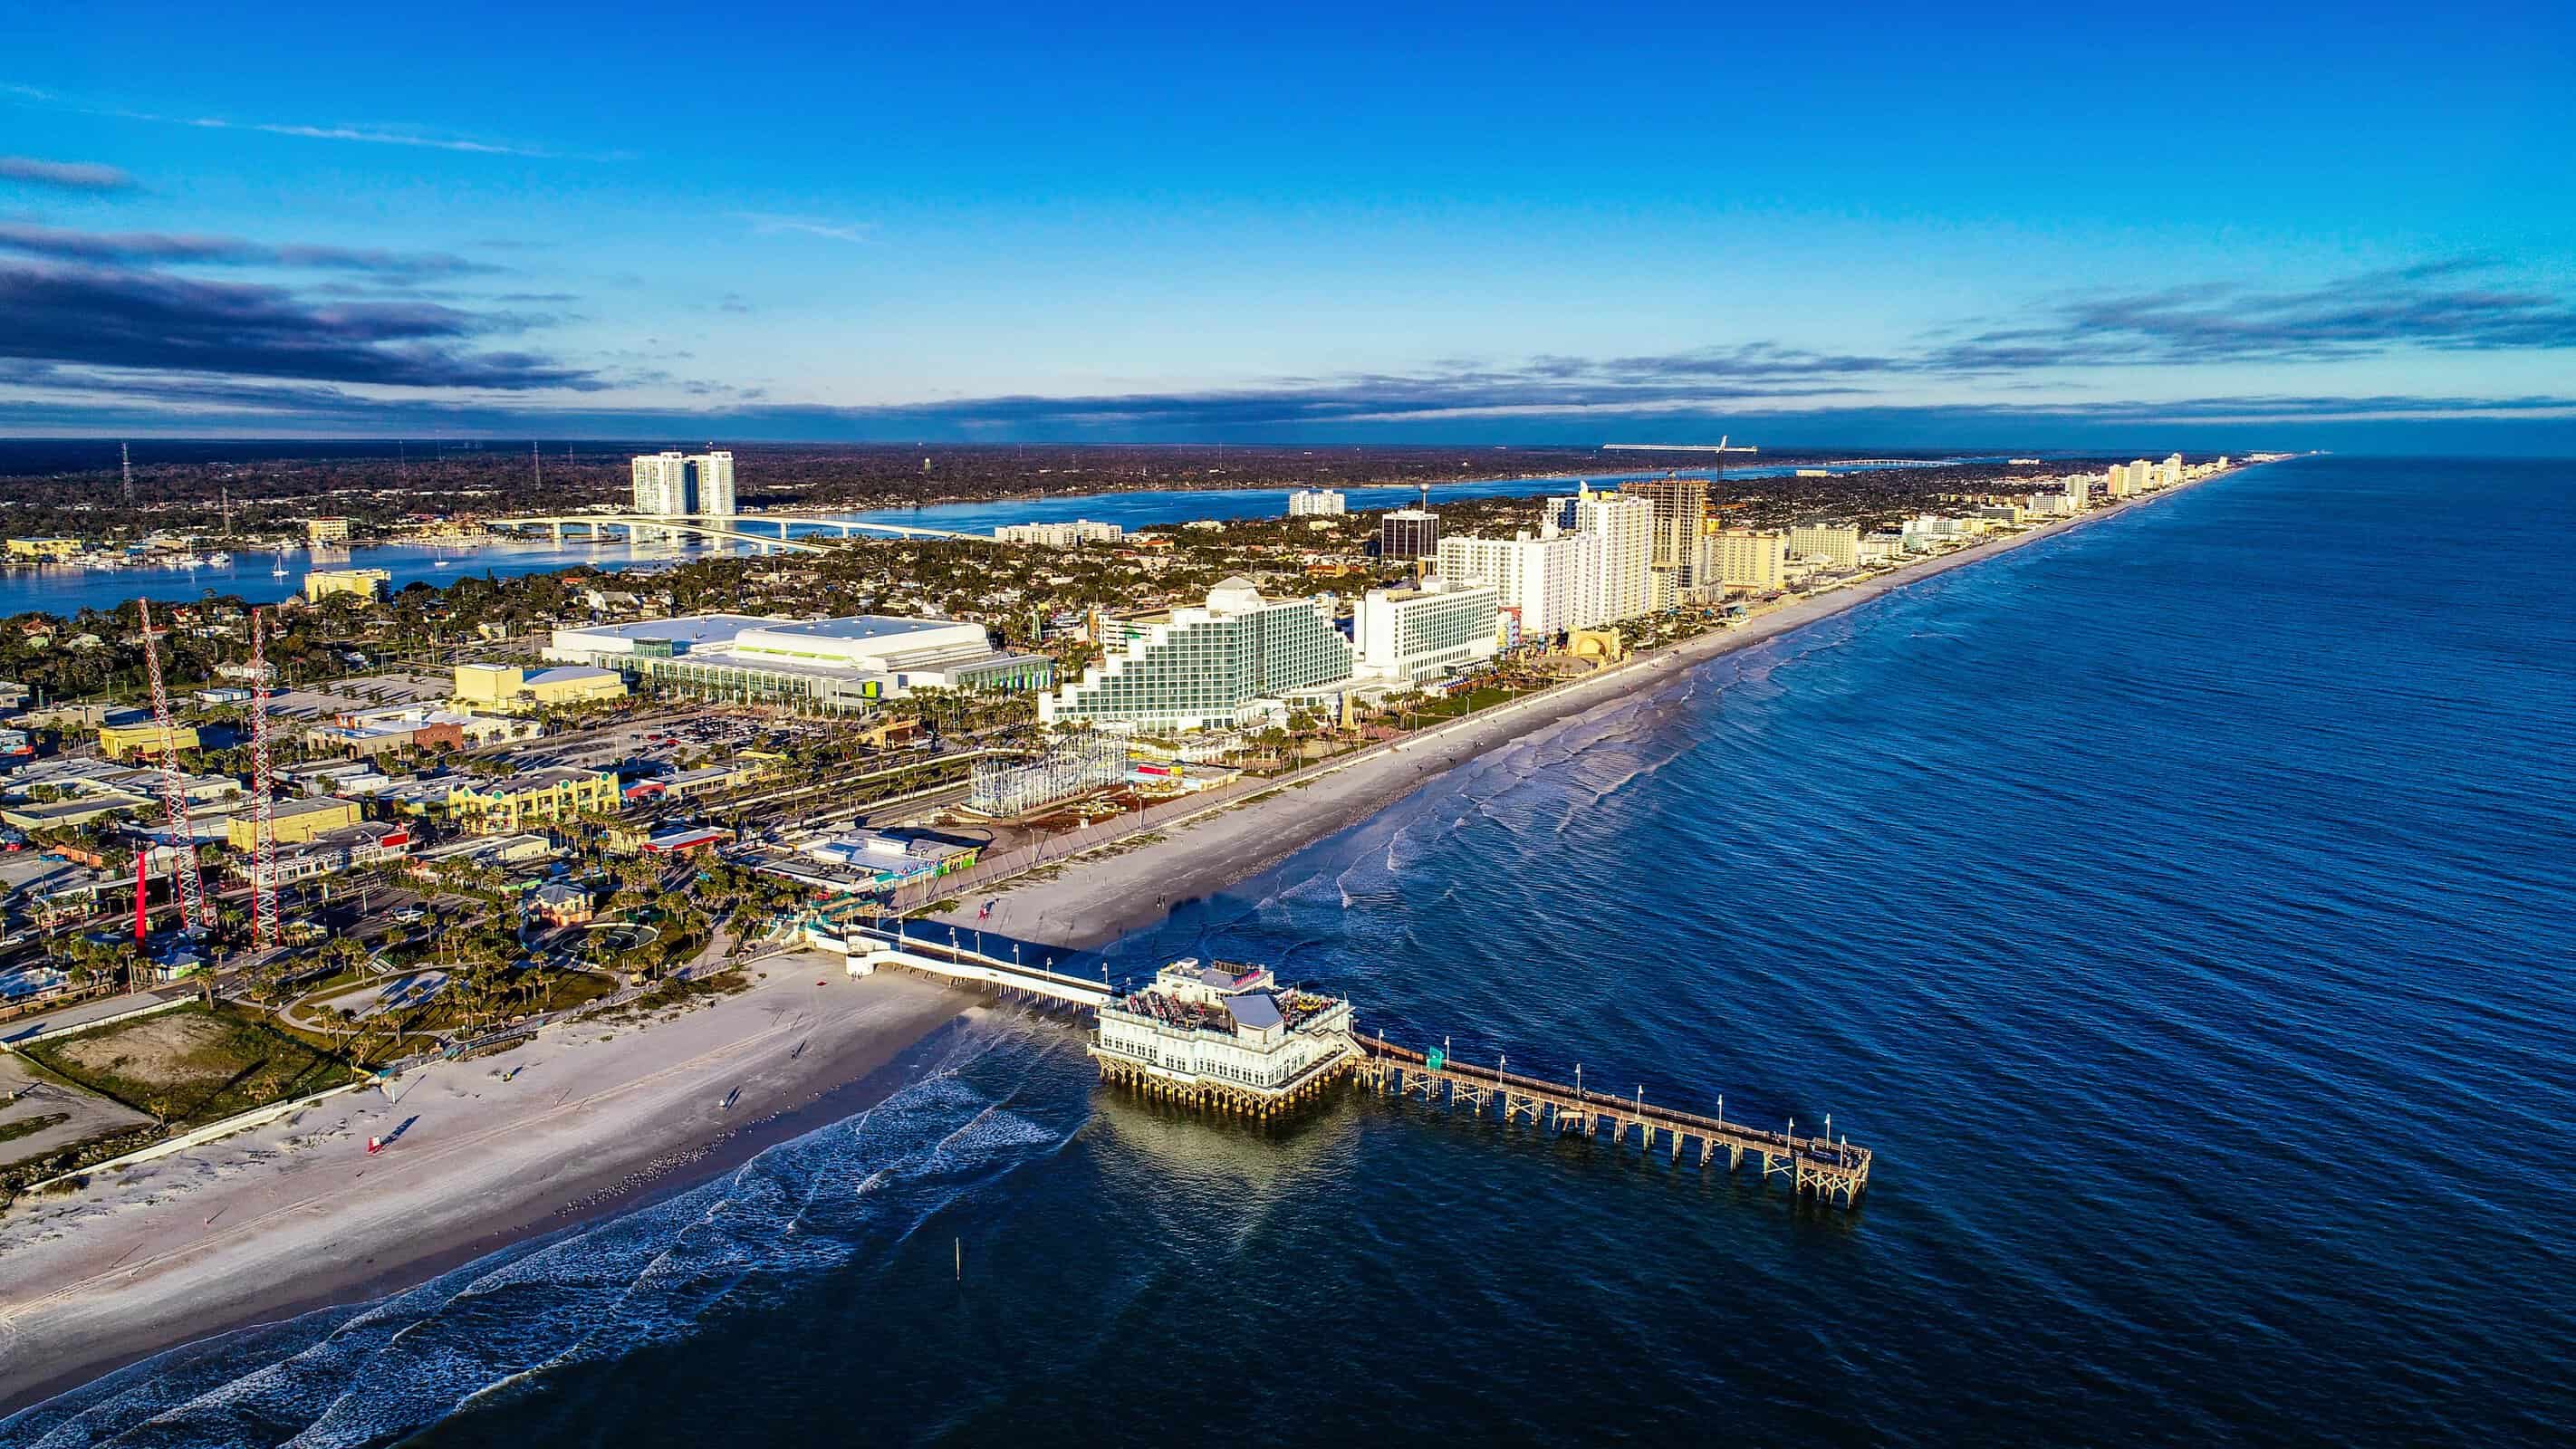
Source: Kruck20 / iStock via Getty Images
- Households unable to afford a new, median priced home: 88.9% (271,927 total)
- Median new home price: $554,573
- Income needed to afford a typical new home: $169,534
- Median household income: $65,889
24. New Orleans-Metairie, LA

Source: f11photo / iStock via Getty Images
- Households unable to afford a new, median priced home: 89.0% (430,993 total)
- Median new home price: $587,334
- Income needed to afford a typical new home: $182,918
- Median household income: $61,602
23. Kalamazoo-Portage, MI

Source: RudyBalasko / iStock via Getty Images
- Households unable to afford a new, median priced home: 89.0% (101,563 total)
- Median new home price: $510,601
- Income needed to afford a typical new home: $167,657
- Median household income: $69,584
22. Spokane-Spokane Valley, WA

Source: benedek / iStock via Getty Images
- Households unable to afford a new, median priced home: 89.1% (219,966 total)
- Median new home price: $602,498
- Income needed to afford a typical new home: $179,644
- Median household income: $68,829
21. Bakersfield, CA
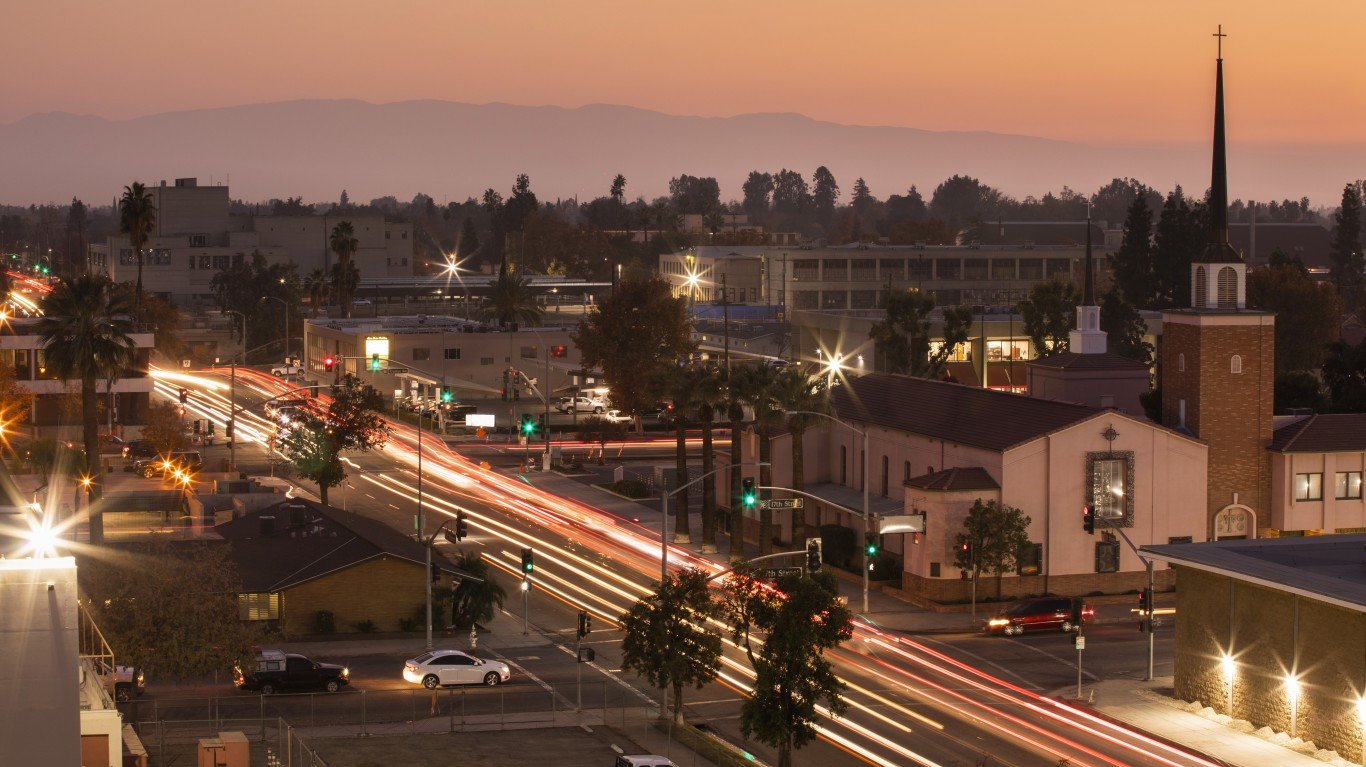
Source: MattGush / iStock via Getty Images
- Households unable to afford a new, median priced home: 89.4% (254,340 total)
- Median new home price: $572,207
- Income needed to afford a typical new home: $172,448
- Median household income: $66,234
20. Olympia-Lacey-Tumwater, WA
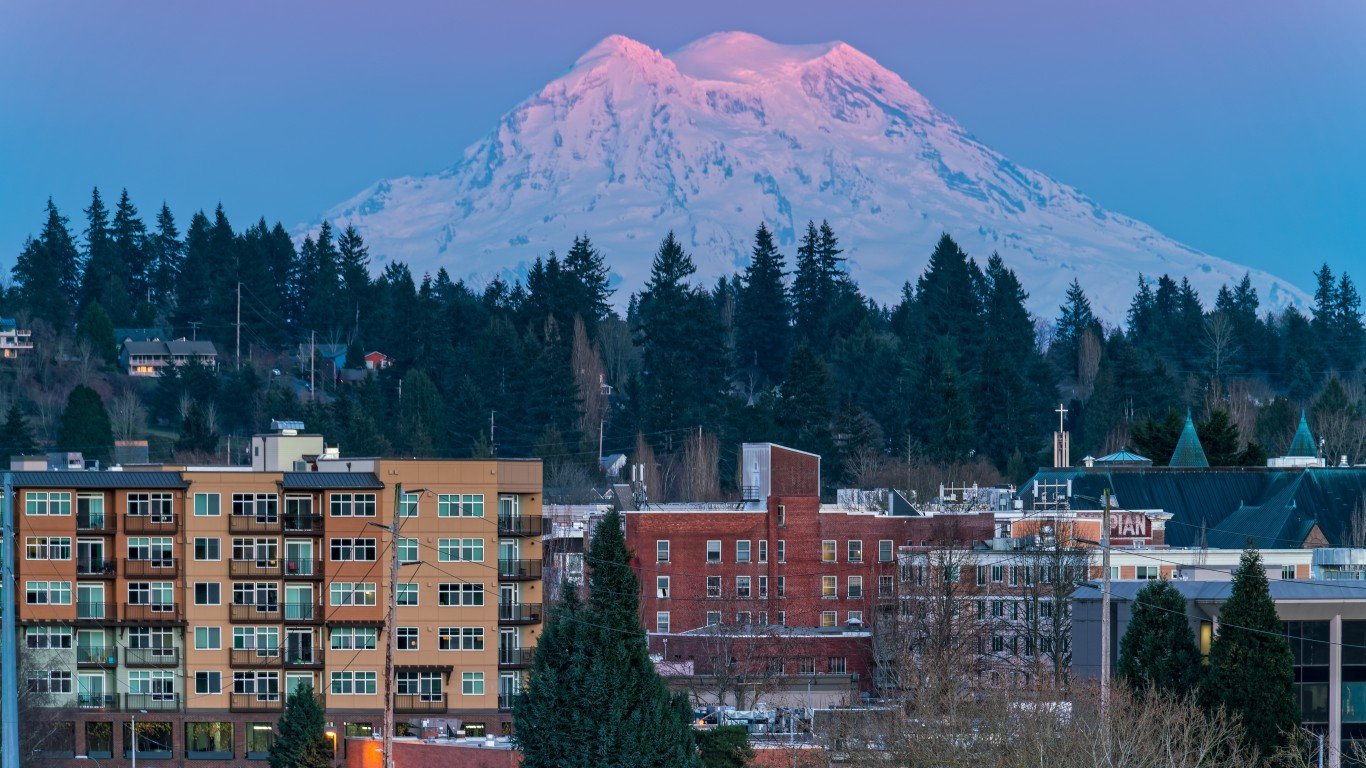
Source: John Callery / iStock via Getty Images
- Households unable to afford a new, median priced home: 89.5% (108,604 total)
- Median new home price: $581,842
- Income needed to afford a typical new home: $173,648
- Median household income: $88,853
19. Detroit-Dearborn-Livonia, MI
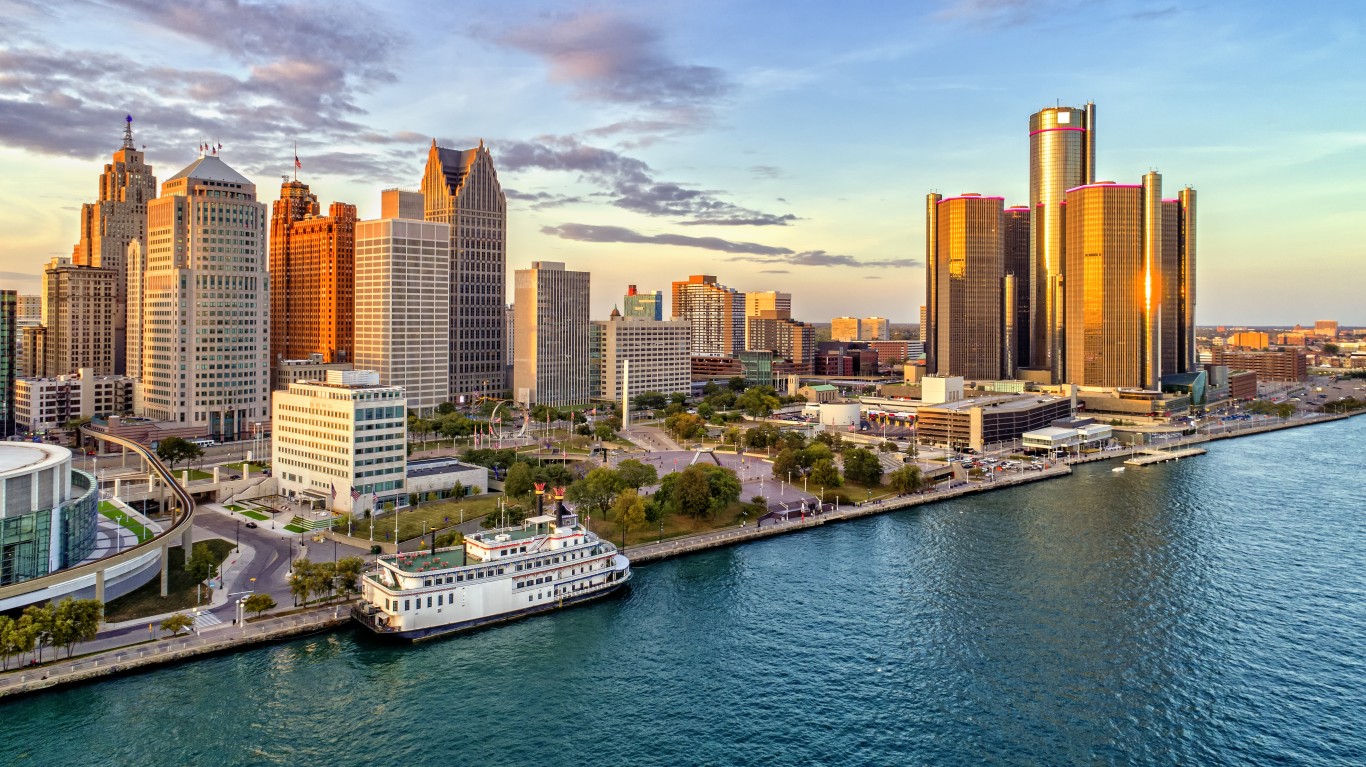
Source: pawel.gaul / E+ via Getty Images
- Households unable to afford a new, median priced home: 89.5% (612,466 total)
- Median new home price: $551,430
- Income needed to afford a typical new home: $184,276
- Median household income: N/A
18. Rochester, NY

Source: DenisTangneyJr / iStock via Getty Images
- Households unable to afford a new, median priced home: 90.0% (415,137 total)
- Median new home price: $596,786
- Income needed to afford a typical new home: $217,099
- Median household income: $69,580
17. Springfield, MA

Source: Sean Pavone / iStock via Getty Images
- Households unable to afford a new, median priced home: 90.2% (254,200 total)
- Median new home price: $627,481
- Income needed to afford a typical new home: $204,718
- Median household income: $68,400
16. Fresno, CA
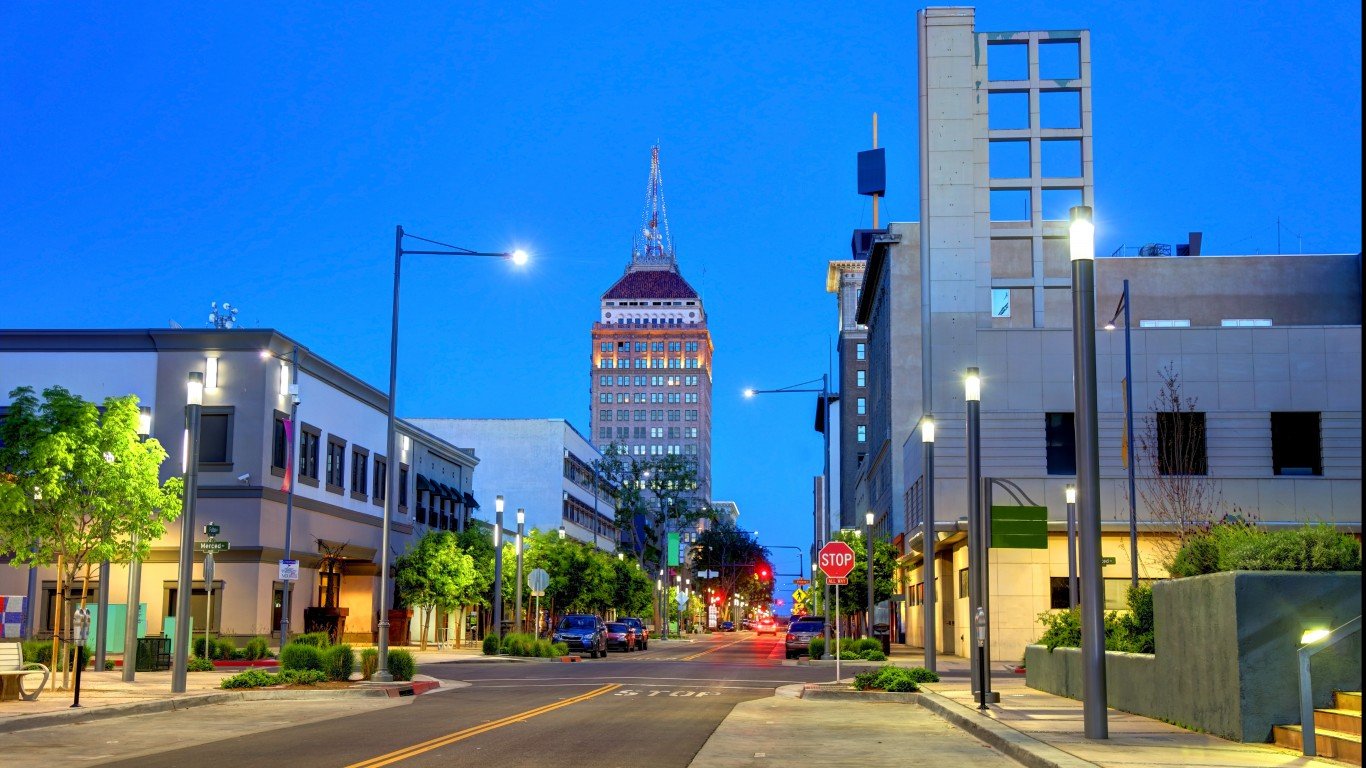
Source: DenisTangneyJr / iStock via Getty Images
- Households unable to afford a new, median priced home: 90.2% (302,855 total)
- Median new home price: $664,655
- Income needed to afford a typical new home: $197,157
- Median household income: $69,571
15. Tucson, AZ

Source: Sean Pavone / iStock via Getty Images
- Households unable to afford a new, median priced home: 90.3% (400,173 total)
- Median new home price: $643,201
- Income needed to afford a typical new home: $189,274
- Median household income: $64,014
14. Shreveport-Bossier City, LA

Source: Sean Pavone / iStock via Getty Images
- Households unable to afford a new, median priced home: 90.4% (144,534 total)
- Median new home price: $508,698
- Income needed to afford a typical new home: $156,074
- Median household income: $52,775
13. Crestview-Fort Walton Beach-Destin, FL
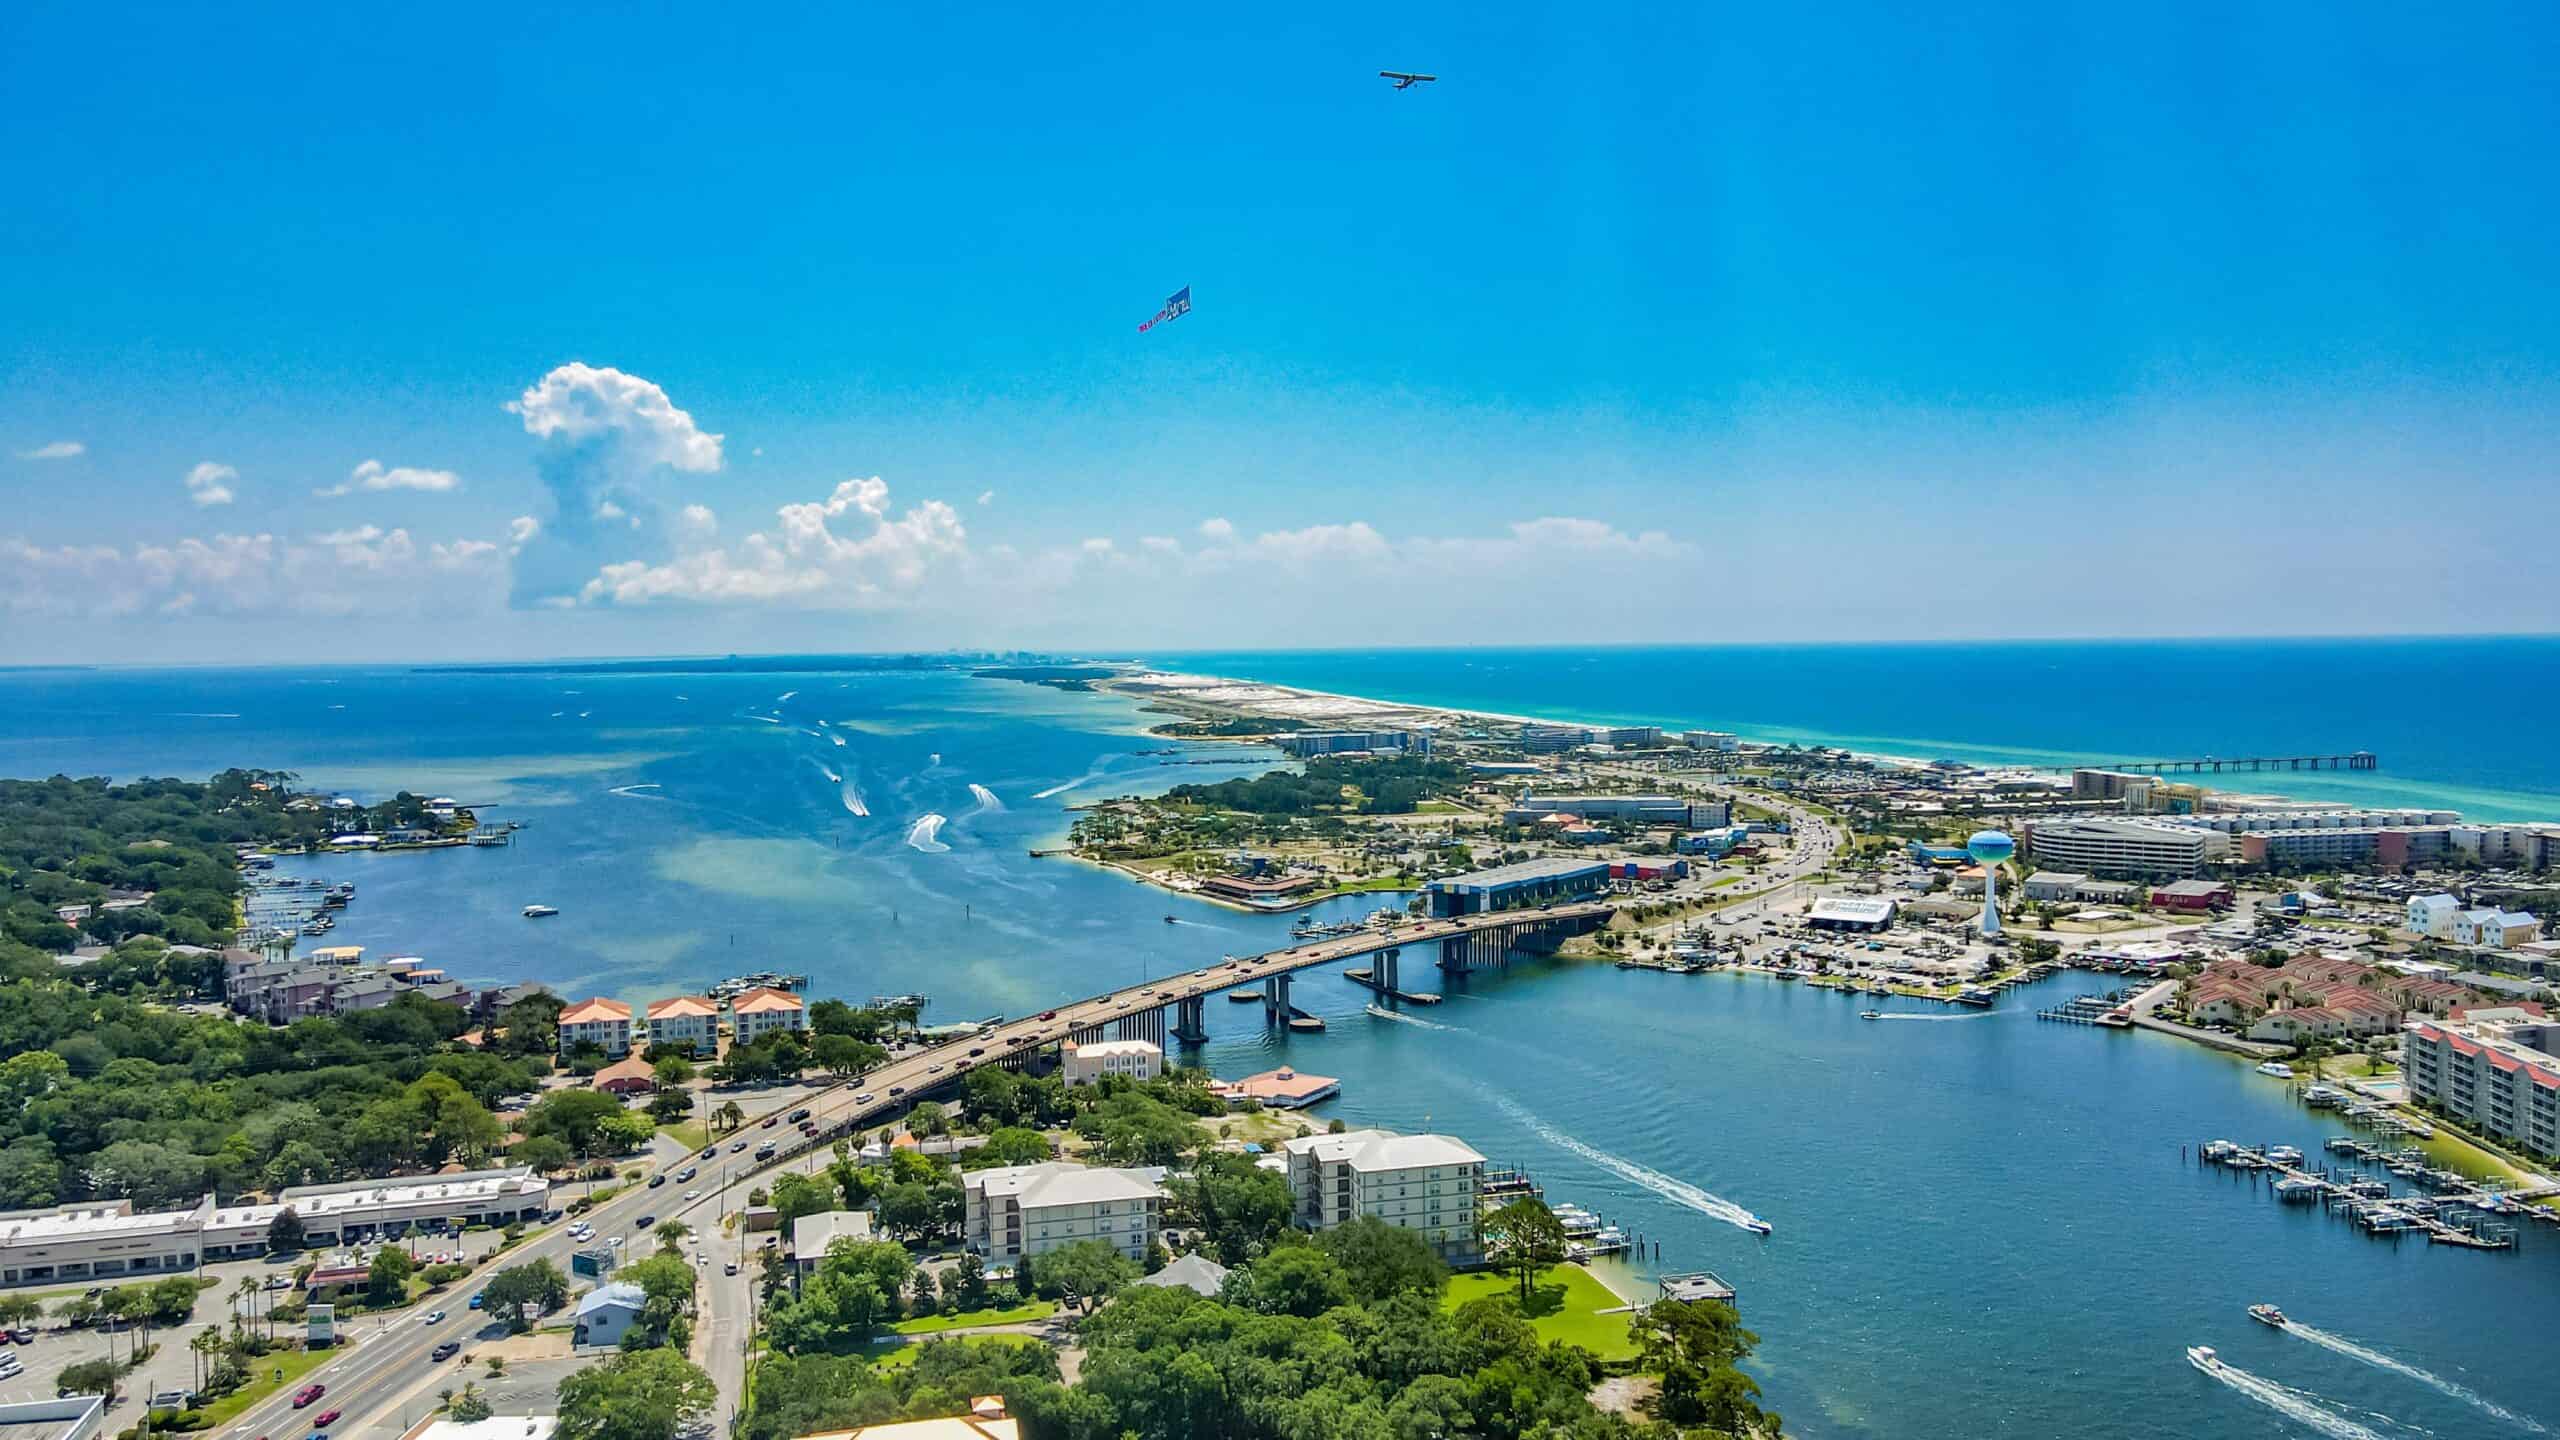
Source: WanderDrone / iStock via Getty Images
- Households unable to afford a new, median priced home: 90.5% (121,813 total)
- Median new home price: $778,786
- Income needed to afford a typical new home: $232,313
- Median household income: $76,945
12. Miami-Fort Lauderdale-Pompano Beach, FL
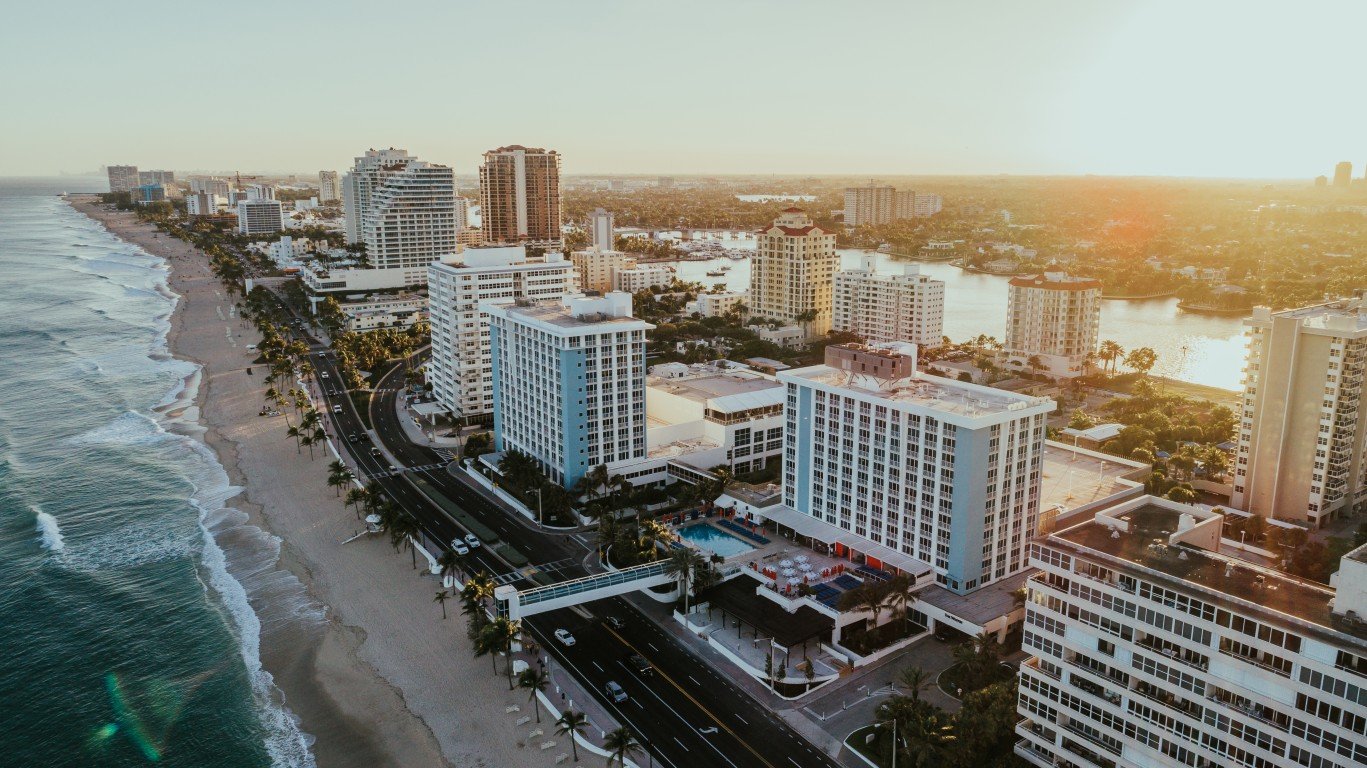
Source: GabrielPevide / E+ via Getty Images
- Households unable to afford a new, median priced home: 90.6% (2,192,452 total)
- Median new home price: $861,995
- Income needed to afford a typical new home: $268,972
- Median household income: $70,769
11. Palm Bay-Melbourne-Titusville, FL

- Households unable to afford a new, median priced home: 90.9% (235,069 total)
- Median new home price: $621,238
- Income needed to afford a typical new home: $188,786
- Median household income: $75,320
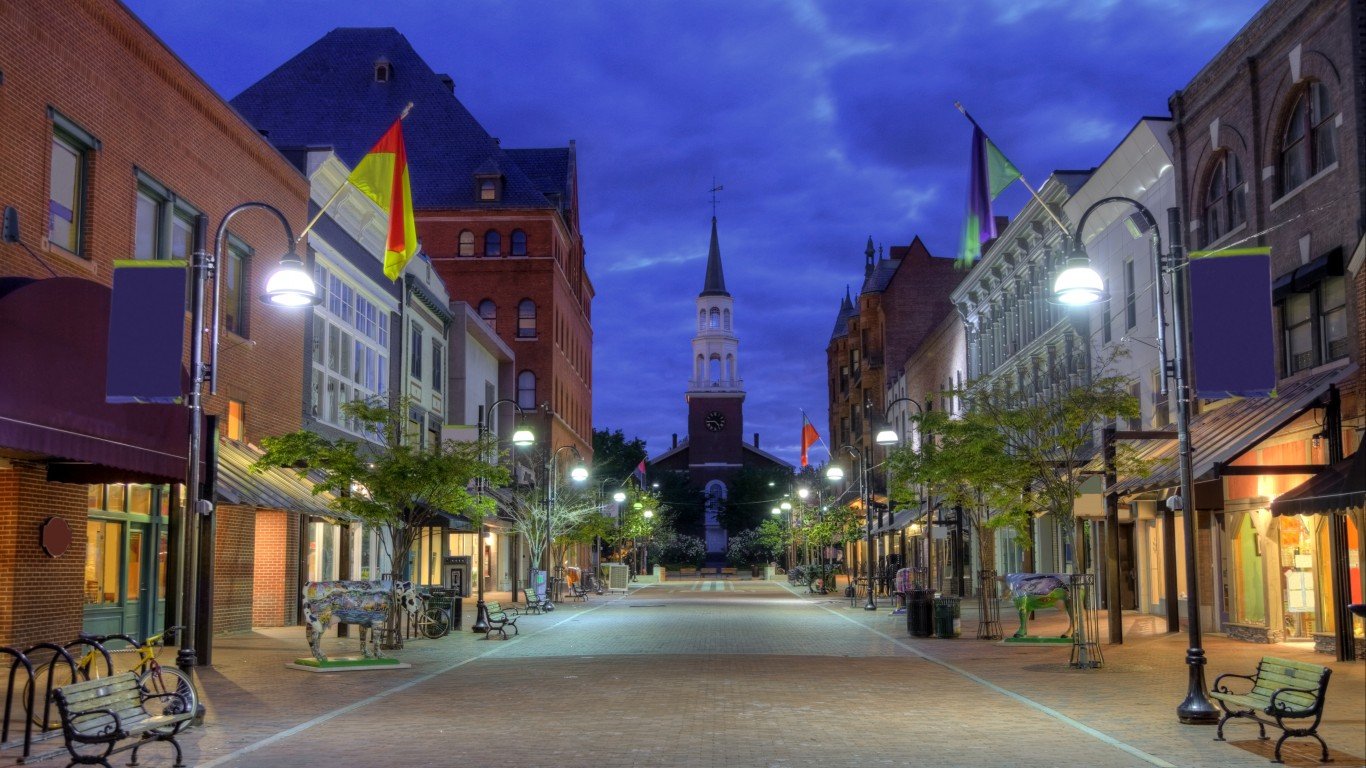
10. Burlington-South Burlington, VT
Source: DenisTangneyJr / E+ via Getty Images
- Households unable to afford a new, median priced home: 90.9% (96,125 total)
- Median new home price: $782,780
- Income needed to afford a typical new home: $255,025
- Median household income: $83,707
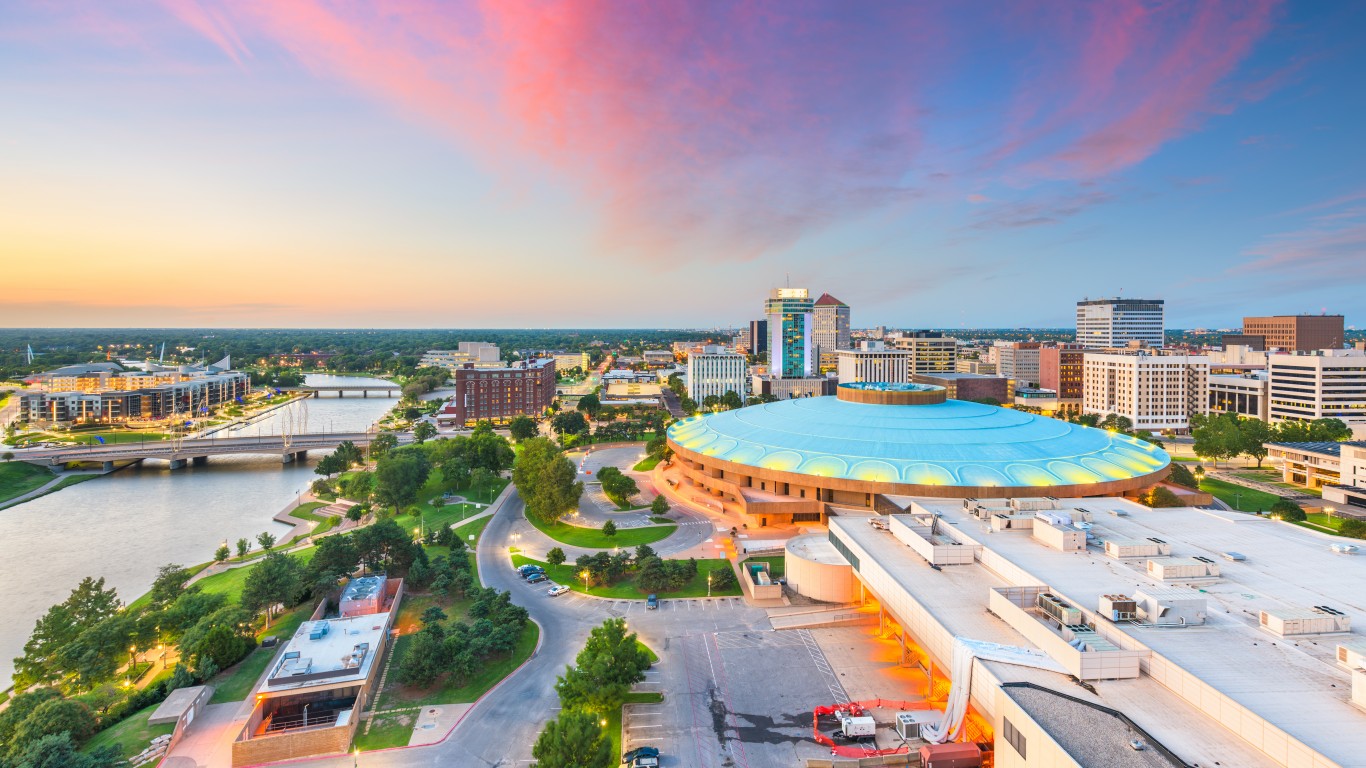
9. Wichita, KS
Source: Sean Pavone / iStock via Getty Images
- Households unable to afford a new, median priced home: 91.2% (235,550 total)
- Median new home price: $549,032
- Income needed to afford a typical new home: $183,529
- Median household income: $67,012
8. Barnstable Town, MA
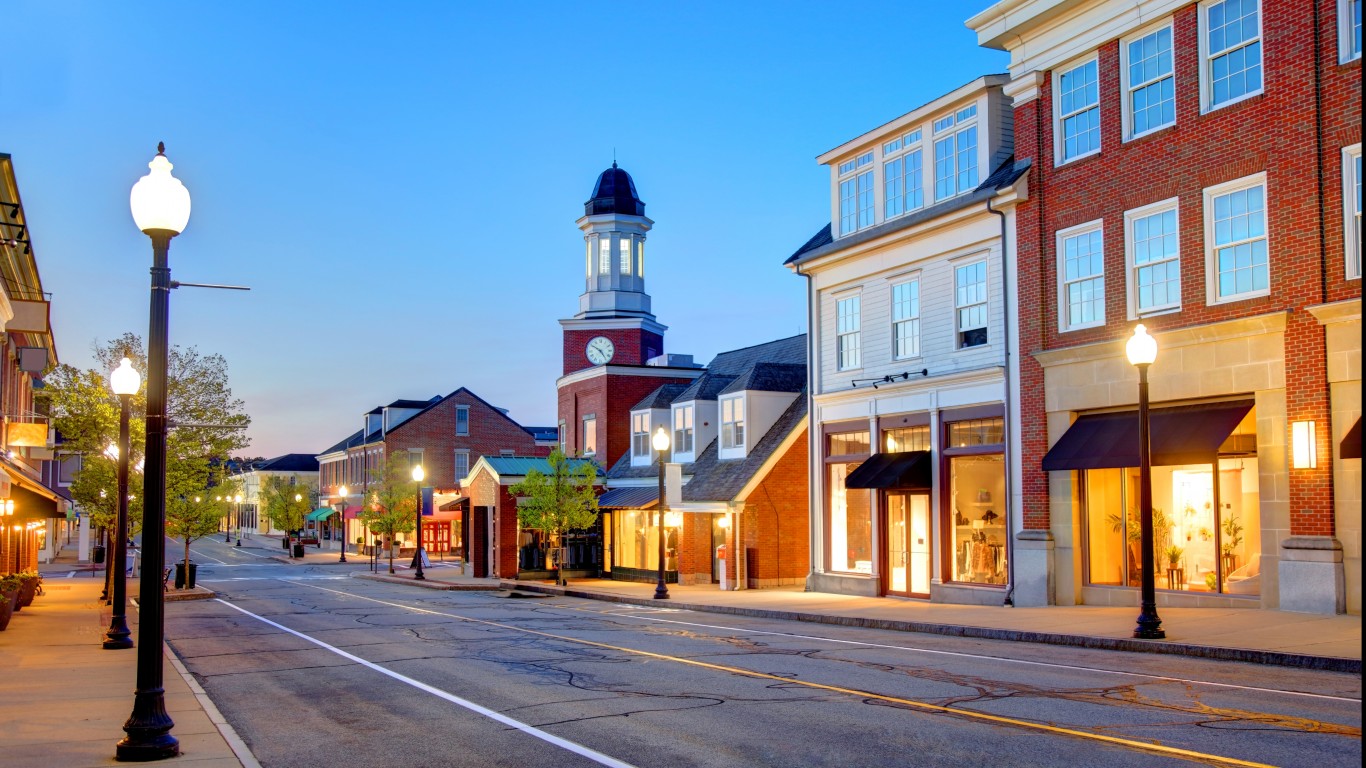
Source: DenisTangneyJr / iStock via Getty Images
- Households unable to afford a new, median priced home: 91.8% (103,111 total)
- Median new home price: $1,369,501
- Income needed to afford a typical new home: $405,991
- Median household income: $91,438
7. Miami-Miami Beach-Kendall, FL
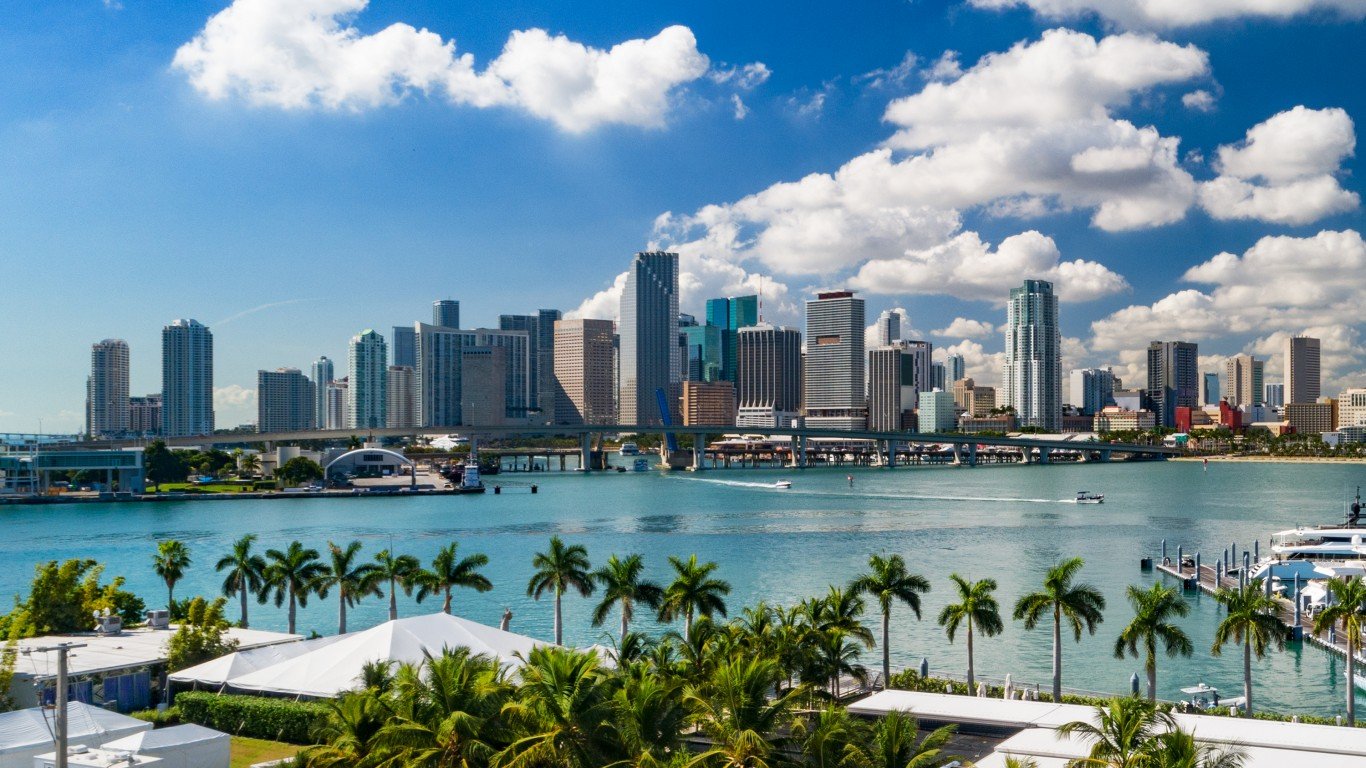
Source: Davel5957 / iStock via Getty Images
- Households unable to afford a new, median priced home: 92.3% (945,805 total)
- Median new home price: $896,352
- Income needed to afford a typical new home: $278,581
- Median household income: N/A
6. Buffalo-Cheektowaga, NY
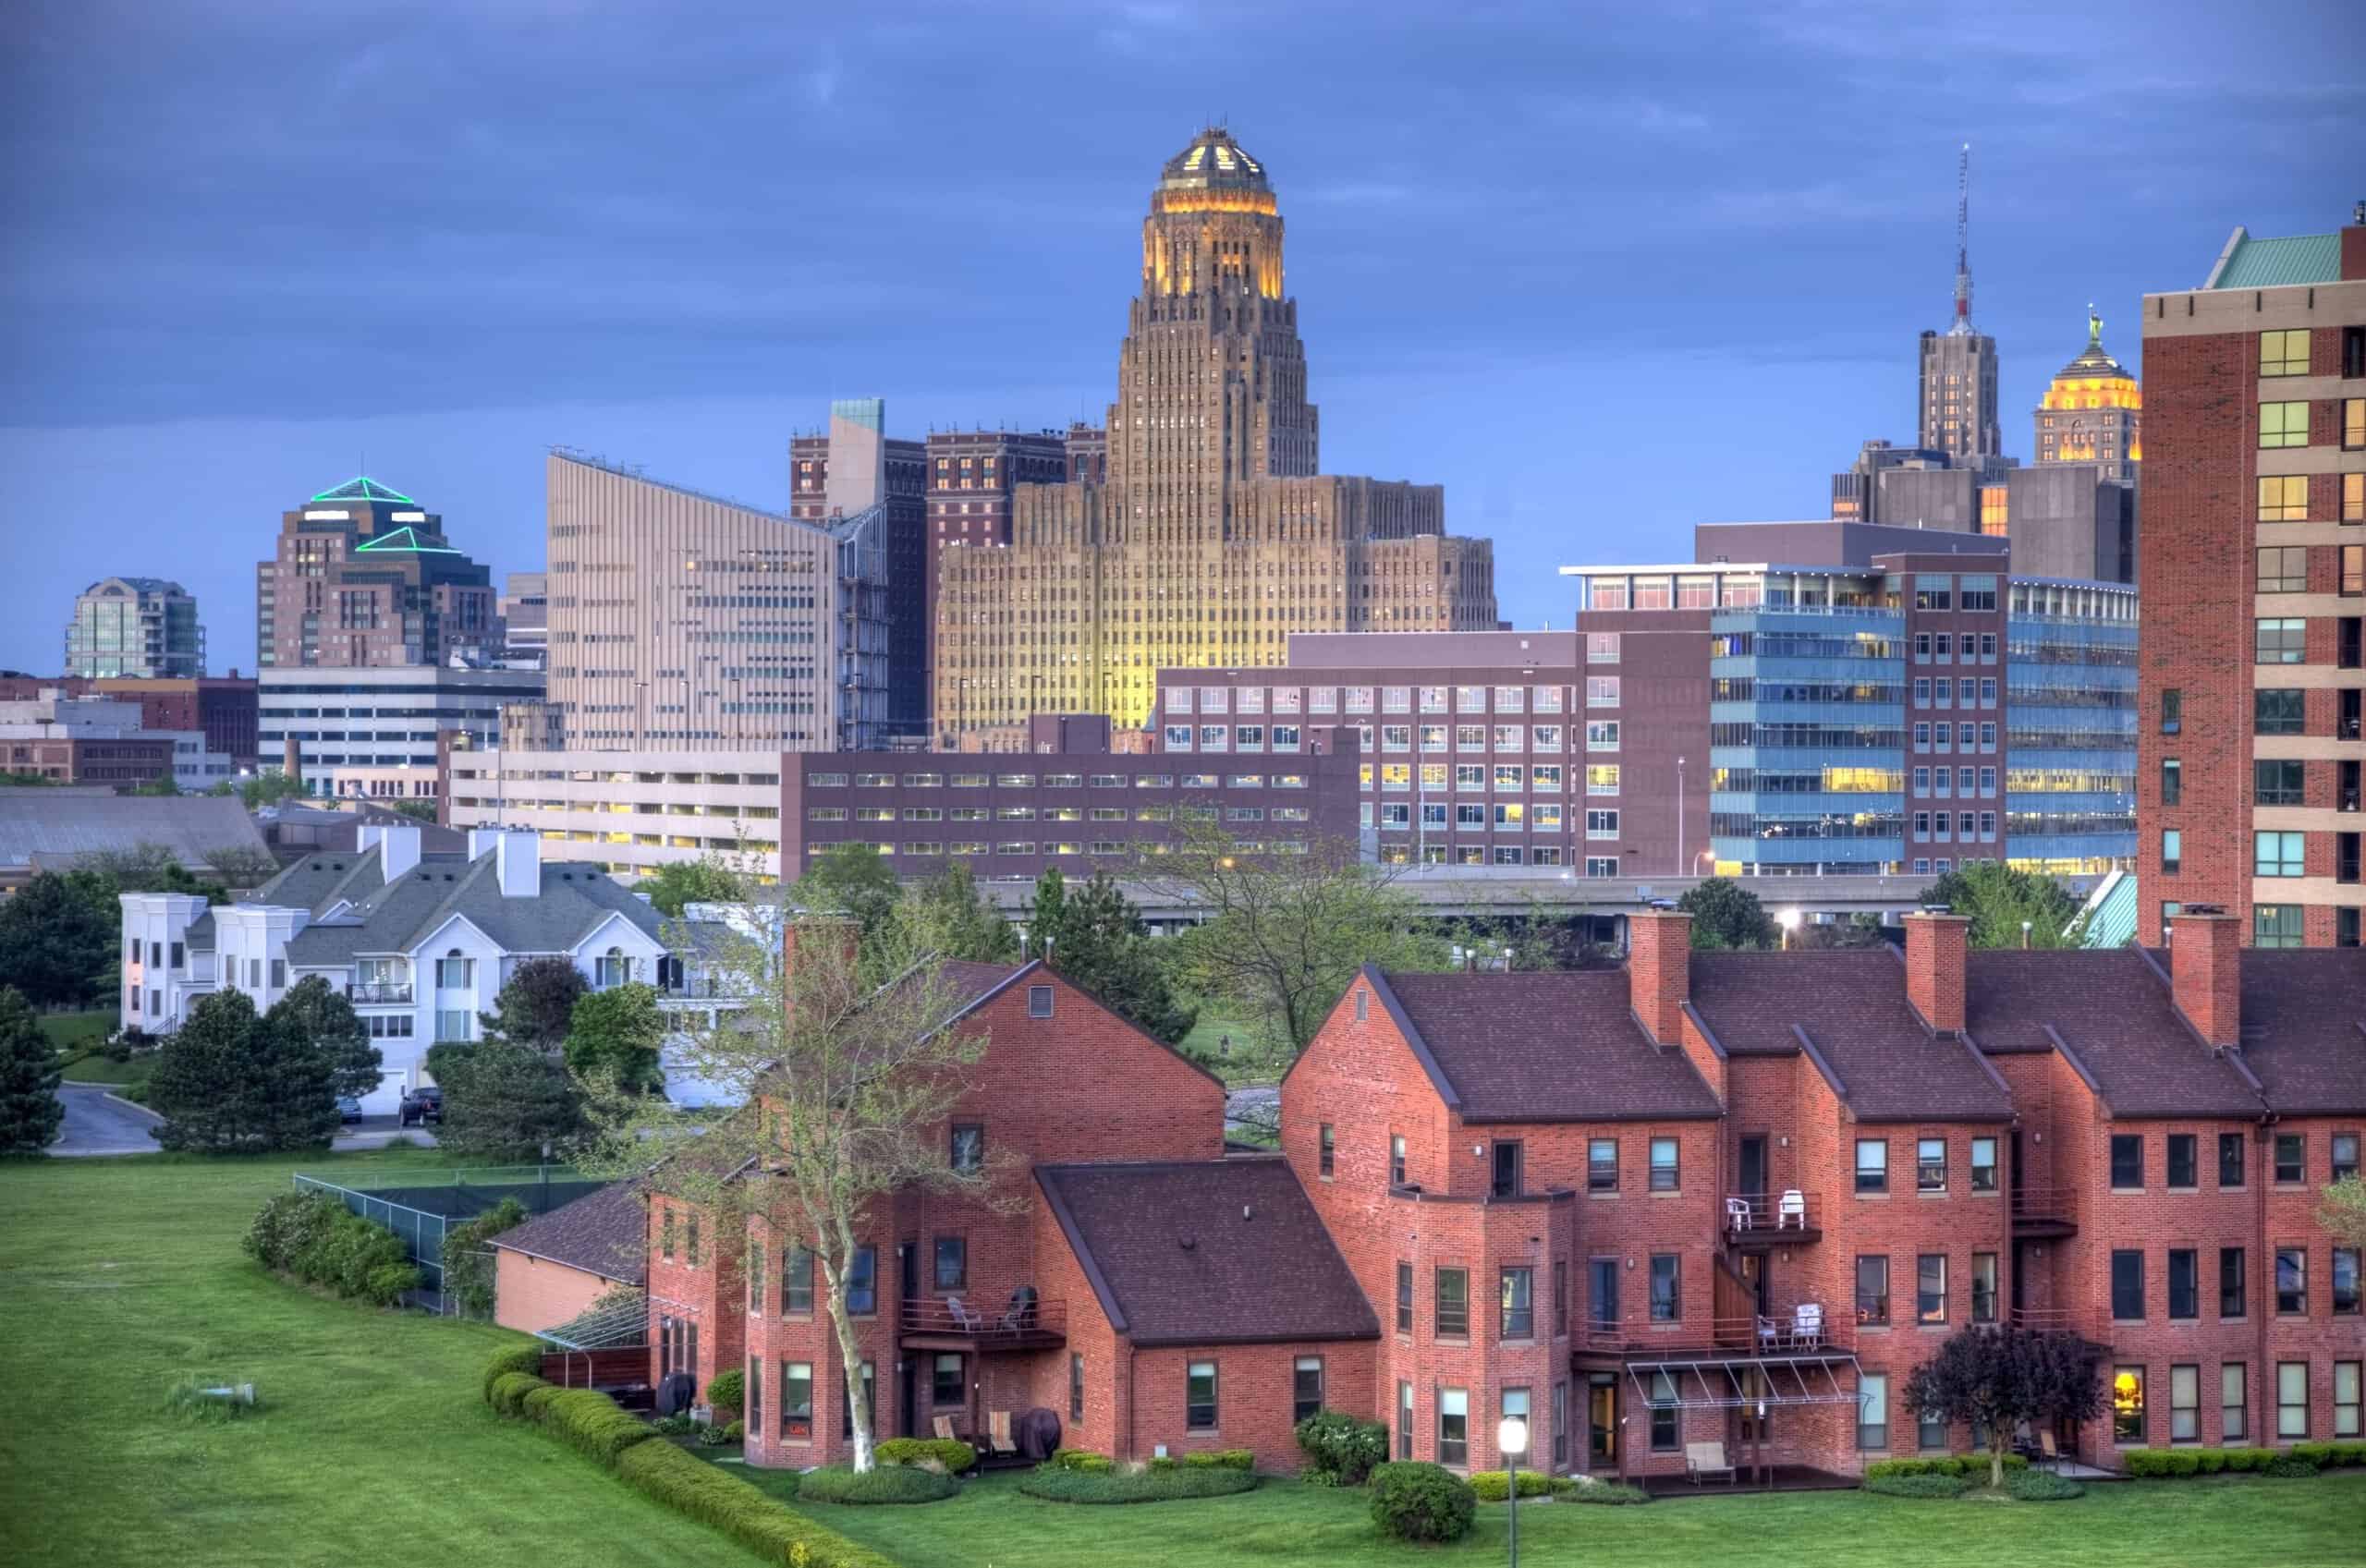
Source: DenisTangneyJr / E+ via Getty Images
- Households unable to afford a new, median priced home: 92.3% (469,530 total)
- Median new home price: $674,076
- Income needed to afford a typical new home: $231,238
- Median household income: $68,698
5. Utica-Rome, NY
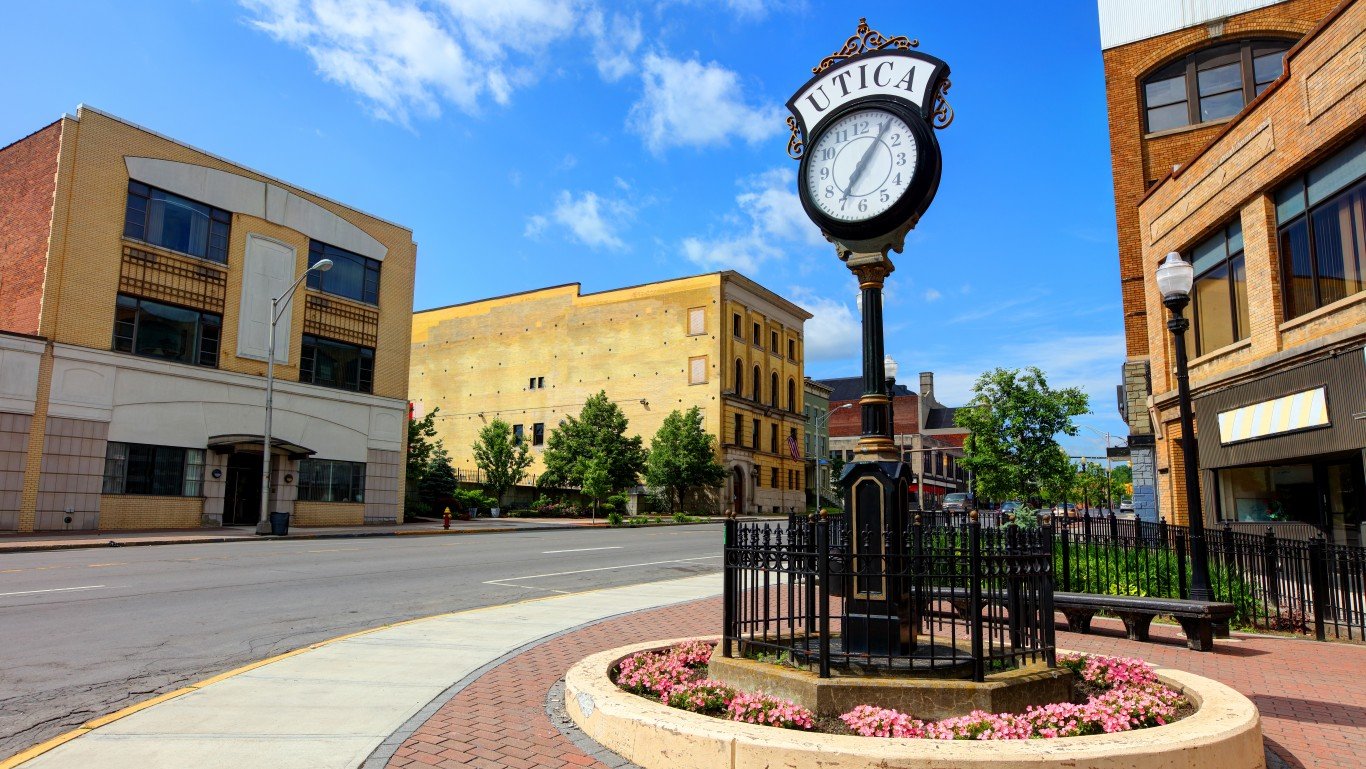
Source: DenisTangneyJr / iStock via Getty Images
- Households unable to afford a new, median priced home: 92.6% (124,600 total)
- Median new home price: $577,400
- Income needed to afford a typical new home: $201,775
- Median household income: $64,203
4. San Jose-Sunnyvale-Santa Clara, CA
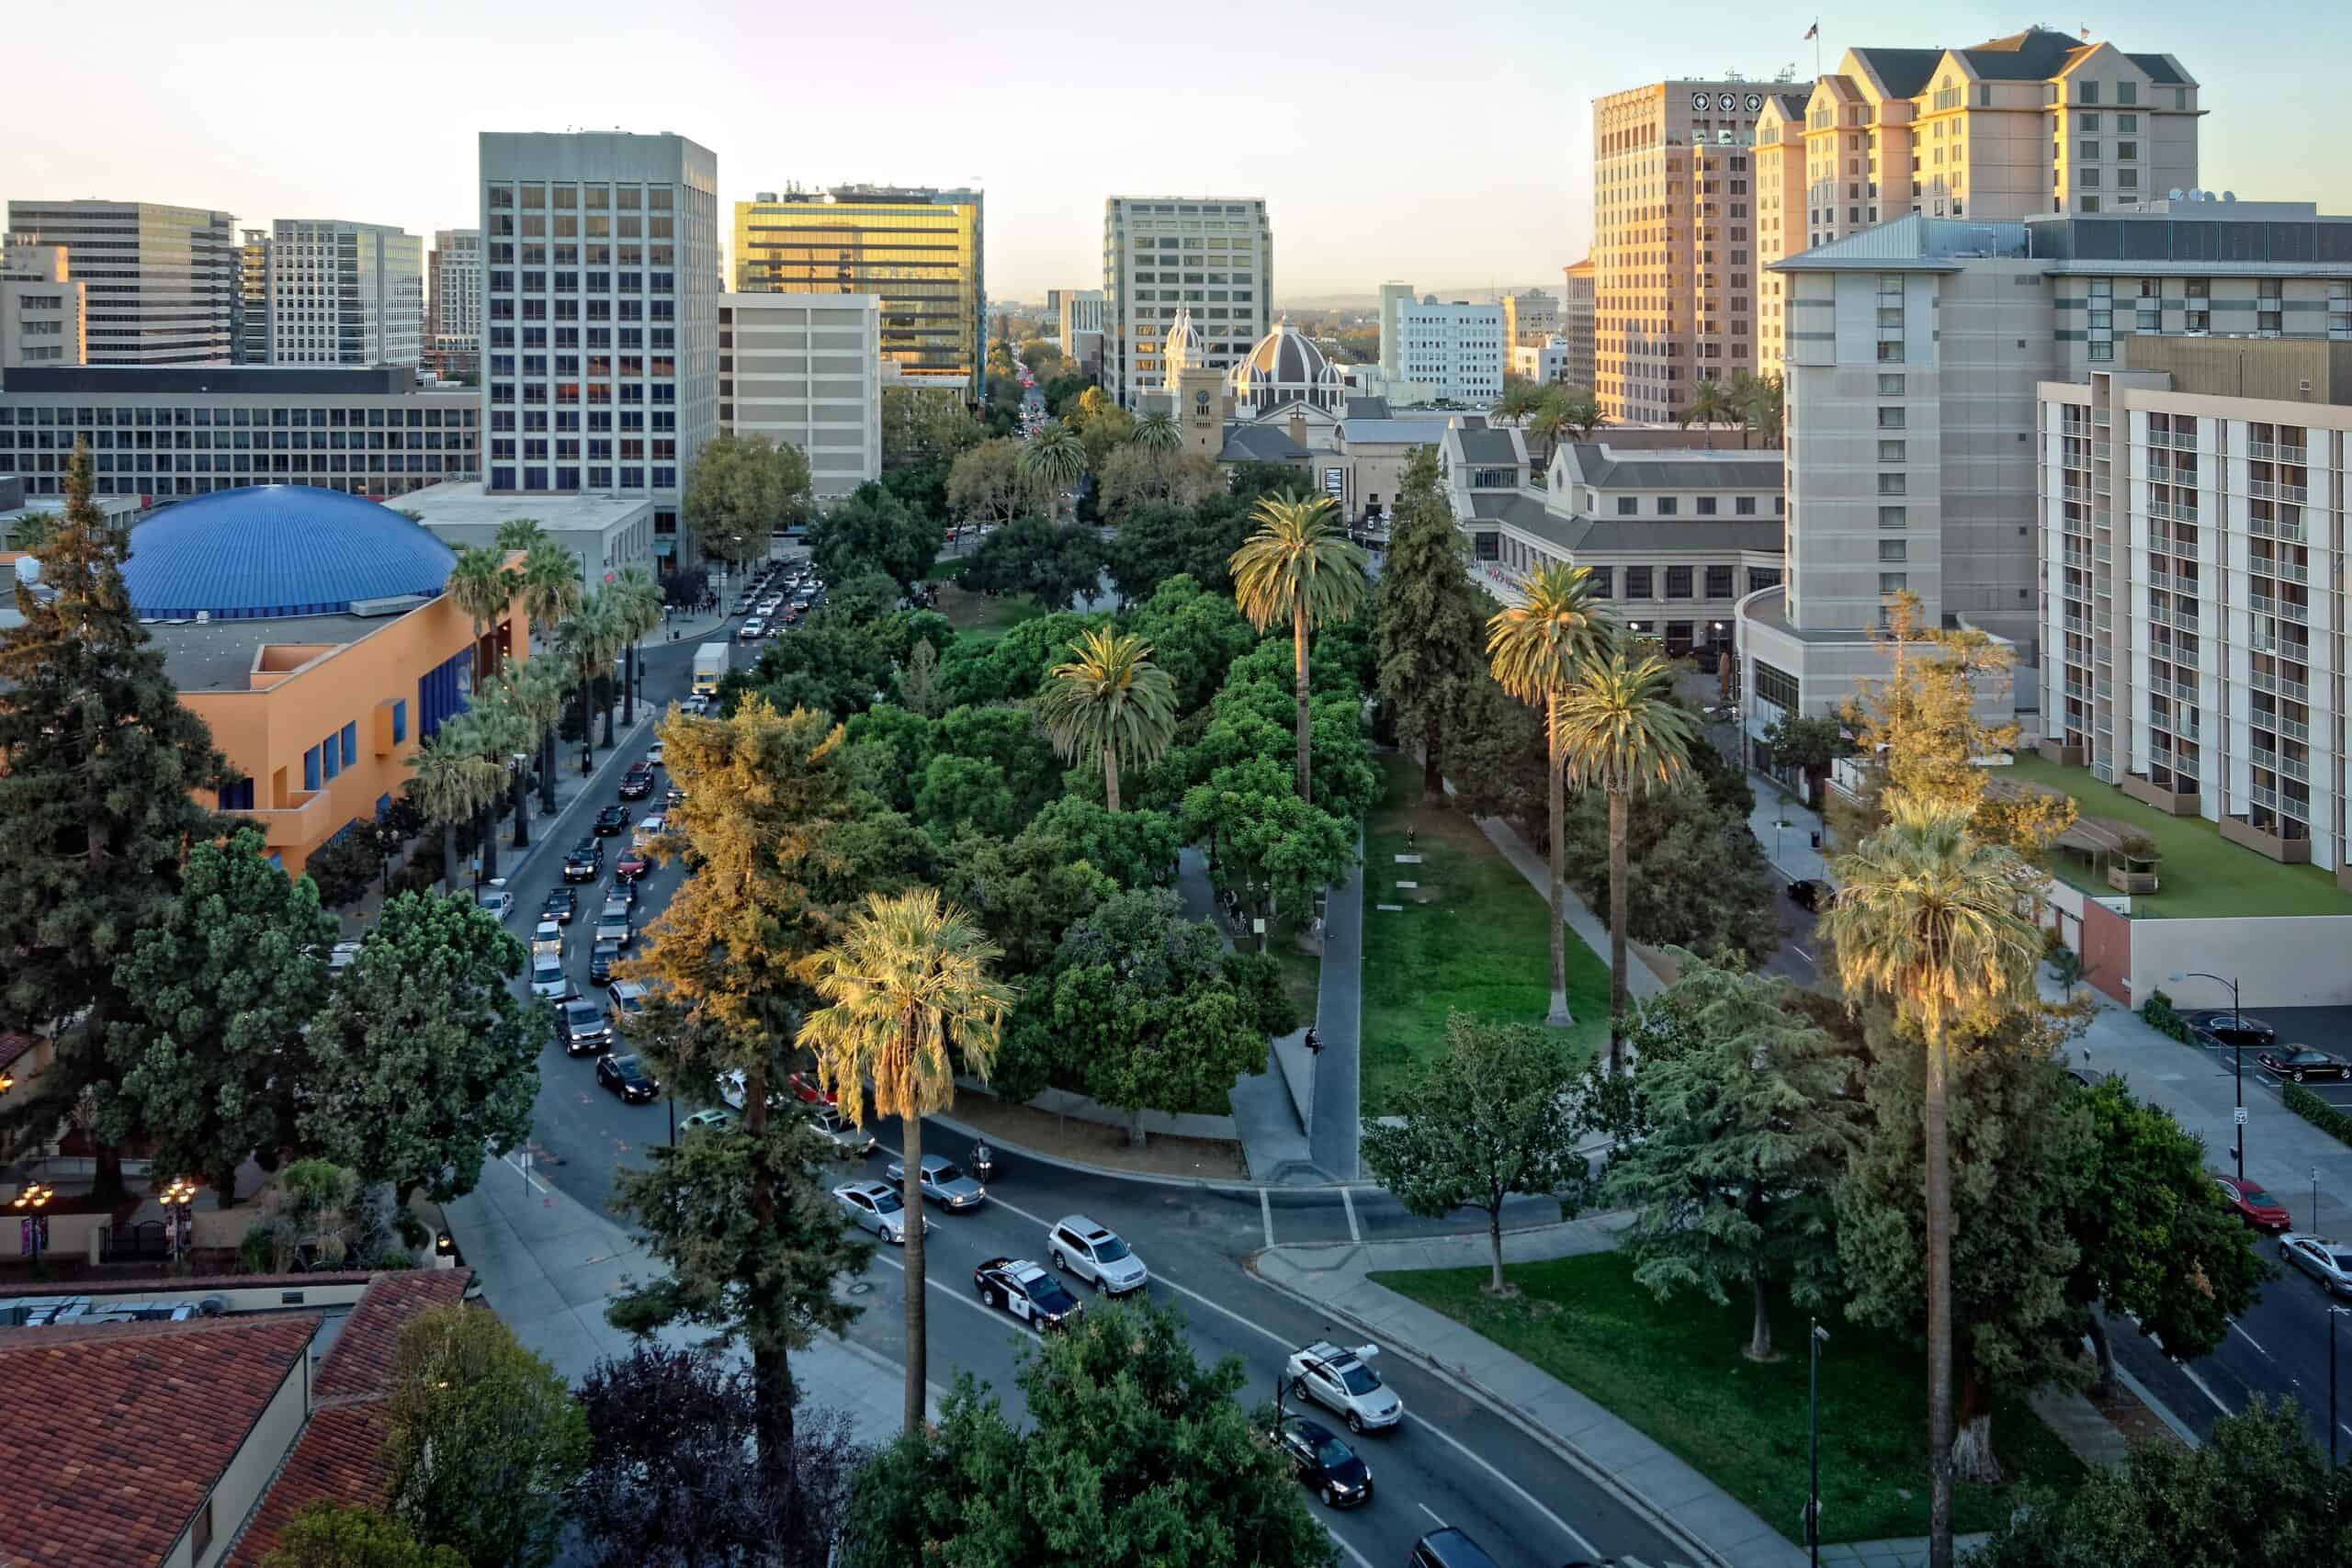
Source: GerardoBrucker / iStock via Getty Images
- Households unable to afford a new, median priced home: 92.6% (638,330 total)
- Median new home price: $1,685,593
- Income needed to afford a typical new home: $487,774
- Median household income: $148,900
3. San Francisco-San Mateo-Redwood City, CA
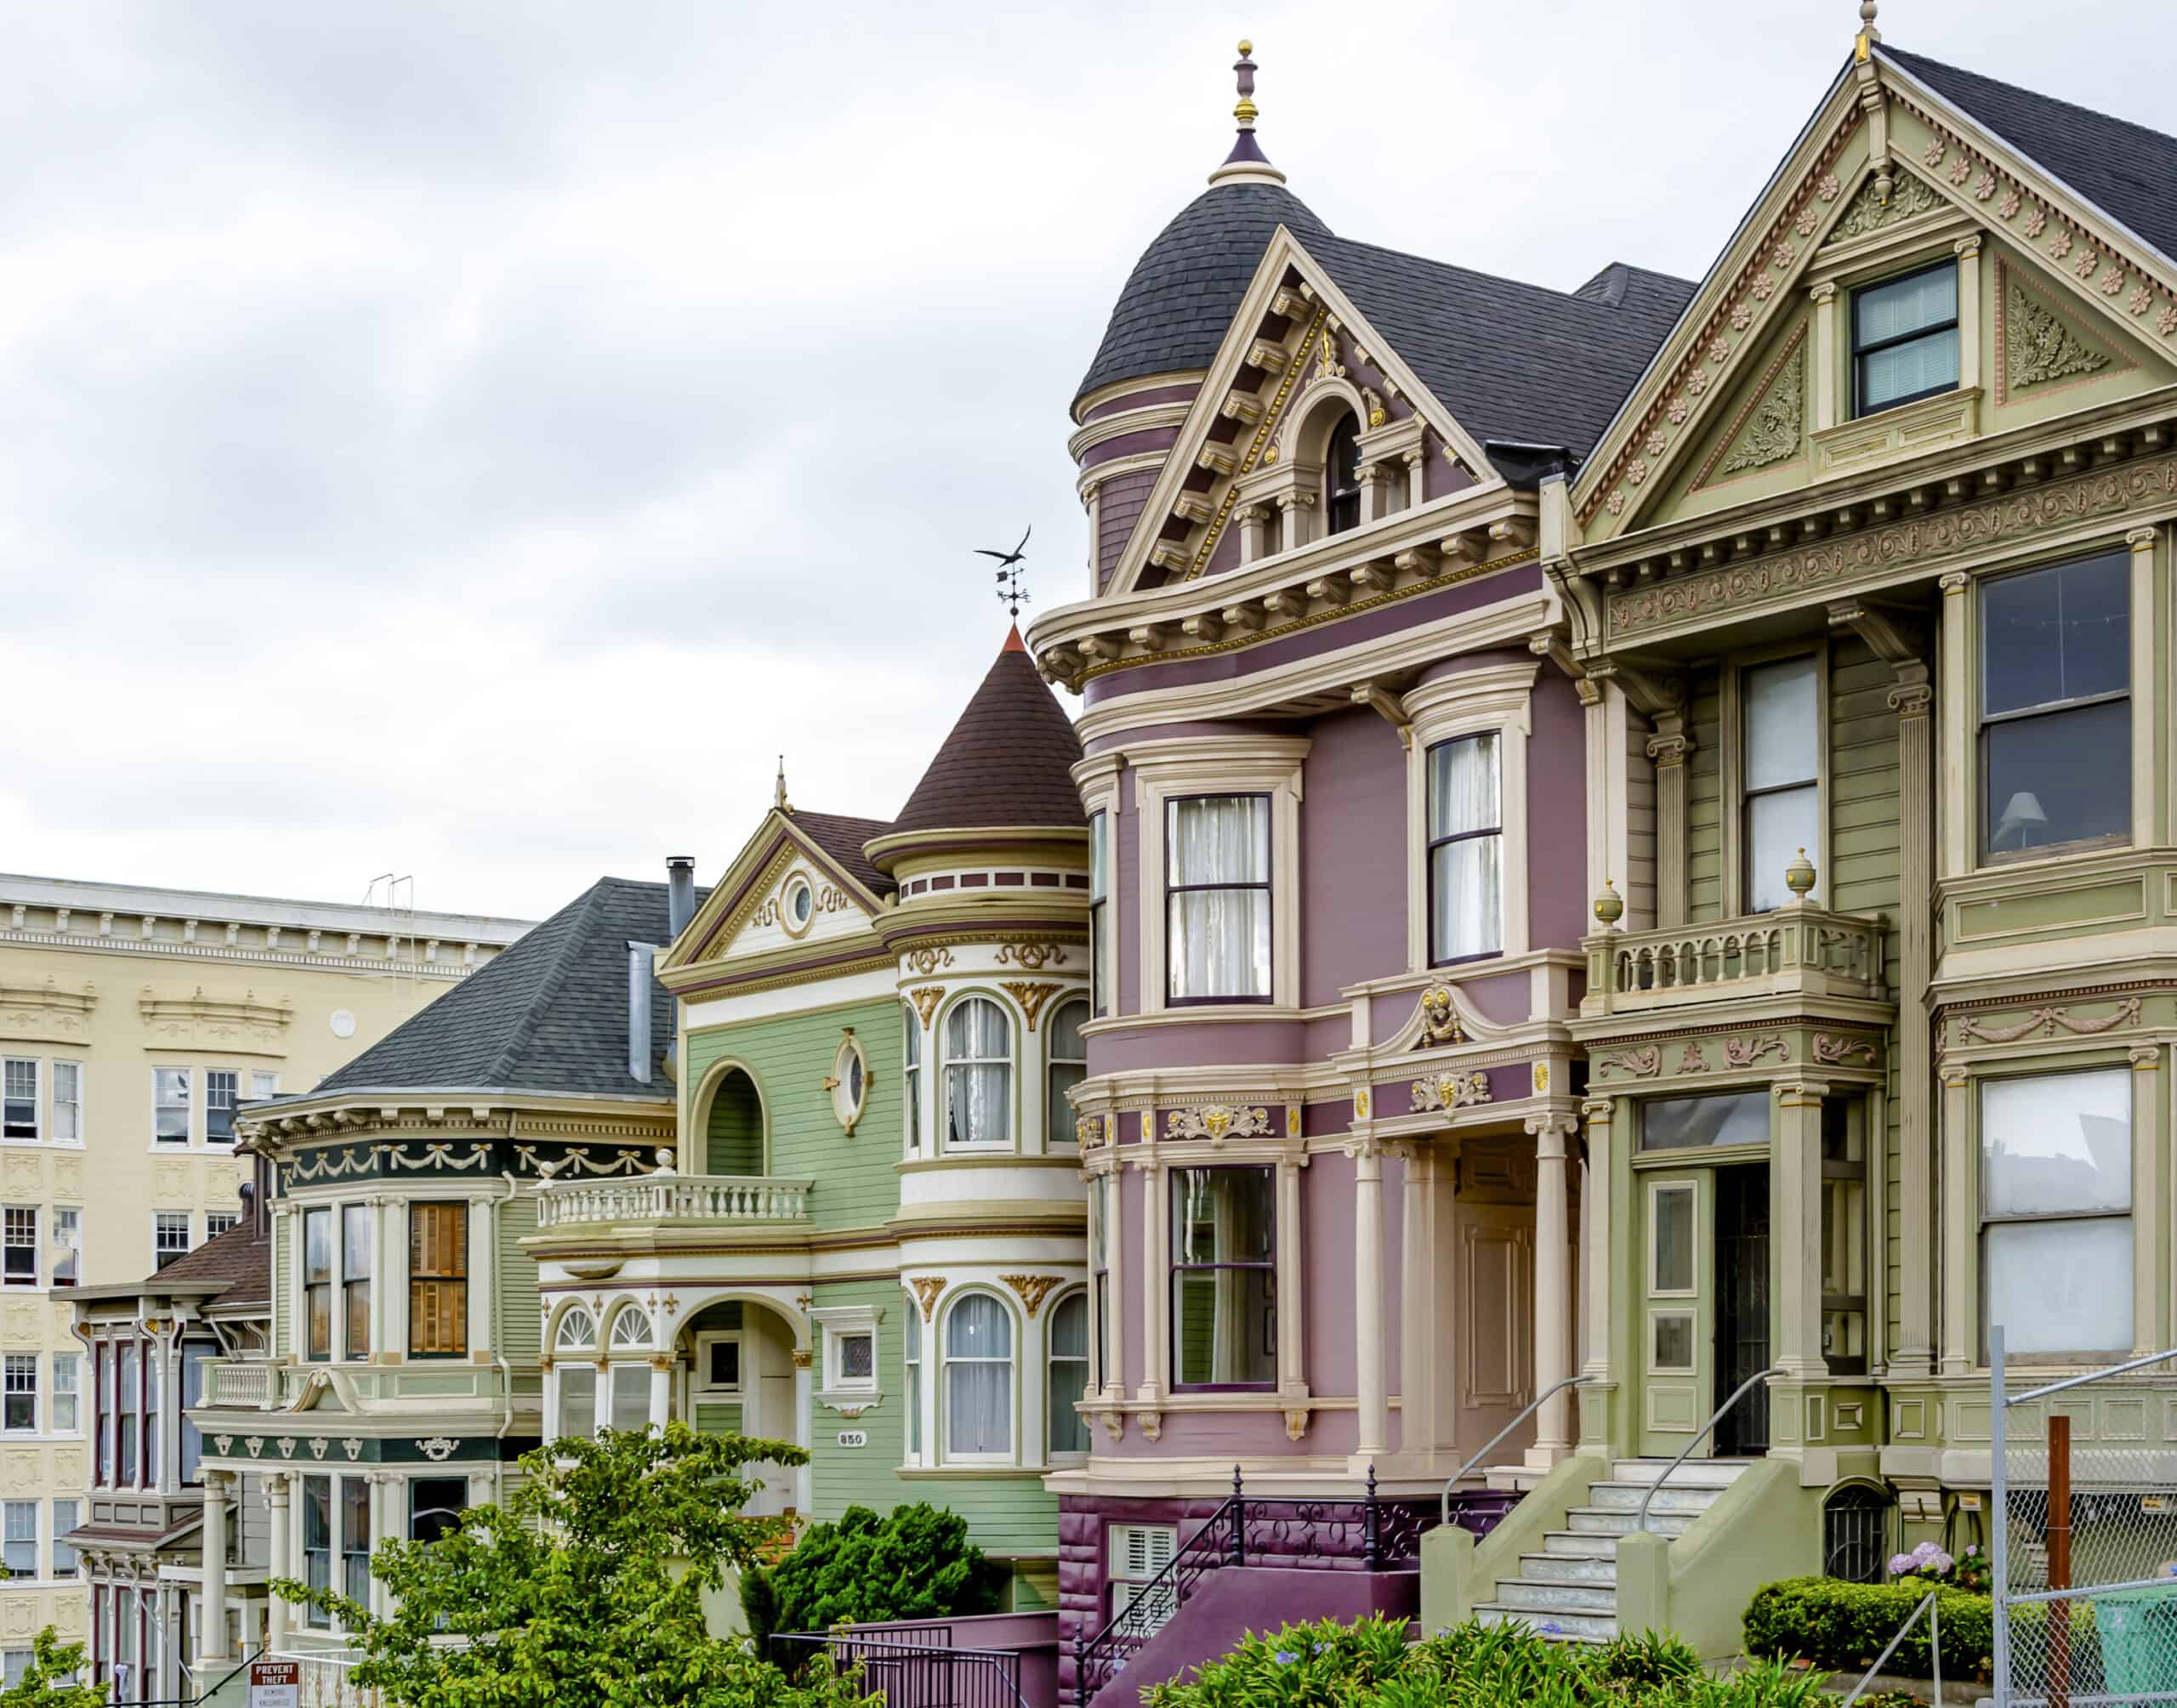
Source: rarrarorro / iStock via Getty Images
- Households unable to afford a new, median priced home: 92.6% (595,391 total)
- Median new home price: $1,507,874
- Income needed to afford a typical new home: $436,801
- Median household income: N/A
2. Salem, OR
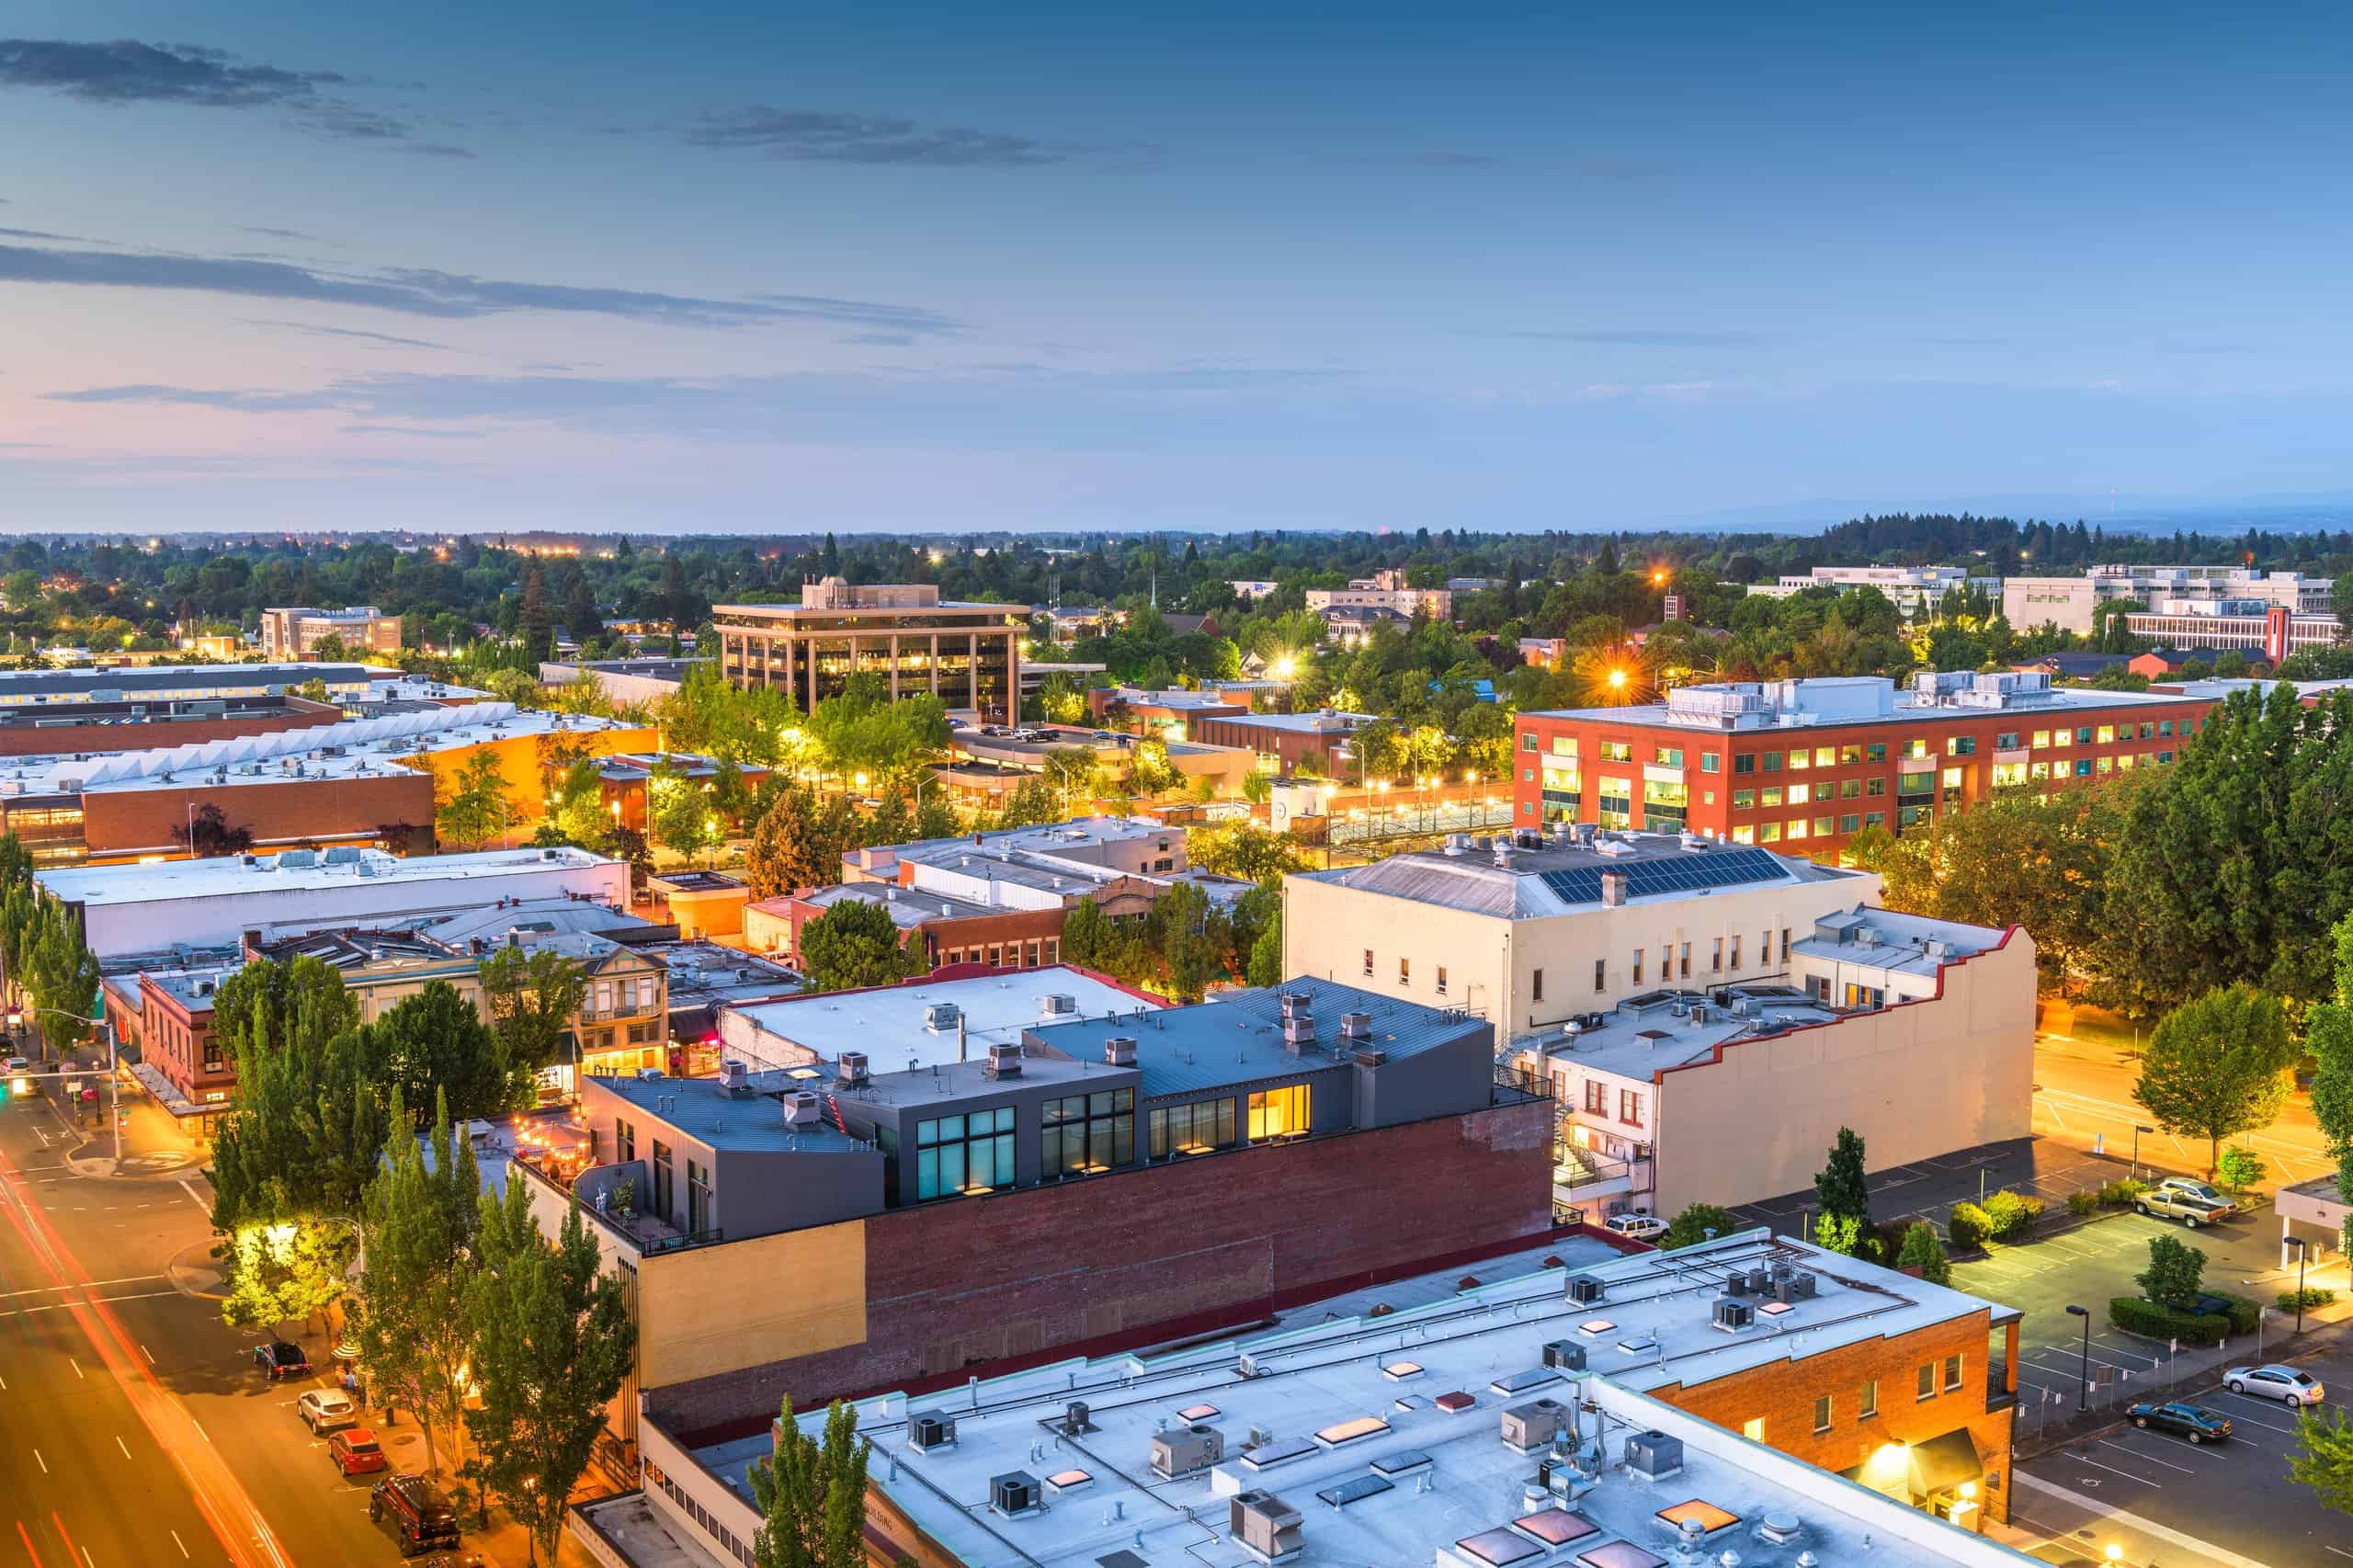
Source: Sean Pavone / iStock via Getty Images
- Households unable to afford a new, median priced home: 93.8% (157,563 total)
- Median new home price: $718,733
- Income needed to afford a typical new home: $214,618
- Median household income: $72,150
1. Prescott Valley-Prescott, AZ
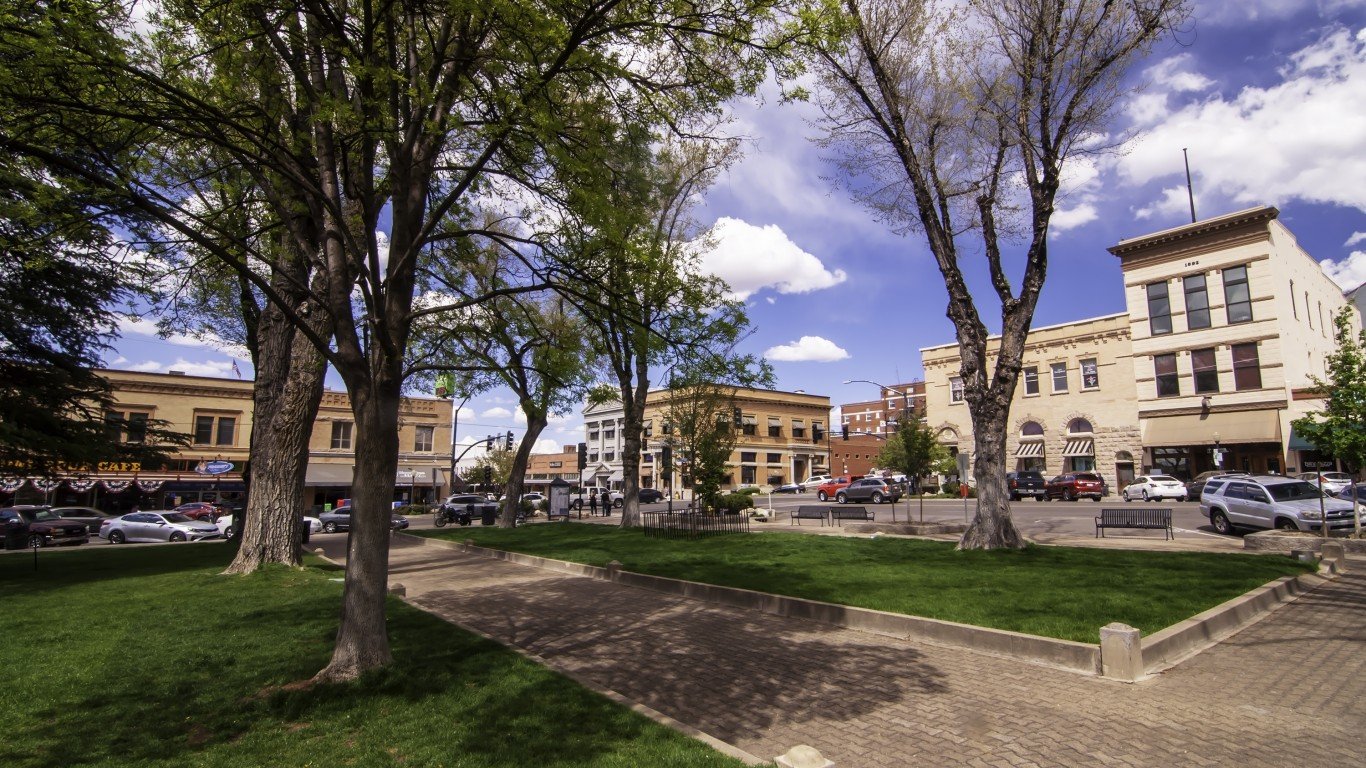
Source: Althom / iStock Editorial via Getty Images
- Households unable to afford a new, median priced home: 94.1% (102,251 total)
- Median new home price: $662,888
- Income needed to afford a typical new home: $188,639
- Median household income: $63,936
Take This Retirement Quiz To Get Matched With An Advisor Now (Sponsored)
Are you ready for retirement? Planning for retirement can be overwhelming, that’s why it could be a good idea to speak to a fiduciary financial advisor about your goals today.
Start by taking this retirement quiz right here from SmartAsset that will match you with up to 3 financial advisors that serve your area and beyond in 5 minutes. Smart Asset is now matching over 50,000 people a month.
Click here now to get started.
Thank you for reading! Have some feedback for us?
Contact the 24/7 Wall St. editorial team.
Editors' Picks