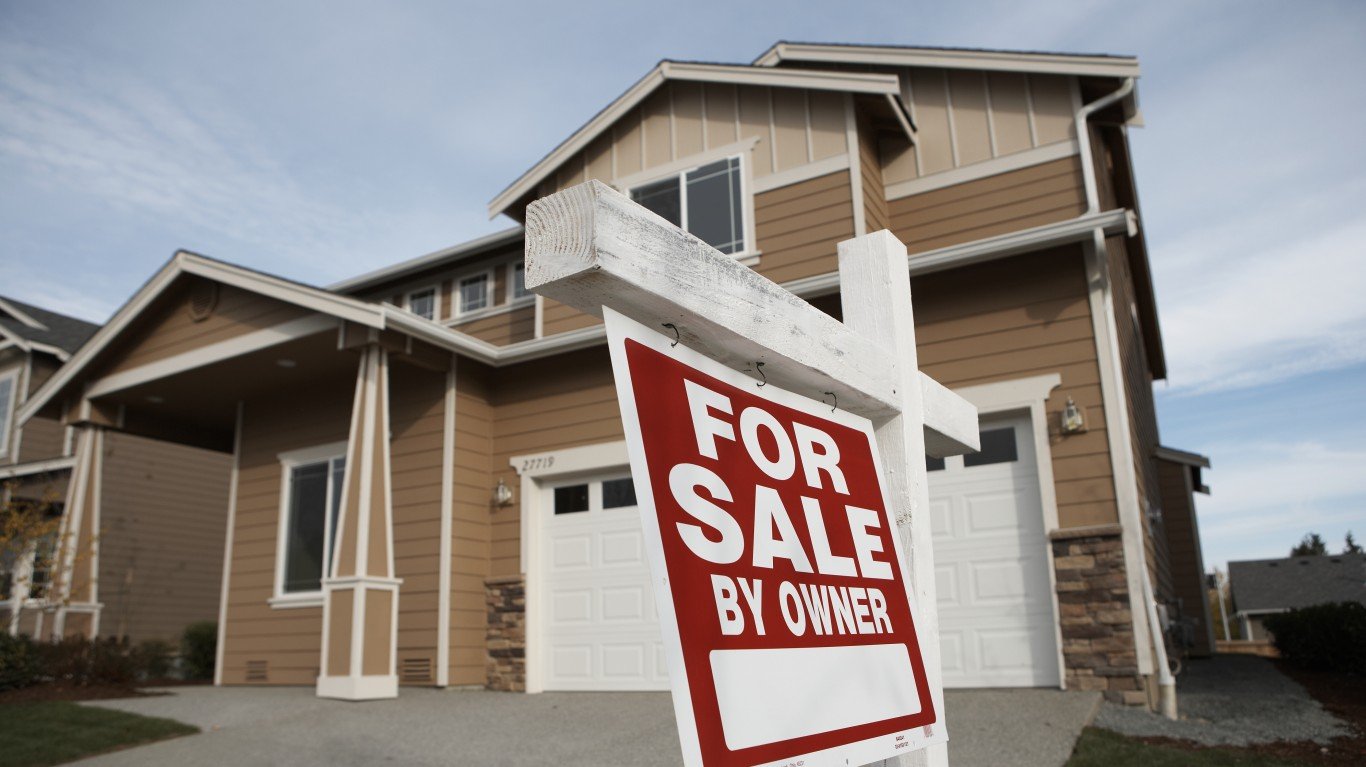
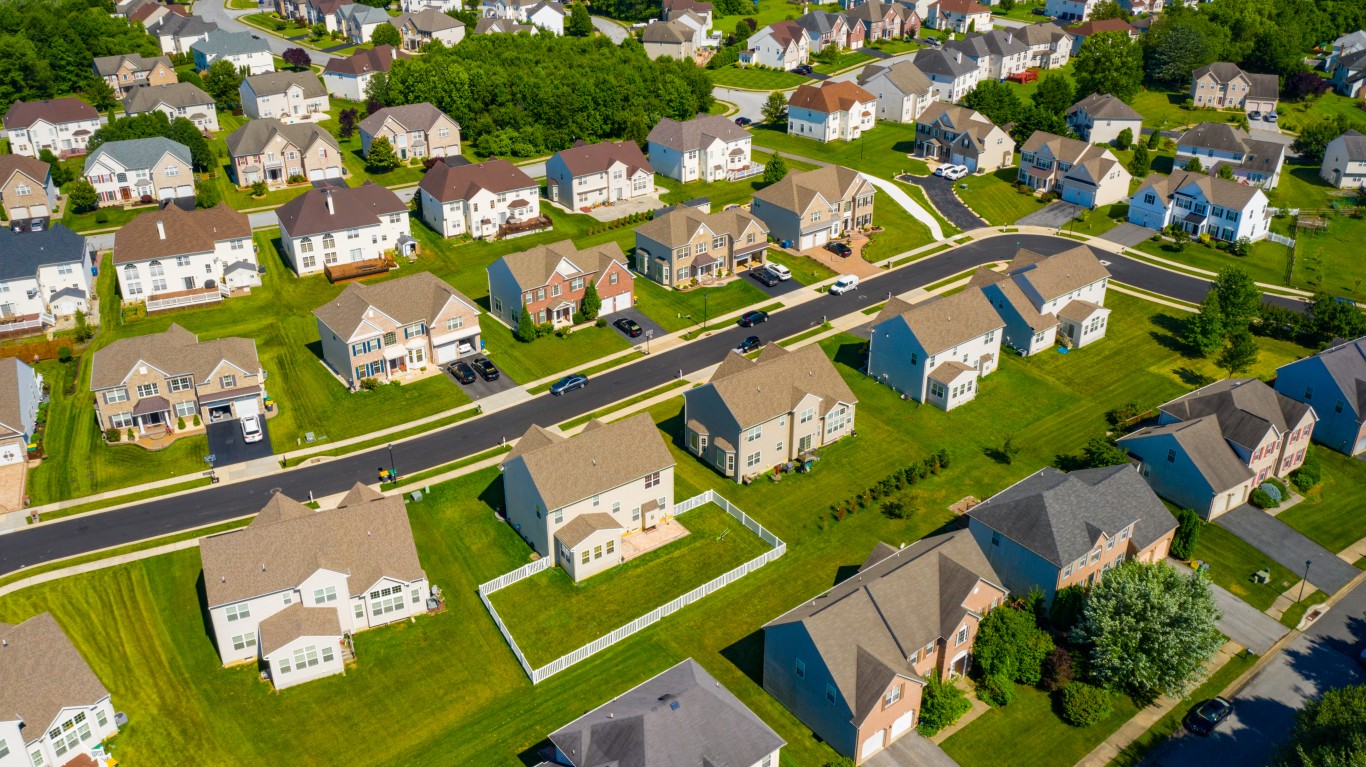
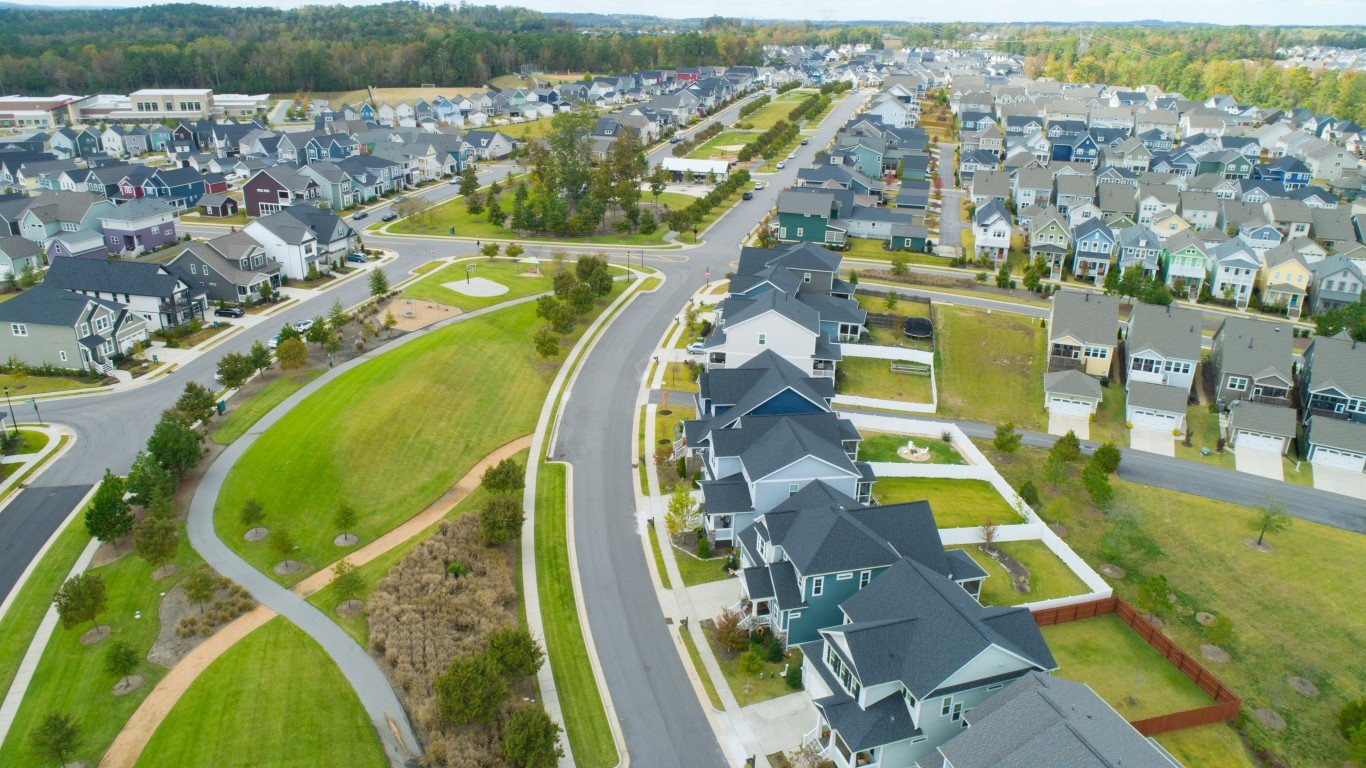
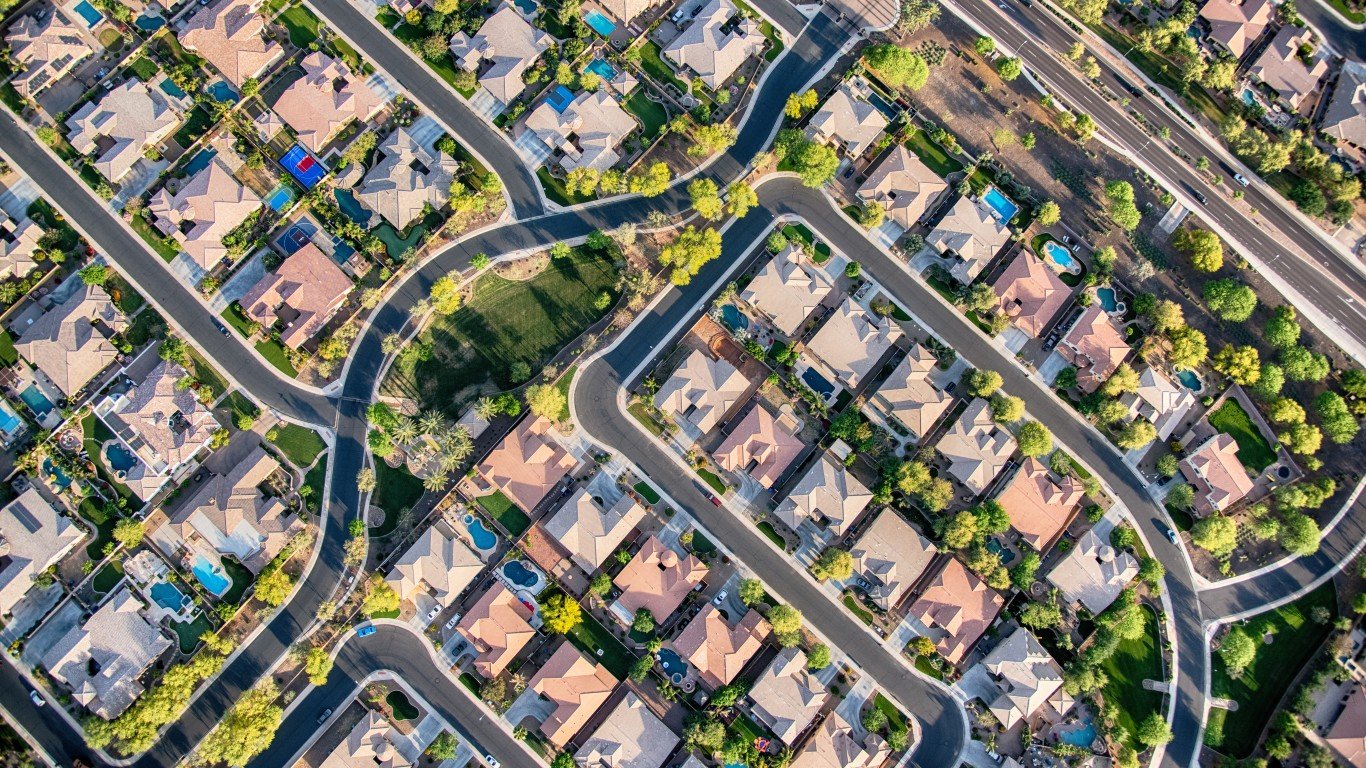
In the early months of the COVID-19 pandemic, demand for housing surged in the United States. New, single family homes sales topped 1 million in October 2020, the highest level in over 14 years. Surging demand, along with supply shortages, sent home values soaring to all-time highs. While the pace of new home sales has fallen in the years since, housing prices have remained elevated — and now, with mortgage rates at historic highs, millions of Americans are priced out of the market.
According to estimates from the National Association of Home Builders, the median price of a new home in the U.S. was $495,750 in March 2024, up over 16% from the previous year and nearly 44% higher than in January 2020, before the pandemic. Meanwhile, the average interest rate on a 30-year fixed mortgage has been over 6.5% for nearly a year, up from less than 3% as recently as October 2021.
Assuming a 10% down payment, and accounting for borrowing costs on a 6.5% 30-year fixed rate mortgage, as well as property taxes, a household would need to have an annual income of nearly $152,000 to be able to afford a typical new home and not spend more than 28% of their gross income on housing, according to the NAHB. Based on this model, 103.5 million households — or 76.9% of all American households — are not able to comfortably afford a new home.
Of course, both incomes and home prices vary considerably across the country. And while there are places where a new home is still affordable to large shares of the population, there are also parts of the country where buying a new home is prohibitively expensive for the vast majority of residents.
Using data from NAHB, 24/7 Wall St. identified the states where the most people cannot afford a new home. We ranked all 50 states on the estimated share of households who do not earn enough to afford a new, median priced home, according to NAHB. Supplemental data on median household income is from the U.S. Census Bureau’s 2022 American Community Survey. A full methodology is available in the NAHB’s March 2024 report.
Across the 50 states, the share of households who cannot afford a typical new home ranges from 66% to over 90%. In any given area, housing affordability is a product of two factors: income and home prices. As a result, states with higher than average new home prices are not always the states where the largest shares of the population are priced out. Similarly, states where more people can afford to buy a new home do not necessarily have high-earning populations.
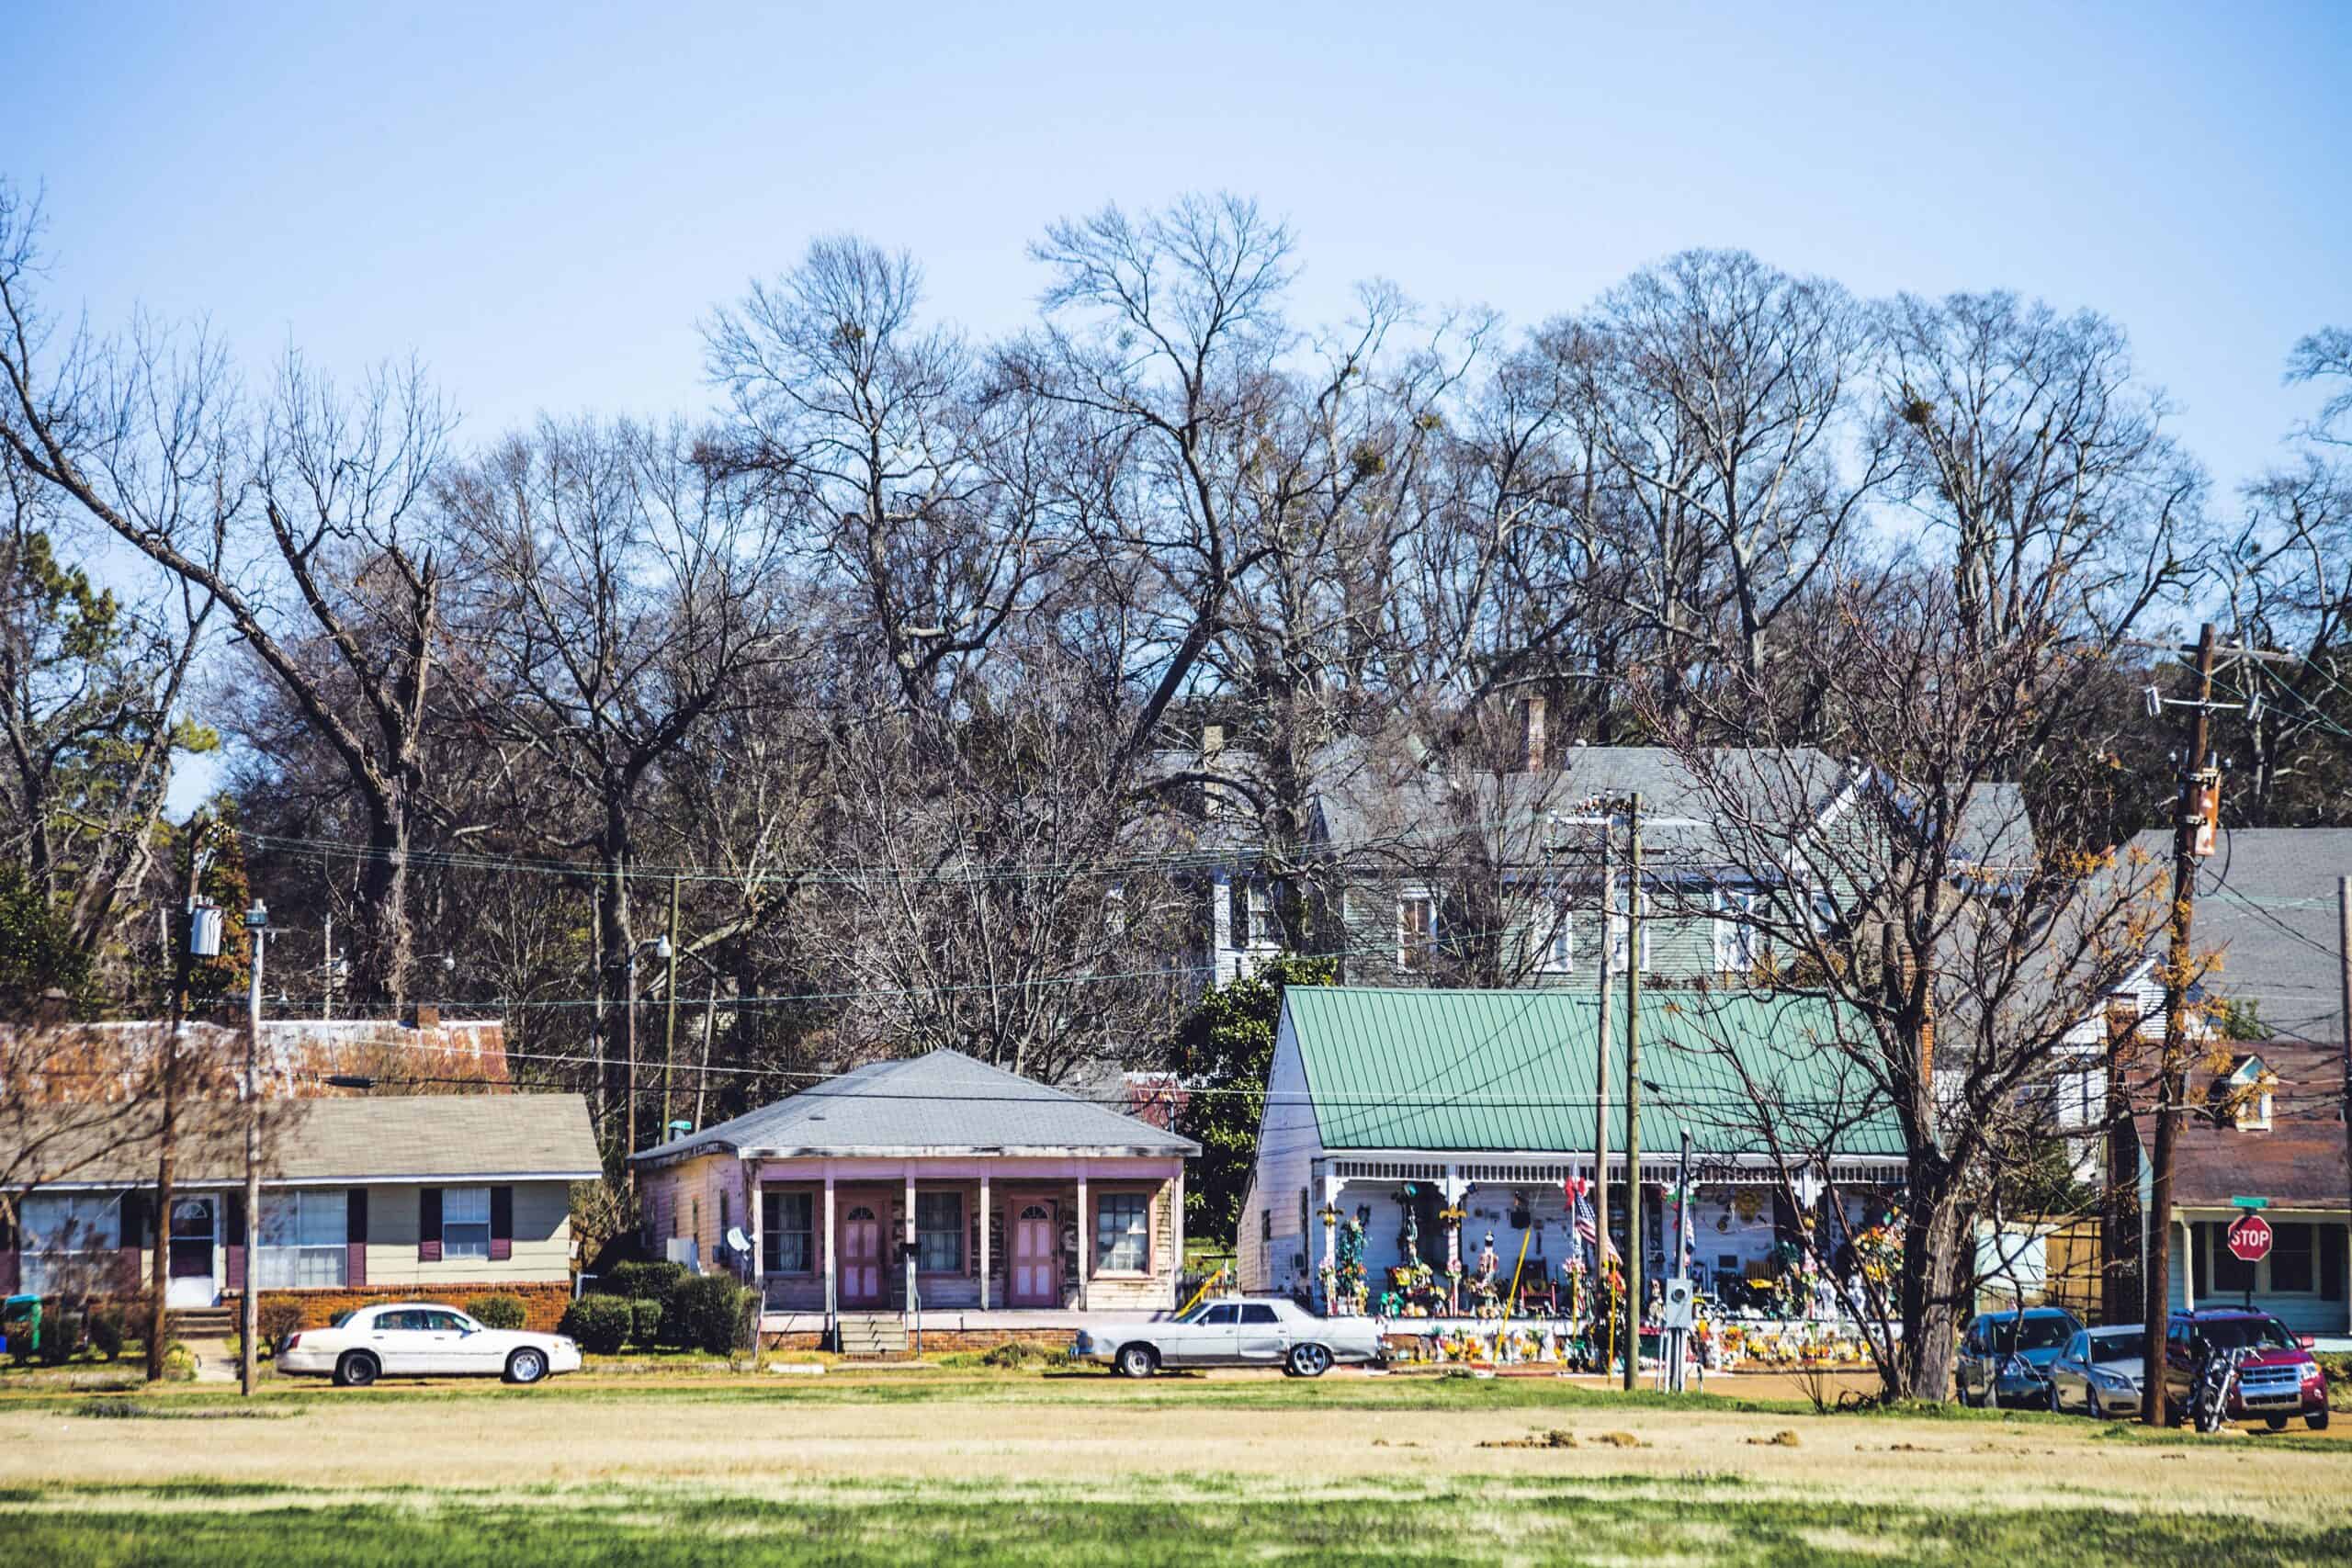
Mississippi, for example, has the lowest median household income in the country, at just $52,719. Still, the typical new home in Mississippi is listed for only $295,835. Low incomes in the state are offset by low housing prices, and as a result, Mississippi is one of only two states where over 30% of households can comfortably afford a new home. (Here is a look at the poorest towns in the United States.)
By contrast, the typical household in Hawaii earns about $92,500 a year, well above the median household income nationwide of $74,755. Still, at nearly $1.1 million, Hawaii also has the highest median new home list price of any state. Accounting for both income and home prices, an estimated 88.5% of households in Hawaii cannot afford a new home, the third largest share of any state. (Here is a look at the most affordable housing market in each state.)
Why It Matters
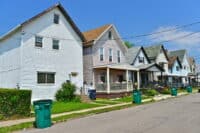
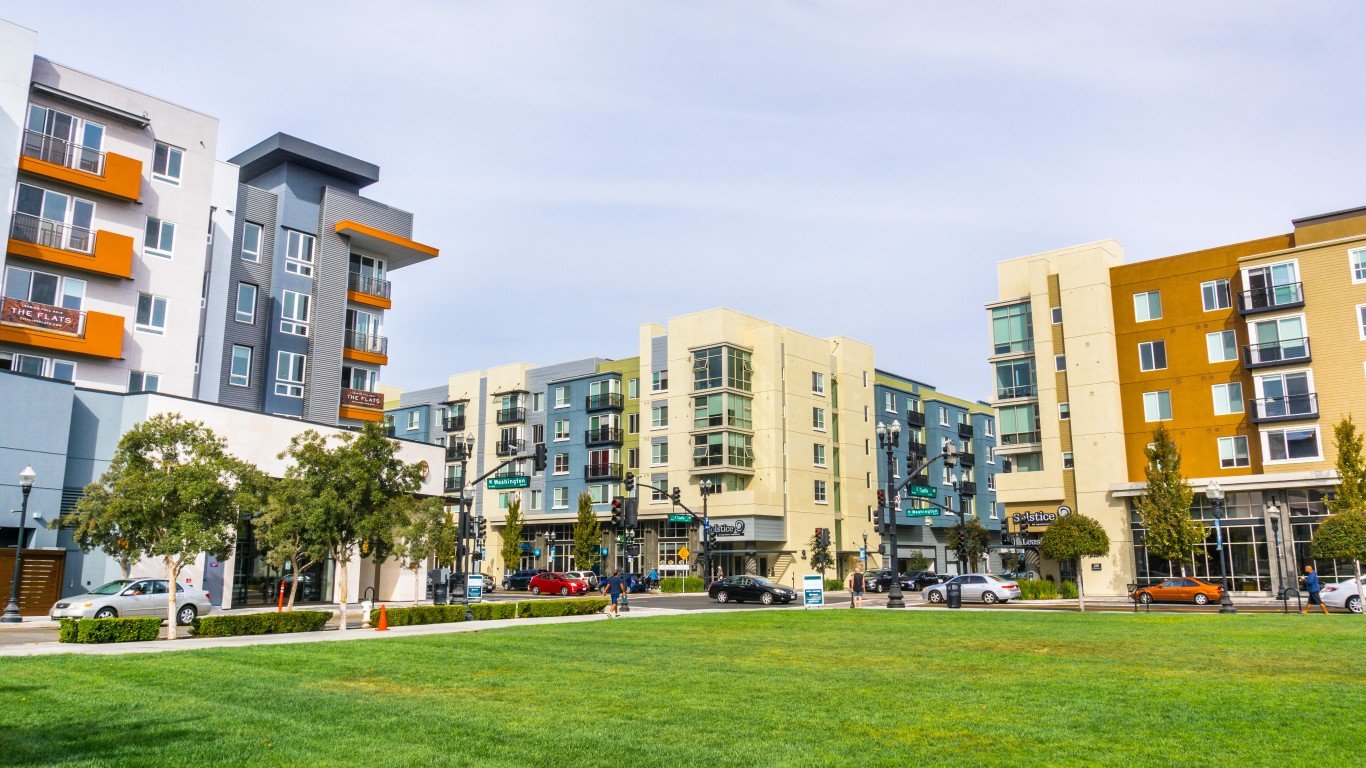
Source: Lane V. Erickson / Shutterstock.com
Homeownership has historically been a reliable means of building wealth in the United States. However, recent increases in home values and borrowing costs have priced large segments of the population out of the market. The state of the housing market is not only impacting individuals and families, but also the broader economy. Residential investment accounts for as much as 5% of U.S. gross domestic product, and since mid-2020, the volume of new home sales in the U.S. has fallen by 33%.
50. Virginia

Source: ferrantraite / E+ via Getty Images
- Households unable to afford a new, median priced home: 66.0% (2,297,977 total)
- Median new home price: $461,542 (22nd lowest of 50 states)
- Income needed to afford a typical new home: $137,496
- Median household income: $85,873 (12th highest of 50 states)
49. Mississippi
Source: peeterv / iStock via Getty Images
- Households unable to afford a new, median priced home: 67.6% (802,689 total)
- Median new home price: $295,835 (the lowest of 50 states)
- Income needed to afford a typical new home: $92,451
- Median household income: $52,719 (the lowest of 50 states)
48. Alaska

- Households unable to afford a new, median priced home: 70.4% (197,940 total)
- Median new home price: $423,327 (9th lowest of 50 states)
- Income needed to afford a typical new home: $132,871
- Median household income: $88,121 (11th highest of 50 states)
47. Maine
Source: haveseen / iStock via Getty Images
- Households unable to afford a new, median priced home: 71.4% (449,239 total)
- Median new home price: $400,672 (5th lowest of 50 states)
- Income needed to afford a typical new home: $123,051
- Median household income: $69,543 (19th lowest of 50 states)
46. New York

- Households unable to afford a new, median priced home: 71.9% (5,771,774 total)
- Median new home price: $457,985 (19th lowest of 50 states)
- Income needed to afford a typical new home: $149,861
- Median household income: $79,557 (16th highest of 50 states)
45. Maryland

Source: krblokhin / iStock via Getty Images
- Households unable to afford a new, median priced home: 72.1% (1,743,877 total)
- Median new home price: $570,135 (15th highest of 50 states)
- Income needed to afford a typical new home: $174,902
- Median household income: $94,991 (2nd highest of 50 states)
44. Georgia

Source: Davel5957 / iStock via Getty Images
- Households unable to afford a new, median priced home: 72.9% (3,122,962 total)
- Median new home price: $436,090 (14th lowest of 50 states)
- Income needed to afford a typical new home: $132,021
- Median household income: $72,837 (21st highest of 50 states)
43. Nebraska
Source: halbergman / iStock via Getty Images
- Households unable to afford a new, median priced home: 73.1% (613,293 total)
- Median new home price: $395,594 (4th lowest of 50 states)
- Income needed to afford a typical new home: $132,642
- Median household income: $69,597 (21st lowest of 50 states)
42. Texas
Source: tirc83 / iStock Unreleased via Getty Images
- Households unable to afford a new, median priced home: 74.1% (8,669,472 total)
- Median new home price: $411,501 (7th lowest of 50 states)
- Income needed to afford a typical new home: $136,973
- Median household income: $72,284 (24th highest of 50 states)
41. Minnesota

- Households unable to afford a new, median priced home: 74.4% (1,791,238 total)
- Median new home price: $496,138 (23rd highest of 50 states)
- Income needed to afford a typical new home: $155,486
- Median household income: $82,338 (13th highest of 50 states)
40. Tennessee
Source: Barry Richards / iStock via Getty Images
- Households unable to afford a new, median priced home: 75.2% (2,259,532 total)
- Median new home price: $420,518 (8th lowest of 50 states)
- Income needed to afford a typical new home: $123,074
- Median household income: $65,254 (11th lowest of 50 states)
39. Delaware
Source: felixmizioznikov / iStock via Getty Images
- Households unable to afford a new, median priced home: 75.5% (313,980 total)
- Median new home price: $448,957 (17th lowest of 50 states)
- Income needed to afford a typical new home: $130,187
- Median household income: $82,174 (14th highest of 50 states)
38. Alabama

Source: Art Wager / iStock via Getty Images
- Households unable to afford a new, median priced home: 75.5% (1,599,770 total)
- Median new home price: $391,725 (3rd lowest of 50 states)
- Income needed to afford a typical new home: $115,091
- Median household income: $59,674 (7th lowest of 50 states)
37. California
Source: Sundry Photography / iStock Editorial via Getty Images
- Households unable to afford a new, median priced home: 76.2% (10,514,739 total)
- Median new home price: $641,531 (9th highest of 50 states)
- Income needed to afford a typical new home: $187,726
- Median household income: $91,551 (5th highest of 50 states)
36. Kentucky

Source: alexeys / iStock via Getty Images
- Households unable to afford a new, median priced home: 76.8% (1,472,408 total)
- Median new home price: $384,851 (2nd lowest of 50 states)
- Income needed to afford a typical new home: $118,091
- Median household income: $59,341 (5th lowest of 50 states)
35. New Jersey
Source: photovs / iStock via Getty Images
- Households unable to afford a new, median priced home: 77.0% (2,736,552 total)
- Median new home price: $576,141 (14th highest of 50 states)
- Income needed to afford a typical new home: $199,710
- Median household income: $96,346 (the highest of 50 states)
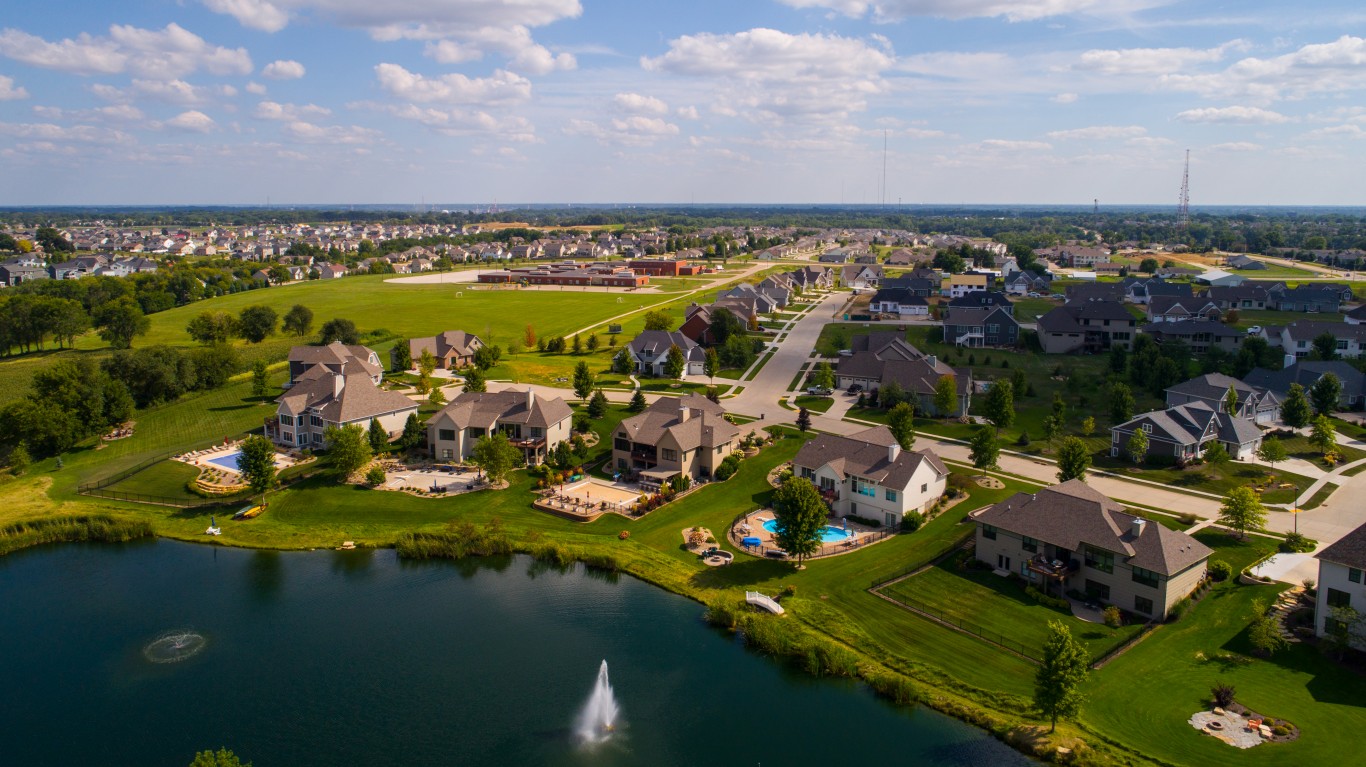
34. Illinois
Source: Alex Potemkin / E+ via Getty Images
- Households unable to afford a new, median priced home: 77.2% (4,005,760 total)
- Median new home price: $454,101 (18th lowest of 50 states)
- Income needed to afford a typical new home: $157,418
- Median household income: $76,708 (17th highest of 50 states)
33. West Virginia

Source: benedek / E+ via Getty Images
- Households unable to afford a new, median priced home: 78.2% (598,934 total)
- Median new home price: $404,648 (6th lowest of 50 states)
- Income needed to afford a typical new home: $120,508
- Median household income: $54,329 (2nd lowest of 50 states)
32. North Carolina
Source: Ryan Herron / E+ via Getty Images
- Households unable to afford a new, median priced home: 78.2% (3,556,505 total)
- Median new home price: $467,506 (24th lowest of 50 states)
- Income needed to afford a typical new home: $139,128
- Median household income: $67,481 (15th lowest of 50 states)
31. Florida
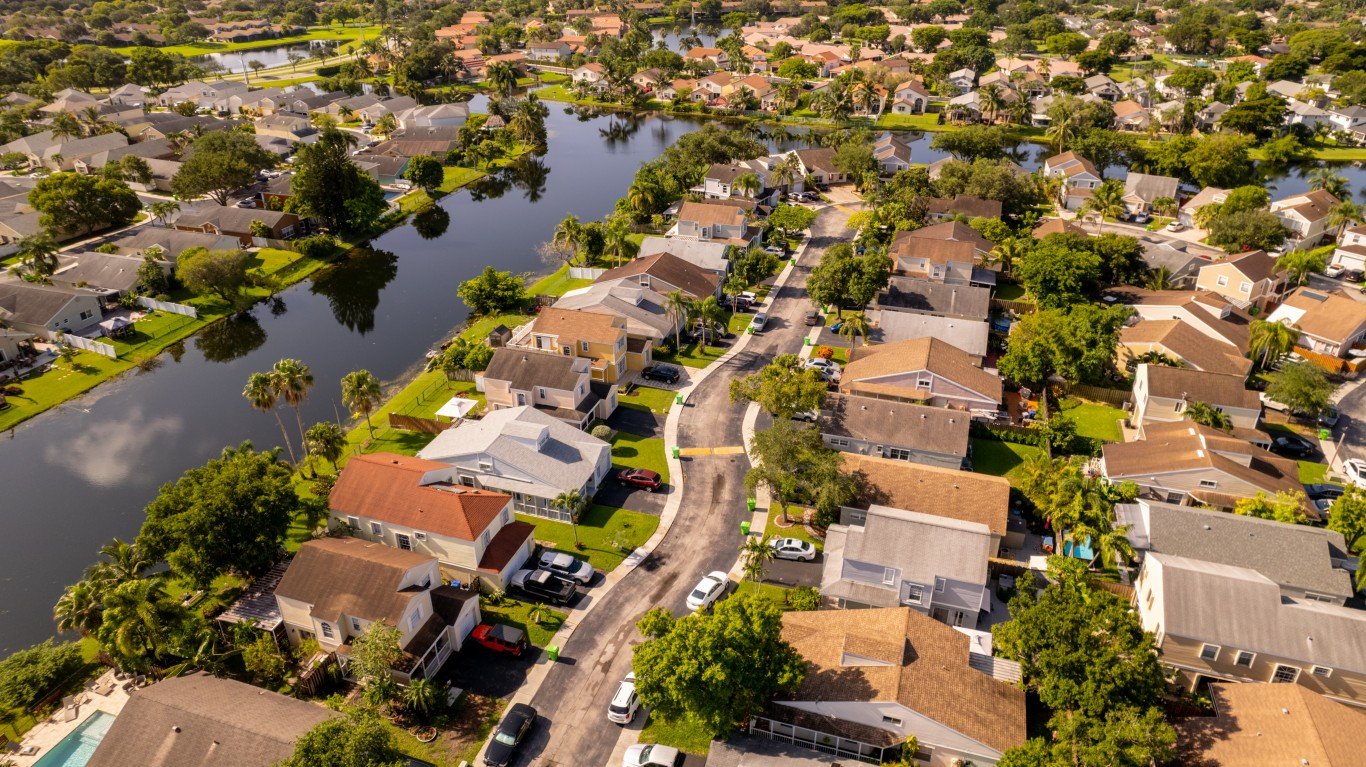
Source: felixmizioznikov / iStock via Getty Images
- Households unable to afford a new, median priced home: 78.7% (7,380,584 total)
- Median new home price: $460,231 (21st lowest of 50 states)
- Income needed to afford a typical new home: $140,606
- Median household income: $69,303 (18th lowest of 50 states)
30. Ohio
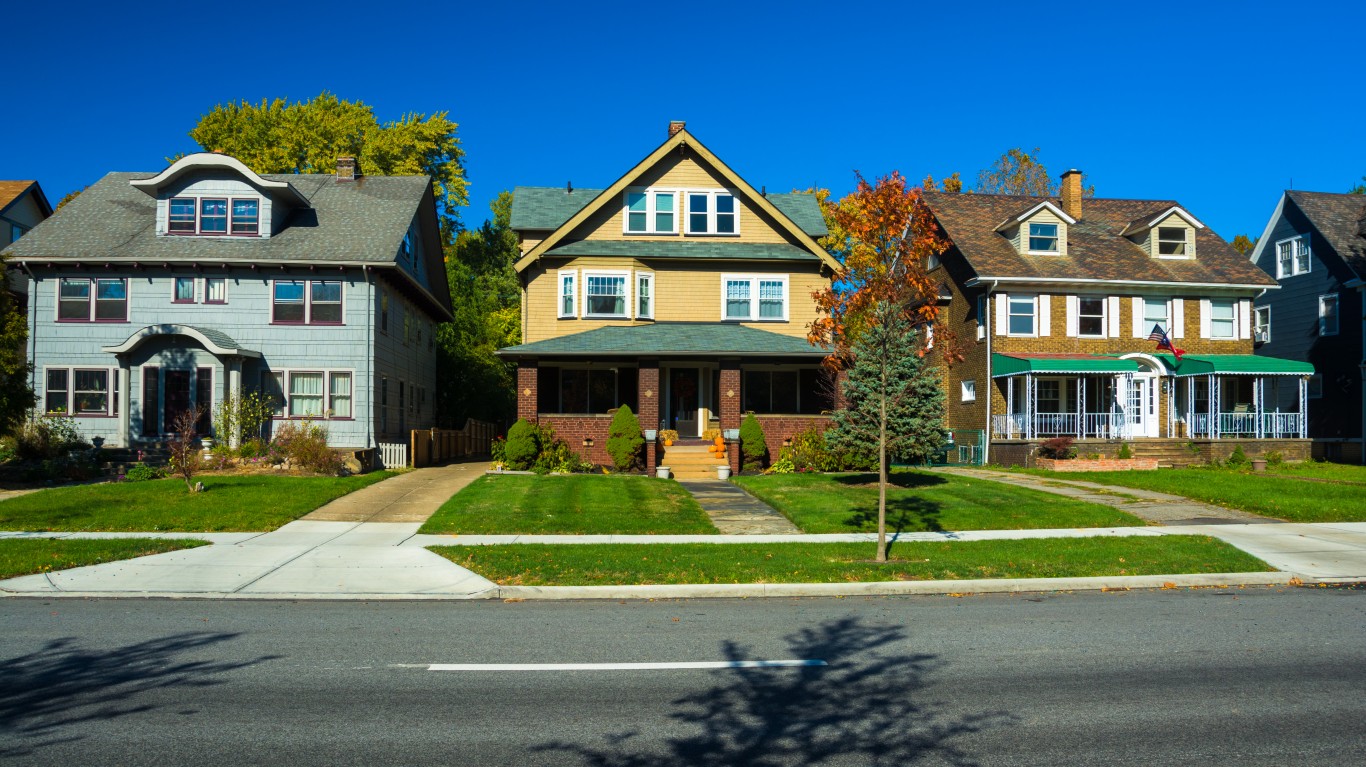
Source: Davel5957 / iStock via Getty Images
- Households unable to afford a new, median priced home: 78.9% (3,920,101 total)
- Median new home price: $433,159 (13th lowest of 50 states)
- Income needed to afford a typical new home: $140,278
- Median household income: $65,720 (12th lowest of 50 states)
29. South Dakota

Source: disorderly / iStock via Getty Images
- Households unable to afford a new, median priced home: 79.0% (309,723 total)
- Median new home price: $423,894 (10th lowest of 50 states)
- Income needed to afford a typical new home: $133,712
- Median household income: $69,728 (22nd lowest of 50 states)
28. Michigan

- Households unable to afford a new, median priced home: 79.1% (3,294,682 total)
- Median new home price: $448,520 (16th lowest of 50 states)
- Income needed to afford a typical new home: $143,593
- Median household income: $66,986 (14th lowest of 50 states)
27. Colorado
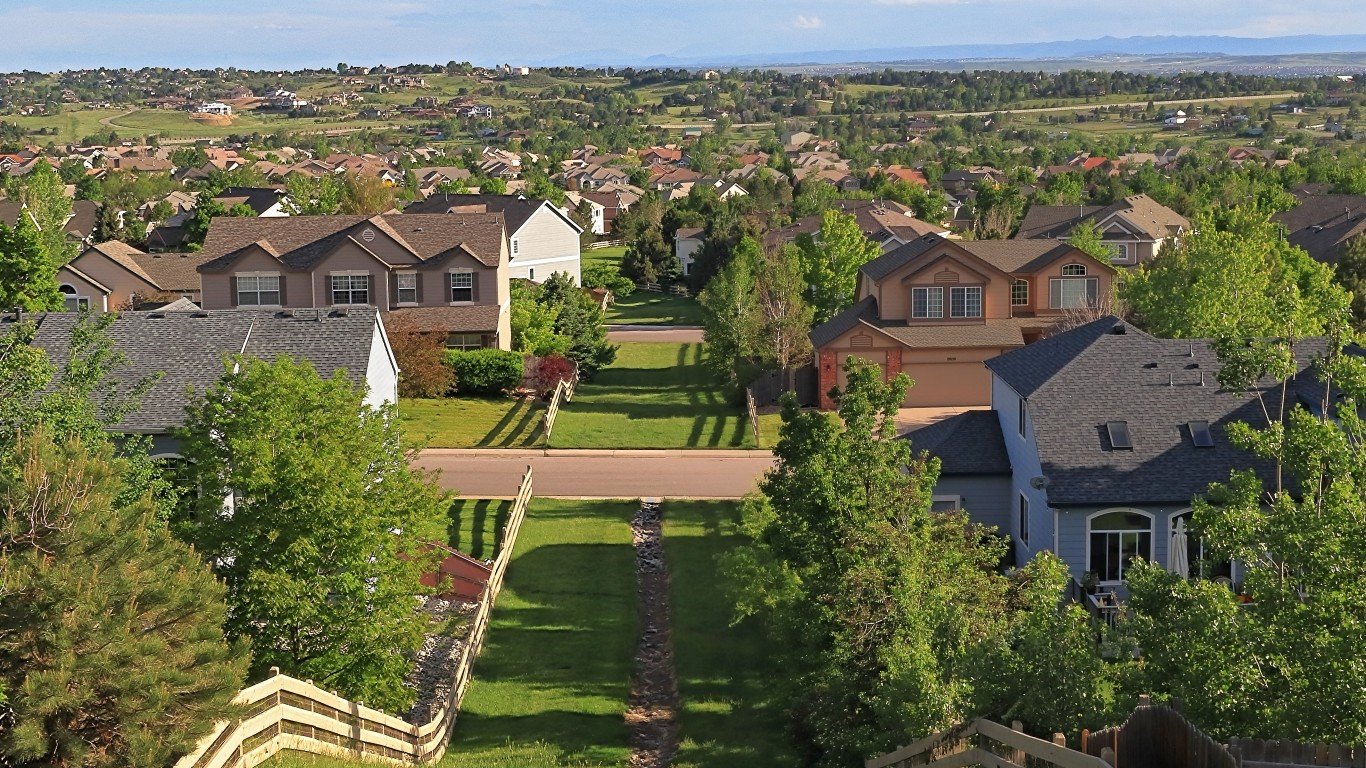
Source: Faina Gurevich / iStock via Getty Images
- Households unable to afford a new, median priced home: 79.4% (2,011,048 total)
- Median new home price: $649,738 (8th highest of 50 states)
- Income needed to afford a typical new home: $188,089
- Median household income: $89,302 (8th highest of 50 states)
26. Iowa
Source: felixmizioznikov / iStock via Getty Images
- Households unable to afford a new, median priced home: 79.5% (1,108,034 total)
- Median new home price: $433,159 (13th lowest of 50 states)
- Income needed to afford a typical new home: $143,356
- Median household income: $69,588 (20th lowest of 50 states)
25. Kansas
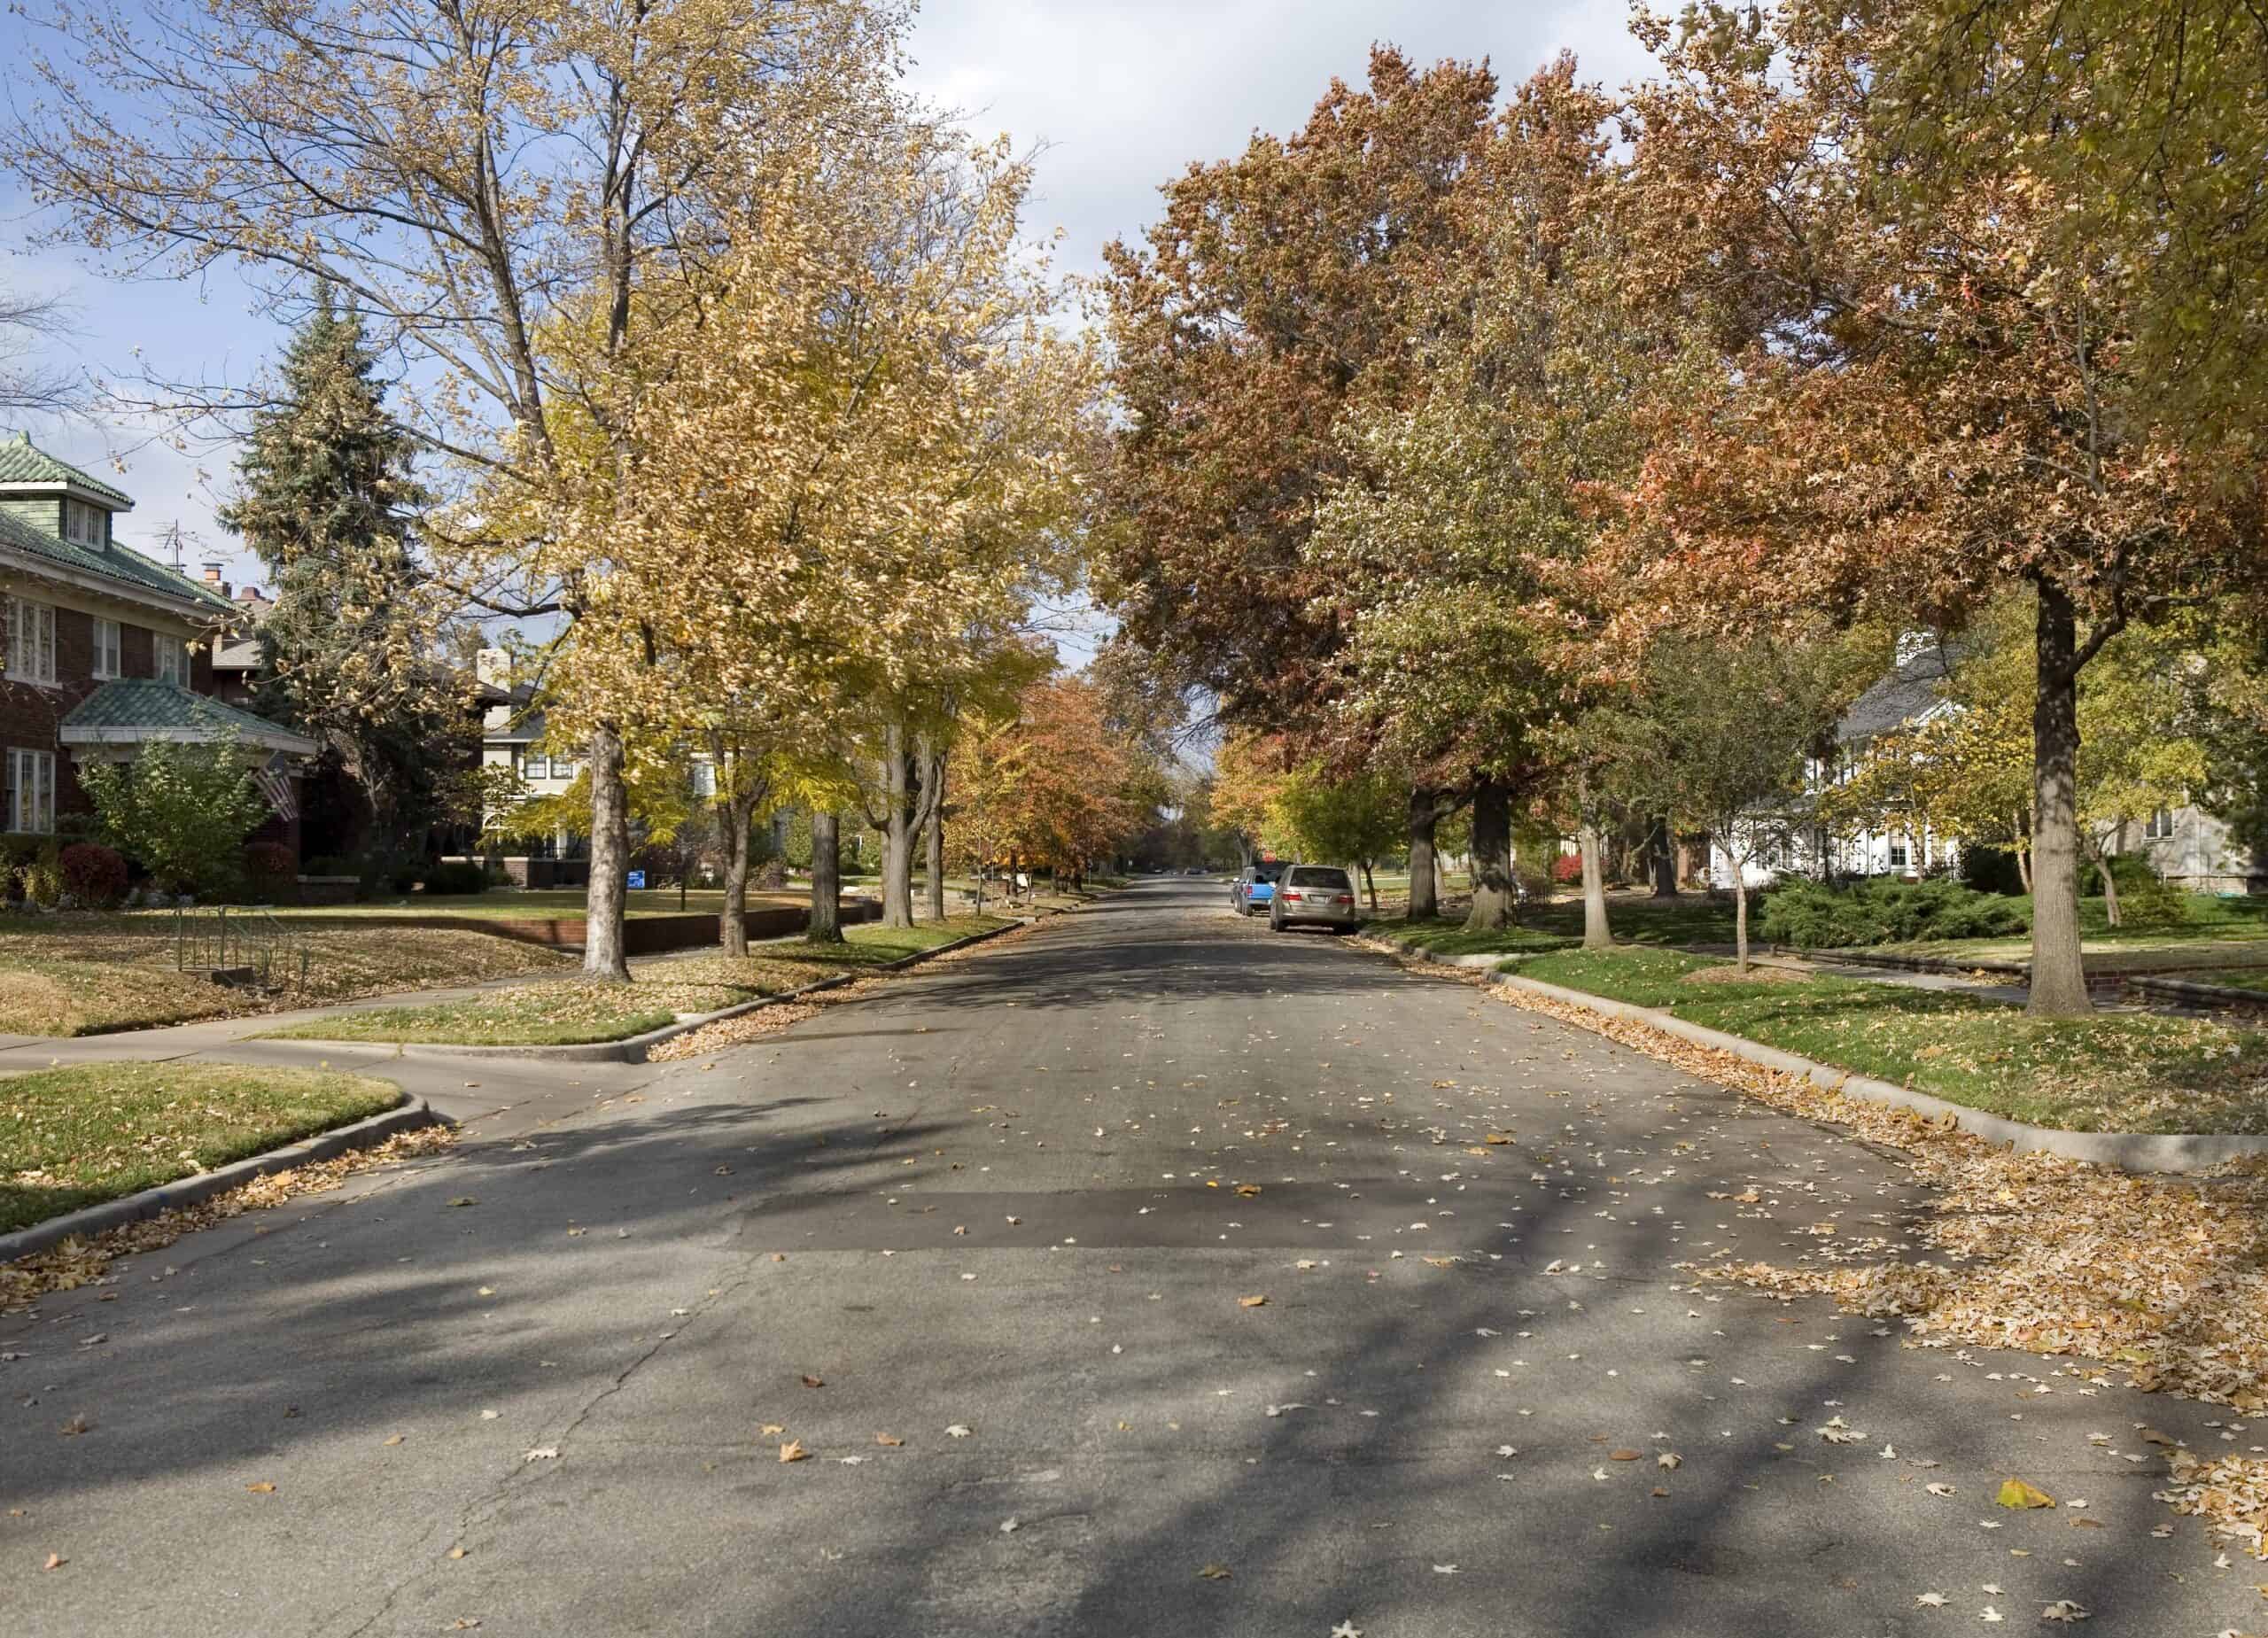
Source: lillisphotography / E+ via Getty Images
- Households unable to afford a new, median priced home: 79.9% (966,102 total)
- Median new home price: $433,159 (13th lowest of 50 states)
- Income needed to afford a typical new home: $142,880
- Median household income: $68,925 (17th lowest of 50 states)
24. Missouri
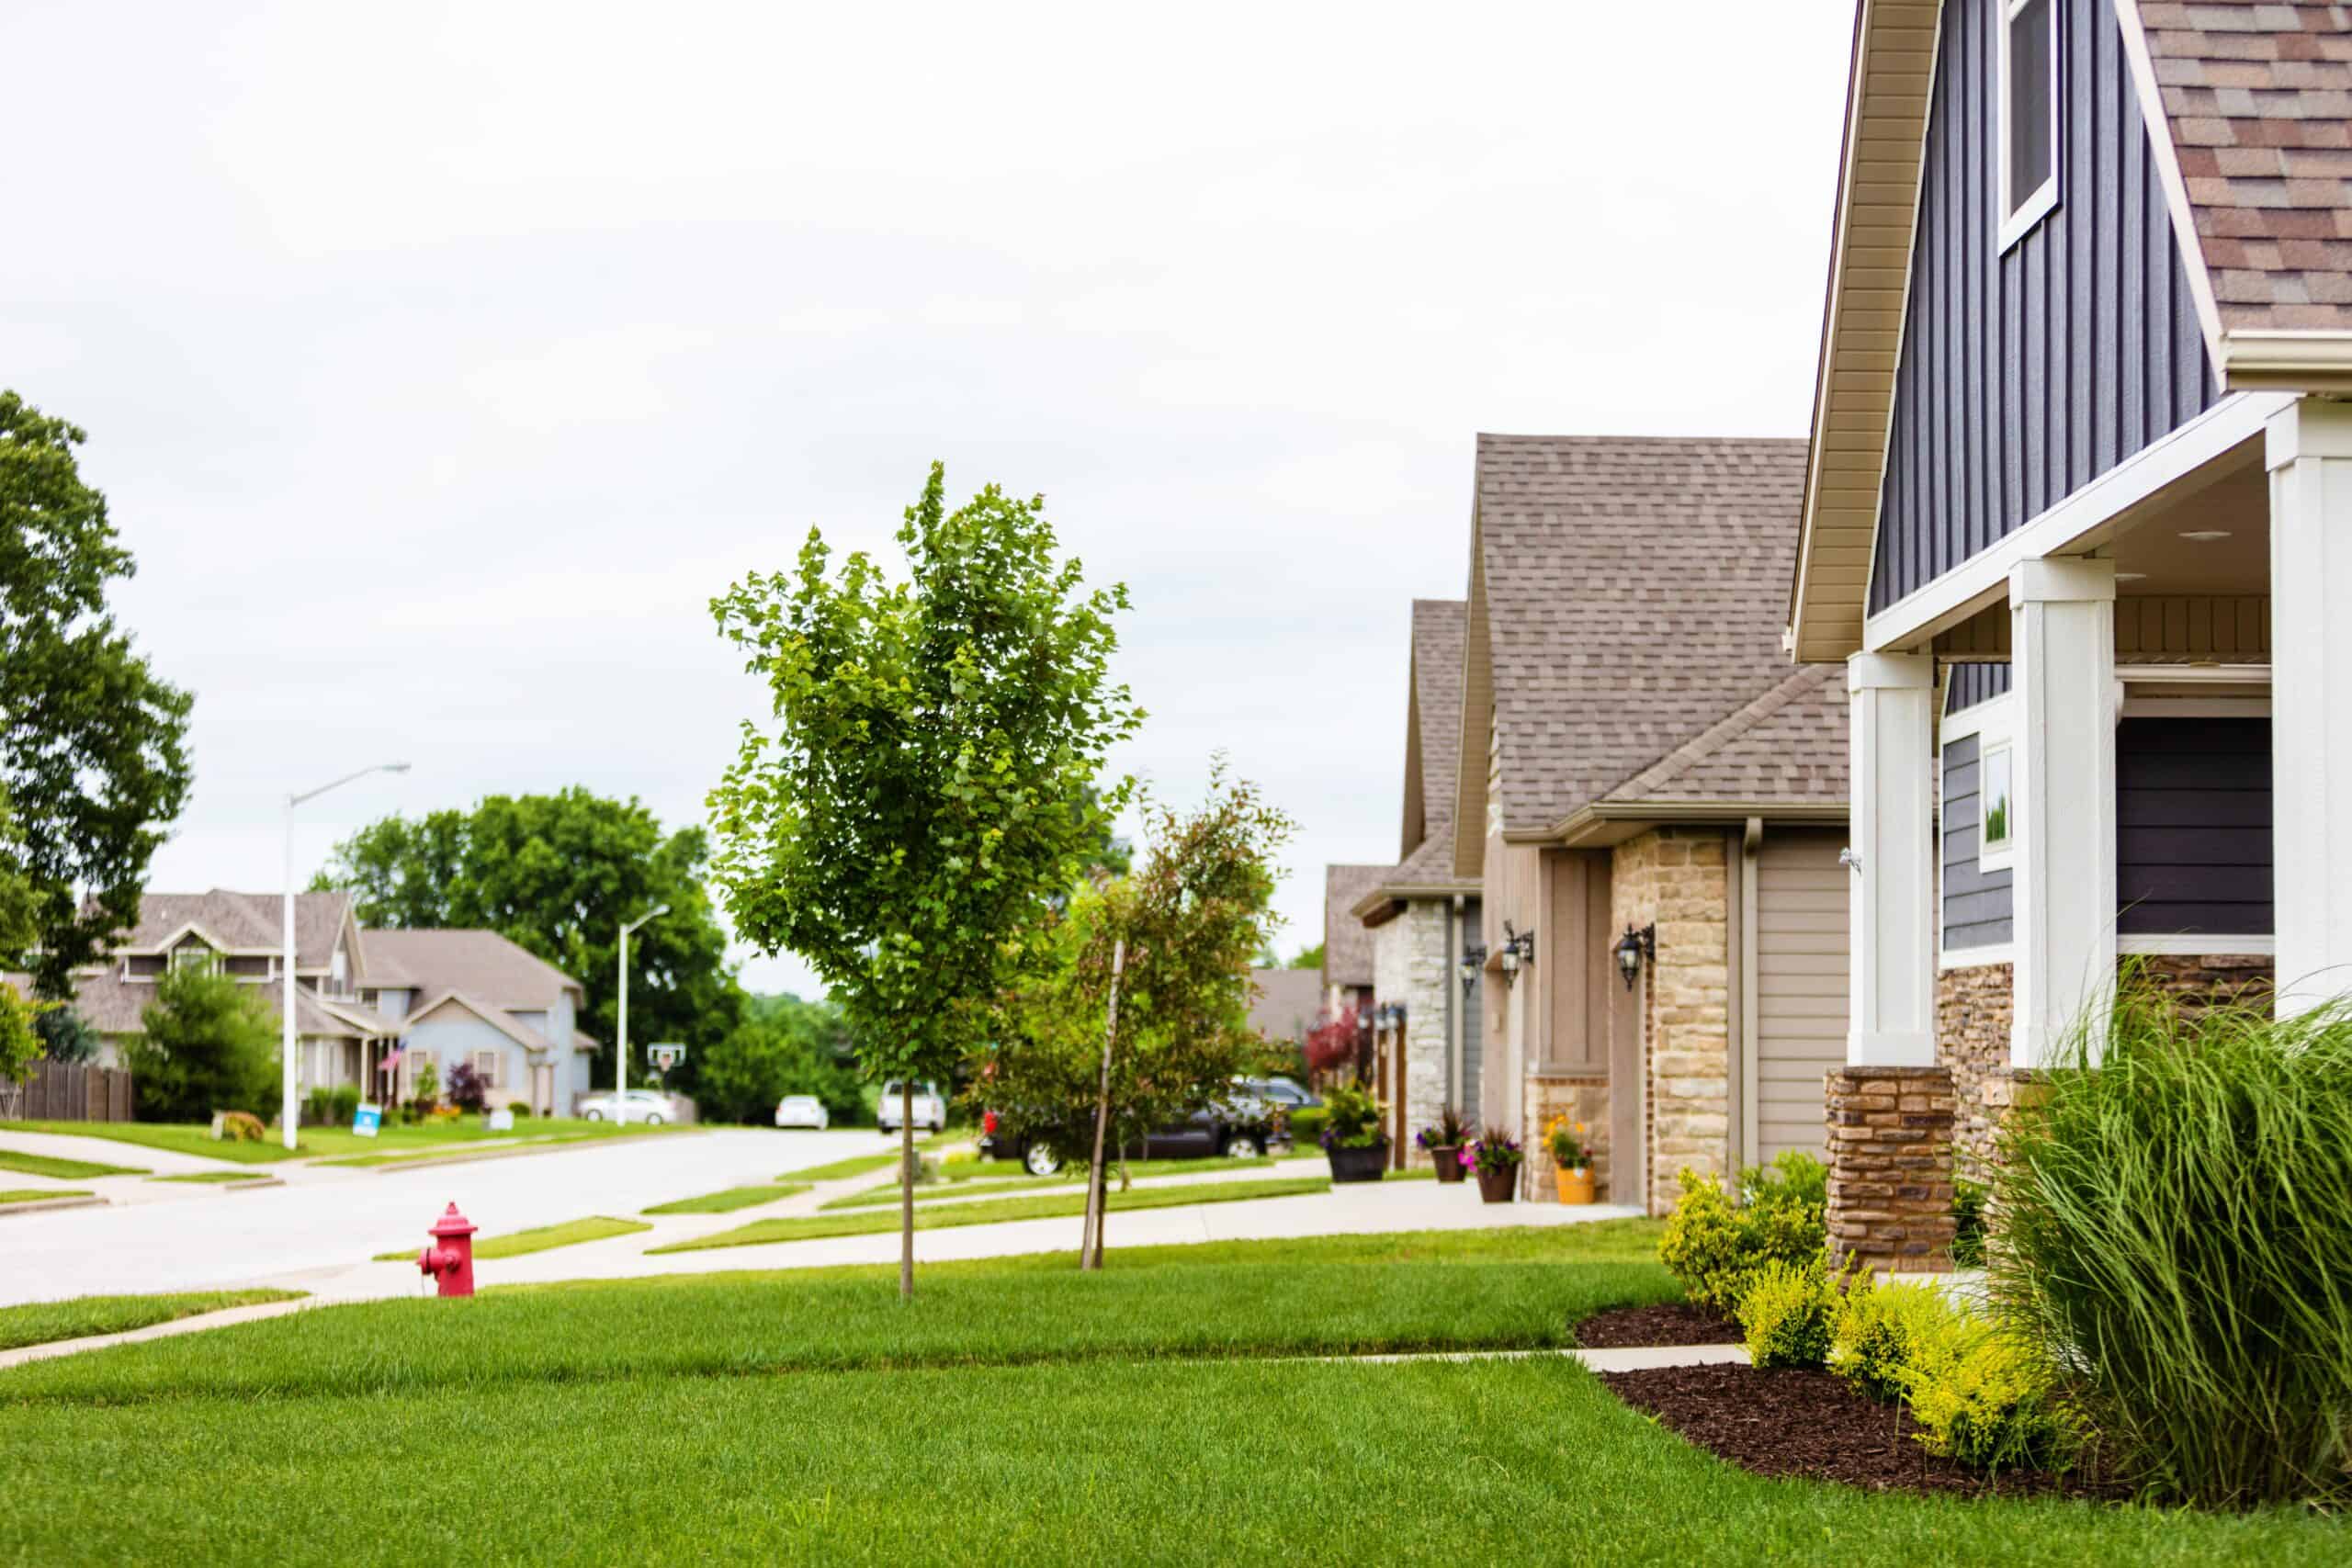
Source: eyecrave productions / iStock via Getty Images
- Households unable to afford a new, median priced home: 80.1% (2,107,440 total)
- Median new home price: $459,957 (20th lowest of 50 states)
- Income needed to afford a typical new home: $143,089
- Median household income: $64,811 (10th lowest of 50 states)
23. Indiana
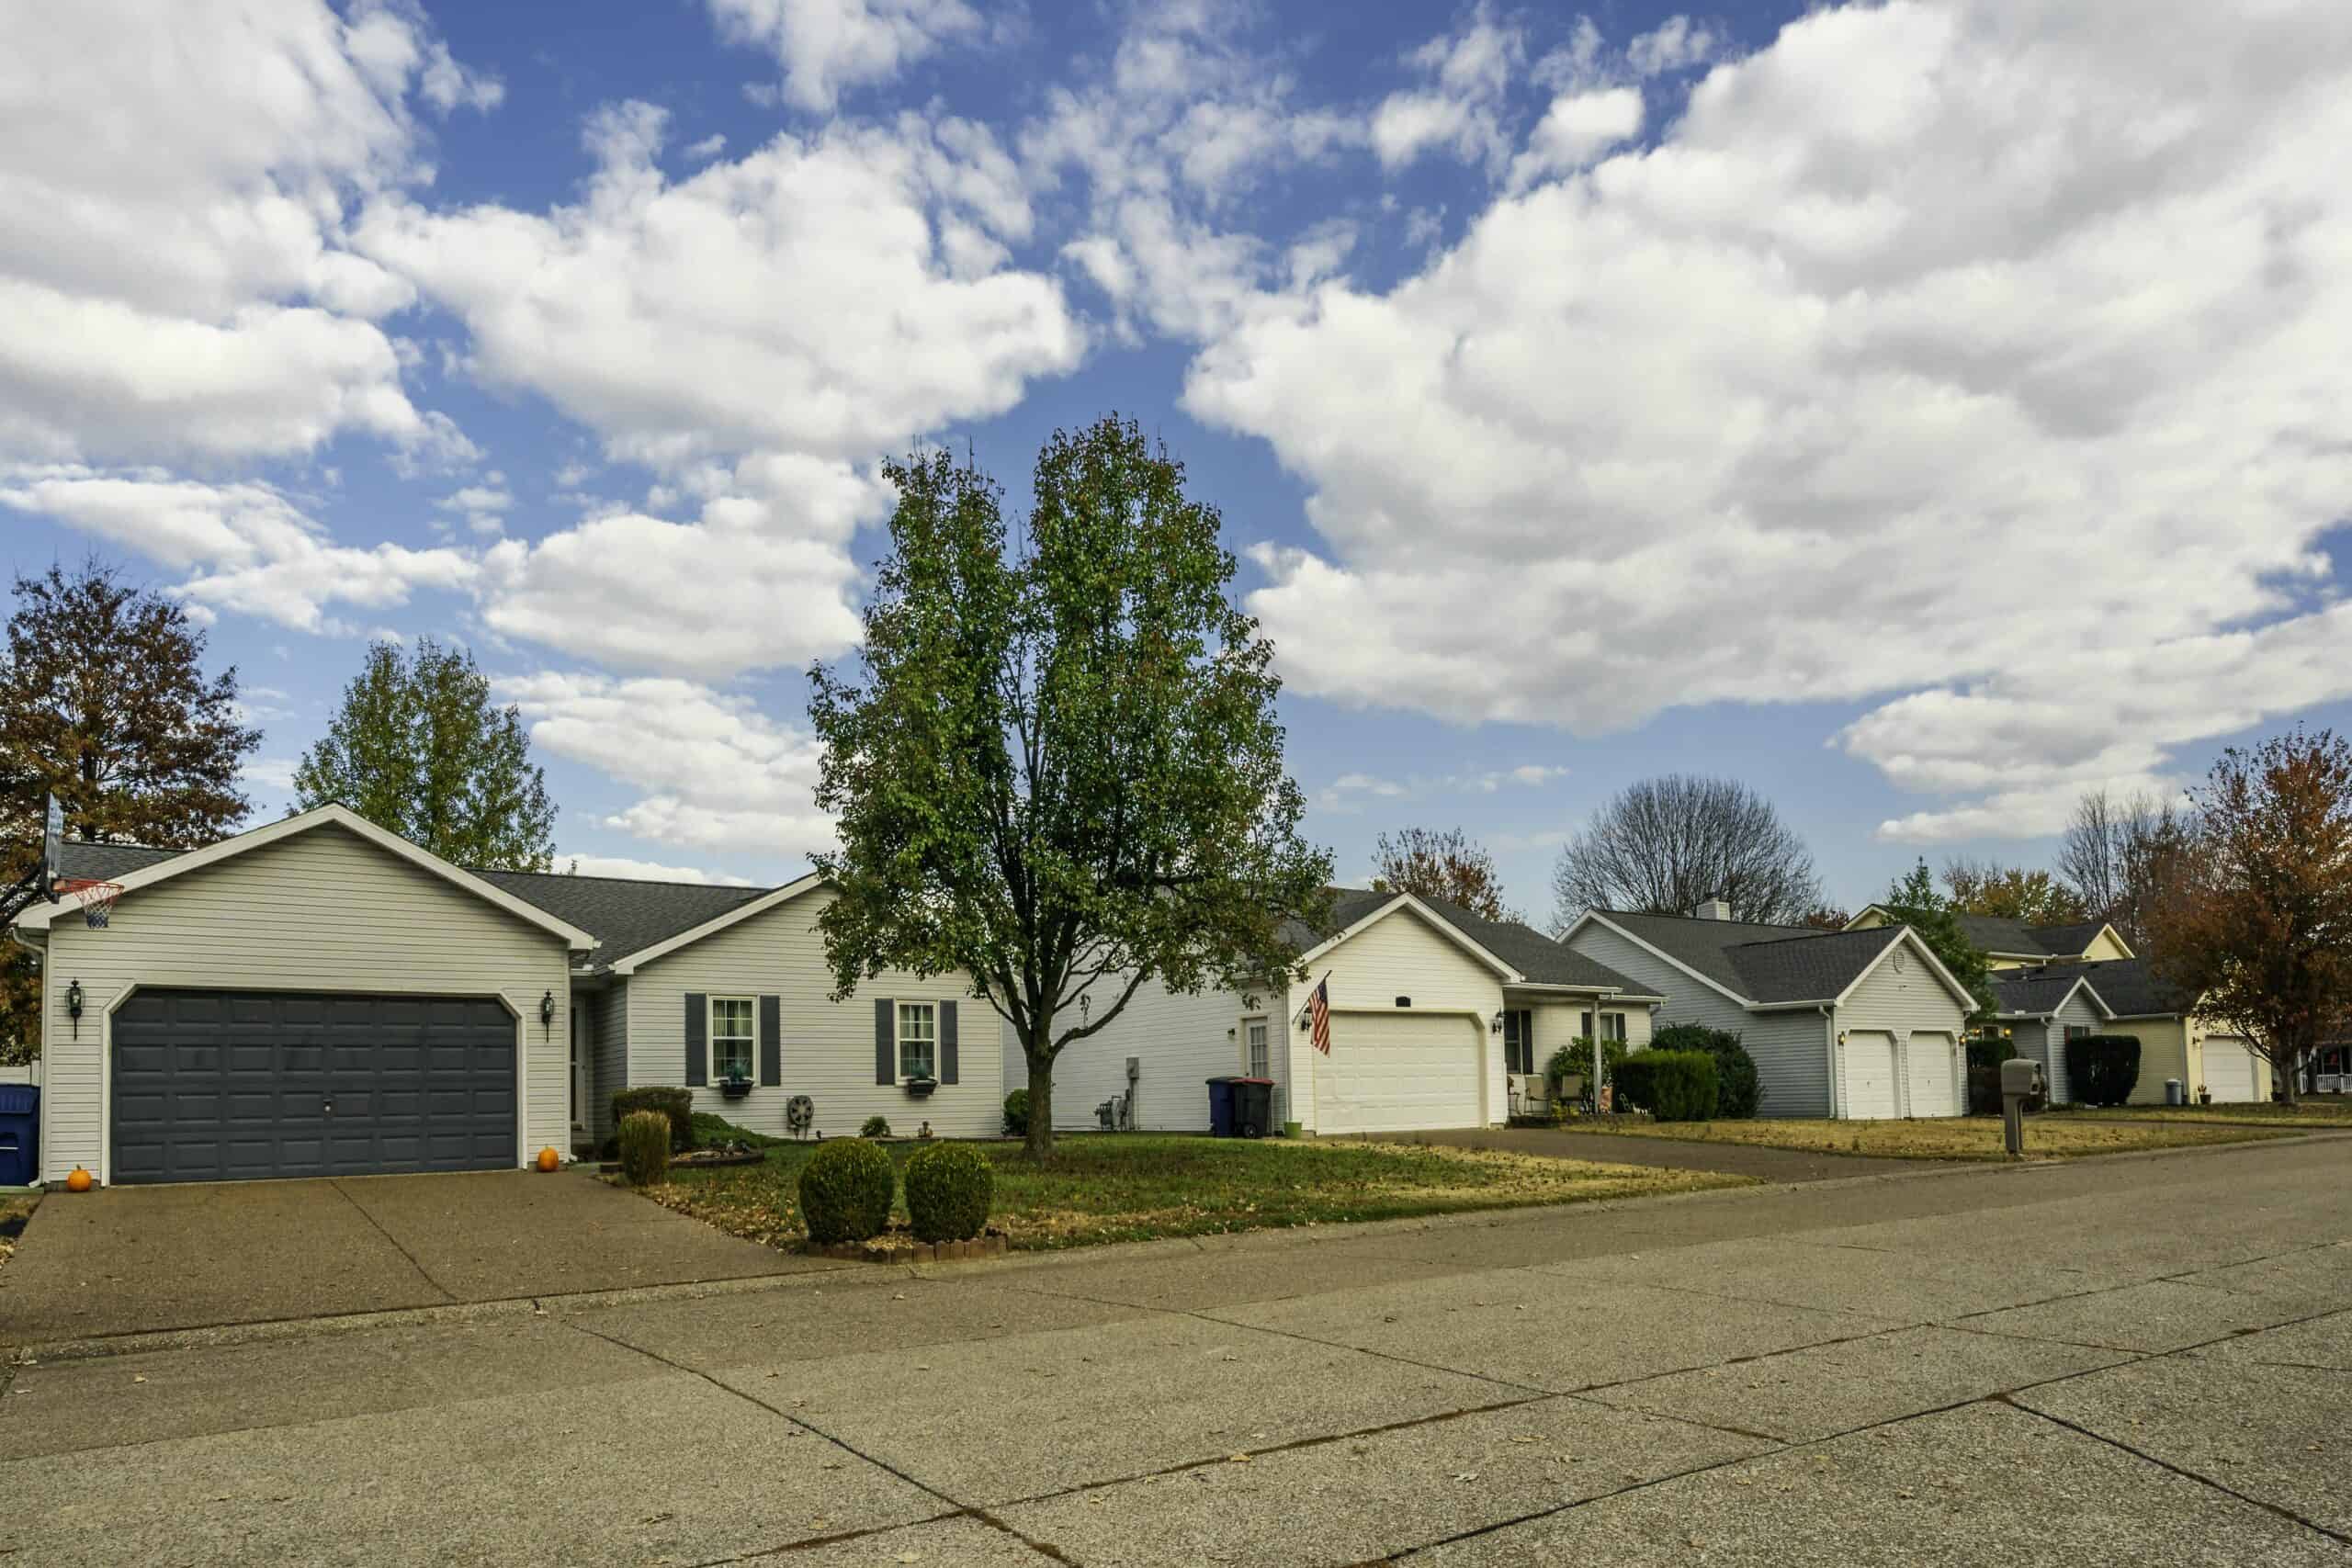
Source: wanderluster / iStock via Getty Images
- Households unable to afford a new, median priced home: 80.5% (2,269,221 total)
- Median new home price: $466,433 (23rd lowest of 50 states)
- Income needed to afford a typical new home: $141,971
- Median household income: $66,785 (13th lowest of 50 states)
22. Arizona
Source: Art Wager / E+ via Getty Images
- Households unable to afford a new, median priced home: 80.8% (2,357,029 total)
- Median new home price: $546,656 (18th highest of 50 states)
- Income needed to afford a typical new home: $156,476
- Median household income: $74,568 (19th highest of 50 states)
21. Utah
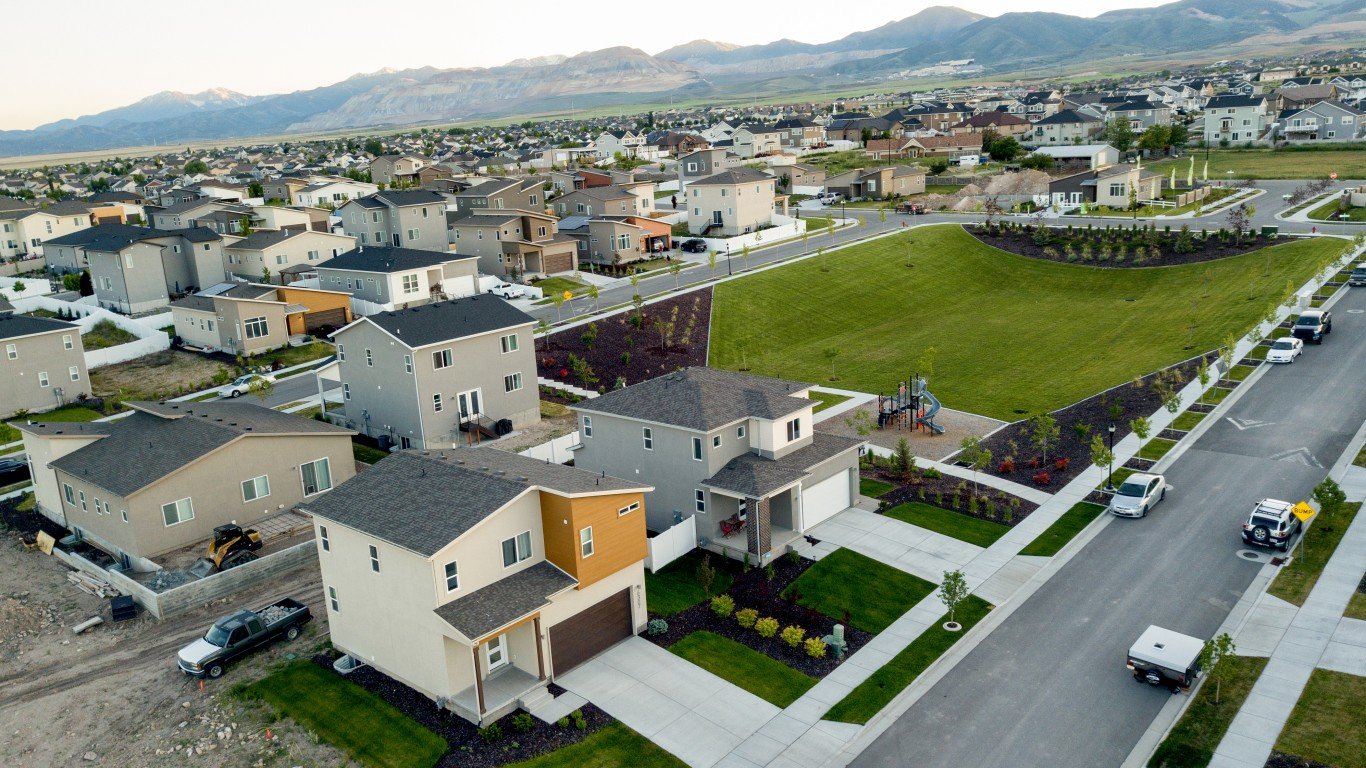
Source: grandriver / iStock via Getty Images
- Households unable to afford a new, median priced home: 81.5% (968,242 total)
- Median new home price: $610,156 (11th highest of 50 states)
- Income needed to afford a typical new home: $174,536
- Median household income: $89,168 (9th highest of 50 states)
20. South Carolina
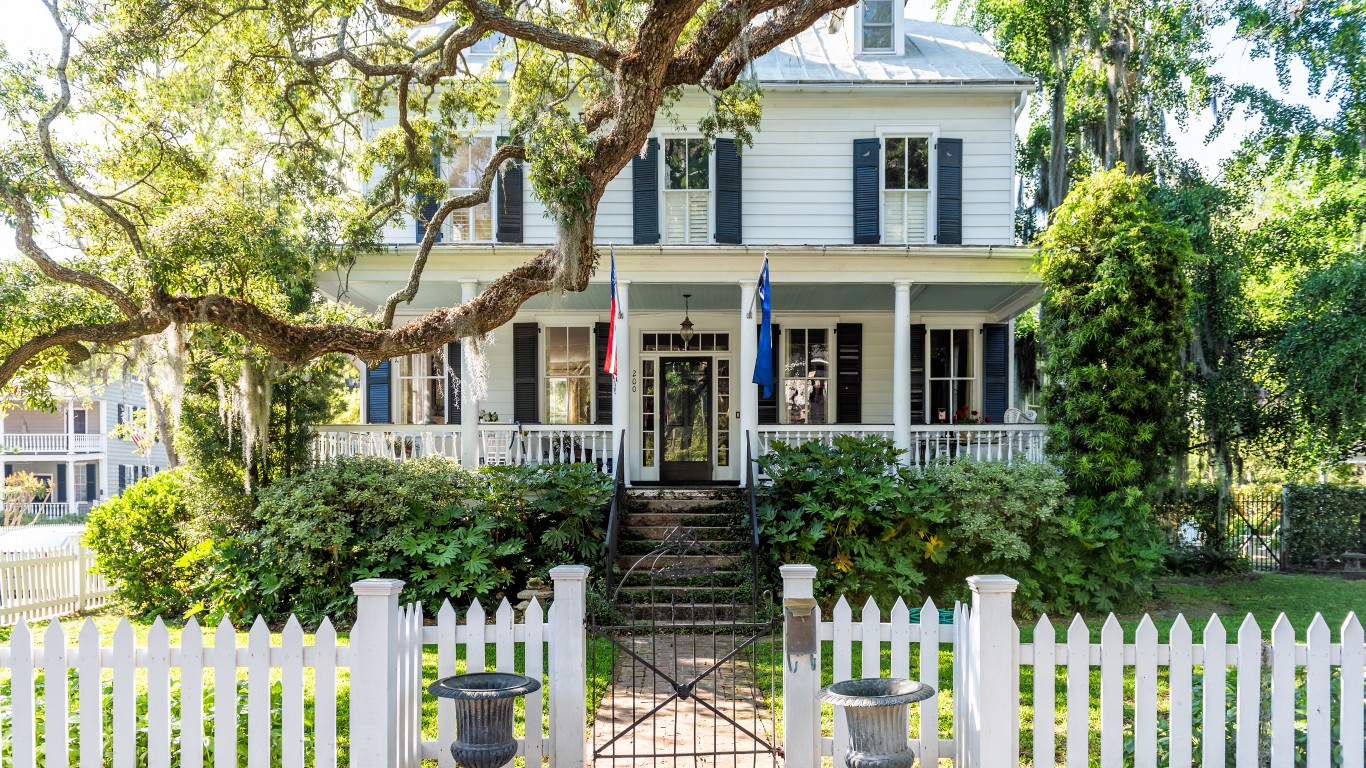
Source: krblokhin / iStock Editorial via Getty Images
- Households unable to afford a new, median priced home: 81.6% (1,892,267 total)
- Median new home price: $487,544 (24th highest of 50 states)
- Income needed to afford a typical new home: $143,060
- Median household income: $64,115 (9th lowest of 50 states)
19. New Mexico

Source: benedek / iStock via Getty Images
- Households unable to afford a new, median priced home: 81.6% (715,694 total)
- Median new home price: $440,032 (15th lowest of 50 states)
- Income needed to afford a typical new home: $132,466
- Median household income: $59,726 (8th lowest of 50 states)
18. Montana
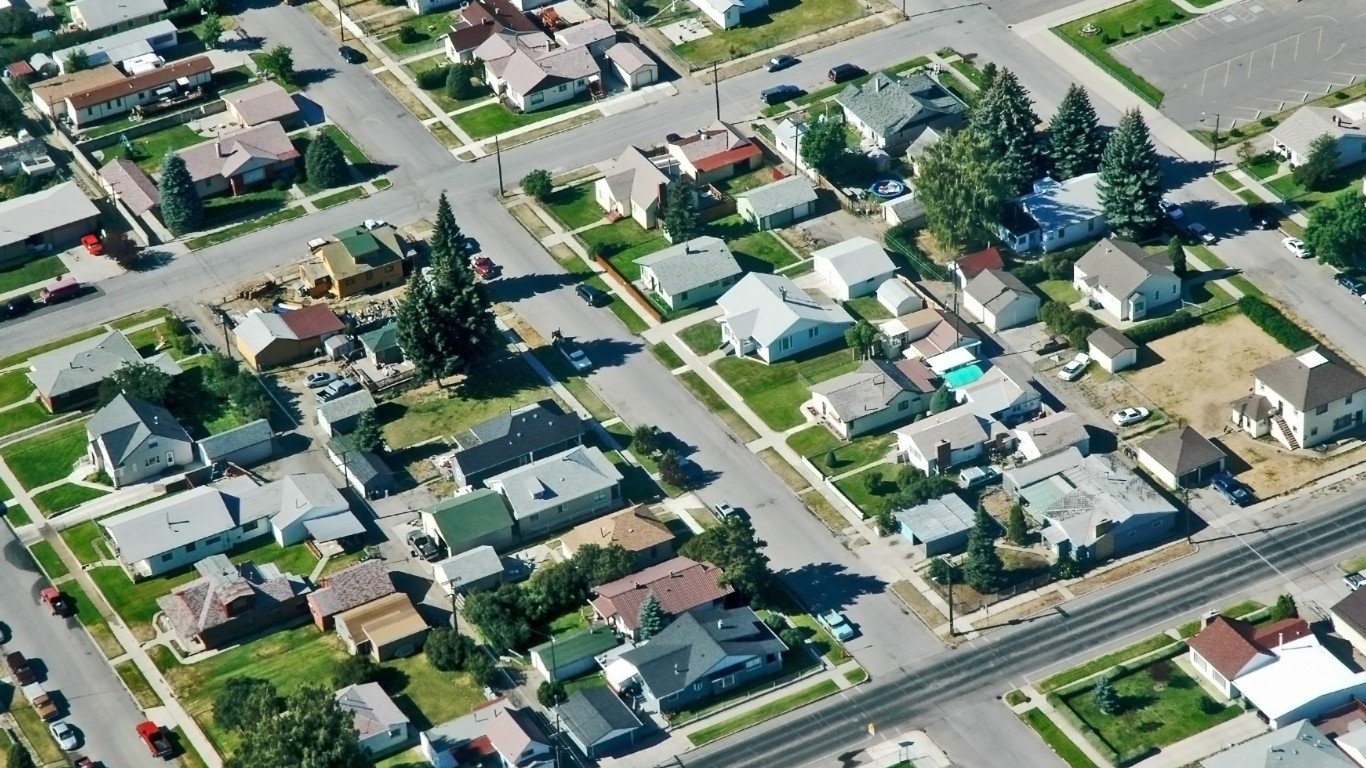
Source: Renphoto / E+ via Getty Images
- Households unable to afford a new, median priced home: 81.8% (405,589 total)
- Median new home price: $514,917 (21st highest of 50 states)
- Income needed to afford a typical new home: $153,287
- Median household income: $67,631 (16th lowest of 50 states)
17. North Dakota

Source: halbergman / iStock via Getty Images
- Households unable to afford a new, median priced home: 82.6% (289,084 total)
- Median new home price: $486,308 (25th highest of 50 states)
- Income needed to afford a typical new home: $153,585
- Median household income: $71,970 (25th highest of 50 states)
16. Nevada

Source: Justin Hartley / iStock via Getty Images
- Households unable to afford a new, median priced home: 83.1% (1,007,715 total)
- Median new home price: $554,458 (17th highest of 50 states)
- Income needed to afford a typical new home: $158,290
- Median household income: $72,333 (23rd highest of 50 states)
15. Pennsylvania
Source: tupungato / iStock via Getty Images
- Households unable to afford a new, median priced home: 83.5% (4,532,599 total)
- Median new home price: $565,618 (16th highest of 50 states)
- Income needed to afford a typical new home: $181,095
- Median household income: $71,798 (25th lowest of 50 states)
14. Washington
Source: 4nadia / iStock via Getty Images
- Households unable to afford a new, median priced home: 83.8% (2,681,167 total)
- Median new home price: $747,199 (5th highest of 50 states)
- Income needed to afford a typical new home: $221,293
- Median household income: $91,306 (6th highest of 50 states)
13. Rhode Island

Source: ThomHartwick / iStock via Getty Images
- Households unable to afford a new, median priced home: 84.0% (386,562 total)
- Median new home price: $595,593 (12th highest of 50 states)
- Income needed to afford a typical new home: $190,440
- Median household income: $81,854 (15th highest of 50 states)
12. Wisconsin
Source: peeterv / iStock via Getty Images
- Households unable to afford a new, median priced home: 85.1% (2,191,983 total)
- Median new home price: $526,044 (19th highest of 50 states)
- Income needed to afford a typical new home: $170,404
- Median household income: $70,996 (24th lowest of 50 states)
11. Louisiana

Source: Lisa-Blue / iStock via Getty Images
- Households unable to afford a new, median priced home: 85.4% (1,608,645 total)
- Median new home price: $485,731 (25th lowest of 50 states)
- Income needed to afford a typical new home: $149,079
- Median household income: $55,416 (3rd lowest of 50 states)
10. Idaho
Source: picmax / iStock via Getty Images
- Households unable to afford a new, median priced home: 85.7% (656,168 total)
- Median new home price: $589,614 (13th highest of 50 states)
- Income needed to afford a typical new home: $168,995
- Median household income: $72,785 (22nd highest of 50 states)
9. Massachusetts

Source: stresstensor / iStock via Getty Images
- Households unable to afford a new, median priced home: 86.3% (2,481,484 total)
- Median new home price: $1,033,271 (2nd highest of 50 states)
- Income needed to afford a typical new home: $319,186
- Median household income: $94,488 (3rd highest of 50 states)
8. Oklahoma

Source: photovs / iStock via Getty Images
- Households unable to afford a new, median priced home: 86.6% (1,406,344 total)
- Median new home price: $499,690 (22nd highest of 50 states)
- Income needed to afford a typical new home: $157,774
- Median household income: $59,673 (6th lowest of 50 states)
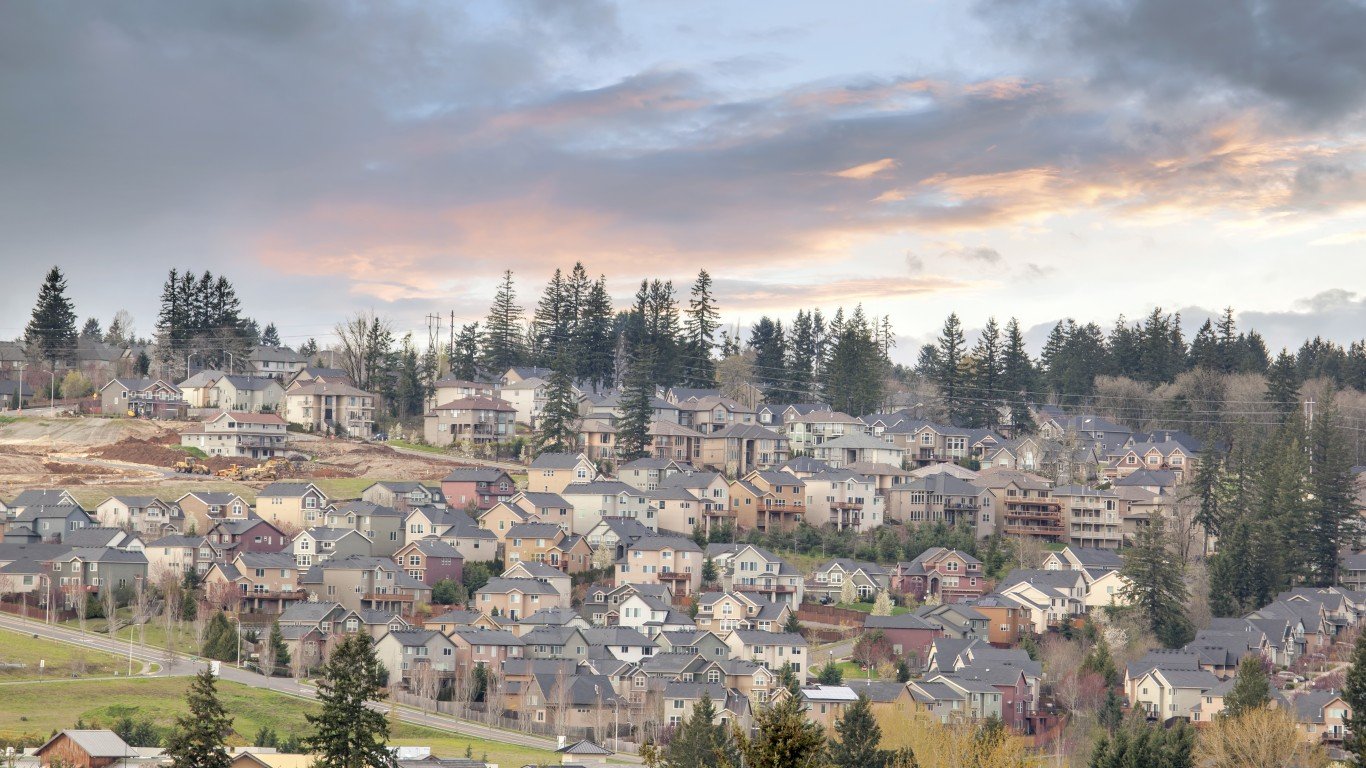
7. Oregon
Source: JPLDesigns / iStock via Getty Images
- Households unable to afford a new, median priced home: 86.7% (1,539,195 total)
- Median new home price: $695,007 (7th highest of 50 states)
- Income needed to afford a typical new home: $206,656
- Median household income: $75,657 (18th highest of 50 states)
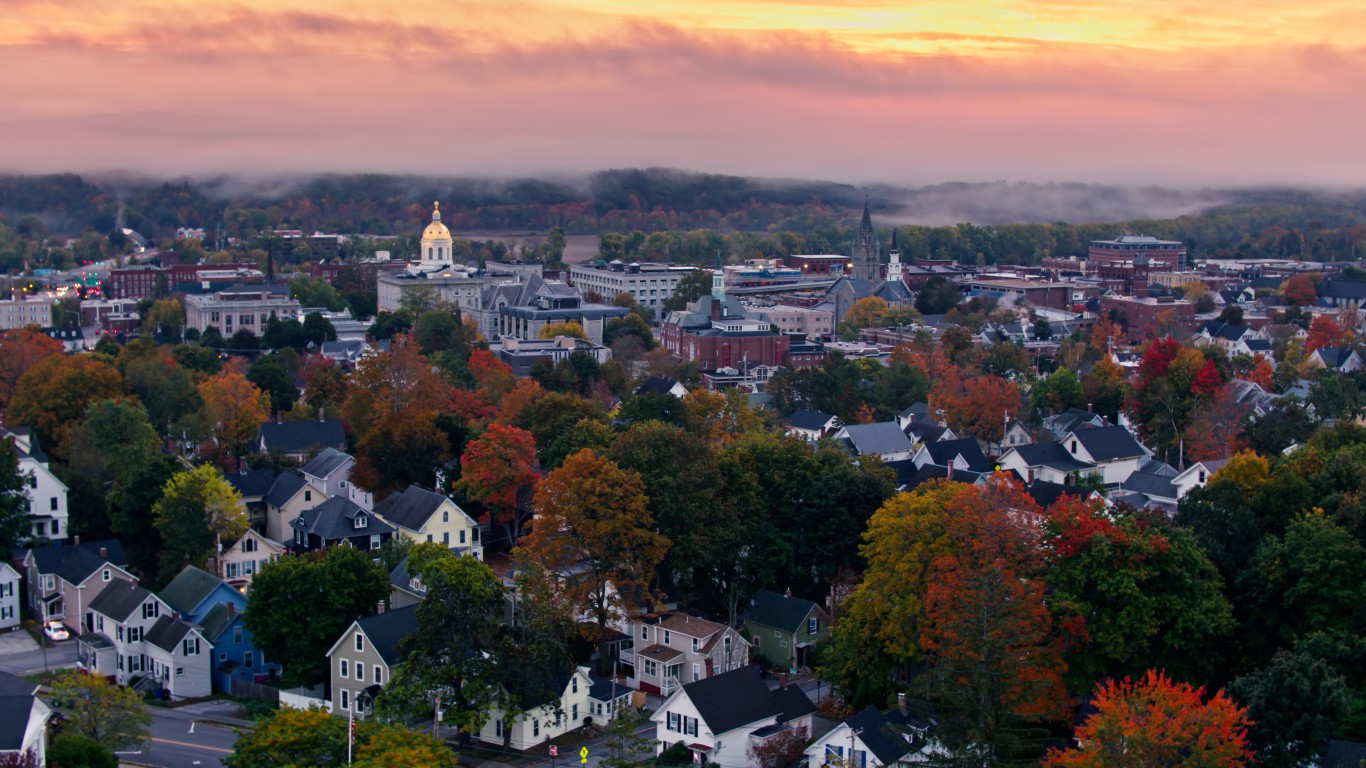
6. New Hampshire
Source: halbergman / iStock via Getty Images
- Households unable to afford a new, median priced home: 86.9% (500,506 total)
- Median new home price: $832,386 (4th highest of 50 states)
- Income needed to afford a typical new home: $274,065
- Median household income: $89,992 (7th highest of 50 states)
5. Wyoming

Source: mujun / iStock via Getty Images
- Households unable to afford a new, median priced home: 87.2% (213,064 total)
- Median new home price: $634,356 (10th highest of 50 states)
- Income needed to afford a typical new home: $187,364
- Median household income: $70,042 (23rd lowest of 50 states)
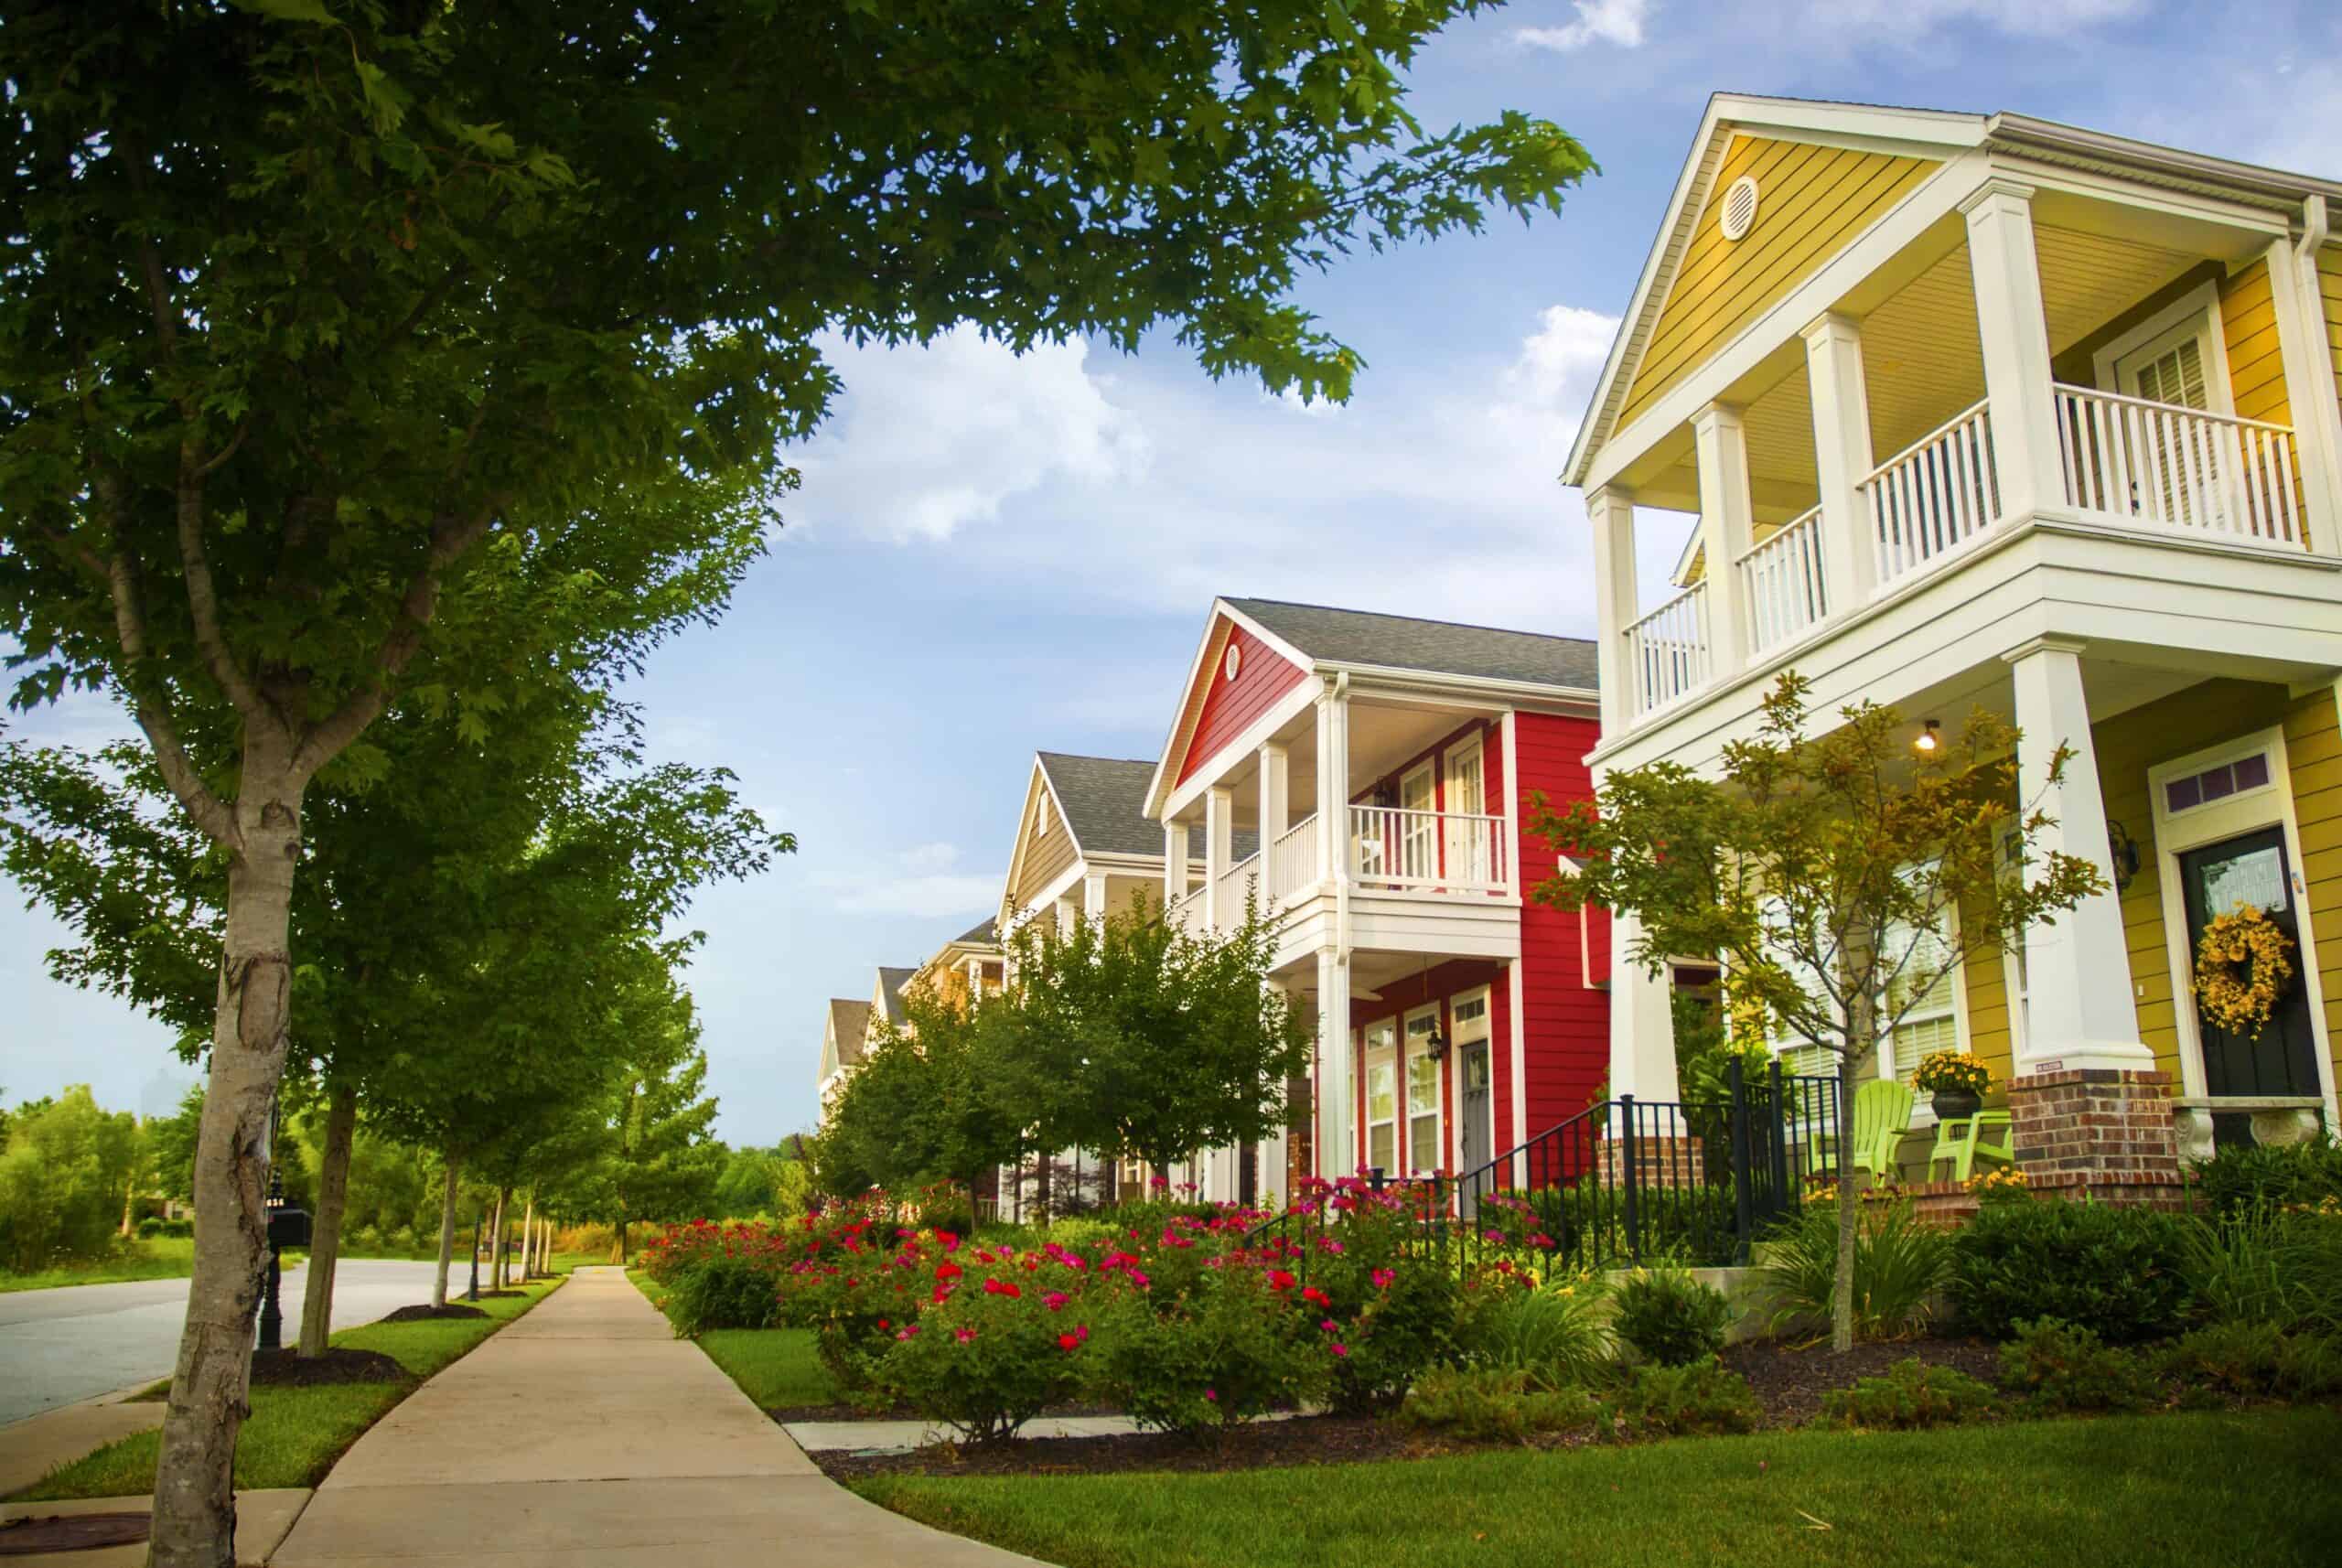
4. Arkansas
Source: BlazenImages / iStock via Getty Images
- Households unable to afford a new, median priced home: 88.1% (1,131,542 total)
- Median new home price: $525,946 (20th highest of 50 states)
- Income needed to afford a typical new home: $158,366
- Median household income: $55,432 (4th lowest of 50 states)
3. Hawaii

Source: Art Wager / E+ via Getty Images
- Households unable to afford a new, median priced home: 88.5% (446,229 total)
- Median new home price: $1,082,897 (the highest of 50 states)
- Income needed to afford a typical new home: $300,609
- Median household income: $92,458 (4th highest of 50 states)
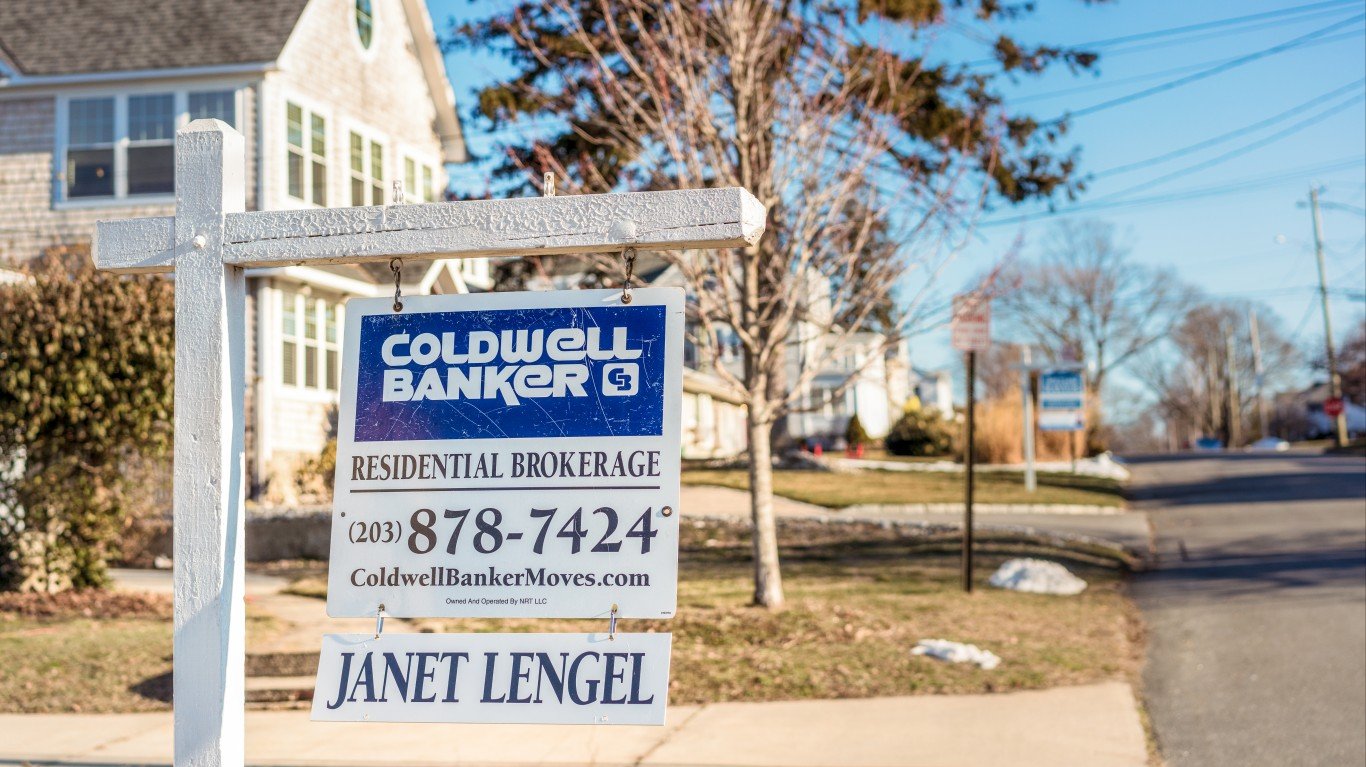
2. Connecticut
Source: georgeclerk / iStock Unreleased via Getty Images
- Households unable to afford a new, median priced home: 89.0% (1,285,181 total)
- Median new home price: $941,884 (3rd highest of 50 states)
- Income needed to afford a typical new home: $319,368
- Median household income: $88,429 (10th highest of 50 states)
1. Vermont

Source: AlbertPego / iStock via Getty Images
- Households unable to afford a new, median priced home: 91.8% (267,550 total)
- Median new home price: $712,378 (6th highest of 50 states)
- Income needed to afford a typical new home: $234,937
- Median household income: $73,991 (20th highest of 50 states)
Take This Retirement Quiz To Get Matched With An Advisor Now (Sponsored)
Are you ready for retirement? Planning for retirement can be overwhelming, that’s why it could be a good idea to speak to a fiduciary financial advisor about your goals today.
Start by taking this retirement quiz right here from SmartAsset that will match you with up to 3 financial advisors that serve your area and beyond in 5 minutes. Smart Asset is now matching over 50,000 people a month.
Click here now to get started.
Thank you for reading! Have some feedback for us?
Contact the 24/7 Wall St. editorial team.
Editors' Picks