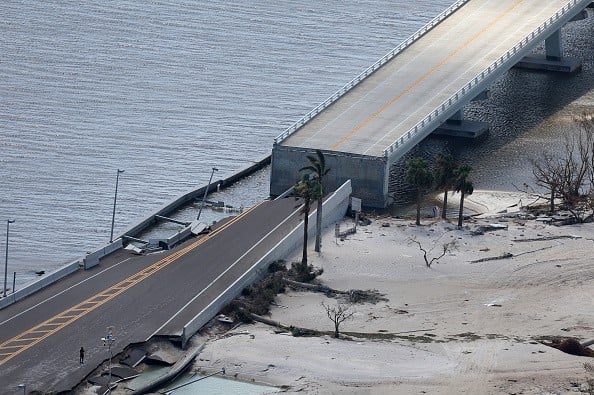
Last week, the port of Baltimore finally reopened fully for the first time since the tragic collapse of the Francis Scott Keys Bridge last March. Maryland Governor Wes Moore stated in a press release, “One of our four key directives in the wake of the Key Bridge collapse has been to fully clear the federal channel. Today, we bring that directive to completion. By working together, we turned months into weeks – and bounced back faster than many could have ever anticipated.” Engineers at Johns Hopkins University are currently investigating what led to the devastating bridge failure and what other bridges across the country are at risk.
At 24/7 Wall St., we took a deep dive into the data to uncover which bridges across the country are the most vulnerable. Using the Libertarian Reason Foundation’s 27th Annual Highway Report, we listed states in order of the percentage of structurally deficient bridges, ranking from lowest to highest. The report provides overall highway performance scores ranging from 1 to 50, with 50 being the best. The rankings are generated using 13 category scores, including deficient bridges, traffic fatalities, traffic congestion, urban and rural pavement conditions, spending per mile, and administrative costs per mile of highway. And finally, we’ve included each state’s most impressive bridge, which came from Love Exploring.
The Reason Foundation report found that of all the states, Florida made the most improvements nationwide in one year, jumping 33 spots from 41st to 8th in the overall rankings from 2020 to 2021. On the other hand, Idaho fell the farthest, from 8th to 34th. (Also see: This State Has the Worst Highways in America.)
The report revealed overall, the state of the nation’s bridges improved only slightly from 2020 to 2021, from 45,861 structurally deficient bridges in 2020 to 43,289 in 2021. The worst offender on the list is West Virginia, with over 20% of its bridges deemed structurally deficient, while Arizona sits on top with only 1.38% of structurally deficient bridges.
What is the condition of bridges in your state? Read on to find out how each state ranks.
Why This Matters
Source: tbabasade / iStock via Getty Images
Many Americans cross bridges each day on their daily commute. Reliable bridges are critical for public safety and the nation’s economy. However, most bridges in America were built to last 50 to 70 years, and 42% of bridges are at least 50 years old. While bridges get inspected every two years, and those deemed deficient are eligible for federal funding for repairs, it’s the policymakers that allocate funds for infrastructure improvements. Unless we increase spending on bridge rehabilitation, it will take many years to get America’s bridges back in shape.
50. Arizona

Source: Pavliha / iStock via Getty Images
- Percentage of structurally deficient bridges in 2021: 1.38%
- Capital and bridge disbursements (the costs to build new, and widen existing, highways and bridges) in 2020: $68,623 per lane-mile
- Expected capital and bridge disbursements in 2020: $44,429 per lane-mile
- Adjusted ratio: 1.54 — 5th lowest
- Highway system overall rank: 30
- State-control highway miles: 20,046 — 20th lowest
- Most impressive bridge: Glen Canyon Dam Bridge
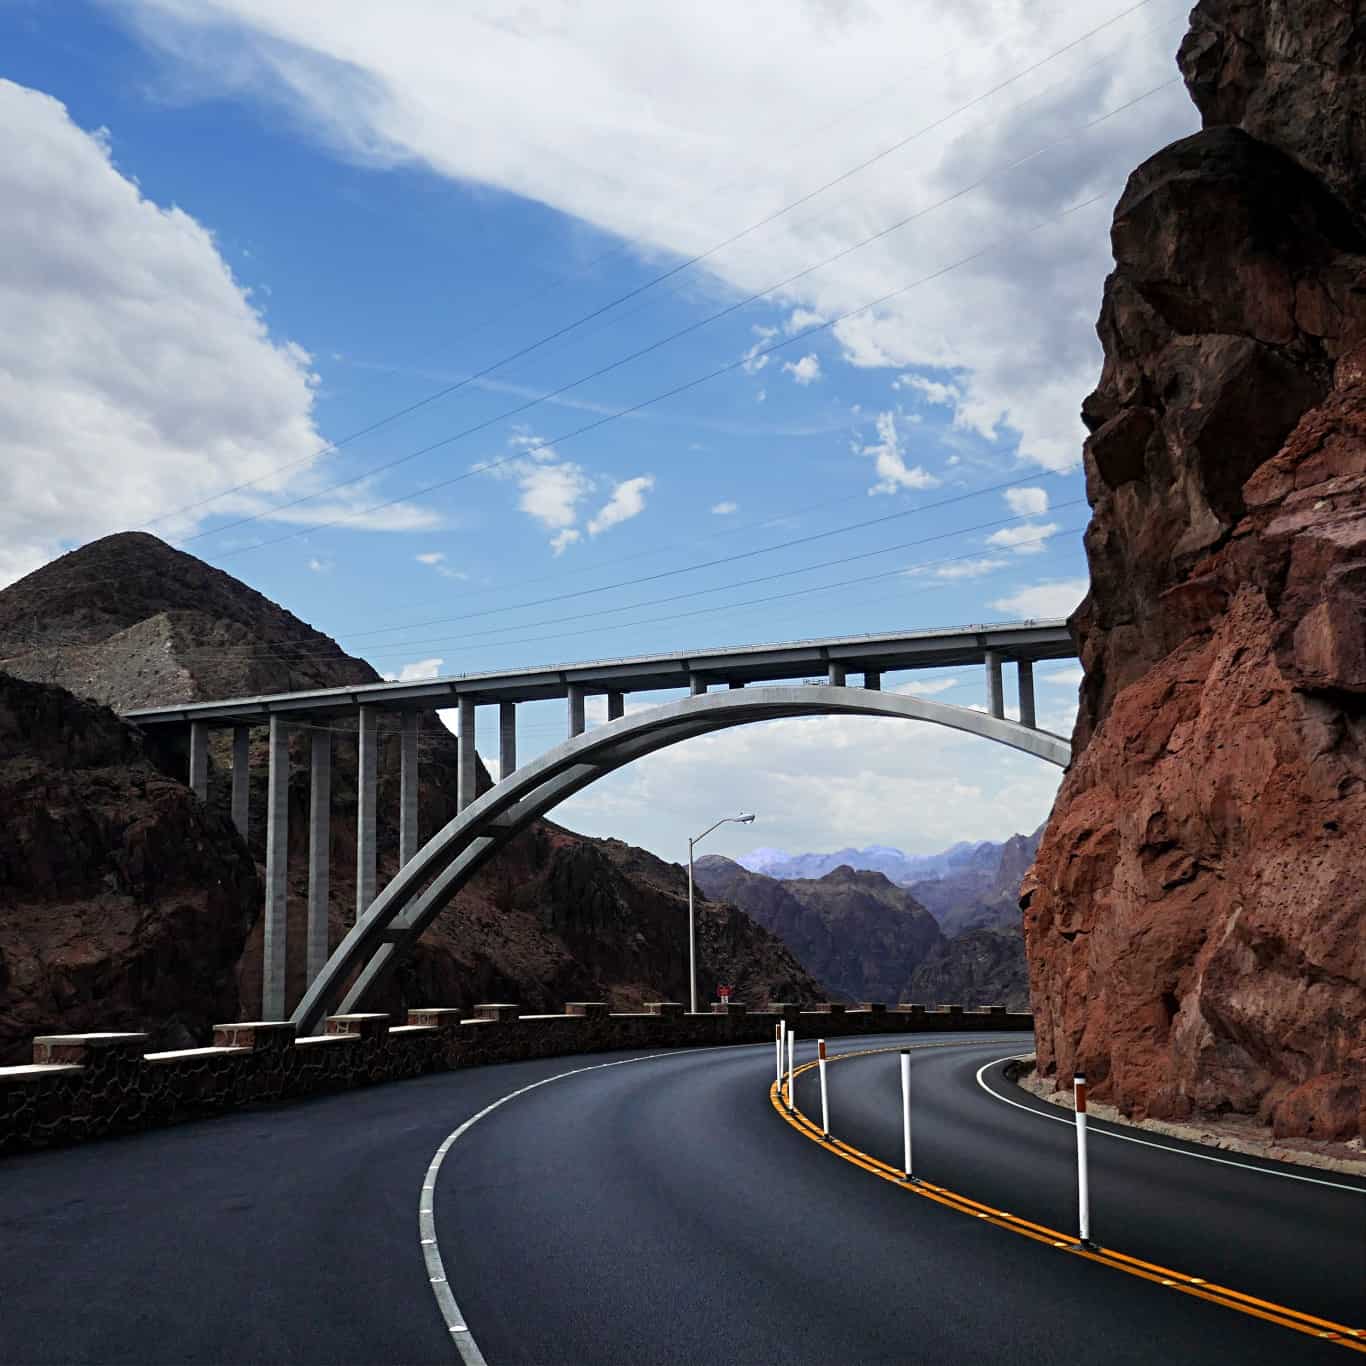
49. Nevada
Source: pom-angers / Flickr
- Percentage of structurally deficient bridges in 2021: 1.40%
- Capital and bridge disbursements (the costs to build new, and widen existing, highways and bridges) in 2020: $51,121 per lane-mile
- Expected capital and bridge disbursements in 2020: $37,692 per lane-mile
- Adjusted ratio: 1.36 — 7th lowest
- Highway system overall rank: 21
- State-control highway miles: 13,509 — 11th lowest
- Most impressive bridge: Mike O’Callaghan-Pat Tillman Memorial Bridge
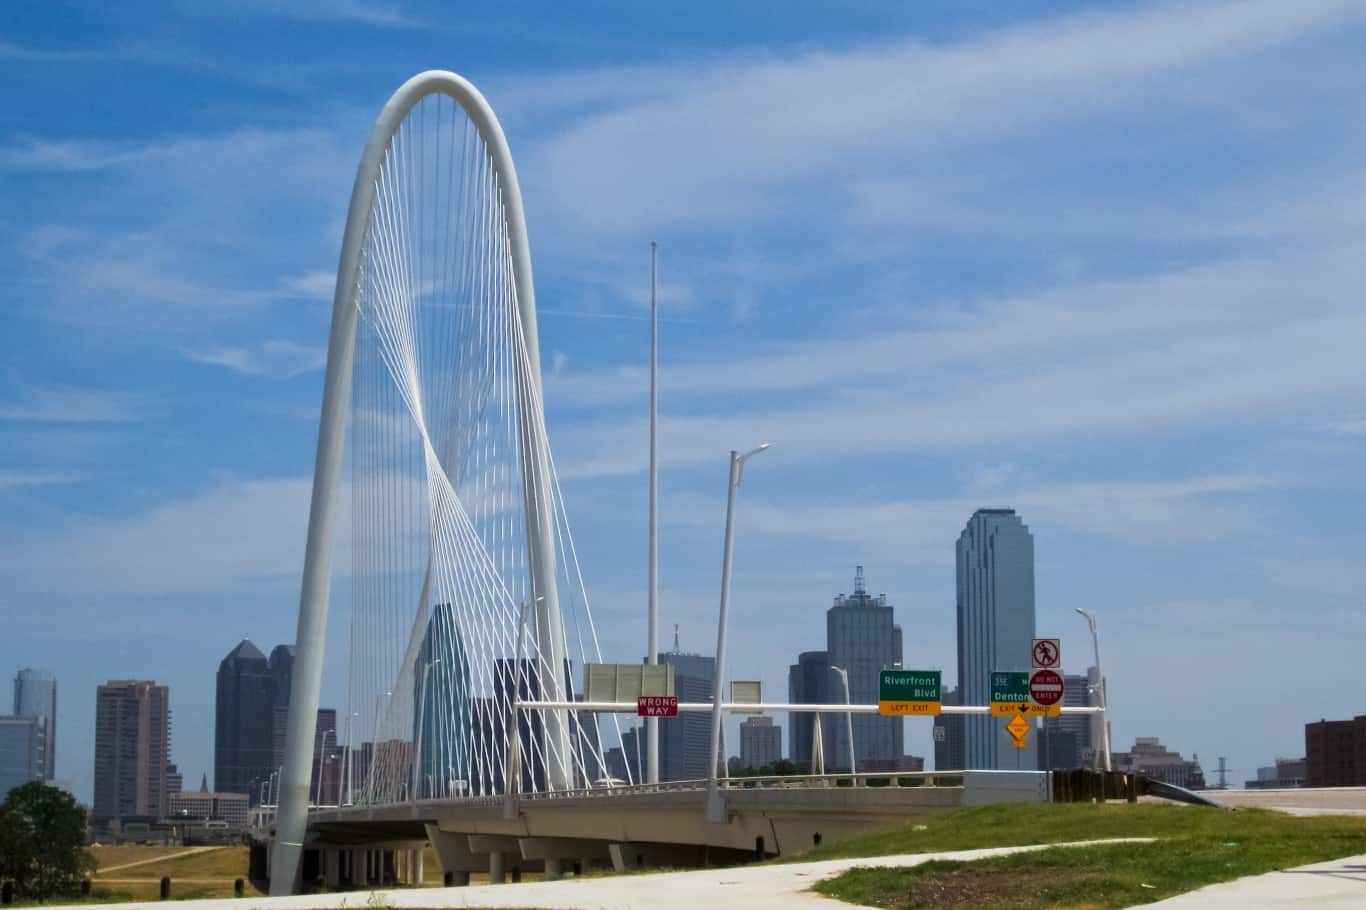
48. Texas
Source: mrlaugh / Flickr
- Percentage of structurally deficient bridges, 2021: 1.43%
- Capital and bridge disbursements (the costs to build new, and widen existing, highways and bridges) in 2020: $48,485 per lane-mile
- Expected capital and bridge disbursements in 2020: $44,236 per lane-mile
- Adjusted ratio: 1.10 — 20th lowest
- Highway system overall rank: 19
- State-control highway miles: 198,465 — the highest
- Most impressive bridge: Margaret Hunt Hill Bridge
47. Delaware
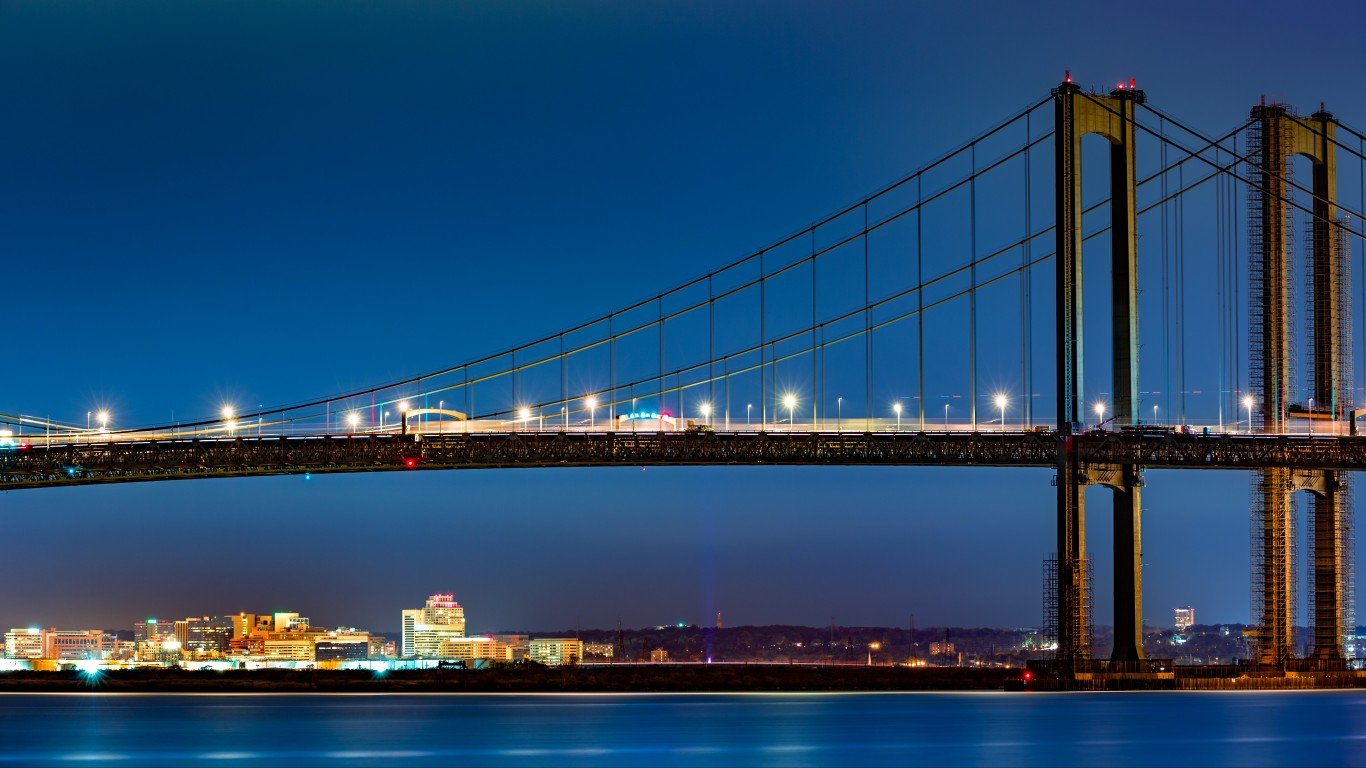
Source: Ultima_Gaina / iStock via Getty Images
- Percentage of structurally deficient bridges in 2021: 1.94%
- Capital and bridge disbursements (the costs to build new, and widen existing, highways and bridges) in 2020: $49,325 per lane-mile
- Expected capital and bridge disbursements in 2020: $82,074 per lane-mile
- Adjusted ratio: 0.60 — 10th highest
- Highway system overall rank: 35
- State-control highway miles: 11,998 — 9th lowest
- Most impressive bridge in Delaware: Delaware Memorial Bridge
46. Utah
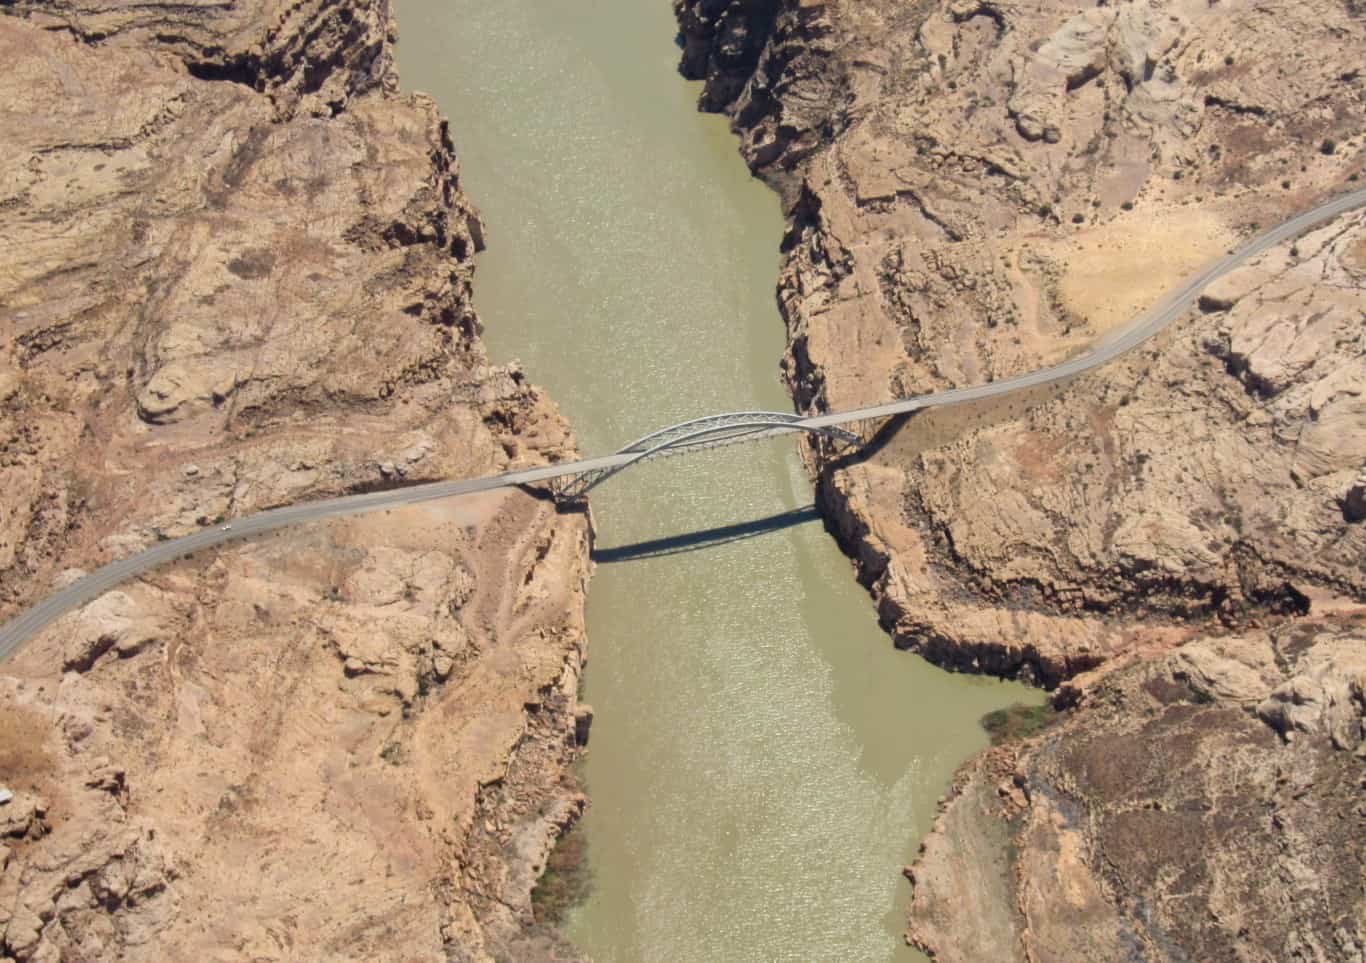
Source: nelsonminar / Flickr
- Percentage of structurally deficient bridges in 2021: 2.06%
- Capital and bridge disbursements (the costs to build new, and widen existing, highways and bridges) in 2020: $58,599 per lane-mile
- Expected capital and bridge disbursements in 2020: $45,052 per lane-mile
- Adjusted ratio: 1.30 — 11th lowest
- Highway system overall rank: 10
- State-control highway miles: 16,023 — 14th lowest
- Most impressive bridge in Utah: Hite Crossing Bridge
45. Georgia
Source: Sean Pavone / iStock via Getty Images
- Percentage of structurally deficient bridges in 2021: 2.13%
- Capital and bridge disbursements (the costs to build new, and widen existing, highways and bridges) in 2020: $31,611 per lane-mile
- Expected capital and bridge disbursements in 2020: $56,314 per lane-mile
- Adjusted ratio: 0.56 — 8th highest
- Highway system overall rank: 4
- State-control highway miles: 49,497 — 11th highest
- Most impressive bridge in Georgia: Tallulah Gorge Bridge
44. Vermont
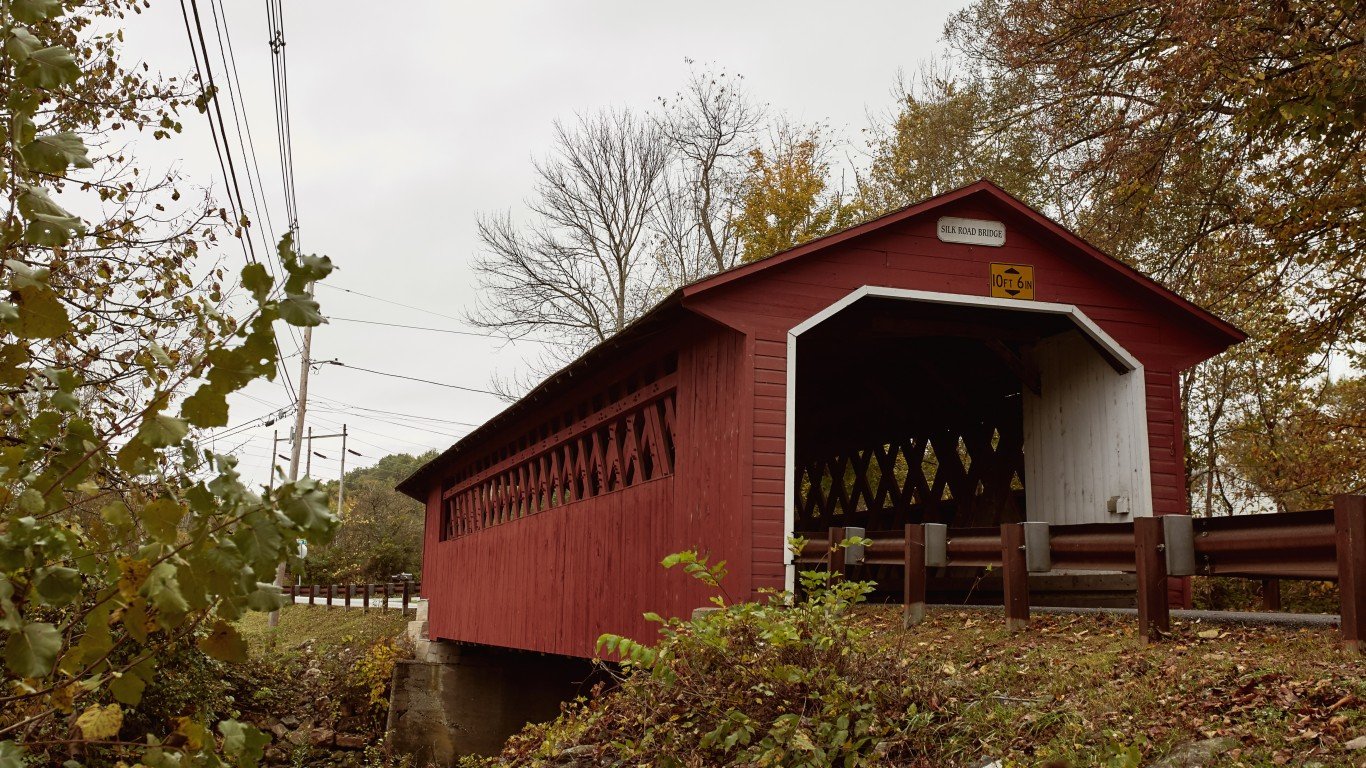
Source: Jen Lobo / iStock via Getty Images
- Percentage of structurally deficient bridges in 2021: 2.40%
- Capital and bridge disbursements (the costs to build new, and widen existing, highways and bridges) in 2020: $32,497 per lane-mile
- Expected capital and bridge disbursements in 2020: $26,905 per lane-mile
- Adjusted ratio: 1.21 — 16th lowest
- Highway system overall rank: 38
- State-control highway miles: 5,998 — 3rd lowest
- Most impressive bridge in Vermont: Silk Covered Bridge
43. Florida
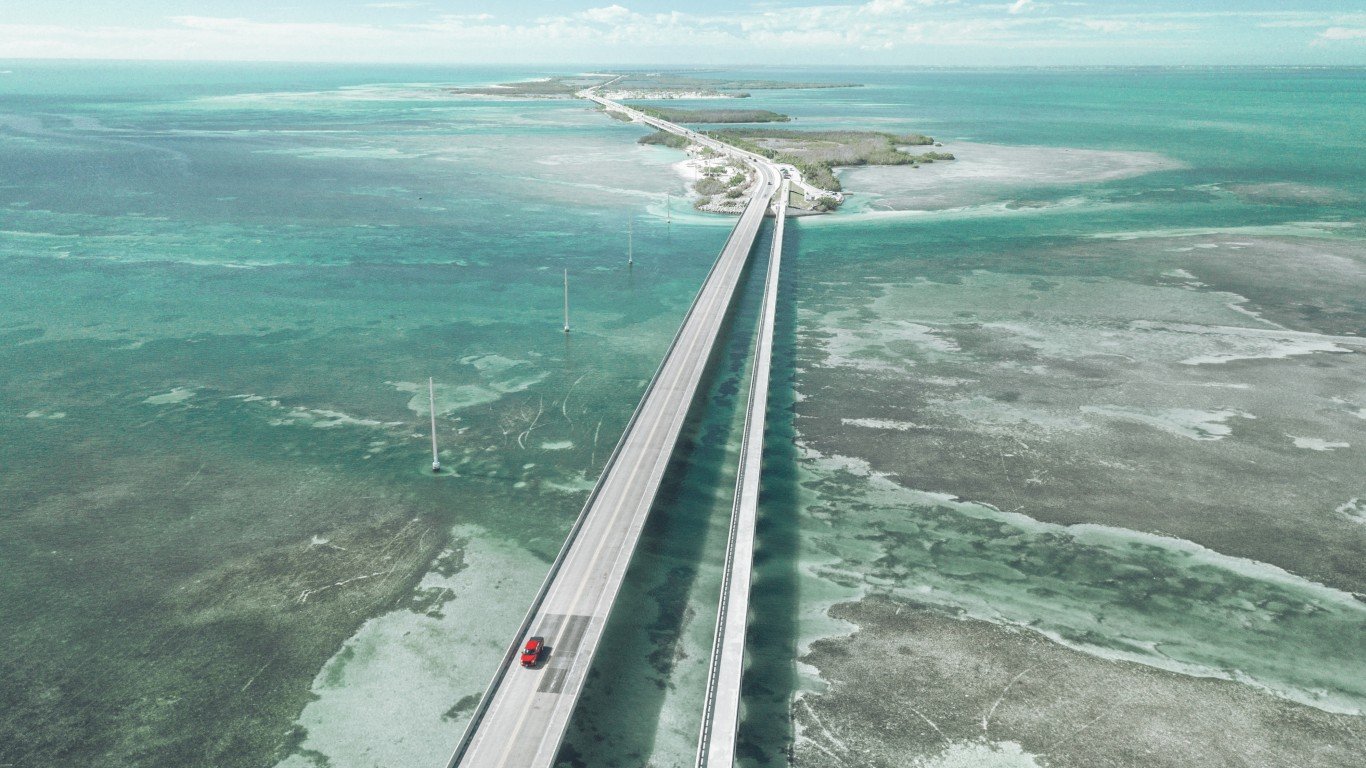
Source: FilippoBacci / E+ via Getty Images
- Percentage of structurally deficient bridges in 2021: 3.62%
- Capital and bridge disbursements (the costs to build new, and widen existing, highways and bridges) in 2020: $144,620 per lane-mile
- Expected capital and bridge disbursements in 2020: $108,485 per lane-mile
- Adjusted ratio: 1.33 — 8th lowest
- Highway system overall rank: 8
- State-control highway miles: 45,013 — 12th highest
- Most impressive bridge in Florida: Seven Mile Bridge
42. Alabama
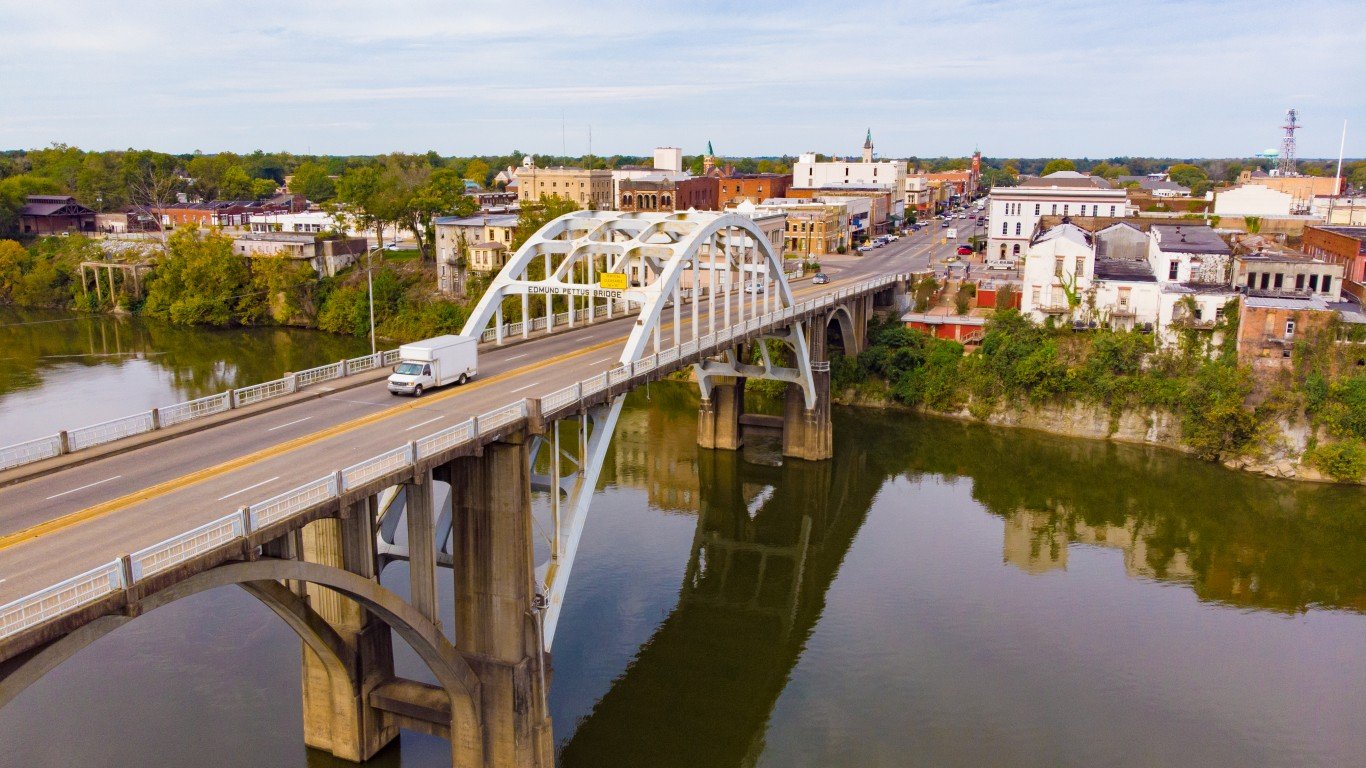
Source: Michael Warren / iStock via Getty Images
- Percentage of structurally deficient bridges in 2021: 3.63%
- Capital and bridge disbursements (the costs to build new, and widen existing, highways and bridges) in 2020: $46,715 per lane-mile
- Expected capital and bridge disbursements in 2020: $45,858 per lane-mile
- Adjusted ratio: 1.02 — 24th lowest
- Highway system overall rank: 15
- State-control highway miles: 29,707 — 20th highest
- Most impressive bridge in Alabama: Edmund Pettus Bridge
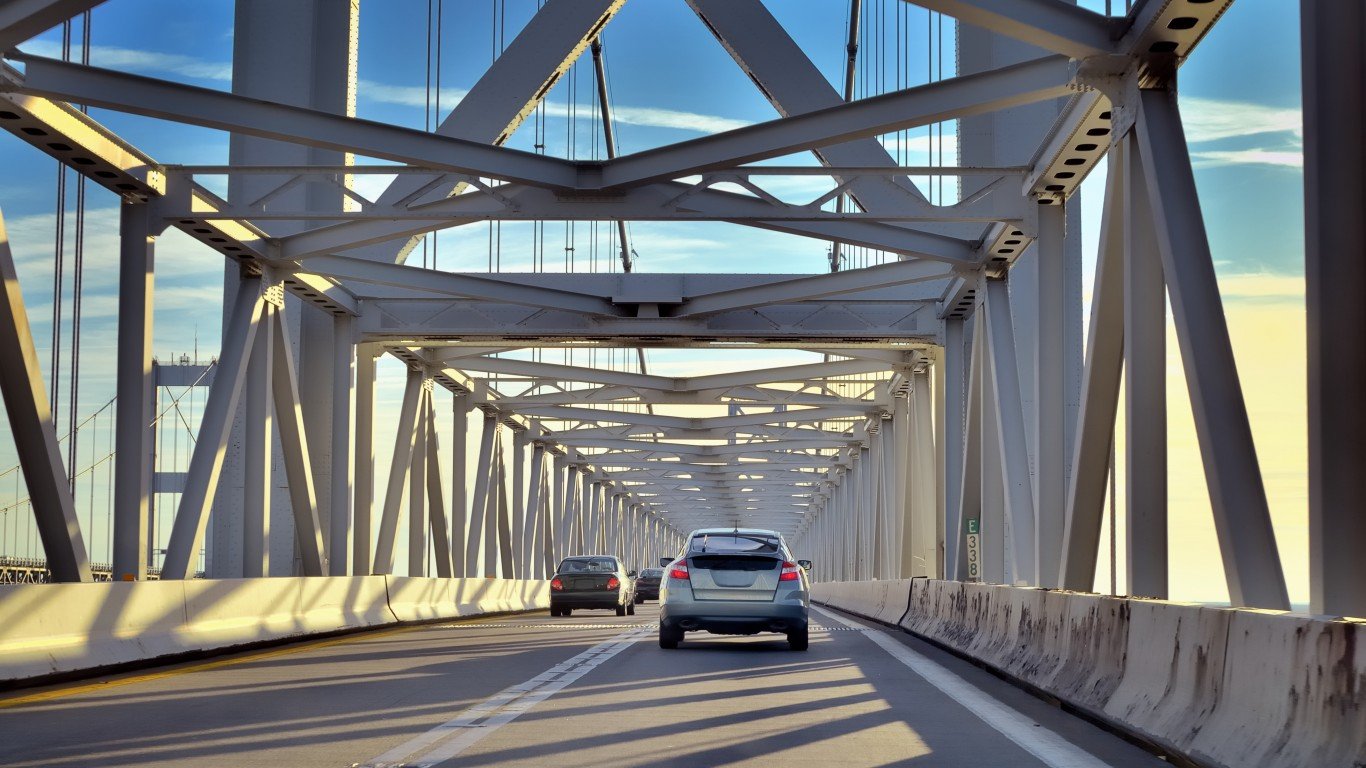
41. Virginia
Source: DavidByronKeener / iStock via Getty Images
- Percentage of structurally deficient bridges in 2021: 3.79%
- Capital and bridge disbursements (the costs to build new, and widen existing, highways and bridges) in 2020: $11,862 per lane-mile
- Expected capital and bridge disbursements in 2020: $42,748 per lane-mile
- Adjusted ratio: 0.28 — the highest
- Highway system overall rank: 1
- State-control highway miles: 128,989 — 3rd highest
- Most impressive bridge in Virginia: Chesapeake Bay Bridge-Tunnel
40. Tennessee
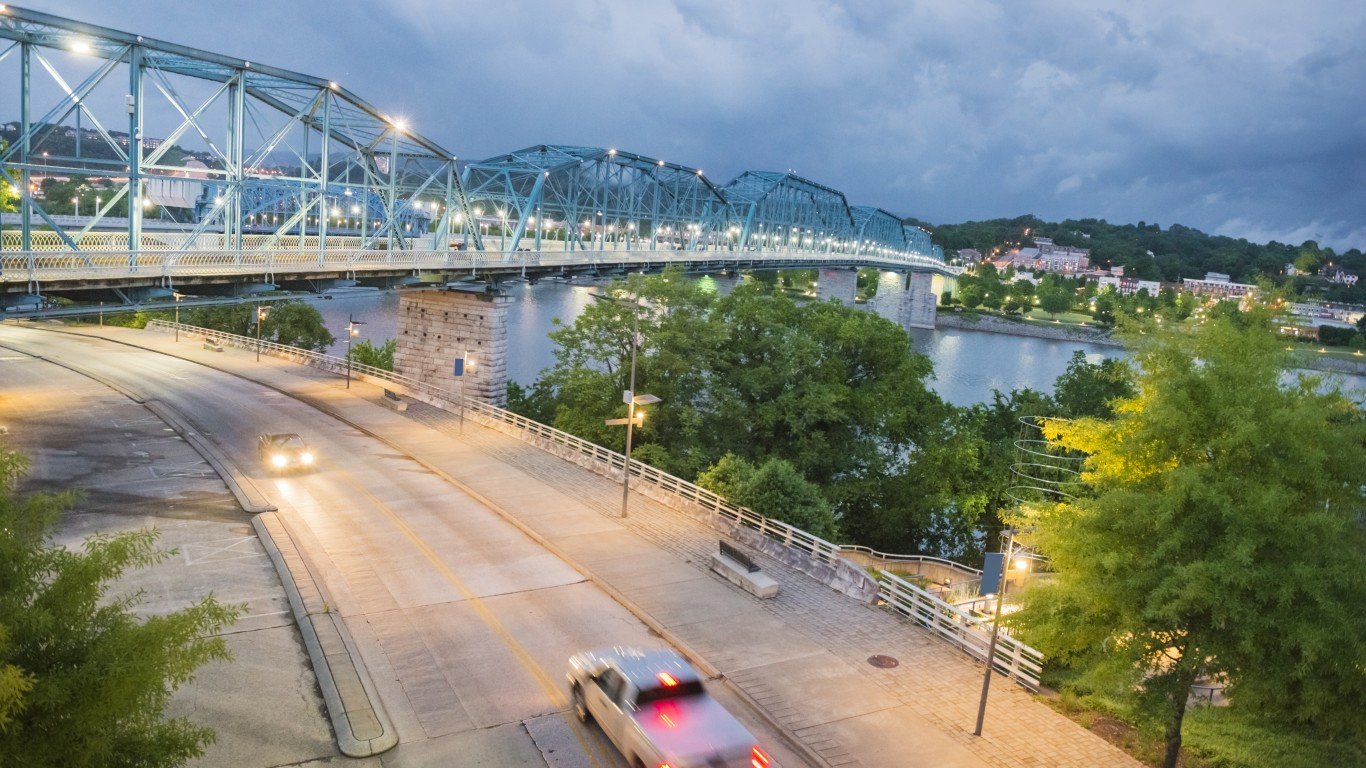
Source: Lorraine Boogich / iStock via Getty Images
- Percentage of structurally deficient bridges in 2021: 4.14%
- Capital and bridge disbursements (the costs to build new, and widen existing, highways and bridges) in 2020: $31,058 per lane-mile
- Expected capital and bridge disbursements in 2020: $52,898 per lane-mile
- Adjusted ratio: 0.59 — 9th highest
- Highway system overall rank: 3
- State-control highway miles: 37,746 — 17th highest
- Most impressive bridge in Tennessee: Walnut Street Bridge
39. Minnesota

Source: jimkruger / E+ via Getty Images
- Percentage of structurally deficient bridges in 2021: 4.58%
- Capital and bridge disbursements (the costs to build new, and widen existing, highways and bridges) in 2020: $41,049 per lane-mile
- Expected capital and bridge disbursements in 2020: $36,827 per lane-mile
- Adjusted ratio: 1.11 — 18th lowest
- Highway system overall rank: 12
- State-control highway miles: 29,176 — 22nd highest
- Most impressive bridge in Minnesota: Lowry Avenue Bridge
38. Oregon
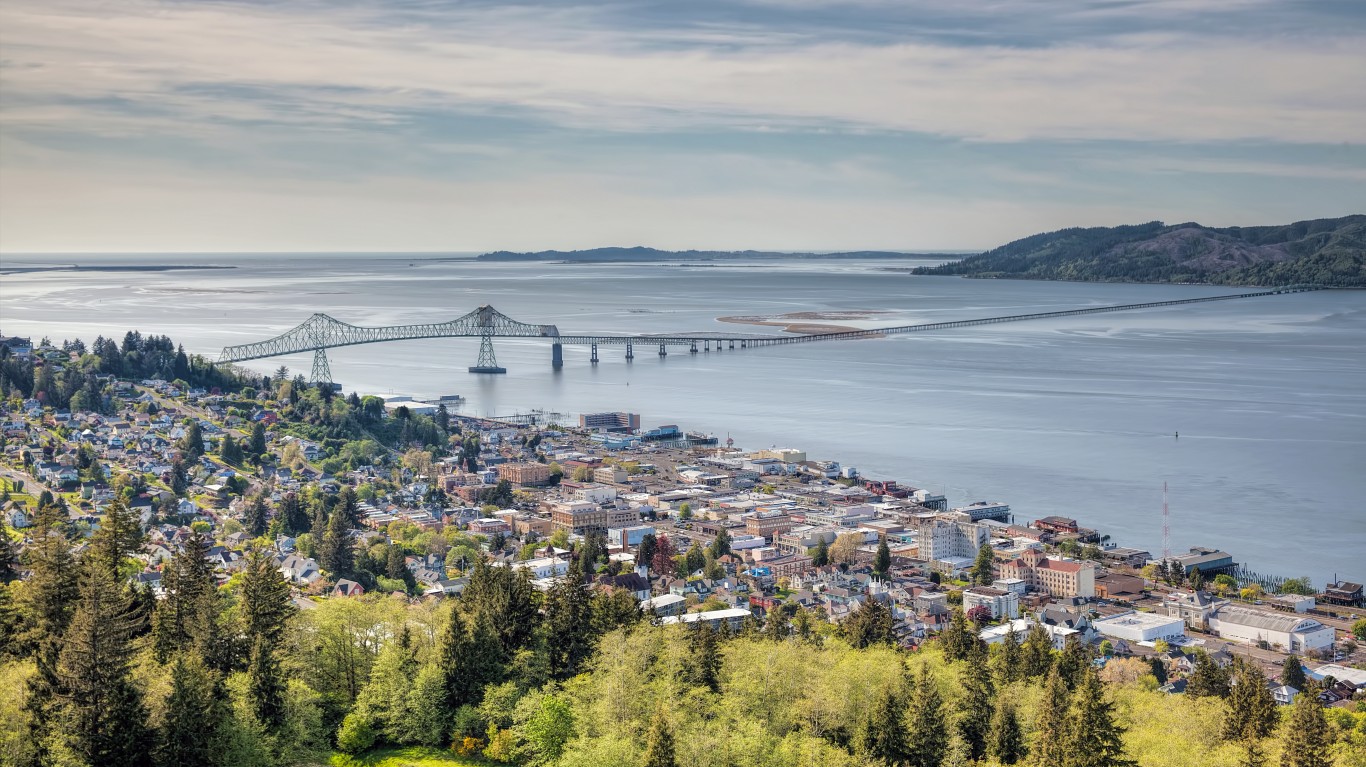
Source: JPLDesigns / iStock via Getty Images
- Percentage of structurally deficient bridges in 2021: 4.64%
- Capital and bridge disbursements (the costs to build new, and widen existing, highways and bridges) in 2020: $50,073 per lane-mile
- Expected capital and bridge disbursements in 2020: $38,506 per lane-mile
- Adjusted ratio: 1.30 — 12th lowest
- Highway system overall rank: 37
- State-control highway miles: 18,460 — 18th lowest
- Most impressive bridge in Oregon: Astoria-Megler Bridge
37. Maryland
Source: Joesboy / iStock via Getty Images
- Percentage of structurally deficient bridges in 2021: 4.65%
- Capital and bridge disbursements (the costs to build new, and widen existing, highways and bridges) in 2020: $101,839 per lane-mile
- Expected capital and bridge disbursements in 2020: $94,042 per lane-mile
- Adjusted ratio: 1.08 — 21st lowest
- Highway system overall rank: 24
- State-control highway miles: 14,928 — 12th lowest
- Most impressive bridge in Maryland: Chesapeake Bay Bridge
36. Washington

Source: halbergman / E+ via Getty Images
- Percentage of structurally deficient bridges in 2021: 4.80%
- Capital and bridge disbursements (the costs to build new, and widen existing, highways and bridges) in 2020: $97,951 per lane-mile
- Expected capital and bridge disbursements in 2020: $46,867 per lane-mile
- Adjusted ratio: 2.09 — the lowest
- Highway system overall rank: 46
- State-control highway miles: 18,450 — 19th lowest
- Most impressive bridge in Washington: Fred G. Redmon Memorial Bridge
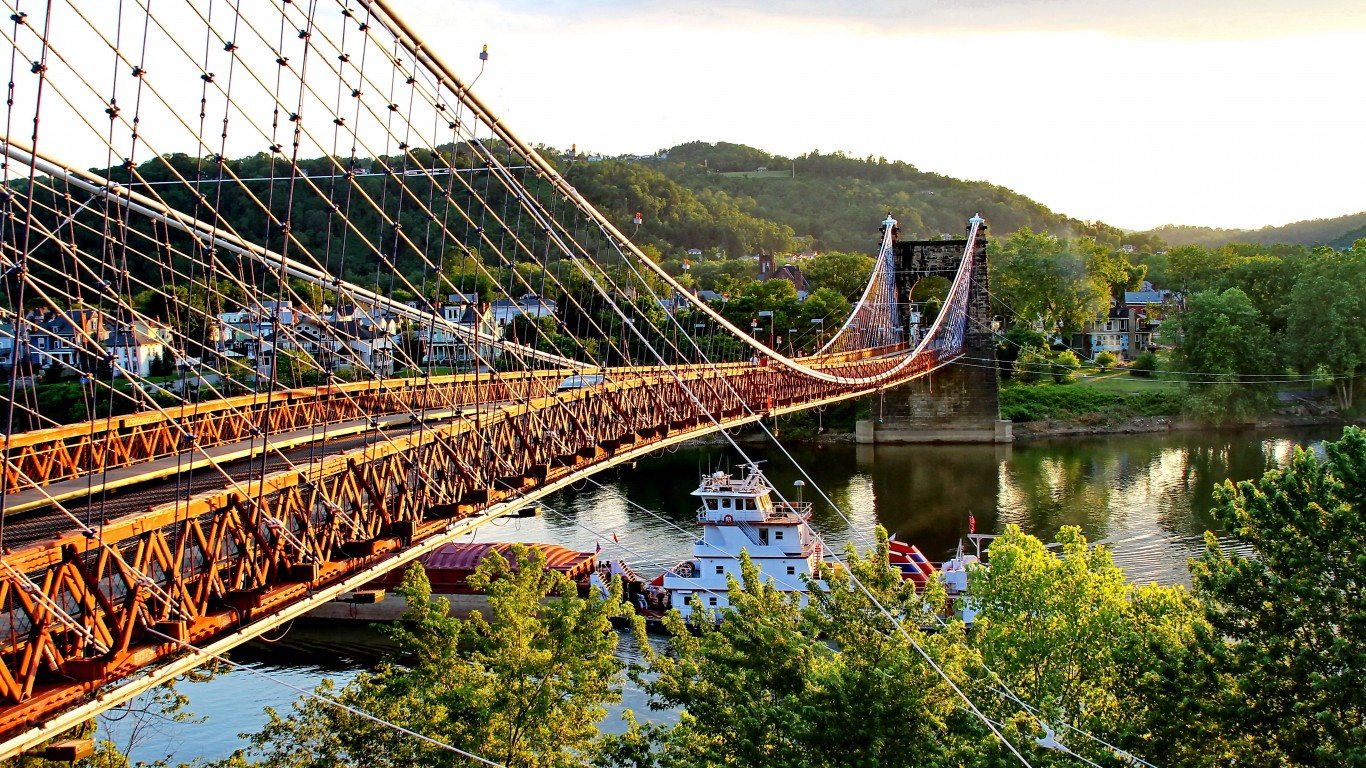
35. Ohio
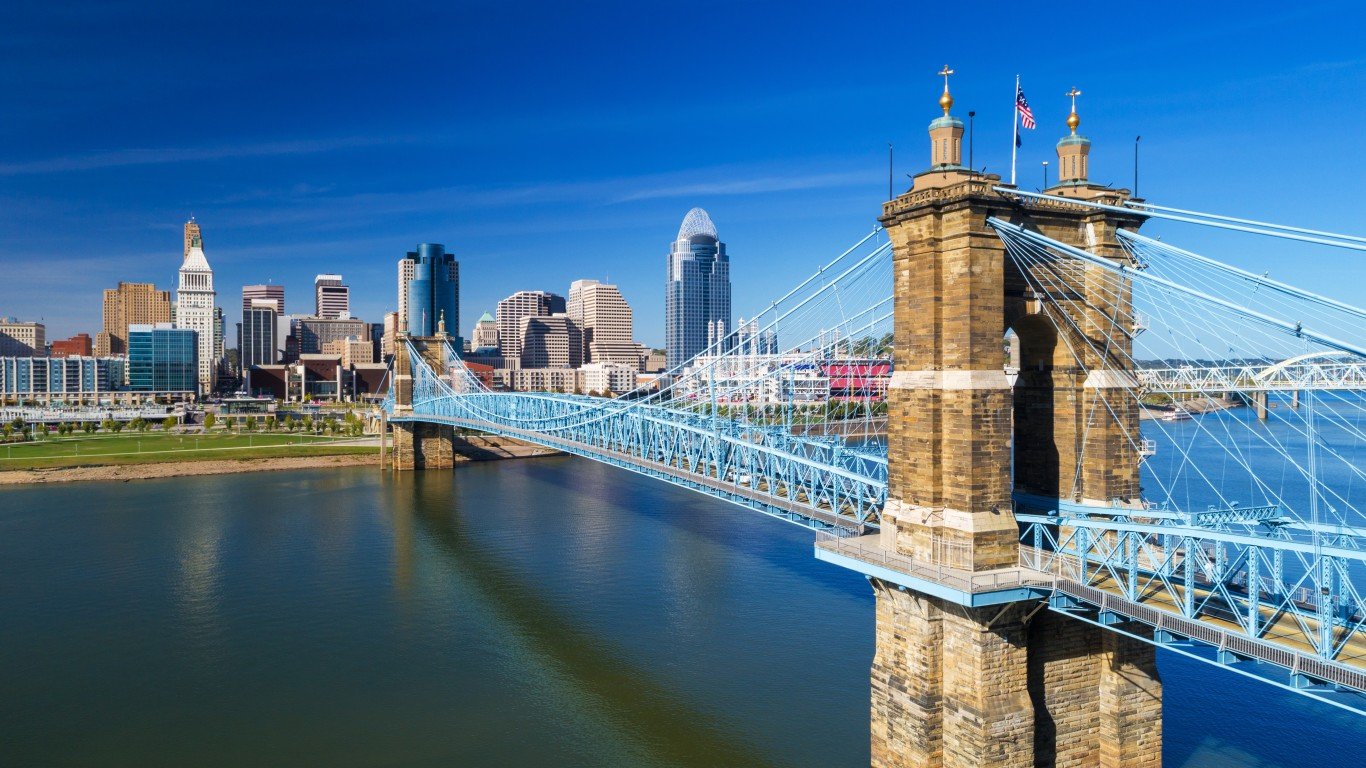
Source: Davel5957 / iStock via Getty Images
- Percentage of structurally deficient bridges in 2021: 4.91%
- Capital and bridge disbursements (the costs to build new, and widen existing, highways and bridges) in 2020: $39,661 per lane-mile
- Expected capital and bridge disbursements in 2020: $56,700 per lane-mile
- Adjusted ratio: 0.70 — 16th highest
- Highway system overall rank: 17
- State-control highway miles: 49,681 — 10th highest
- Most impressive bridge in Ohio: Roebling Suspension Bridge
34. Kansas
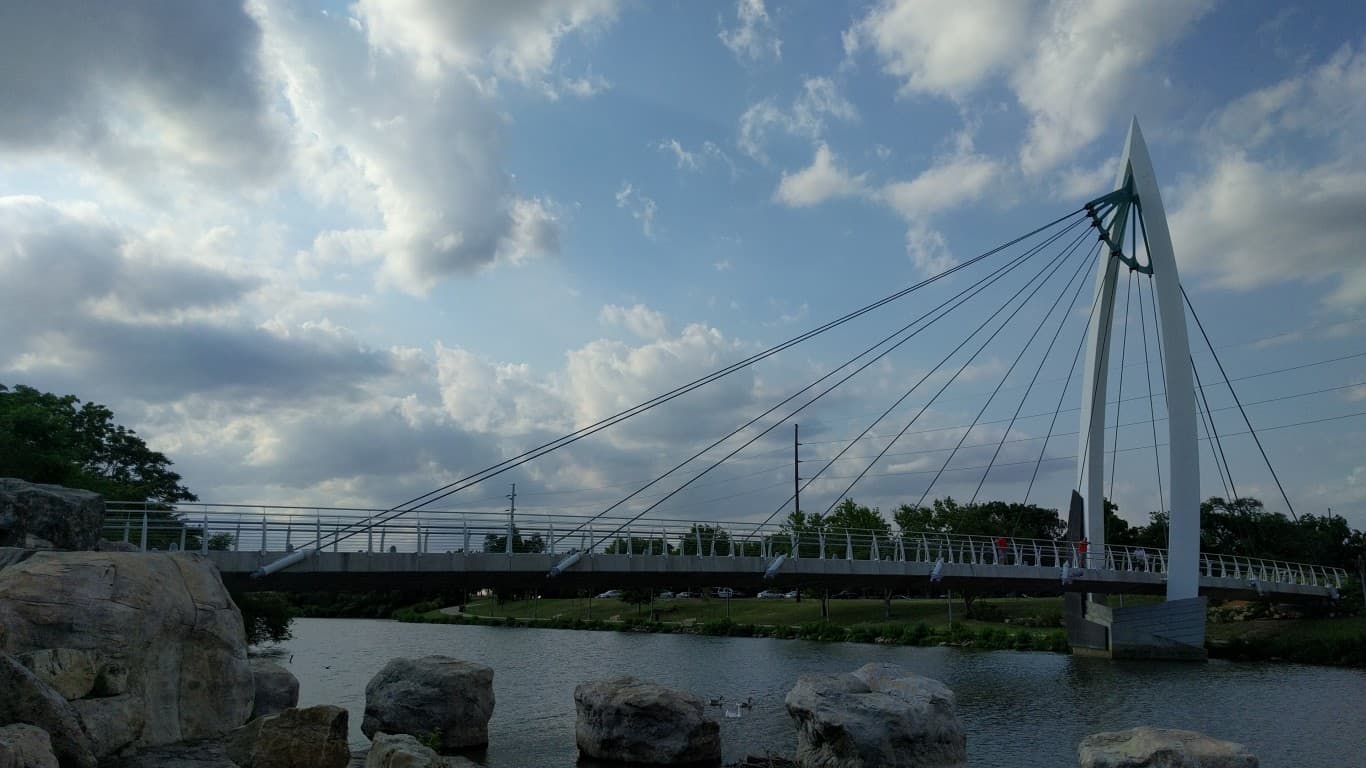
Source: drewtarvin / Flickr
- Percentage of structurally deficient bridges in 2021: 5.12%
- Capital and bridge disbursements (the costs to build new, and widen existing, highways and bridges) in 2020: $18,545 per lane-mile
- Expected capital and bridge disbursements in 2020: $27,958 per lane-mile
- Adjusted ratio: 0.66 — 13th highest
- Highway system overall rank: 22
- State-control highway miles: 24,037 — 24th lowest
- Most impressive bridge in Kansas: Keeper of the Plains Bridge
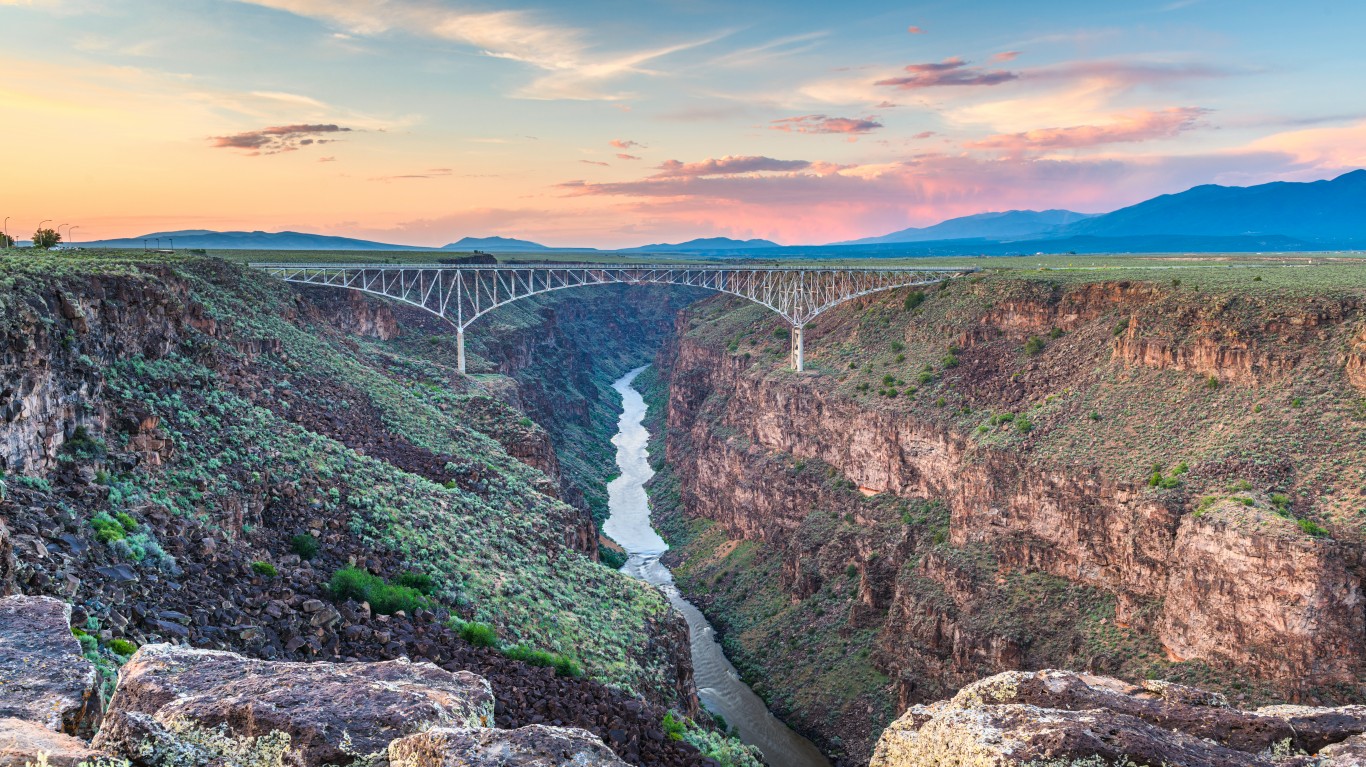
33. New Mexico
Source: Sean Pavone / iStock via Getty Images
- Percentage of structurally deficient bridges in 2021: 5.17%
- Capital and bridge disbursements (the costs to build new, and widen existing, highways and bridges) in 2020: $14,794 per lane-mile
- Expected capital and bridge disbursements in 2020: $26,872 per lane-mile
- Adjusted ratio: 0.55 — 7th highest
- Highway system overall rank: 36
- State-control highway miles: 29,430 — 21st highest
- Most impressive bridge in New Mexico: Rio Grande Gorge Bridge
32. Idaho

Source: onasill / Flickr
- Percentage of structurally deficient bridges in 2021: 5.22%
- Capital and bridge disbursements (the costs to build new, and widen existing, highways and bridges) in 2020: $49,130 per lane-mile
- Expected capital and bridge disbursements in 2020: $26,779 per lane-mile
- Adjusted ratio: 1.83 — 3rd lowest
- Highway system overall rank:34
- State-control highway miles: 12,272 — 10th lowest
- Most impressive bridge in Idaho: Perrine Bridge
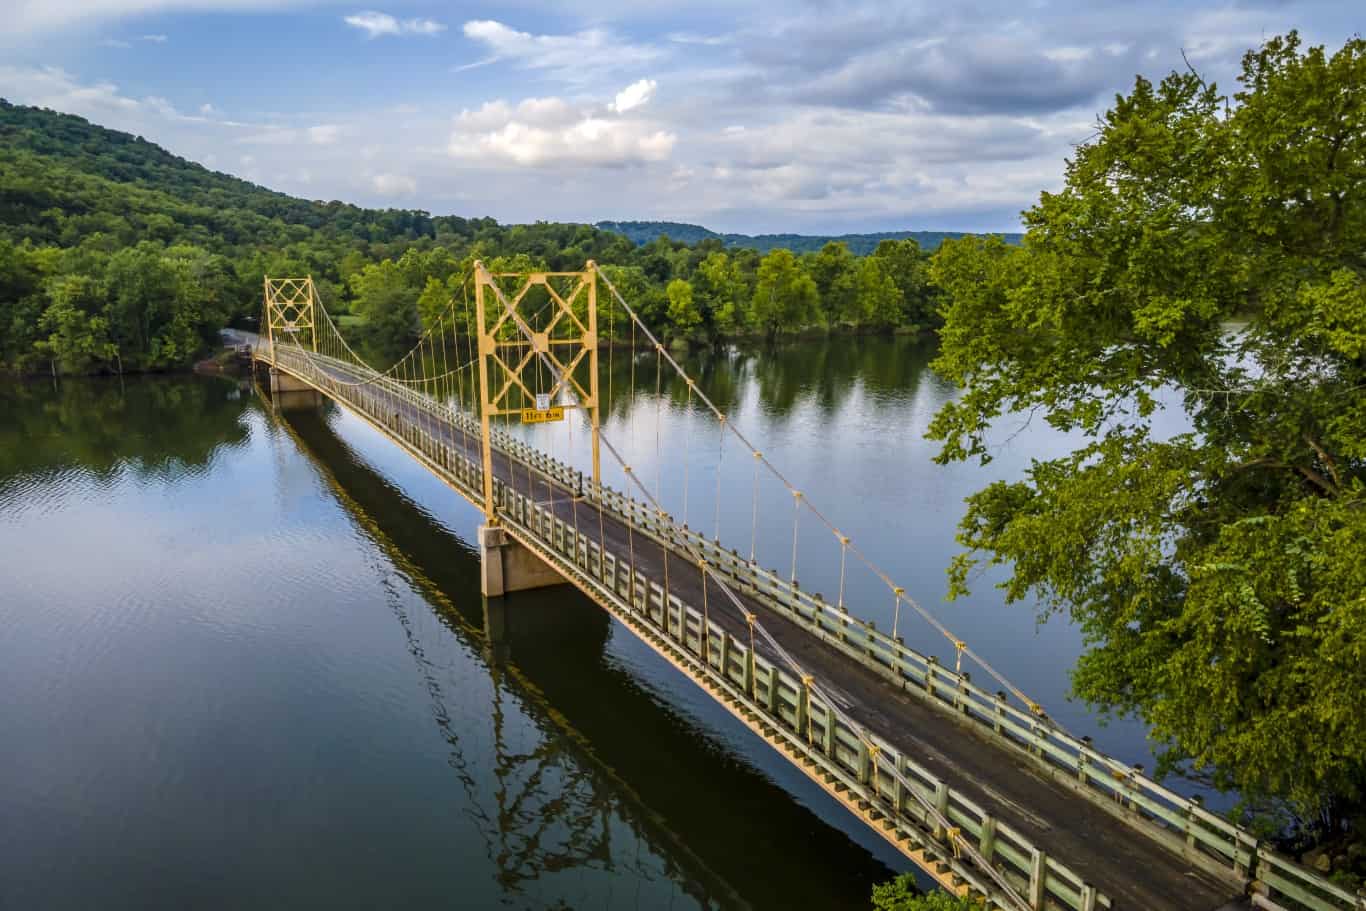
31. Arkansas
Source: jay_stout_photography / Flickr
- Percentage of structurally deficient bridges in 2021: 5.25%
- Capital and bridge disbursements (the costs to build new, and widen existing, highways and bridges) in 2020: $24,155 per lane-mile
- Expected capital and bridge disbursements in 2020: $35,260 per lane-mile
- Adjusted ratio: 0.69 — 15th highest
- Highway system overall rank: 13
- State-control highway miles: 38,078 — 16th highest
- Most impressive bridge in Arkansas: Beaver Bridge
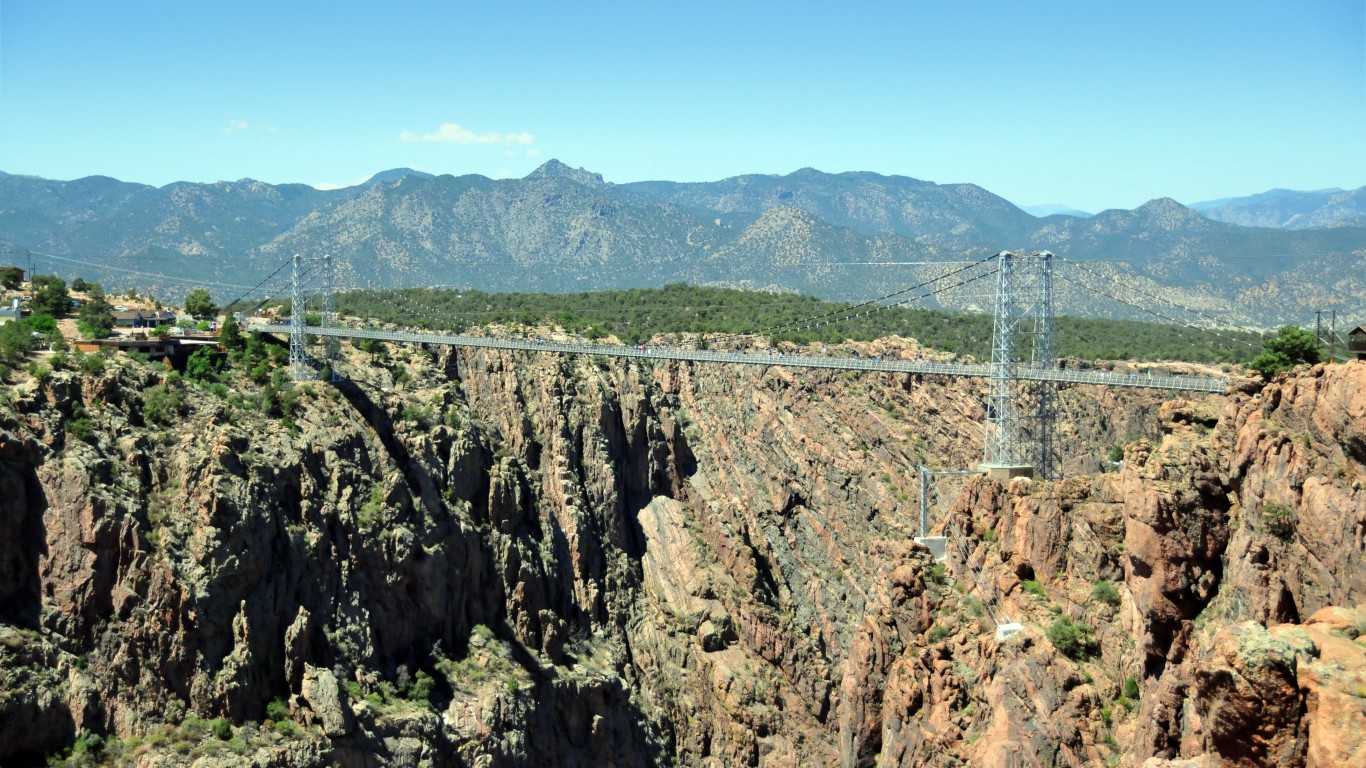
30. Colorado
Source: mtcurado / iStock via Getty Images
- Percentage of structurally deficient bridges in 2021: 5.29%
- Capital and bridge disbursements (the costs to build new, and widen existing, highways and bridges) in 2020: $45,663 per lane-mile
- Expected capital and bridge disbursements in 2020: $43,457 per lane-mile
- Adjusted ratio: 1.05 — 23rd lowest
- Highway system overall rank: 43
- State-control highway miles: 23,022 — 23rd lowest
- Most impressive bridge in Colorado: Royal Gorge Bridge
29. Connecticut
Source: jjbers / Flickr
- Percentage of structurally deficient bridges in 2021: 5.30%
- Capital and bridge disbursements (the costs to build new, and widen existing, highways and bridges) in 2020: $94,435 per lane-mile
- Expected capital and bridge disbursements in 2020: $147,085 per lane-mile
- Adjusted ratio: 0.64 — 12th highest
- Highway system overall rank: 5
- State-control highway miles: 9,827 — 7th lowest
- Most impressive bridge in Connecticut: Arrigoni Bridge
28. South Carolina
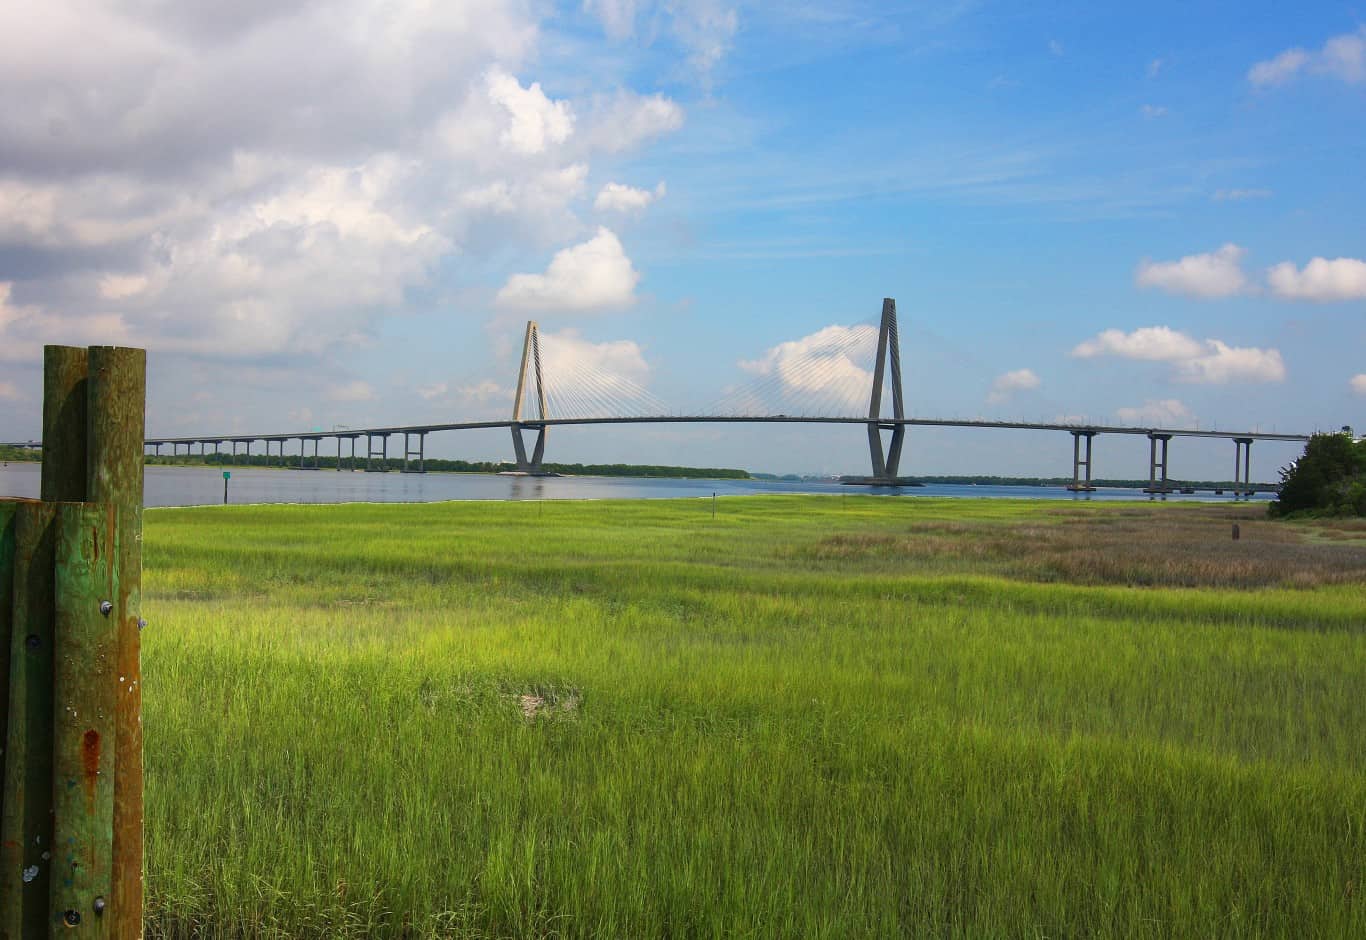
Source: tomsaint / Flickr
- Percentage of structurally deficient bridges in 2021: 5.31%
- Capital and bridge disbursements (the costs to build new, and widen existing, highways and bridges) in 2020: $21,016 per lane-mile
- Expected capital and bridge disbursements in 2020: $45,109 per lane-mile
- Adjusted ratio: 0.47 — 5th highest
- Highway system overall rank: 6
- State-control highway miles: 90,552 — 4th highest
- Most impressive bridge in South Carolina: Arthur Ravenel Jr Bridge
27. Indiana
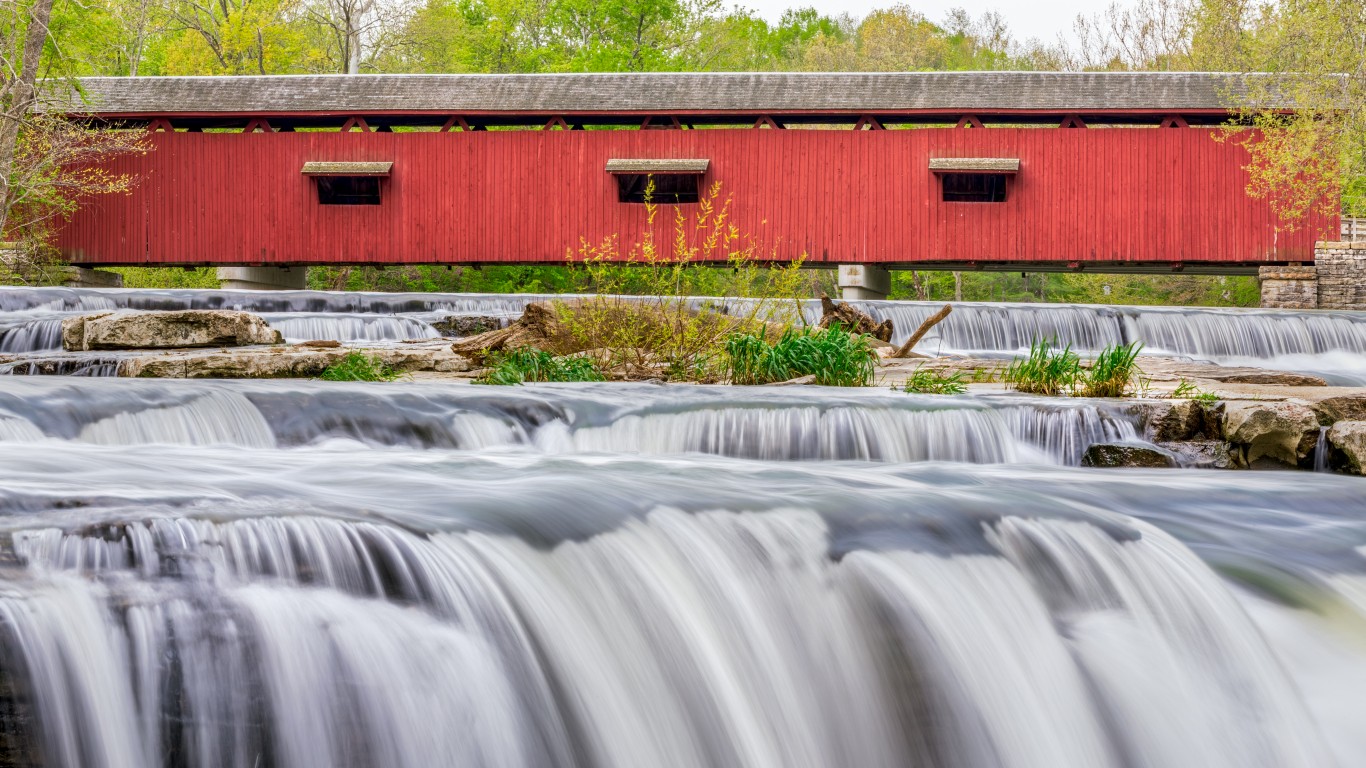
Source: Kenneth_Keifer / Getty Images
- Percentage of structurally deficient bridges in 2021: 5.60%
- Capital and bridge disbursements (the costs to build new, and widen existing, highways and bridges) in 2020: $54,635 per lane-mile
- Expected capital and bridge disbursements in 2020: $44,368 per lane-mile
- Adjusted ratio: 1.23 — 14th lowest
- Highway system overall rank: 23
- State-control highway miles: 28,445 — 23rd highest
- Most impressive bridge in Indiana: Cataract Falls Covered Bridge
26. California

Source: bluejayphoto / iStock via Getty Images
- Percentage of structurally deficient bridges in 2021: 5.80%
- Capital and bridge disbursements (the costs to build new, and widen existing, highways and bridges) in 2020: $86,801 per lane-mile
- Expected capital and bridge disbursements in 2020: $71,250 per lane-mile
- Adjusted ratio: 1.22 — 15th lowest
- Highway system overall rank: 47
- State-control highway miles: 52,004 — 9th highest
- Most impressive bridge in California: Golden Gate Bridge
25. Kentucky
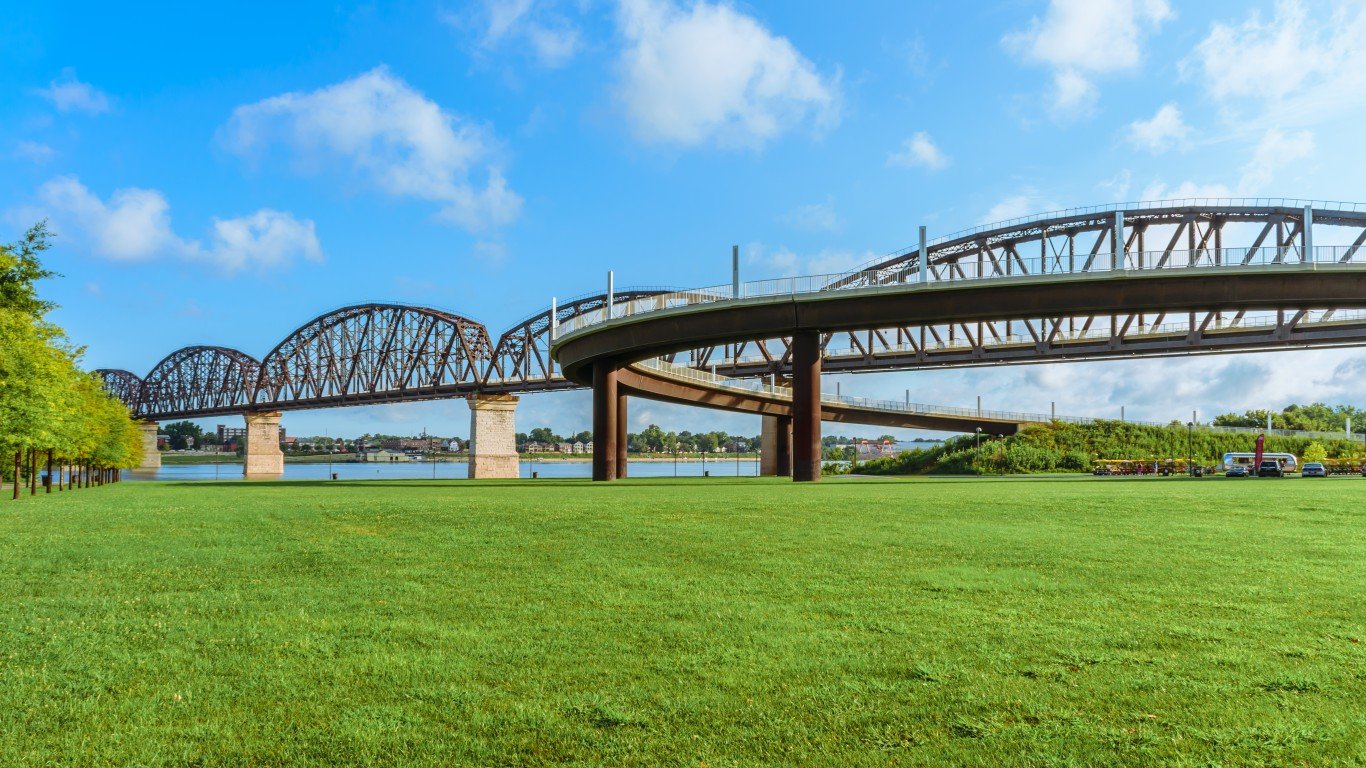
Source: Thomas Kelley / iStock via Getty Images
- Percentage of structurally deficient bridges in 2021: 6.87%
- Capital and bridge disbursements (the costs to build new, and widen existing, highways and bridges) in 2020: $20,742 per lane-mile
- Expected capital and bridge disbursements in 2020: $30,817 per lane-mile
- Adjusted ratio: 0.67 — 14th highest
- Highway system overall rank: 7
- State-control highway miles: 62,346 — 8th highest
- Most impressive bridge in Kentucky: Big Four Bridge
24. Wisconsin
Source: JamesBrey / iStock via Getty Images
- Percentage of structurally deficient bridges in 2021: 6.90%
- Capital and bridge disbursements (the costs to build new, and widen existing, highways and bridges) in 2020: $46,455 per lane-mile
- Expected capital and bridge disbursements in 2020: $43,833 per lane-mile
- Adjusted ratio: 1.06 — 22nd lowest
- Highway system overall rank: 33
- State-control highway miles: 29,806 — 19th highest
- Most impressive bridge in Wisconsin: Cedarburg Covered Bridge
23. Montana
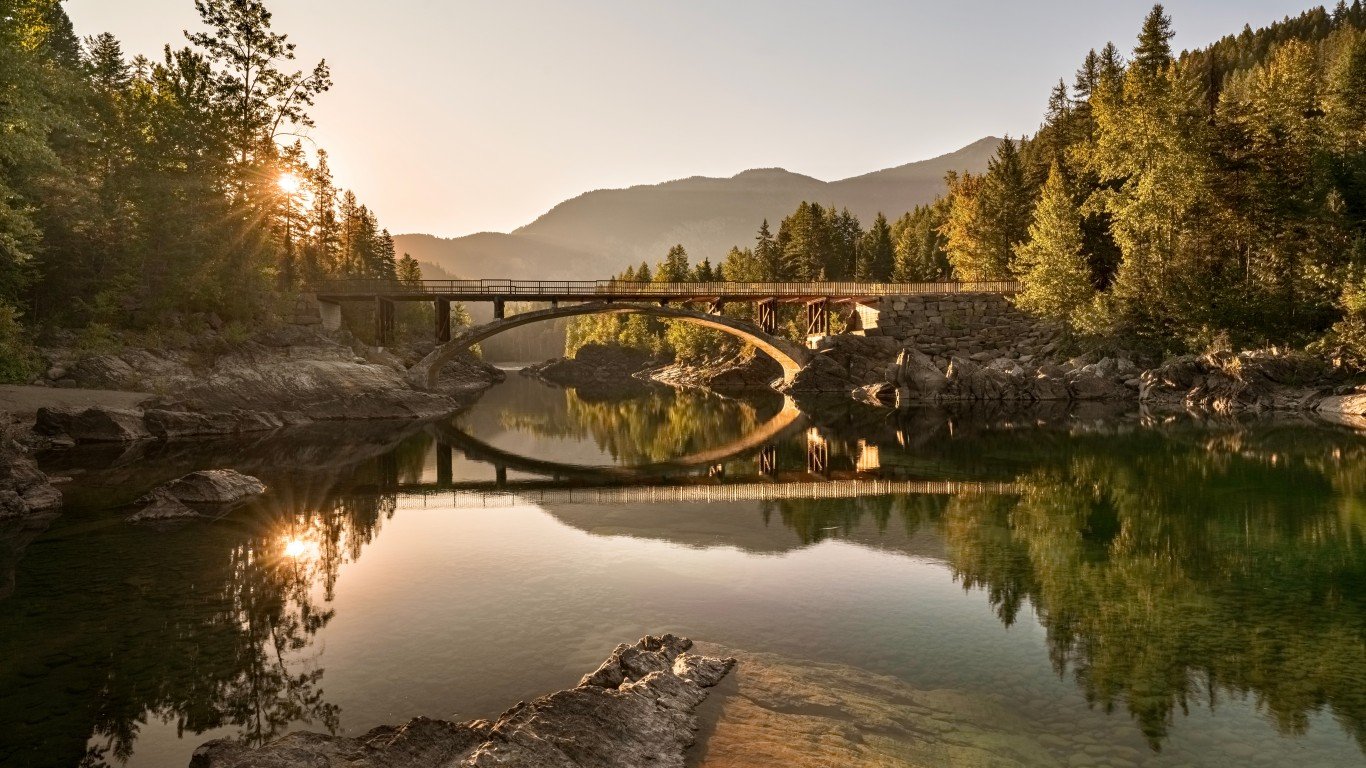
Source: JPDworld / iStock via Getty Images
- Percentage of structurally deficient bridges in 2021: 6.93%
- Capital and bridge disbursements (the costs to build new, and widen existing, highways and bridges) in 2020: $20,961 per lane-mile
- Expected capital and bridge disbursements in 2020: $19,047 per lane-mile
- Adjusted ratio: 1.10 — 19th lowest
- Highway system overall rank: 25
- State-control highway miles: 25,211 — 25th lowest
- Most impressive bridge in Montana: Koocanusa Bridge
22. Mississippi
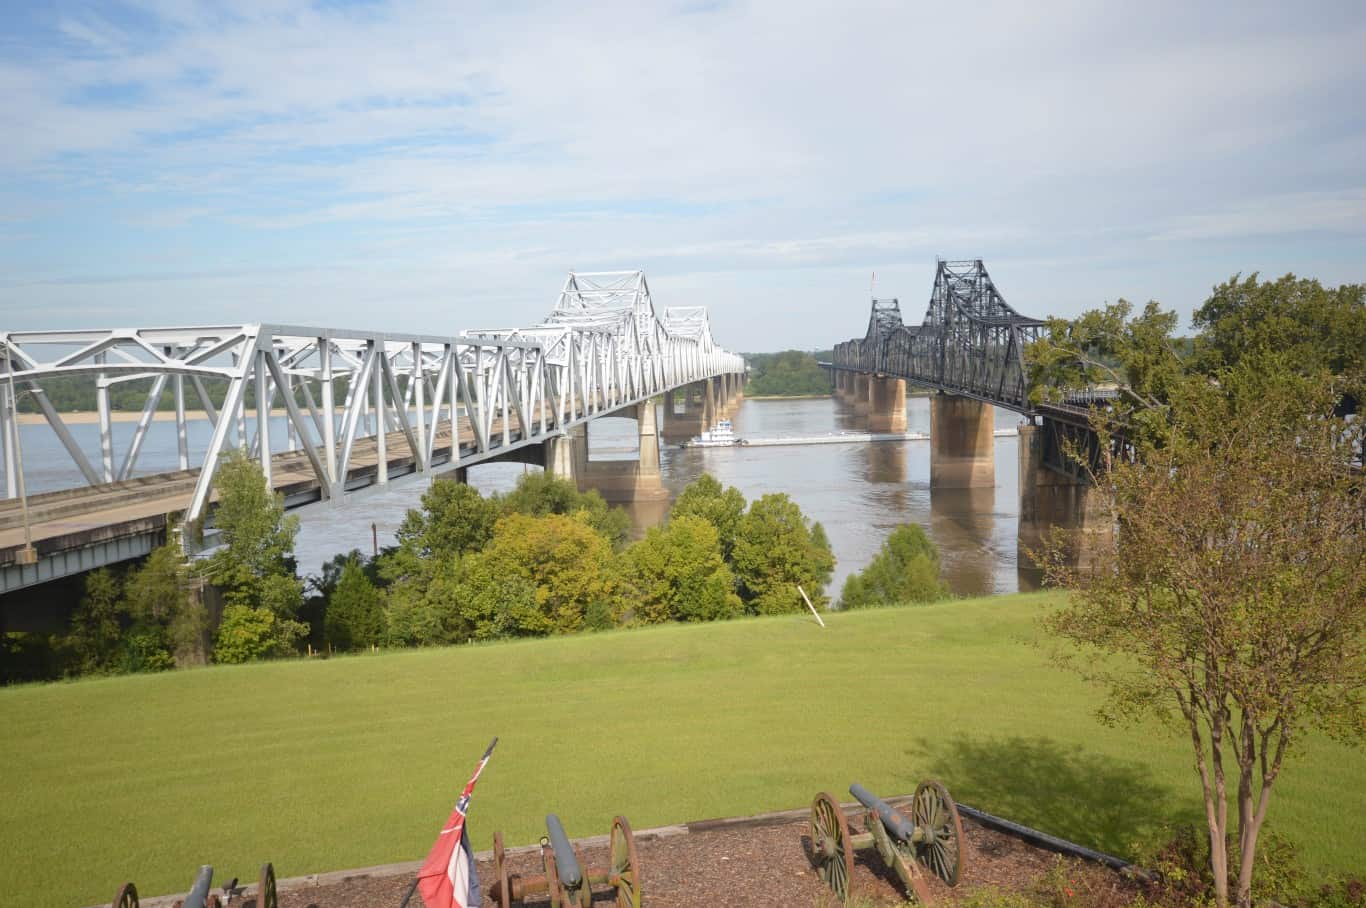
Source: mgaylard / Flickr
- Percentage of structurally deficient bridges in 2021: 6.99%
- Capital and bridge disbursements (the costs to build new, and widen existing, highways and bridges) in 2020: $25,031 per lane-mile
- Expected capital and bridge disbursements in 2020: $33,554 per lane-mile
- Adjusted ratio: 0.75 — 17th highest
- Highway system overall rank: 18
- State-control highway miles: 28,310 — 24th highest
- Most impressive bridge in Mississippi: Old Vicksburg Bridge
21. North Carolina

Source: brookebecker / iStock via Getty Images
- Percentage of structurally deficient bridges in 2021: 7.02%
- Capital and bridge disbursements (the costs to build new, and widen existing, highways and bridges) in 2020: $27,897 per lane-mile
- Expected capital and bridge disbursements in 2020: $44,381 per lane-mile
- Adjusted ratio: 0.63 — 11th highest
- Highway system overall rank: 2
- State-control highway miles: 173,653 — 2nd highest
- Most impressive bridge in North Carolina: Mile High Swinging Bridge
20. New Jersey
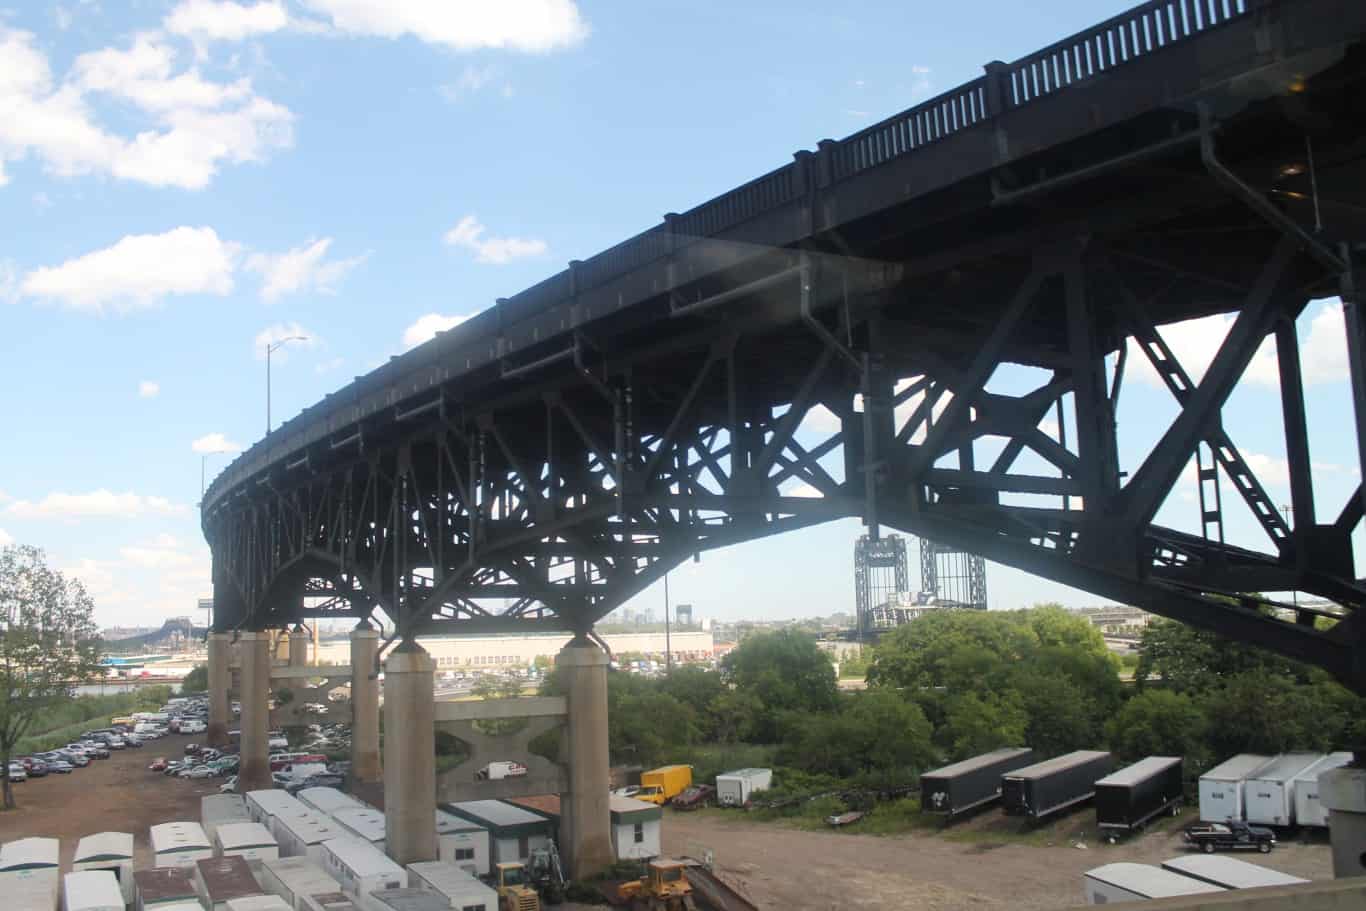
Source: perspective / Flickr
- Percentage of structurally deficient bridges in 2021: 7.09%
- Capital and bridge disbursements (the costs to build new, and widen existing, highways and bridges) in 2020: $344,386 per lane-mile
- Expected capital and bridge disbursements in 2020: $225,160 per lane-mile
- Adjusted ratio: 1.53 — 6th lowest
- Highway system overall rank: 44
- State-control highway miles: 8,551 — 5th lowest
- Most impressive bridge in New Jersey: Pulaski Skyway
19. Wyoming
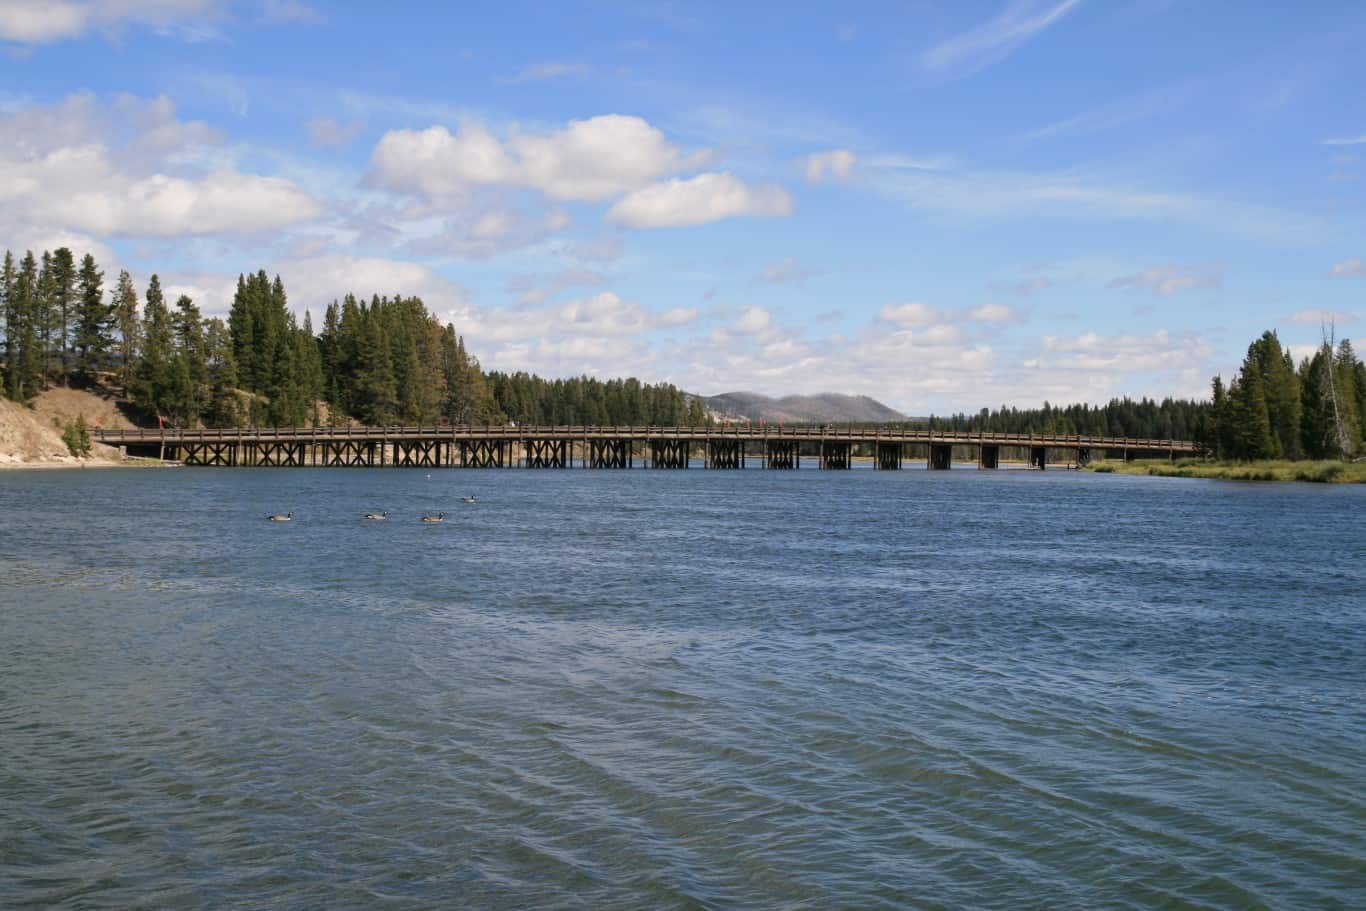
Source: brostad / Flickr
- Percentage of structurally deficient bridges in 2021: 7.39%
- Capital and bridge disbursements (the costs to build new, and widen existing, highways and bridges) in 2020: $23,697 per lane-mile
- Expected capital and bridge disbursements in 2020: $23,913 per lane-mile
- Adjusted ratio: 0.99 — 25th lowest
- Highway system overall rank: 16
- State-control highway miles: 15,792 — 13th lowest
- Most impressive bridge in Wyoming: Fishing Bridge
18. Hawaii
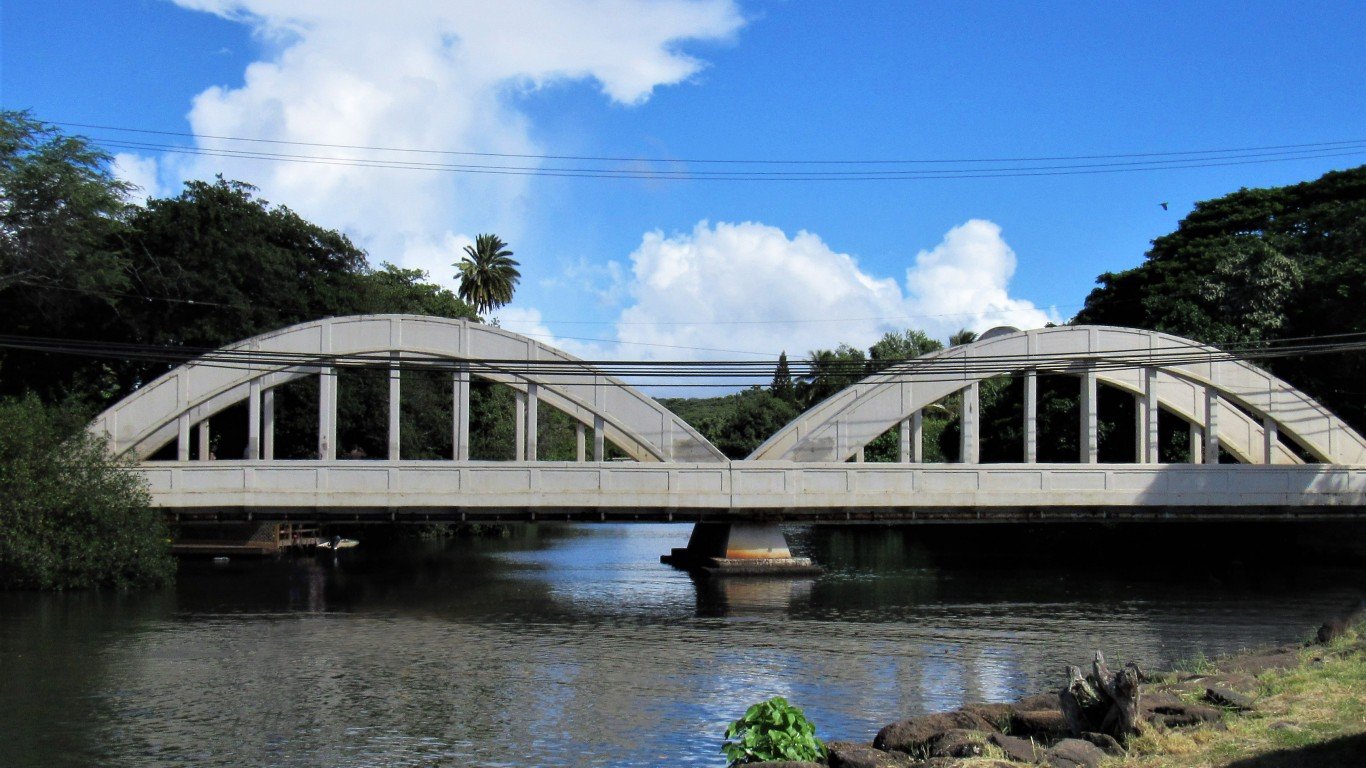
Source: Teri Wertman / iStock via Getty Images
- Percentage of structurally deficient bridges in 2021: 7.49%
- Capital and bridge disbursements (the costs to build new, and widen existing, highways and bridges) in 2020: $98,120 per lane-mile
- Expected capital and bridge disbursements in 2020: $99,817 per lane-mile
- Adjusted ratio: 0.98 — 25th highest
- Highway system overall rank: 48
- State-control highway miles: 2,477 — the lowest
- Most impressive bridge in Hawaii: Anahulu Stream Bridge
17. New Hampshire
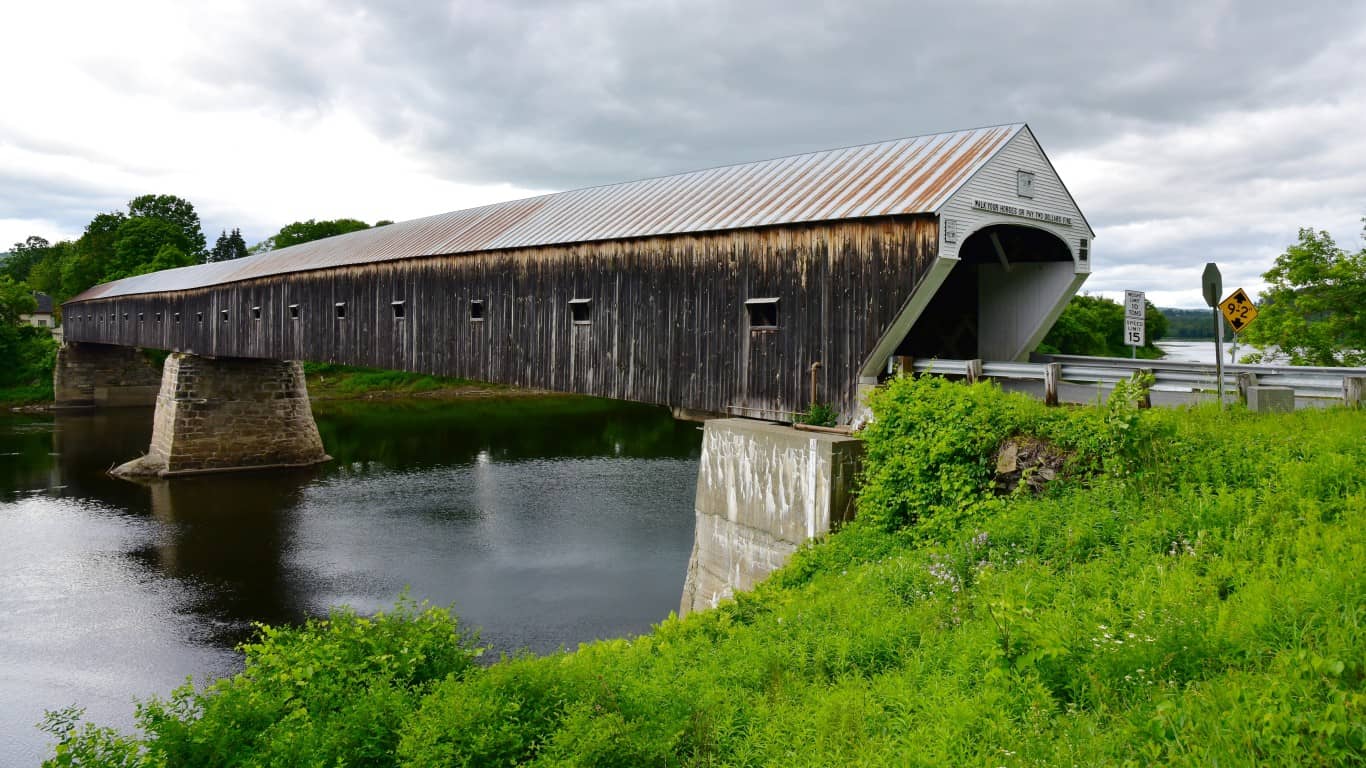
Source: larry1732 / Flickr
- Percentage of structurally deficient bridges in 2021: 7.68%
- Capital and bridge disbursements (the costs to build new, and widen existing, highways and bridges) in 2020: $32,313 per lane-mile
- Expected capital and bridge disbursements in 2020: $37,664 per lane-mile
- Adjusted ratio: 0.86 — 19th highest
- Highway system overall rank: 14
- State-control highway miles: 8,453 — 4th lowest
- Most impressive bridge in New Hampshire: Cornish-Windsor Covered Bridge
16. Alaska
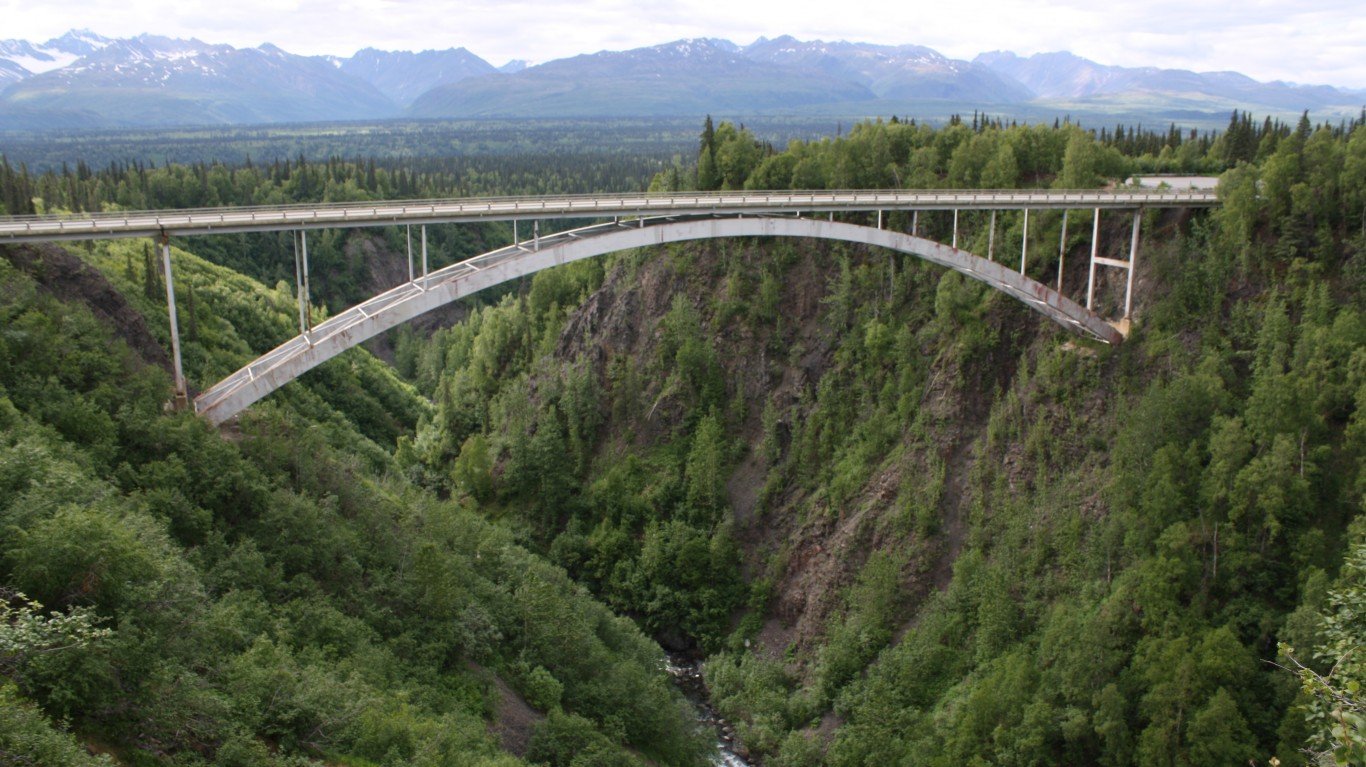
Source: micahmabin / iStock via Getty Images
- Percentage of structurally deficient bridges in 2021: 8.21%
- Capital and bridge disbursements (the costs to build new, and widen existing, highways and bridges) in 2020: $65,303 per lane-mile
- Expected capital and bridge disbursements in 2020: $31,277 per lane-mile
- Adjusted ratio: 2.09 — 2nd lowest
- Highway system overall rank: 50
- State-control highway miles: 11,754 — 8th lowest
- Most impressive bridge in Alaska: Hurricane Gulch Bridge
15. Nebraska
Source: Dean_Fikar / iStock via Getty Images
- Percentage of structurally deficient bridges in 2021: 8.34%
- Capital and bridge disbursements (the costs to build new, and widen existing, highways and bridges) in 2020: $21,452 per lane-mile
- Expected capital and bridge disbursements in 2020: $22,276 per lane-mile
- Adjusted ratio: 0.96 — 24th highest
- Highway system overall rank: 26
- State-control highway miles: 22,541 — 21st lowest
- Most impressive bridge in Nebraska: Bob Kerrey Pedestrian Bridge
14. Massachusetts
Source: DenisTangneyJr / iStock via Getty Images
- Percentage of structurally deficient bridges in 2021: 8.69%
- Capital and bridge disbursements (the costs to build new, and widen existing, highways and bridges) in 2020: $91,830 per lane-mile
- Expected capital and bridge disbursements in 2020: $207,833 per lane-mile
- Adjusted ratio: 0.44 — 3rd highest
- Highway system overall rank: 20
- State-control highway miles: 9,556 — 6th lowest
- Most impressive bridge in Massachusetts: Bridge of Flowers
13. Illinois

Source: ibsky / Getty Images
- Percentage of structurally deficient bridges in 2021: 8.96%
- Capital and bridge disbursements (the costs to build new, and widen existing, highways and bridges) in 2020: $74,606 per lane-mile
- Expected capital and bridge disbursements in 2020: $63,747 per lane-mile
- Adjusted ratio: 1.17 — 17th lowest
- Highway system overall rank: 29
- State-control highway miles: 42,169 — 13th highest
- Most impressive bridge in Illinois: DuSable Bridge
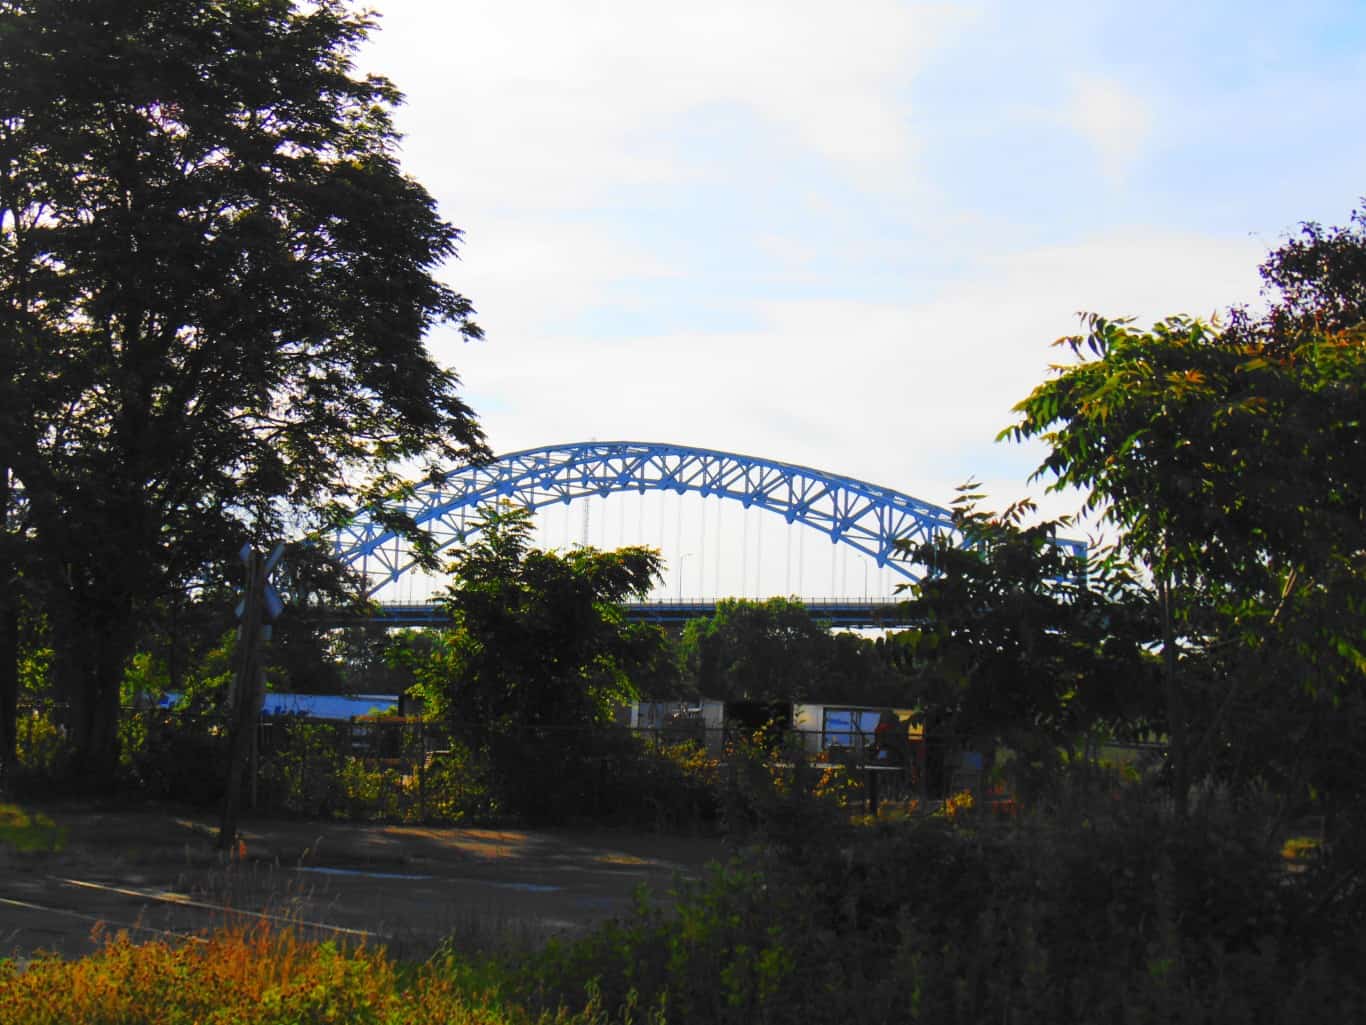
12. Missouri
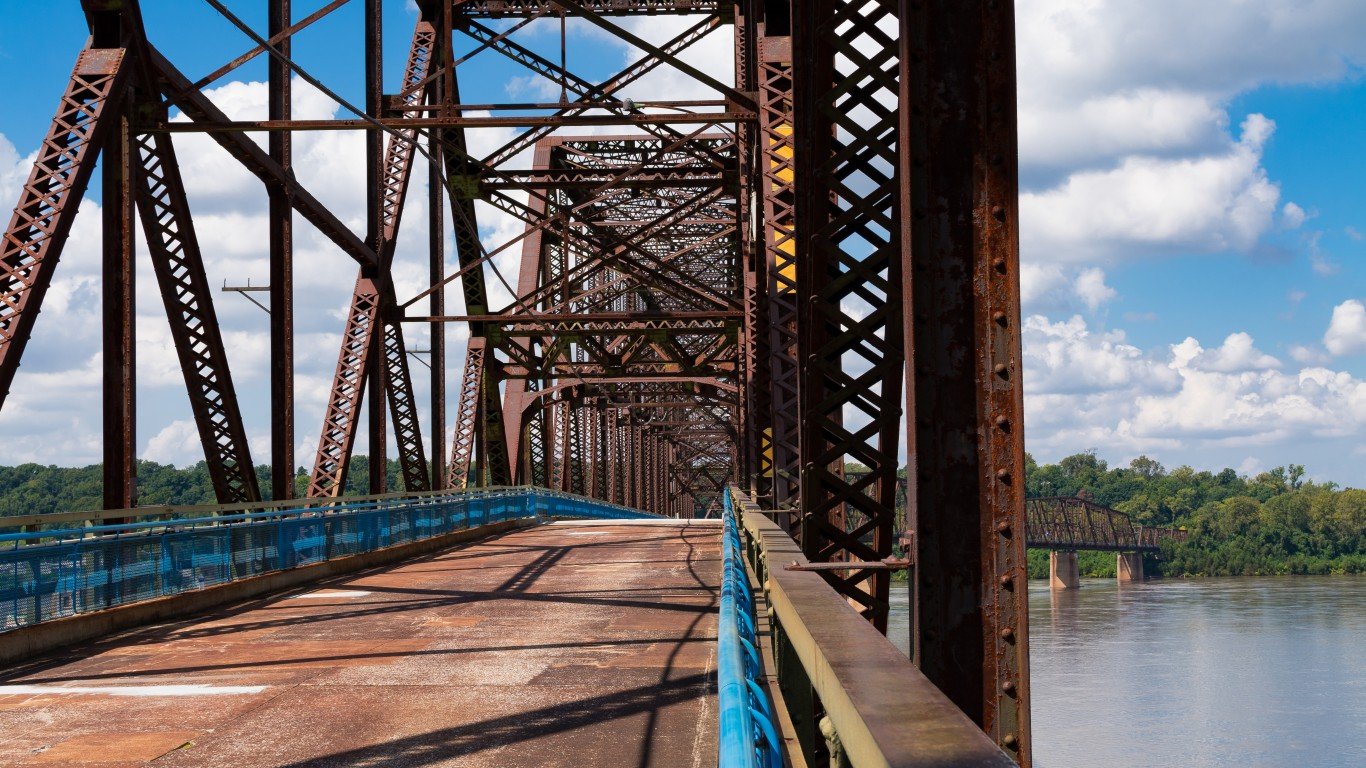
Source: EJ_Rodriquez / iStock via Getty Images
- Percentage of structurally deficient bridges in 2021: 9.02%
- Capital and bridge disbursements (the costs to build new, and widen existing, highways and bridges) in 2020: $10,364 per lane-mile
- Expected capital and bridge disbursements in 2020: $30,406 per lane-mile
- Adjusted ratio: 0.34 — 2nd highest
- Highway system overall rank: 11
- State-control highway miles: 77,693 — 6th highest
- Most impressive bridge in Missouri: Chain of Rocks Bridge
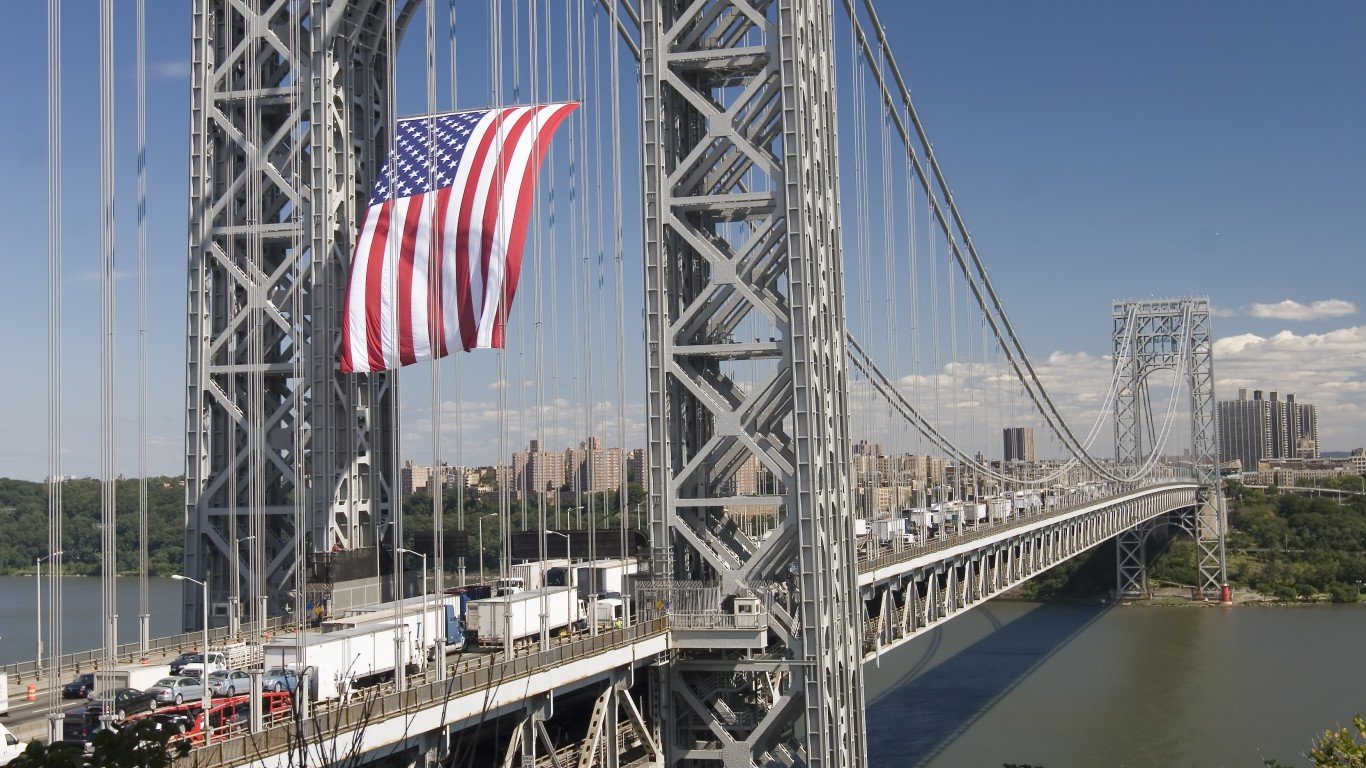
11. New York

Source: Ultima_Gaina / iStock via Getty Images
- Percentage of structurally deficient bridges in 2021: 9.52%
- Capital and bridge disbursements (the costs to build new, and widen existing, highways and bridges) in 2020: $103,205 per lane-mile
- Expected capital and bridge disbursements in 2020: $65,611 per lane-mile
- Adjusted ratio: 1.57 — 4th lowest
- Highway system overall rank: 49
- State-control highway miles: 38,157 — 15th highest
- Most impressive bridge in New York: Brooklyn Bridge
10. Oklahoma

Source: Christina Woods / iStock via Getty Images
- Percentage of structurally deficient bridges in 2021: 9.89%
- Capital and bridge disbursements (the costs to build new, and widen existing, highways and bridges) in 2020: $44,728 per lane-mile
- Expected capital and bridge disbursements in 2020: $33,958 per lane-mile
- Adjusted ratio: 1.32 — 10th lowest
- Highway system overall rank: 45
- State-control highway miles: 30,407 — 18th highest
- Most impressive bridge in Oklahoma: Skydance Bridge
9. Michigan
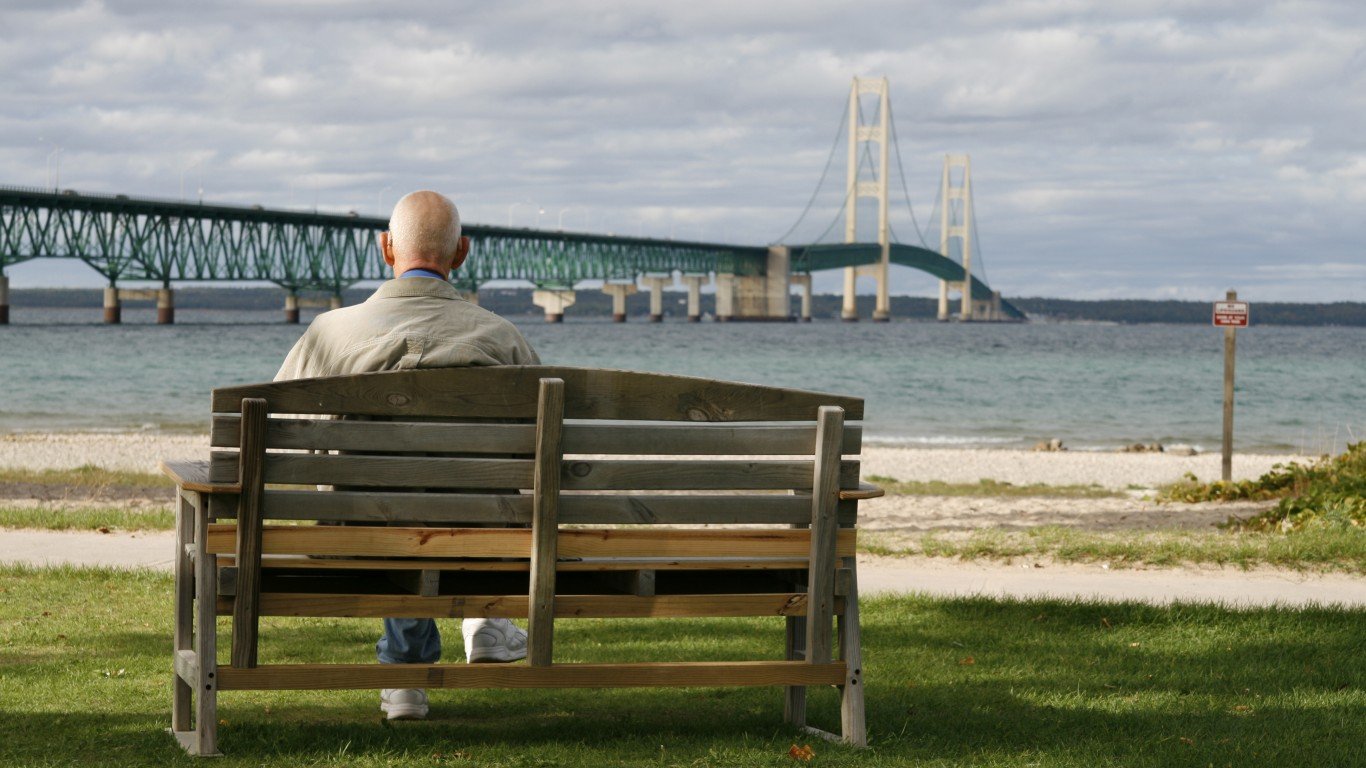
Source: duckycards / iStock via Getty Images
- Percentage of structurally deficient bridges in 2021: 10.99%
- Capital and bridge disbursements (the costs to build new, and widen existing, highways and bridges) in 2020: $53,110 per lane-mile
- Expected capital and bridge disbursements in 2020: $60,894 per lane-mile
- Adjusted ratio: 0.87 — 20th highest
- Highway system overall rank: 27
- State-control highway miles: 27,366 — 25th highest
- Most impressive bridge in Michigan: Mackinac Bridge
8. North Dakota
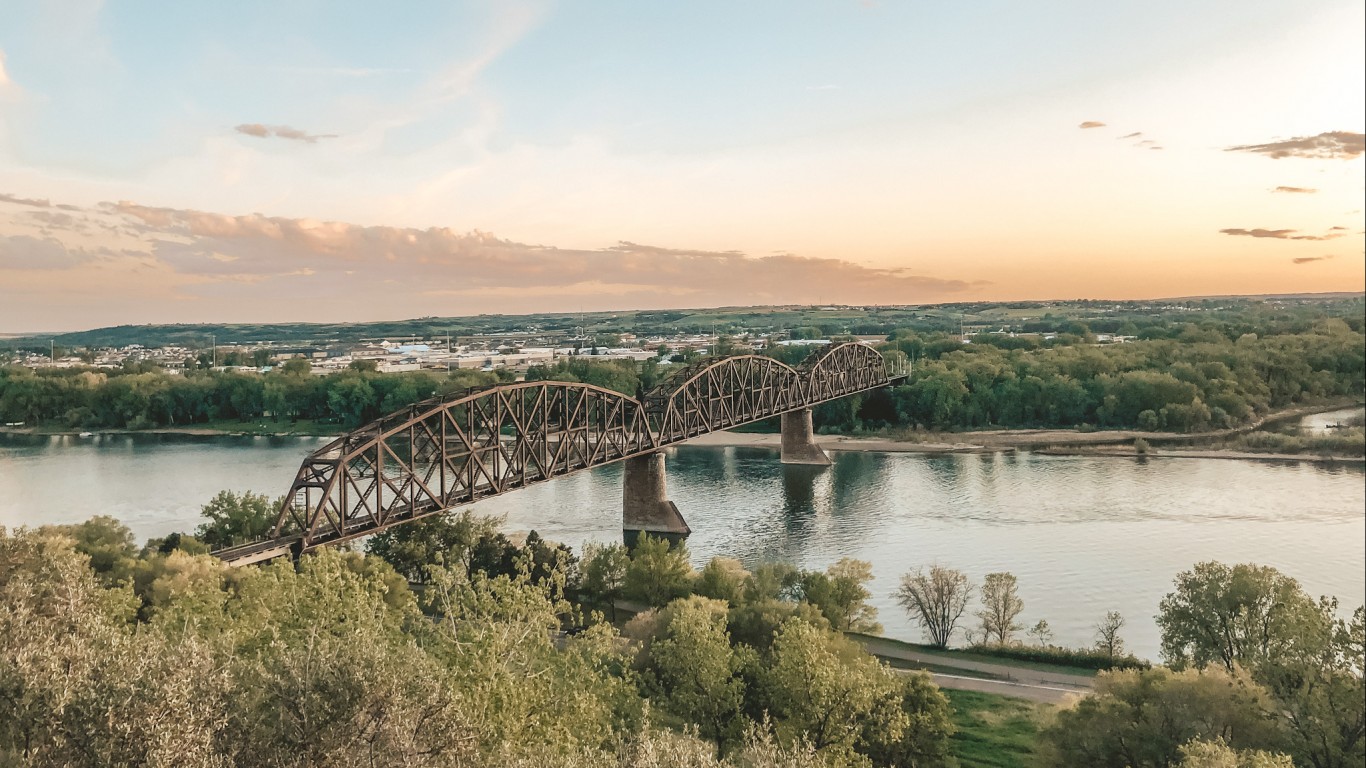
Source: Nathan Livedalen / iStock via Getty Images
- Percentage of structurally deficient bridges in 2021: 11.23%
- Capital and bridge disbursements (the costs to build new, and widen existing, highways and bridges) in 2020: $21,820 per lane-mile
- Expected capital and bridge disbursements in 2020: $17,458 per lane-mile
- Adjusted ratio: 1.25 — 13th lowest
- Highway system overall rank: 9
- State-control highway miles: 17,245 — 15th lowest
- Most impressive bridge in North Dakota: Hi-Line Bridge
7. Maine
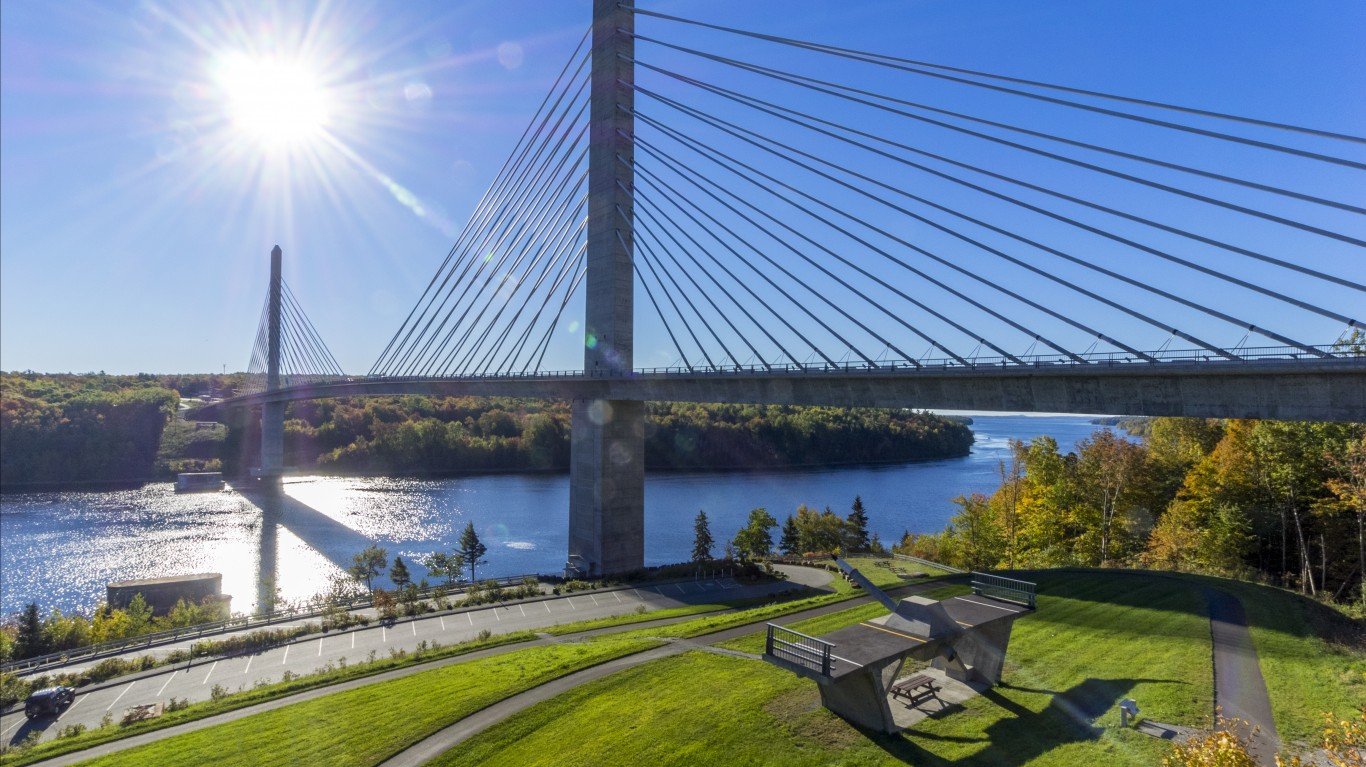
Source: GarysFRP / Getty Images
- Percentage of structurally deficient bridges in 2021: 12.64%
- Capital and bridge disbursements (the costs to build new, and widen existing, highways and bridges) in 2020: $27,840 per lane-mile
- Expected capital and bridge disbursements in 2020: $29,198 per lane-mile
- Adjusted ratio: 0.95 — 23rd highest
- Highway system overall rank: 32
- State-control highway miles: 17,467 — 16th lowest
- Most impressive bridge in Maine: Penobscot Narrows Bridge
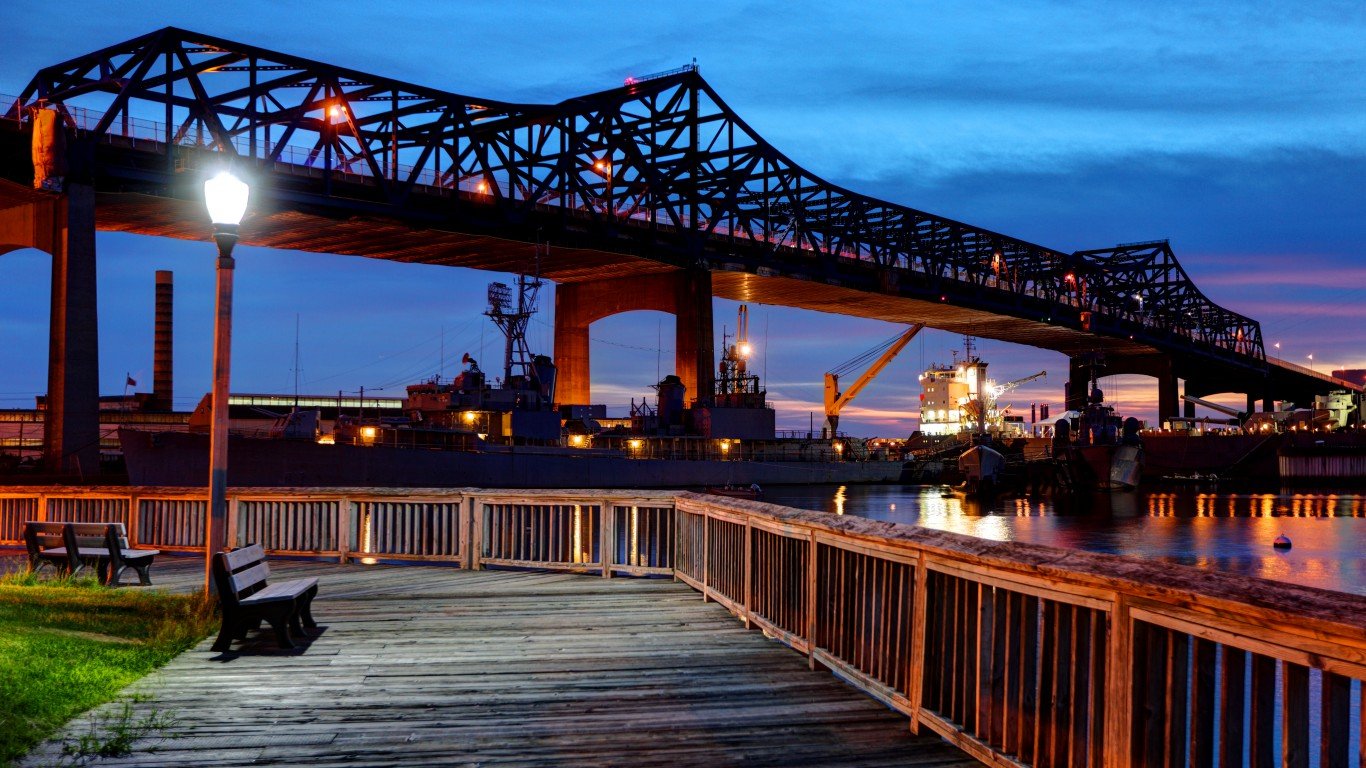
6. Louisiana
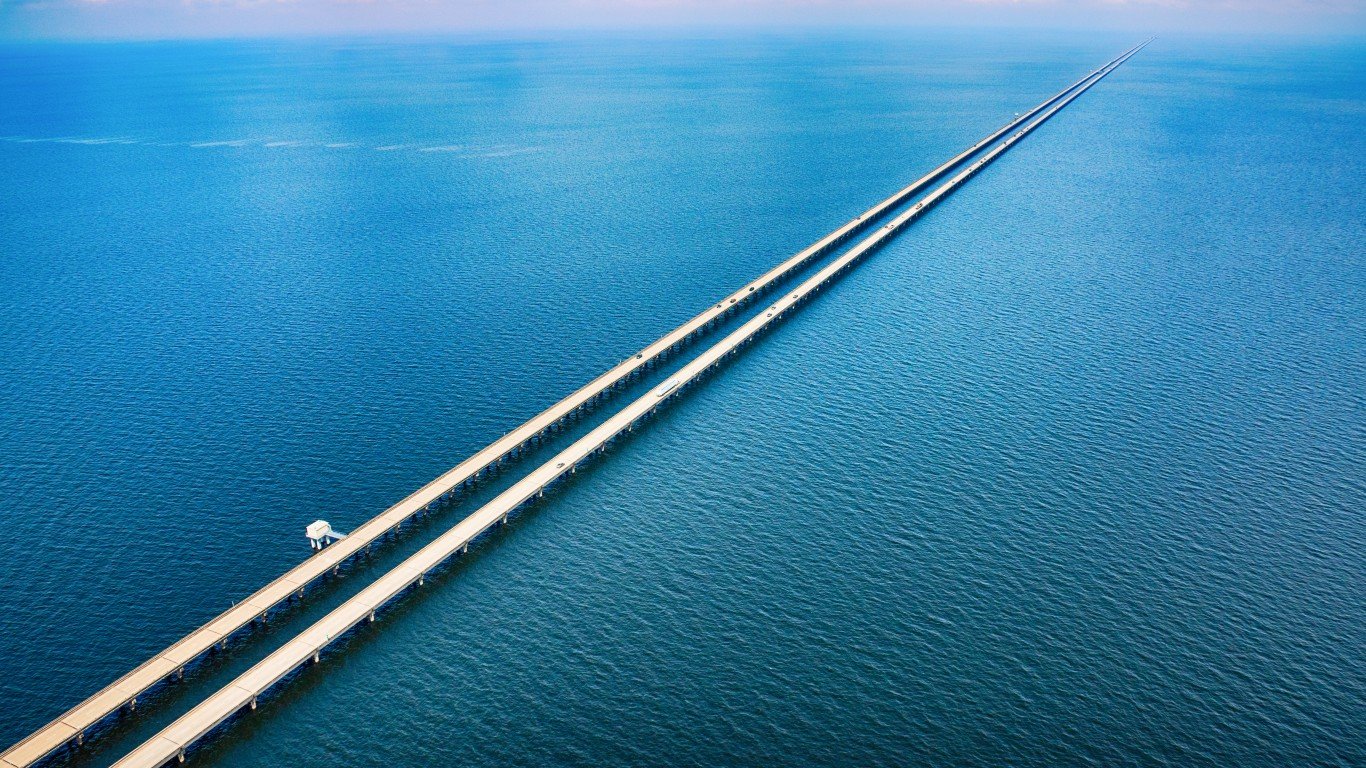
Source: Art Wager / E+ via Getty Images
- Percentage of structurally deficient bridges in 2021: 12.76%
- Capital and bridge disbursements (the costs to build new, and widen existing, highways and bridges) in 2020: $22,084 per lane-mile
- Expected capital and bridge disbursements in 2020: $44,370 per lane-mile
- Adjusted ratio: 0.50 — 6th highest
- Highway system overall rank: 40
- State-control highway miles: 40,154 — 14th highest
- Most impressive bridge in Louisiana: Lake Pontchartrain Causeway
5. Pennsylvania
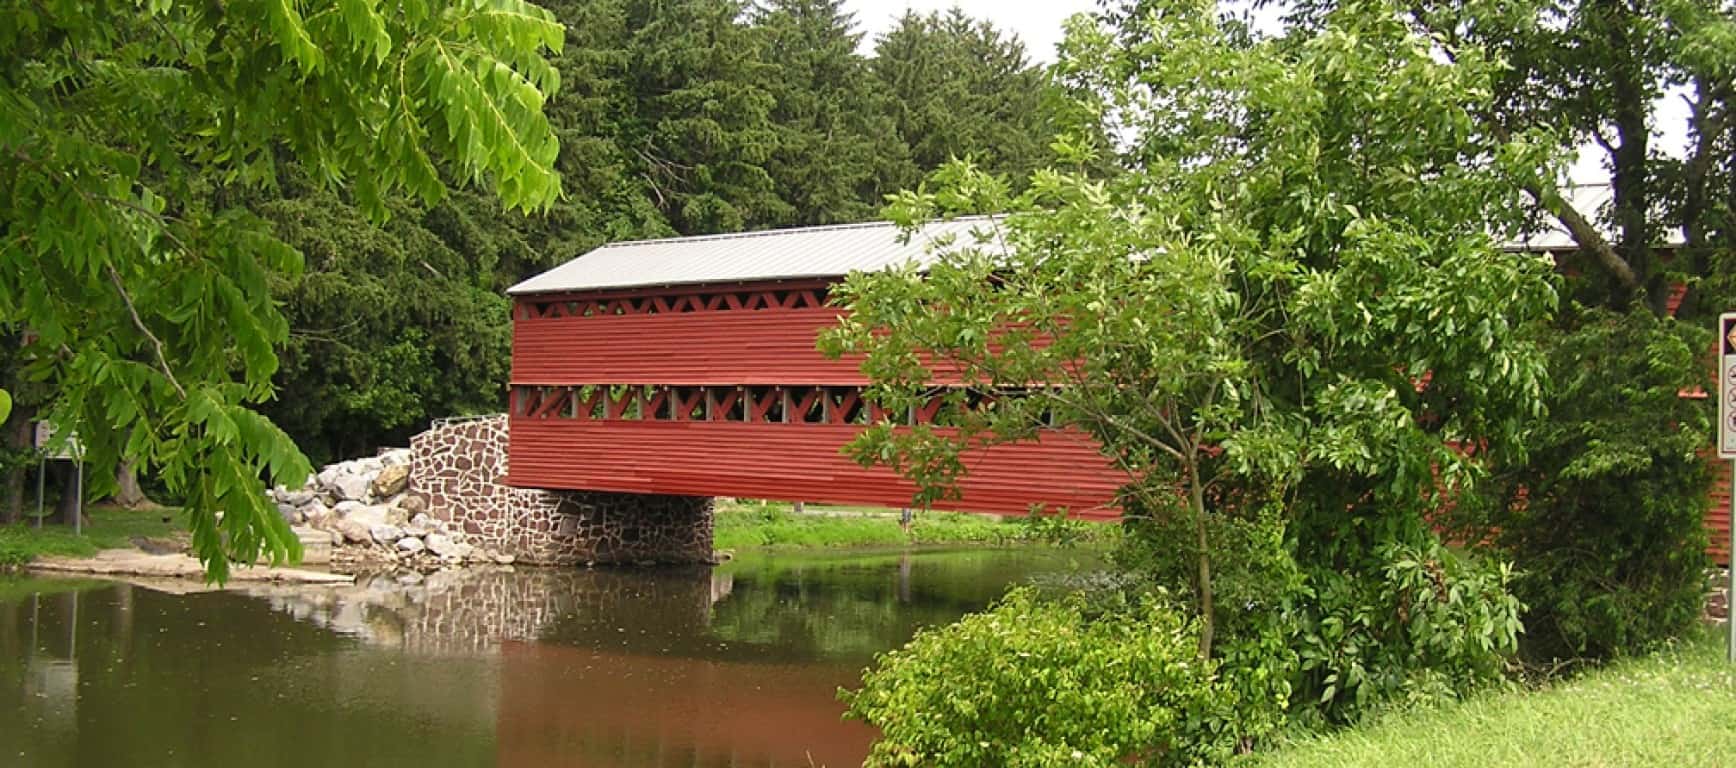
Source: lcd1863 / Flickr
- Percentage of structurally deficient bridges in 2021: 13.80%
- Capital and bridge disbursements (the costs to build new, and widen existing, highways and bridges) in 2020: $43,217 per lane-mile
- Expected capital and bridge disbursements in 2020: $47,341 per lane-mile
- Adjusted ratio: 0.91 — 21st highest
- Highway system overall rank: 41
- State-control highway miles: 88,322 — 5th highest
- Most impressive bridge in Pennsylvania: Sachs Covered Bridge
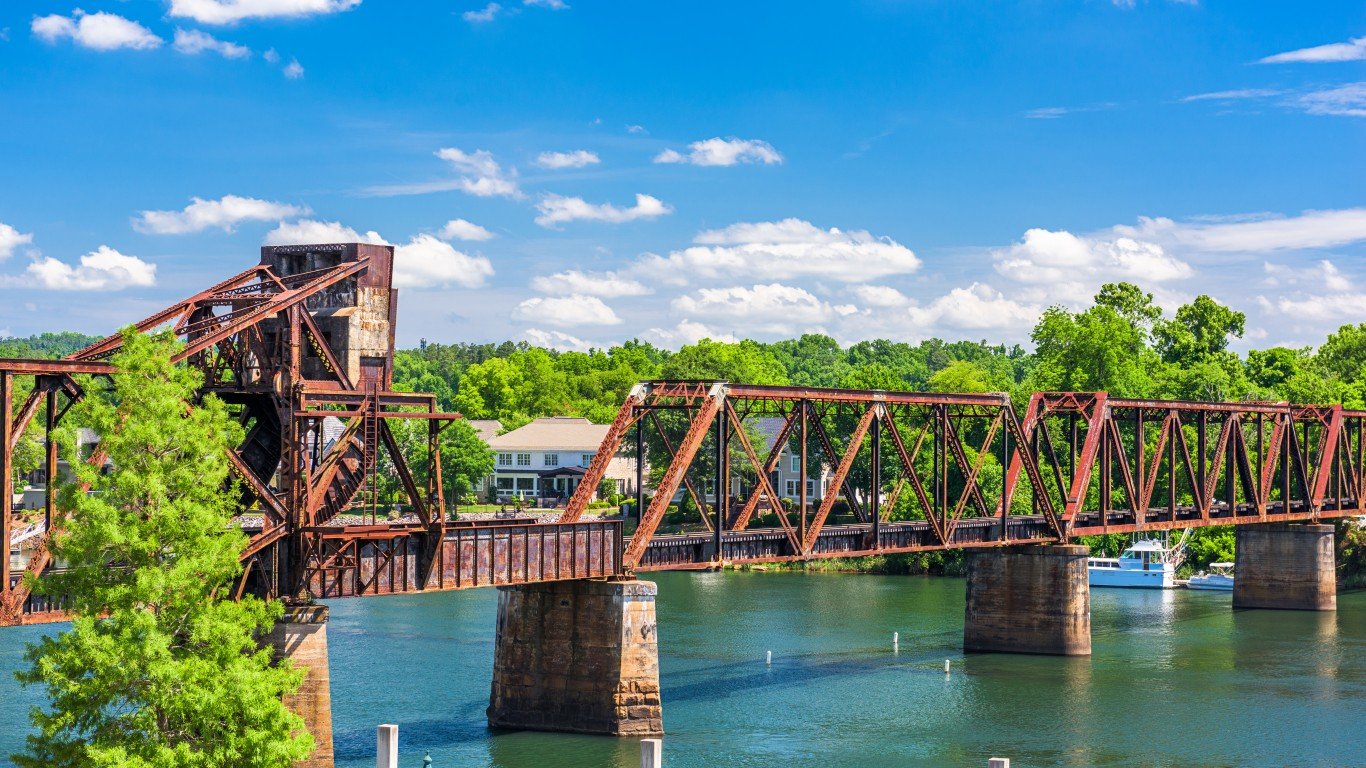
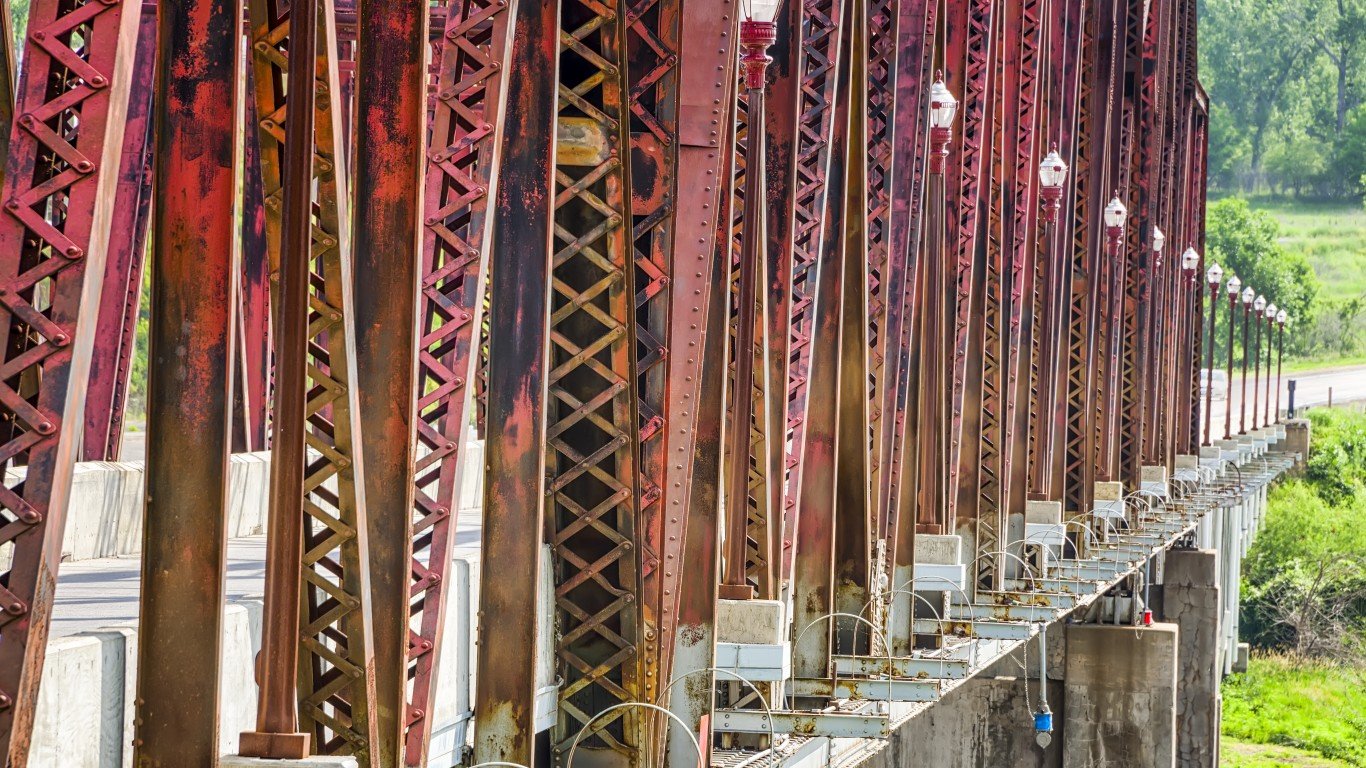
4. South Dakota

- Percentage of structurally deficient bridges in 2021: 17.30%
- Capital and bridge disbursements (the costs to build new, and widen existing, highways and bridges) in 2020: $13,696 per lane-mile
- Expected capital and bridge disbursements in 2020: $18,126 per lane-mile
- Adjusted ratio: 0.76 — 18th highest
- Highway system overall rank: 28
- State-control highway miles: 17,955 — 17th lowest
- Most impressive bridge in South Dakota: Chamberlain Rail Bridge
3. Rhode Island
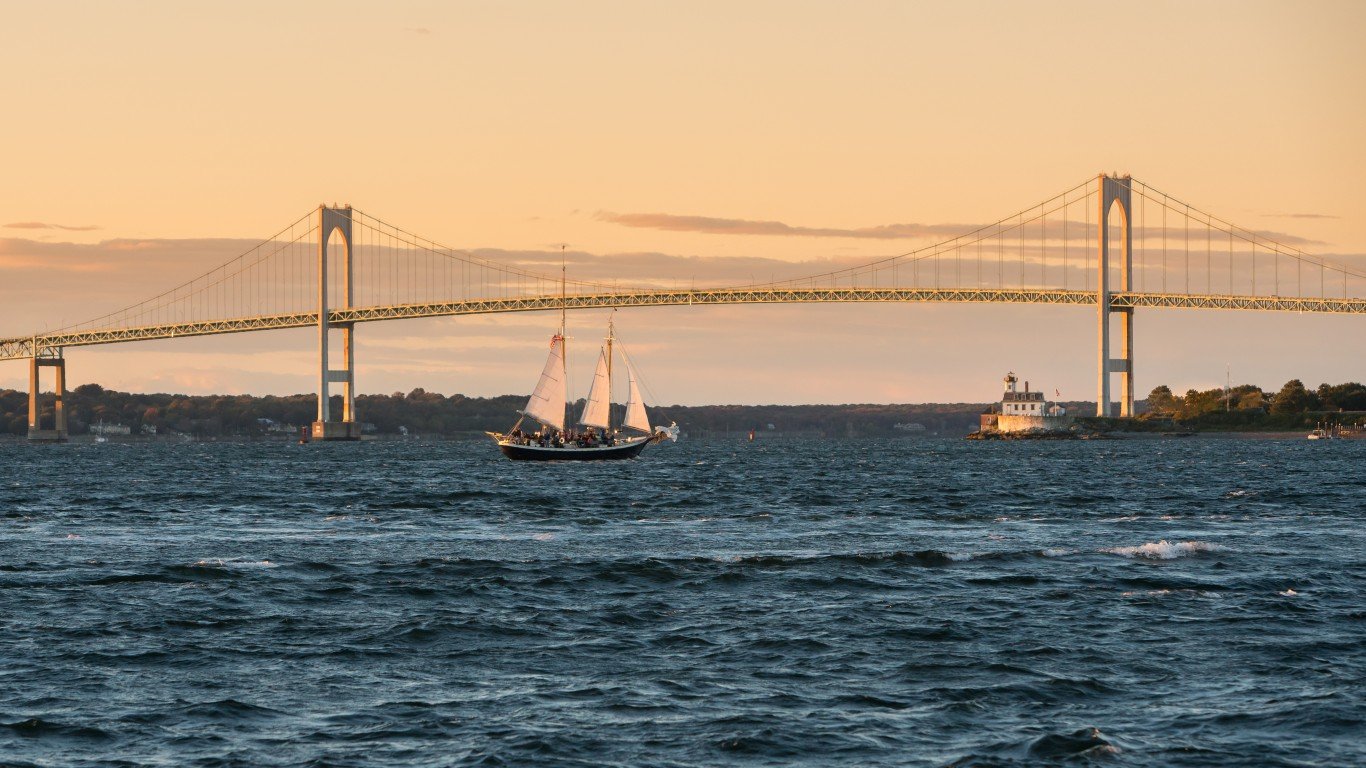
Source: pabradyphoto / Getty Images
- Percentage of structurally deficient bridges in 2021: 17.46%
- Capital and bridge disbursements (the costs to build new, and widen existing, highways and bridges) in 2020: $124,081 per lane-mile
- Expected capital and bridge disbursements in 2020: $132,030 per lane-mile
- Adjusted ratio: 0.94 — 22nd highest
- Highway system overall rank: 42
- State-control highway miles: 2,870 — 2nd lowest
- Most impressive bridge in Rhode Island: Claiborne Pell Bridge
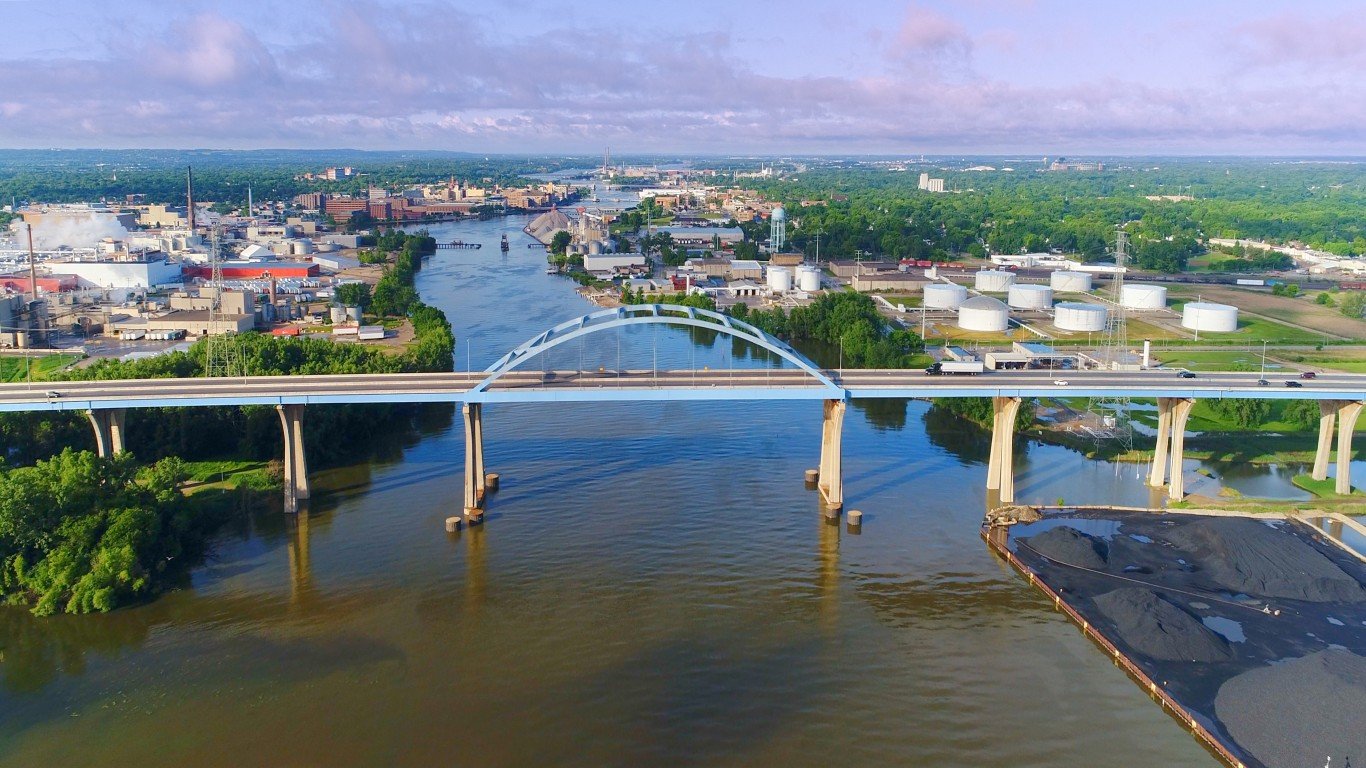
2. Iowa
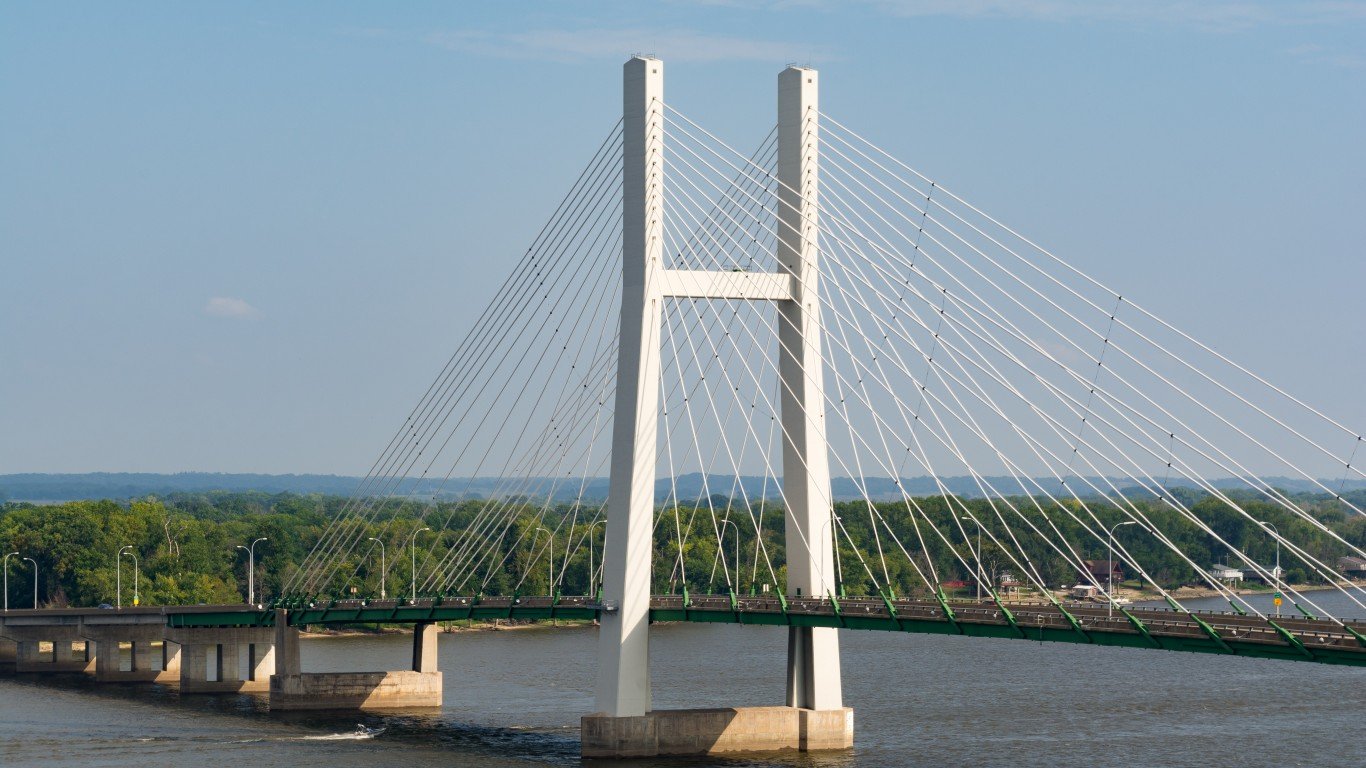
Source: EJ_Rodriquez / iStock via Getty Images
- Percentage of structurally deficient bridges in 2021: 18.87%
- Capital and bridge disbursements (the costs to build new, and widen existing, highways and bridges) in 2020: $44,132 per lane-mile
- Expected capital and bridge disbursements in 2020: $33,116 per lane-mile
- Adjusted ratio: 1.33 — 9th lowest
- Highway system overall rank: 31
- State-control highway miles: 22,918 — 22nd lowest
- Most impressive bridge in Iowa: Kate Shelley High Bridge
1. West Virginia
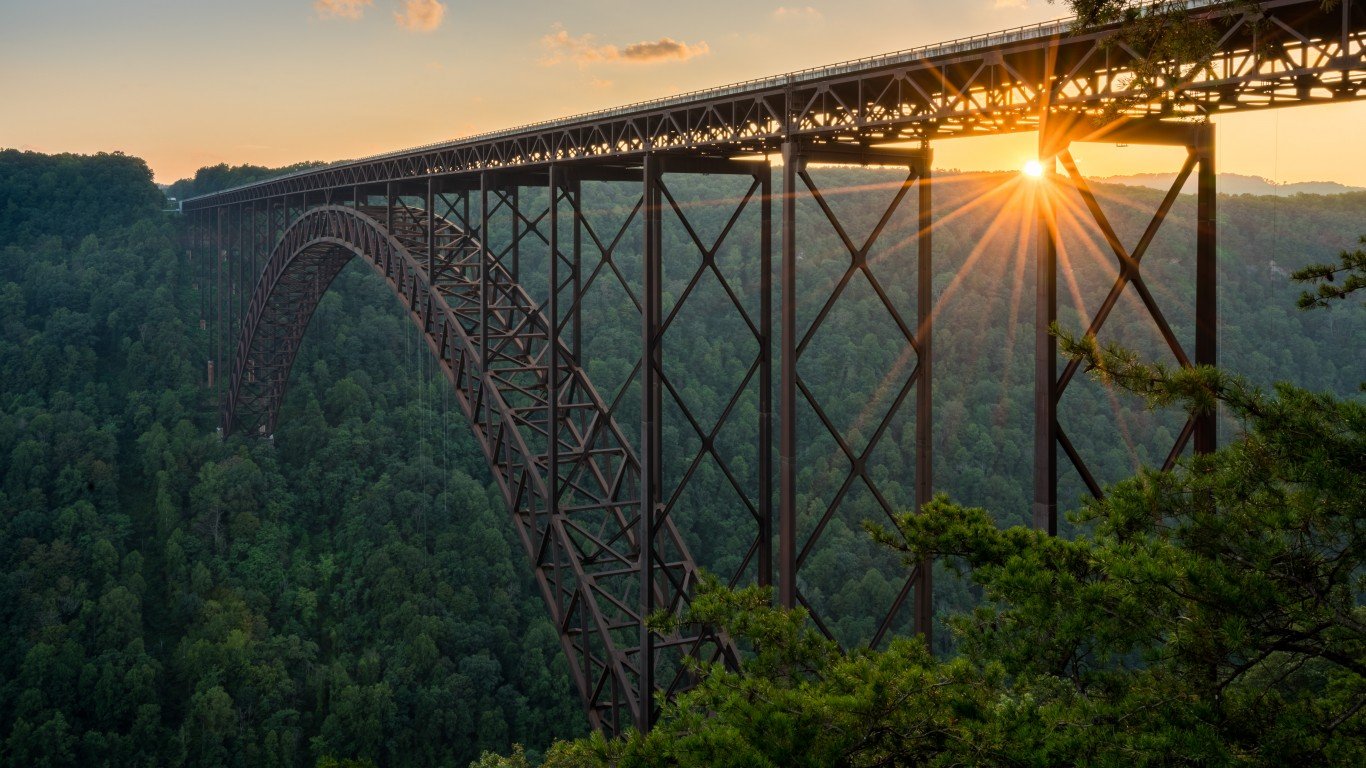
Source: BackyardProduction / iStock via Getty Images
- Percentage of structurally deficient bridges in 2021: 20.37%
- Capital and bridge disbursements (the costs to build new, and widen existing, highways and bridges) in 2020: $12,820 per lane-mile
- Expected capital and bridge disbursements in 2020: $28,193 per lane-mile
- Adjusted ratio: 0.45 — 4th highest
- Highway system overall rank: 39
- State-control highway miles: 71,054 — 7th highest
- Most impressive bridge in West Virginia: New River Gorge Bridge
Thank you for reading! Have some feedback for us?
Contact the 24/7 Wall St. editorial team.
Editors' Picks