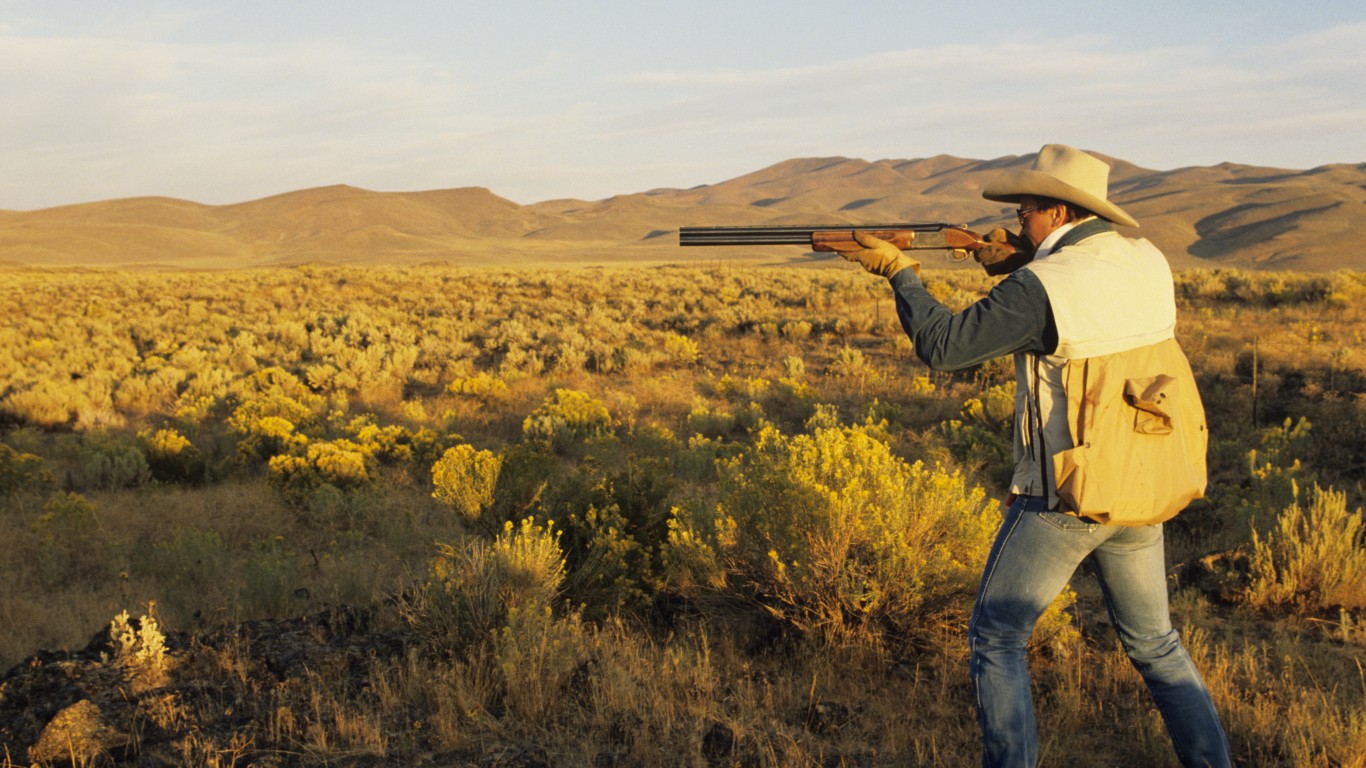
America’s relationship to hunting has changed throughout the years. Although many Americans no longer rely on wild game as a food source, it has not lost its importance. Hunting can be used as a method to address game overpopulation while encouraging conservation. It also boosts the economy on a local and national level.
The number of paid hunting licenses that Americans were issued in 2023 has gone up significantly from the year prior. According to the U.S. Fish and Wildlife Service, there were 15.94 million licenses issued in 2023, compared to 15.39 million in 2022. (Also see, the most versatile hunting rifle cartridges.)
There are hunters in every state, but hunting is a far more important pastime in some states than others. (Many hunters choose a double-barrel shotgun. Here are the most popular double-barrel shotguns in America and how much they cost.)
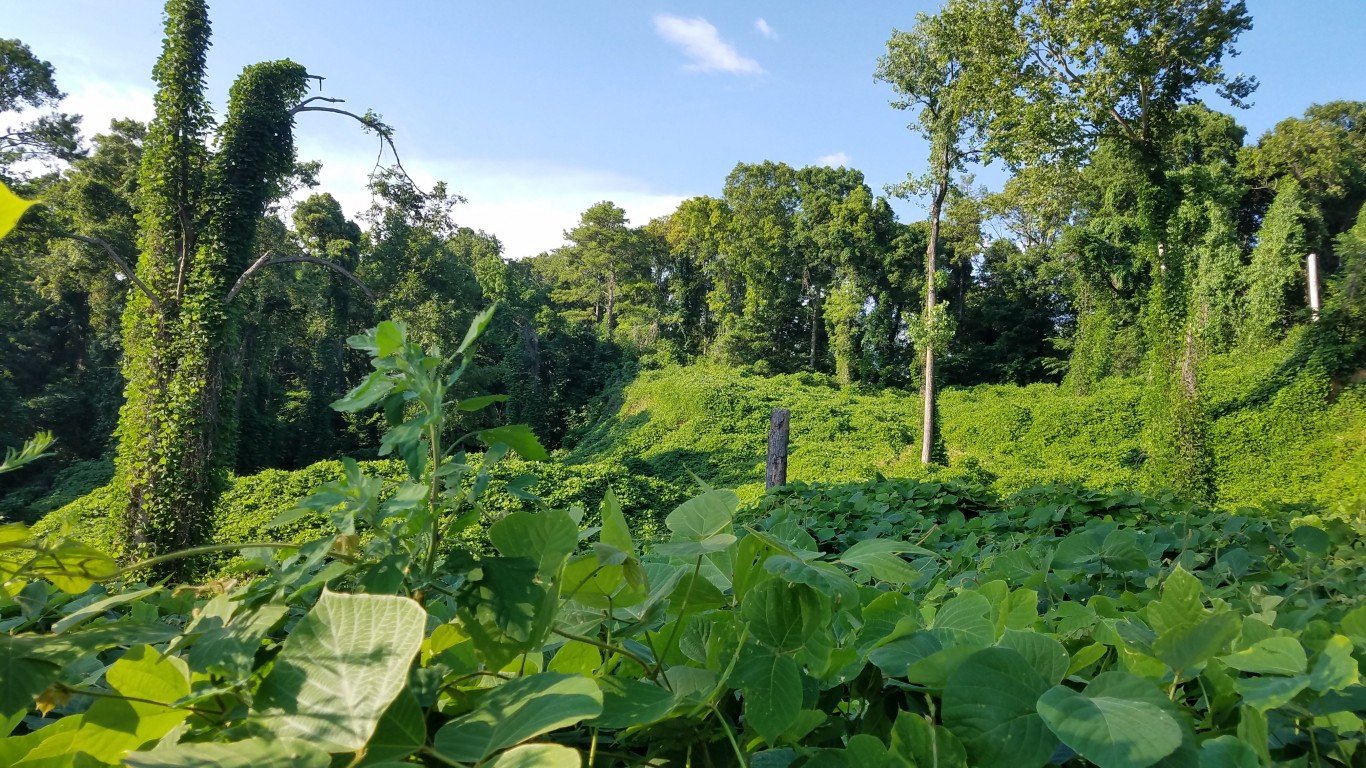
Each state has its own hunting regulations. As certain animal species are protected by federal law, some states require special licenses that explain the type of game that can be hunted. Limited access to public lands also constrains where hunters can hunt. In eight Western states, public lands account for more than 50% of a state’s total area.
24/7 Wall St. reviewed data on hunting license apportionments from the U.S. Fish and Wildlife Service to determine the states with the most hunters. States were ranked based on the number of paid hunting licenses issued in 2021 per 100 residents.
Why This Matters
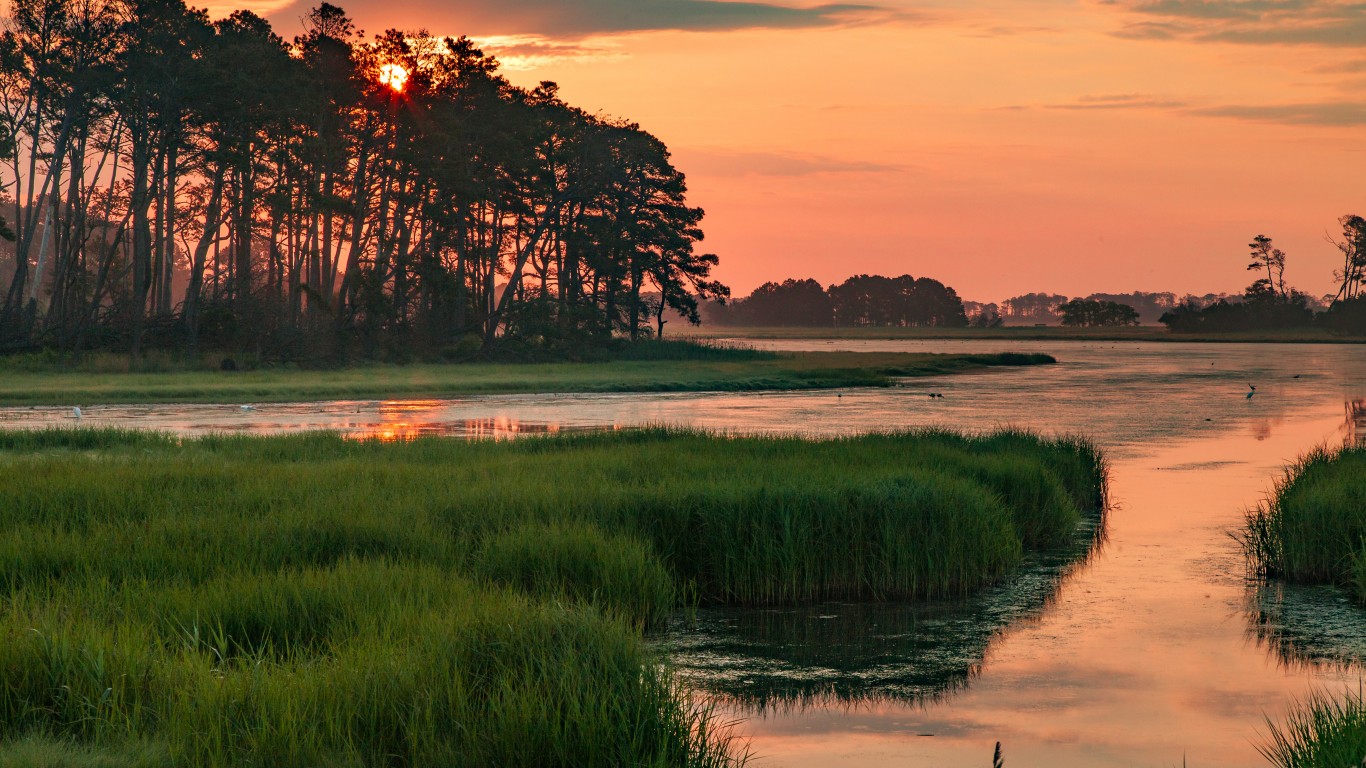
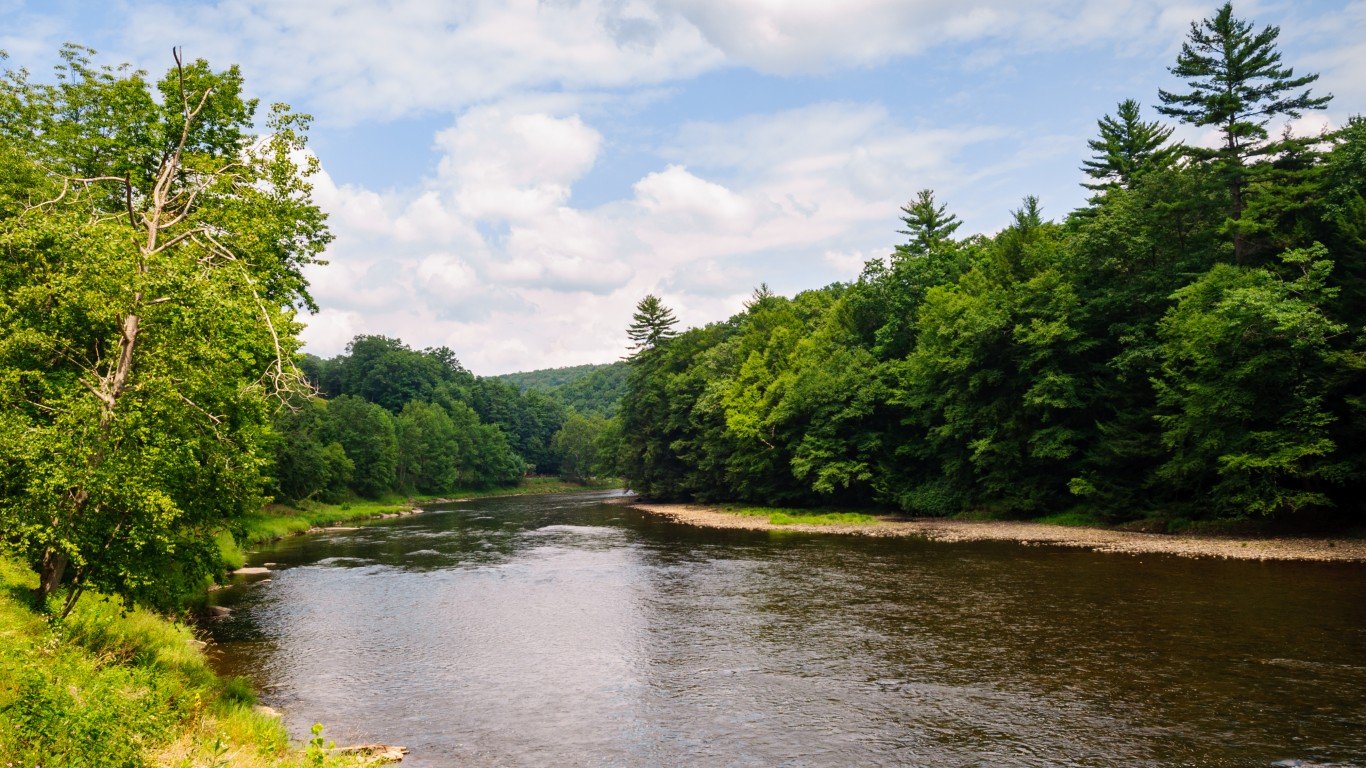
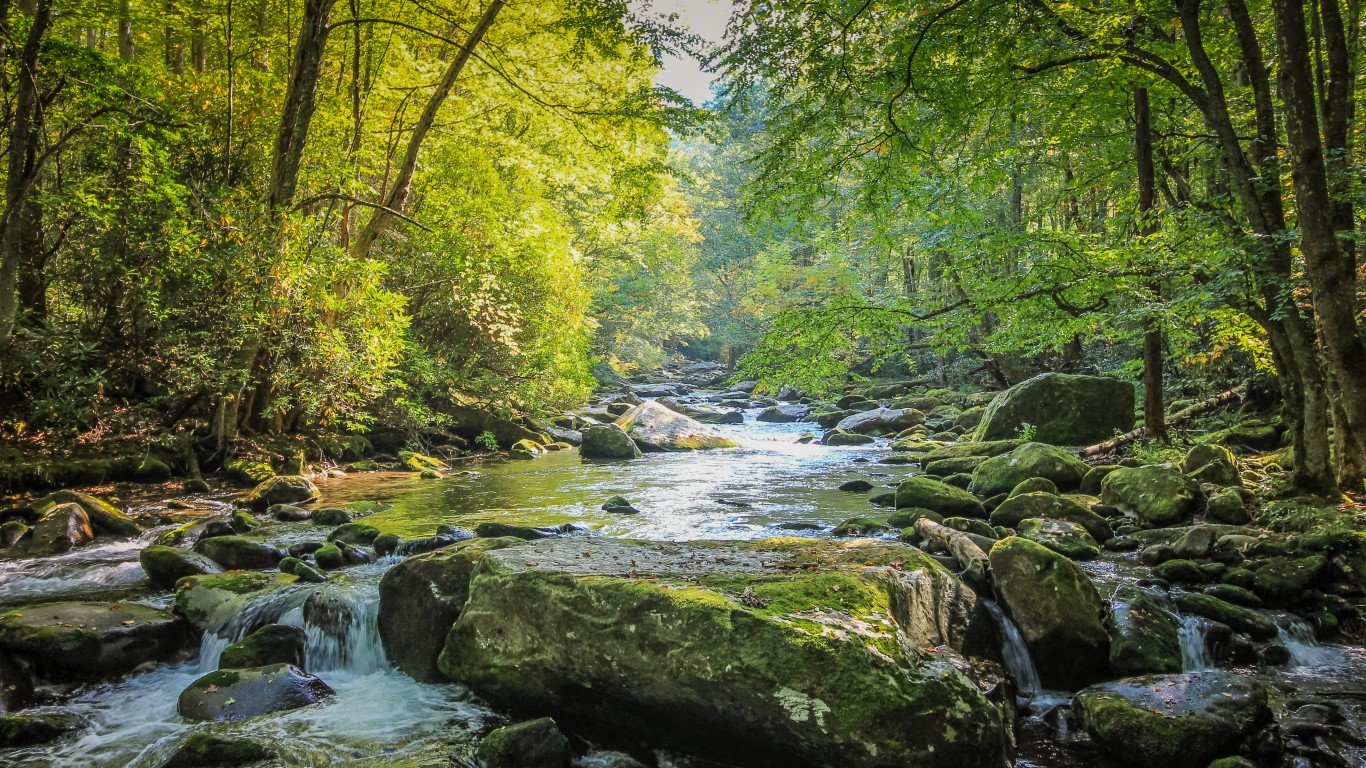
Source: river34 / iStock via Getty Images
24/7 wants to help you better understand your money, and how to spend it wisely. We’re covering which states have the most hunters to help you gauge where your hard earned dollar will go the furthest. In 2021, Wyoming, South Dakota, Montana, North Dakota, and Idaho had the highest percentage of paid hunting licenses issued per 100 residents. All are in the West and are among the least densely populated states. Hunters in some of these states are also paying the highest premium for hunting licenses in the country. Wyoming, Montana, and Idaho have three of the five highest gross costs for hunting licenses.
Scroll to the bottom to read our detailed methodology.
Scroll below to see the state that has the most hunters: every state ranked. Data is for the year 2021.
50. California

Source: Nikolay Tsuguliev / iStock via Getty Images
- Paid hunting licenses issued (adjusted for state population): 0.7 per 100 residents
- Average hunting license expense: $86.67 per hunter (16th most)
- Total paid hunting licenses issued: 278,210 (23rd most)
- Percent of public lands in total state area: 55.9% (6th most)
49. Rhode Island
Source: Image Source / Image Source via Getty Images
- Paid hunting licenses issued (adjusted for state population): 0.7 per 100 residents
- Average hunting license expense: $63.84 per hunter (25th least)
- Total paid hunting licenses issued: 7,985 (the least)
- Percent of public lands in total state area: 10.9% (17th least)
48. New Jersey
Source: Leembe / Getty Images
- Paid hunting licenses issued (adjusted for state population): 0.8 per 100 residents
- Average hunting license expense: $114.71 per hunter (6th most)
- Total paid hunting licenses issued: 71,707 (8th least)
- Percent of public lands in total state area: 23.6% (16th most)
47. Hawaii

Source: Lorraine Boogich / iStock via Getty Images
- Paid hunting licenses issued (adjusted for state population): 0.8 per 100 residents
- Average hunting license expense: $40.91 per hunter (9th least)
- Total paid hunting licenses issued: 11,270 (2nd least)
- Percent of public lands in total state area: 40.5% (11th most)
46. Massachusetts
Source: DenisTangneyJr / E+ via Getty Images
- Paid hunting licenses issued (adjusted for state population): 0.9 per 100 residents
- Average hunting license expense: $43.51 per hunter (12th least)
- Total paid hunting licenses issued: 59,652 (5th least)
- Percent of public lands in total state area: 19.4% (18th most)
45. Connecticut
Source: CHBD / E+ via Getty Images
- Paid hunting licenses issued (adjusted for state population): 0.9 per 100 residents
- Average hunting license expense: $71.24 per hunter (24th most)
- Total paid hunting licenses issued: 30,807 (4th least)
- Percent of public lands in total state area: 15.8% (25th most)
44. Florida
Source: CampPhoto / E+ via Getty Images
- Paid hunting licenses issued (adjusted for state population): 1.0 per 100 residents
- Average hunting license expense: $36.67 per hunter (6th least)
- Total paid hunting licenses issued: 217,113 (19th least)
- Percent of public lands in total state area: 27.0% (14th most)
43. Delaware
Source: wangjs / Flickr
- Paid hunting licenses issued (adjusted for state population): 1.7 per 100 residents
- Average hunting license expense: $91.41 per hunter (13th most)
- Total paid hunting licenses issued: 16,728 (3rd least)
- Percent of public lands in total state area: 14.6% (22nd least)
42. Maryland
Source: ALFSnaiper / iStock via Getty Images
- Paid hunting licenses issued (adjusted for state population): 1.9 per 100 residents
- Average hunting license expense: $54.44 per hunter (20th least)
- Total paid hunting licenses issued: 116,422 (11th least)
- Percent of public lands in total state area: 14.1% (21st least)
41. Illinois
Source: EAGiven / iStock via Getty Images
- Paid hunting licenses issued (adjusted for state population): 2.3 per 100 residents
- Average hunting license expense: $111.83 per hunter (7th most)
- Total paid hunting licenses issued: 289,922 (21st most)
- Percent of public lands in total state area: 4.3% (5th least)
40. Washington
Source: SolomonCrowe / iStock via Getty Images
- Paid hunting licenses issued (adjusted for state population): 2.4 per 100 residents
- Average hunting license expense: $103.00 per hunter (8th most)
- Total paid hunting licenses issued: 185,147 (16th least)
- Percent of public lands in total state area: 38.3% (12th most)
39. New York
Source: PapaBear / iStock via Getty Images
- Paid hunting licenses issued (adjusted for state population): 2.8 per 100 residents
- Average hunting license expense: $42.13 per hunter (11th least)
- Total paid hunting licenses issued: 560,346 (8th most)
- Percent of public lands in total state area: 15.3% (25th least)
38. Virginia
Source: pabradyphoto / iStock via Getty Images
- Paid hunting licenses issued (adjusted for state population): 2.9 per 100 residents
- Average hunting license expense: $89.42 per hunter (14th most)
- Total paid hunting licenses issued: 253,650 (23rd least)
- Percent of public lands in total state area: 16.0% (24th most)
37. Ohio
Source: bryanakers / iStock via Getty Images
- Paid hunting licenses issued (adjusted for state population): 3.1 per 100 residents
- Average hunting license expense: $75.33 per hunter (21st most)
- Total paid hunting licenses issued: 360,421 (15th most)
- Percent of public lands in total state area: 6.0% (8th least)
36. Nevada
Source: Kyle Kempf / iStock via Getty Images
- Paid hunting licenses issued (adjusted for state population): 3.4 per 100 residents
- Average hunting license expense: $71.45 per hunter (23rd most)
- Total paid hunting licenses issued: 106,861 (10th least)
- Percent of public lands in total state area: 83.2% (the most)
35. Texas

- Paid hunting licenses issued (adjusted for state population): 4.0 per 100 residents
- Average hunting license expense: $41.90 per hunter (10th least)
- Total paid hunting licenses issued: 1,170,316 (the most)
- Percent of public lands in total state area: 4.1% (4th least)
34. Indiana
Source: Zach Finn / Getty Images
- Paid hunting licenses issued (adjusted for state population): 4.0 per 100 residents
- Average hunting license expense: $46.17 per hunter (15th least)
- Total paid hunting licenses issued: 273,423 (24th most)
- Percent of public lands in total state area: 4.7% (6th least)
33. South Carolina
Source: ericfoltz / E+ via Getty Images
- Paid hunting licenses issued (adjusted for state population): 4.2 per 100 residents
- Average hunting license expense: $46.38 per hunter (16th least)
- Total paid hunting licenses issued: 219,222 (20th least)
- Percent of public lands in total state area: 9.4% (11th least)
32. New Hampshire
Source: kanonsky / iStock via Getty Images
- Paid hunting licenses issued (adjusted for state population): 4.4 per 100 residents
- Average hunting license expense: $83.54 per hunter (17th most)
- Total paid hunting licenses issued: 60,629 (6th least)
- Percent of public lands in total state area: 24.9% (15th most)
31. Arizona
Source: MarciParavia / iStock via Getty Images
- Paid hunting licenses issued (adjusted for state population): 4.8 per 100 residents
- Average hunting license expense: $59.52 per hunter (22nd least)
- Total paid hunting licenses issued: 349,554 (16th most)
- Percent of public lands in total state area: 55.1% (7th most)
30. North Carolina
Source: KenCanning / E+ via Getty Images
- Paid hunting licenses issued (adjusted for state population): 6.2 per 100 residents
- Average hunting license expense: $20.12 per hunter (the least)
- Total paid hunting licenses issued: 654,251 (7th most)
- Percent of public lands in total state area: 10.7% (16th least)
29. Colorado

- Paid hunting licenses issued (adjusted for state population): 6.4 per 100 residents
- Average hunting license expense: $207.63 per hunter (2nd most)
- Total paid hunting licenses issued: 370,736 (14th most)
- Percent of public lands in total state area: 44.7% (10th most)
28. Michigan
Source: ehrlif / iStock via Getty Images
- Paid hunting licenses issued (adjusted for state population): 6.6 per 100 residents
- Average hunting license expense: $56.19 per hunter (21st least)
- Total paid hunting licenses issued: 660,933 (6th most)
- Percent of public lands in total state area: 15.3% (24th least)
27. New Mexico
Source: James Orndorf / Shutterstock.com
- Paid hunting licenses issued (adjusted for state population): 6.6 per 100 residents
- Average hunting license expense: $141.52 per hunter (5th most)
- Total paid hunting licenses issued: 140,685 (13th least)
- Percent of public lands in total state area: 47.6% (9th most)
26. Iowa
Source: carlwwycoff / Flickr
- Paid hunting licenses issued (adjusted for state population): 6.9 per 100 residents
- Average hunting license expense: $101.84 per hunter (9th most)
- Total paid hunting licenses issued: 220,576 (21st least)
- Percent of public lands in total state area: 3.0% (3rd least)
25. Georgia
Source: William Silver / Shutterstock.com
- Paid hunting licenses issued (adjusted for state population): 7.1 per 100 residents
- Average hunting license expense: $26.89 per hunter (4th least)
- Total paid hunting licenses issued: 769,105 (3rd most)
- Percent of public lands in total state area: 9.9% (13th least)
24. Kentucky
Source: Thomas Kelley / iStock via Getty Images
- Paid hunting licenses issued (adjusted for state population): 7.1 per 100 residents
- Average hunting license expense: $71.07 per hunter (25th most)
- Total paid hunting licenses issued: 321,347 (19th most)
- Percent of public lands in total state area: 7.7% (10th least)
23. Pennsylvania
Source: zrfphoto / Getty Images
- Paid hunting licenses issued (adjusted for state population): 7.4 per 100 residents
- Average hunting license expense: $44.63 per hunter (13th least)
- Total paid hunting licenses issued: 953,903 (2nd most)
- Percent of public lands in total state area: 18.7% (20th most)
22. Oregon
Source: Dee / iStock via Getty Images
- Paid hunting licenses issued (adjusted for state population): 7.8 per 100 residents
- Average hunting license expense: $91.63 per hunter (12th most)
- Total paid hunting licenses issued: 331,475 (17th most)
- Percent of public lands in total state area: 56.8% (4th most)
21. Utah
Source: MagicDreamer / Getty Images
- Paid hunting licenses issued (adjusted for state population): 8.0 per 100 residents
- Average hunting license expense: $78.87 per hunter (19th most)
- Total paid hunting licenses issued: 268,075 (25th most)
- Percent of public lands in total state area: 72.0% (2nd most)
20. Missouri
Source: ricricciardi / Flickr
- Paid hunting licenses issued (adjusted for state population): 8.3 per 100 residents
- Average hunting license expense: $51.33 per hunter (18th least)
- Total paid hunting licenses issued: 509,963 (10th most)
- Percent of public lands in total state area: 7.6% (9th least)
19. Kansas
Source: ricardoreitmeyer / iStock via Getty Images
- Paid hunting licenses issued (adjusted for state population): 8.7 per 100 residents
- Average hunting license expense: $93.39 per hunter (11th most)
- Total paid hunting licenses issued: 255,143 (25th least)
- Percent of public lands in total state area: 1.9% (the least)
18. Nebraska
Source: marekuliasz / iStock via Getty Images
- Paid hunting licenses issued (adjusted for state population): 9.4 per 100 residents
- Average hunting license expense: $86.91 per hunter (15th most)
- Total paid hunting licenses issued: 185,034 (15th least)
- Percent of public lands in total state area: 2.4% (2nd least)
17. Louisiana
Source: RoschetzkyIstockPhoto / iStock via Getty Images
- Paid hunting licenses issued (adjusted for state population): 9.6 per 100 residents
- Average hunting license expense: $22.13 per hunter (2nd least)
- Total paid hunting licenses issued: 442,678 (13th most)
- Percent of public lands in total state area: 10.1% (14th least)
16. Mississippi
Source: Jonathan Hammond / Getty Images
- Paid hunting licenses issued (adjusted for state population): 9.6 per 100 residents
- Average hunting license expense: $49.13 per hunter (17th least)
- Total paid hunting licenses issued: 283,021 (22nd most)
- Percent of public lands in total state area: 9.8% (12th least)
15. Minnesota
Source: Jacob Boomsma / iStock via Getty Images
- Paid hunting licenses issued (adjusted for state population): 9.6 per 100 residents
- Average hunting license expense: $61.86 per hunter (23rd least)
- Total paid hunting licenses issued: 550,663 (9th most)
- Percent of public lands in total state area: 18.9% (19th most)
14. Vermont
Source: A&J Fotos / E+ via Getty Images
- Paid hunting licenses issued (adjusted for state population): 10.0 per 100 residents
- Average hunting license expense: $71.53 per hunter (22nd most)
- Total paid hunting licenses issued: 64,343 (7th least)
- Percent of public lands in total state area: 16.5% (23rd most)
13. Alabama
Source: George Dodd / iStock via Getty Images
- Paid hunting licenses issued (adjusted for state population): 10.0 per 100 residents
- Average hunting license expense: $45.46 per hunter (14th least)
- Total paid hunting licenses issued: 504,600 (11th most)
- Percent of public lands in total state area: 5.9% (7th least)
12. Tennessee
Source: KLBahr / iStock via Getty Images
- Paid hunting licenses issued (adjusted for state population): 10.4 per 100 residents
- Average hunting license expense: $39.06 per hunter (7th least)
- Total paid hunting licenses issued: 728,759 (4th most)
- Percent of public lands in total state area: 10.2% (15th least)
11. Arkansas
Source: latteda / Flickr
- Paid hunting licenses issued (adjusted for state population): 10.7 per 100 residents
- Average hunting license expense: $61.95 per hunter (24th least)
- Total paid hunting licenses issued: 323,474 (18th most)
- Percent of public lands in total state area: 13.6% (20th least)
10. Wisconsin
Source: wackybadger / Flickr
- Paid hunting licenses issued (adjusted for state population): 11.4 per 100 residents
- Average hunting license expense: $53.51 per hunter (19th least)
- Total paid hunting licenses issued: 669,813 (5th most)
- Percent of public lands in total state area: 14.7% (23rd least)
9. Oklahoma
Source: photovs / iStock via Getty Images
- Paid hunting licenses issued (adjusted for state population): 12.5 per 100 residents
- Average hunting license expense: $26.30 per hunter (3rd least)
- Total paid hunting licenses issued: 499,182 (12th most)
- Percent of public lands in total state area: 11.7% (18th least)
8. Alaska
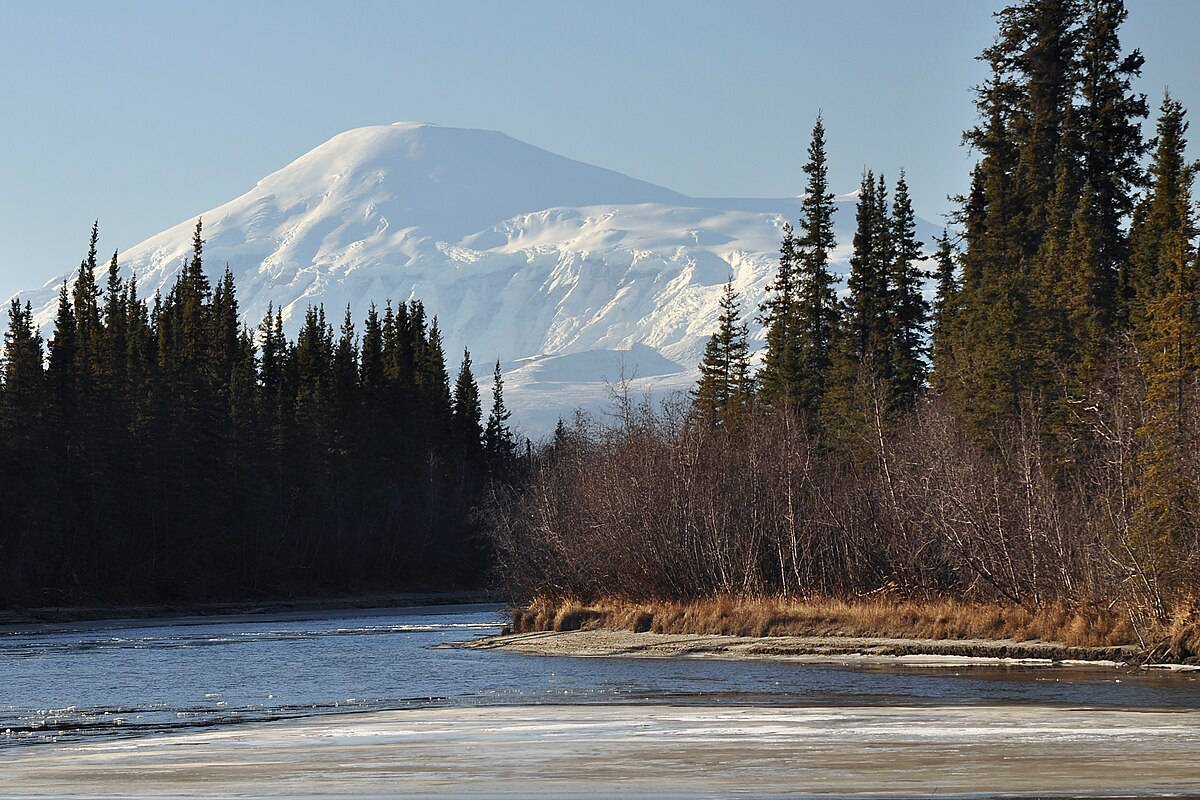
Source: Paxson Woelber/Wikimedia Commons
- Paid hunting licenses issued (adjusted for state population): 13.4 per 100 residents
- Average hunting license expense: $77.73 per hunter (20th most)
- Total paid hunting licenses issued: 98,202 (9th least)
- Percent of public lands in total state area: 56.2% (5th most)
7. West Virginia
Source: Malachi Jacobs / Shutterstock.com
- Paid hunting licenses issued (adjusted for state population): 14.2 per 100 residents
- Average hunting license expense: $35.18 per hunter (5th least)
- Total paid hunting licenses issued: 253,955 (24th least)
- Percent of public lands in total state area: 12.1% (19th least)
6. Maine
Source: Derek Young / Shutterstock.com
- Paid hunting licenses issued (adjusted for state population): 15.1 per 100 residents
- Average hunting license expense: $39.41 per hunter (8th least)
- Total paid hunting licenses issued: 207,849 (18th least)
- Percent of public lands in total state area: 18.1% (21st most)
5. Idaho
Source: Jessica Torres / Getty Images
- Paid hunting licenses issued (adjusted for state population): 15.9 per 100 residents
- Average hunting license expense: $142.14 per hunter (4th most)
- Total paid hunting licenses issued: 301,994 (20th most)
- Percent of public lands in total state area: 68.0% (3rd most)
4. North Dakota
Source: corradobarattaphotos / iStock via Getty Images
- Paid hunting licenses issued (adjusted for state population): 19.4 per 100 residents
- Average hunting license expense: $81.97 per hunter (18th most)
- Total paid hunting licenses issued: 150,724 (14th least)
- Percent of public lands in total state area: 21.6% (17th most)
3. Montana
Source: Melissa Kopka / iStock via Getty Images
- Paid hunting licenses issued (adjusted for state population): 20.9 per 100 residents
- Average hunting license expense: $166.57 per hunter (3rd most)
- Total paid hunting licenses issued: 231,339 (22nd least)
- Percent of public lands in total state area: 37.6% (13th most)
2. South Dakota
Source: jerry7171 / Flickr
- Paid hunting licenses issued (adjusted for state population): 23.0 per 100 residents
- Average hunting license expense: $101.08 per hunter (10th most)
- Total paid hunting licenses issued: 206,316 (17th least)
- Percent of public lands in total state area: 16.9% (22nd most)
1. Wyoming
Source: Amanda Allard-Korell / Shutterstock.com
- Paid hunting licenses issued (adjusted for state population): 23.5 per 100 residents
- Average hunting license expense: $258.66 per hunter (the most)
- Total paid hunting licenses issued: 136,205 (12th least)
- Percent of public lands in total state area: 54.2% (8th most)
Methodology
To determine the states with the most hunters, 24/7 Wall St. reviewed data on hunting license apportionments from the U.S. Fish and Wildlife Service. States were ranked based on the number of paid hunting licenses issued within in 2021 per 100 residents.
Population data used to adjust hunting license apportionments per capita came from the U.S. Census Bureau’s 2021 American Community Survey and are one-year estimates. Data on the gross cost of paid hunting licenses issued in 2021 used to calculate the average license cost per hunter also came from the USFWS. Data on the percentage of a state that is operated as public land came from the Protected Areas Database program of the U.S. Geological Survey.
Buffett Missed These Two…
Warren Buffett loves dividend stocks, and has stuffed Berkshire with some of his favorites.
But he overlooked two dividend legends that continue to print checks on a new level, they’re nowhere in his portfolio.
Unlock the two dividend legends Buffett missed in this new free report.
Thank you for reading! Have some feedback for us?
Contact the 24/7 Wall St. editorial team.