COVID-19 has dealt a serious blow to downtowns nationwide as health care measures encouraged people to work from home, leaving office buildings empty and stores without foot traffic. Many downtown residents also preferred to move away to houses with greater space — indoors and out. And though there has been an investment to revive and repopulate downtowns in the past decades, the pandemic put a wedge in those efforts, and downtowns nationwide are slow to recover from COVID. Whether it is an ongoing trend or a more recent phenomena, some downtowns are shrinking.
To determine the 40 cities with shrinking downtowns, 24/7 Wall St. ranked cities based on the percentage change in population in their downtown census tracts from 2012 to 2022, using Census Bureau data.
While in most cities on the list the downtown populations are shrinking in tandem with the rest of the city, in places like Anniston, Alabama; Sumter, South Carolina; and Lima, Ohio, the downtowns are shrinking while non-downtown tracts are growing, suggesting people may be moving from the declining downtowns to the suburbs.
In other cities, such as some Midwestern cities on the list that have known decades of economic struggles, their populations have generally been declining — including in their downtown areas. (Some of the cities on this list are indeed also among America’s fastest shrinking big cities.)
Geographically, 10 of the cities on the list are from the Midwest. However, the region with the most cities on the list is the South, with 26 cities, including 10 in Texas alone. Georgia has the second most cities on the list, at four, including the city whose downtown shrank the most from 2012 to 2022.
Full Methodology
To determine the cities with shrinking downtowns, 24/7 Wall St. reviewed five-year data on population change from the U.S. Census Bureau’s 2022 American Community Survey. Cities were ranked based on the percentage change in population in downtown census tracts from 2012 to 2022. Downtown areas were defined as the census tracts that fall at least 50% within the 1.8-mile radius around a city hall. Non-downtown areas were defined as the census tracts that fall at least 50% within a city’s boundaries, yet less than 50% within the 1.8-mile radius around city hall. Boundary definitions are from the U.S. Census Bureau and are for 2022. Only principal cities of metropolitan statistical areas were considered. City hall coordinates as well as supplemental data on income are also from the Census Bureau.
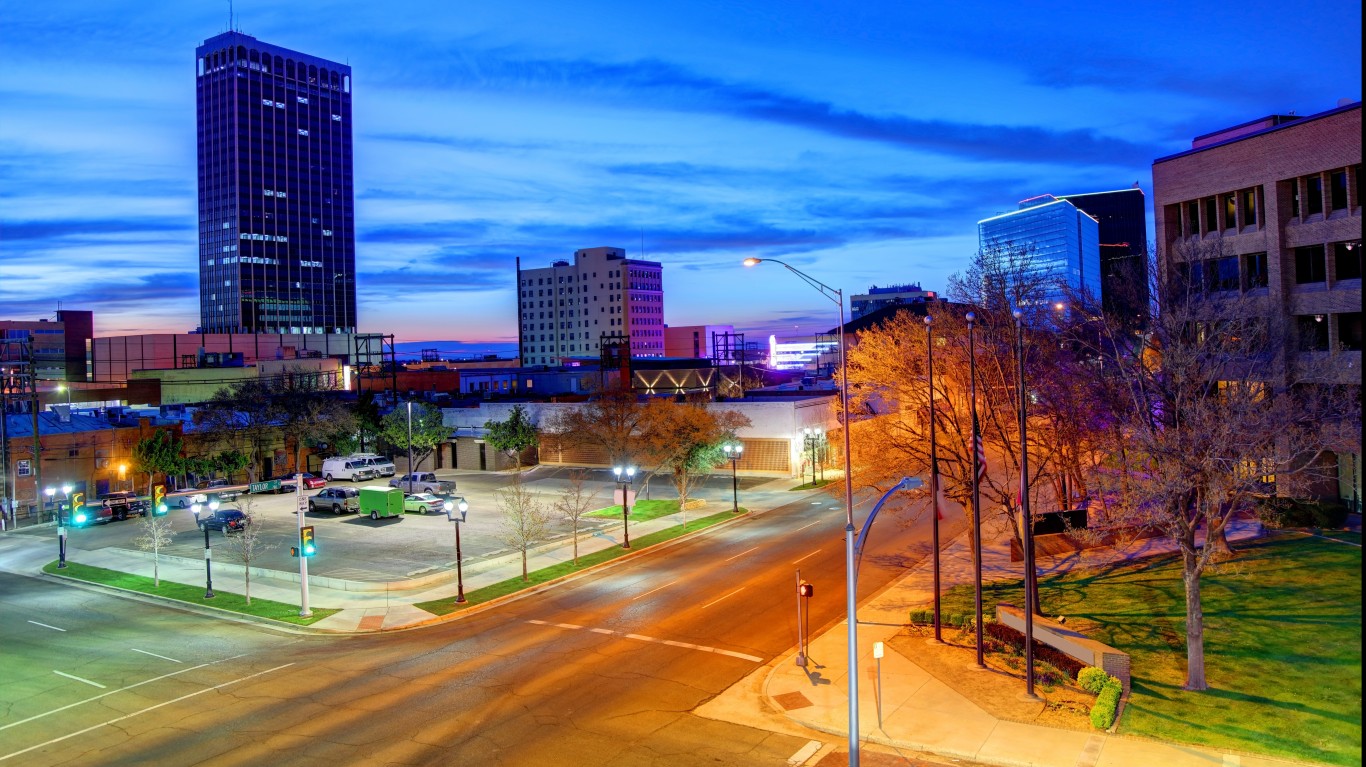
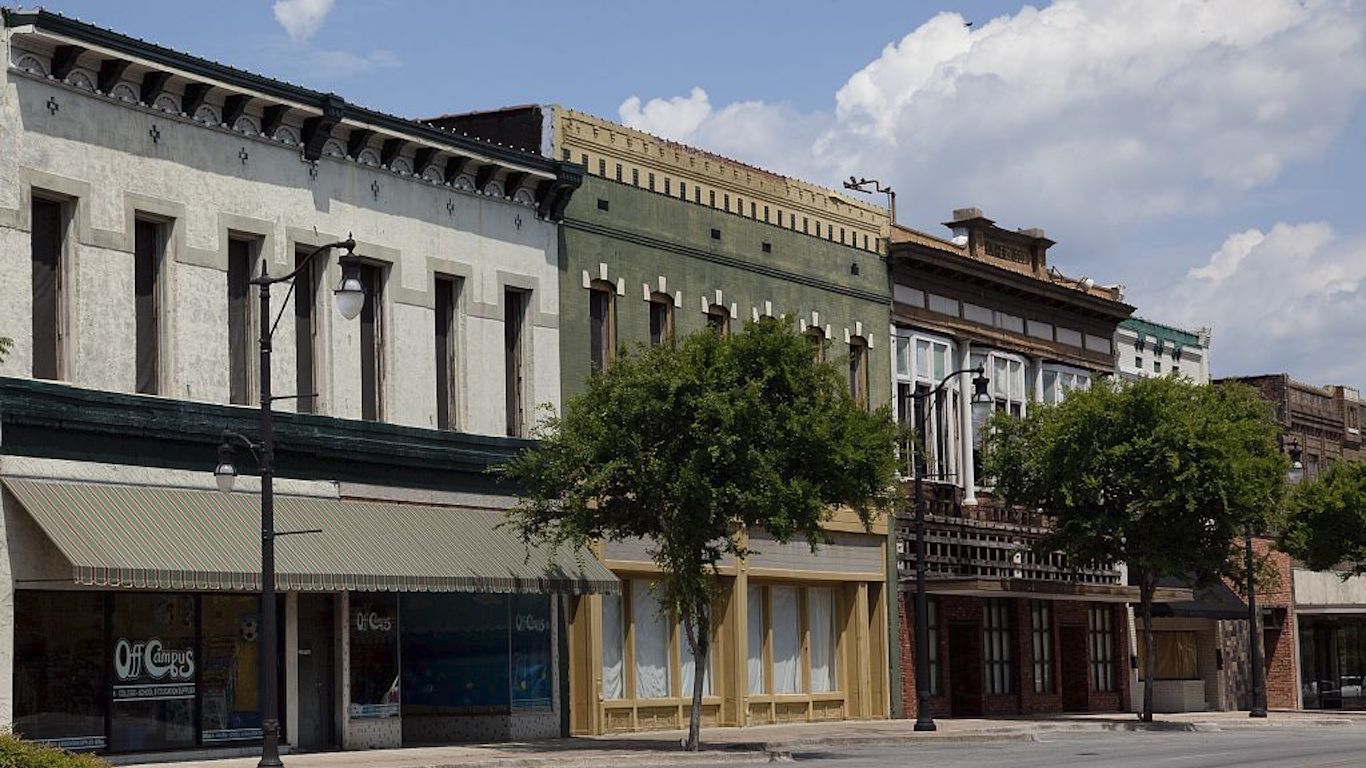
40. San Angelo, Texas
Source: DenisTangneyJr / iStock Unreleased via Getty Images
- Population change in downtown tracts from 2012 to 2022: -10.3%
- Population change of non-downtown tracts from 2012 to 2022: +8.7%
- Per capita income chg in downtown tracts from 2012 to 2022: +21.3%
- Per capita income chg in non-downtown tracts from 2012 to 2022: +15.5%
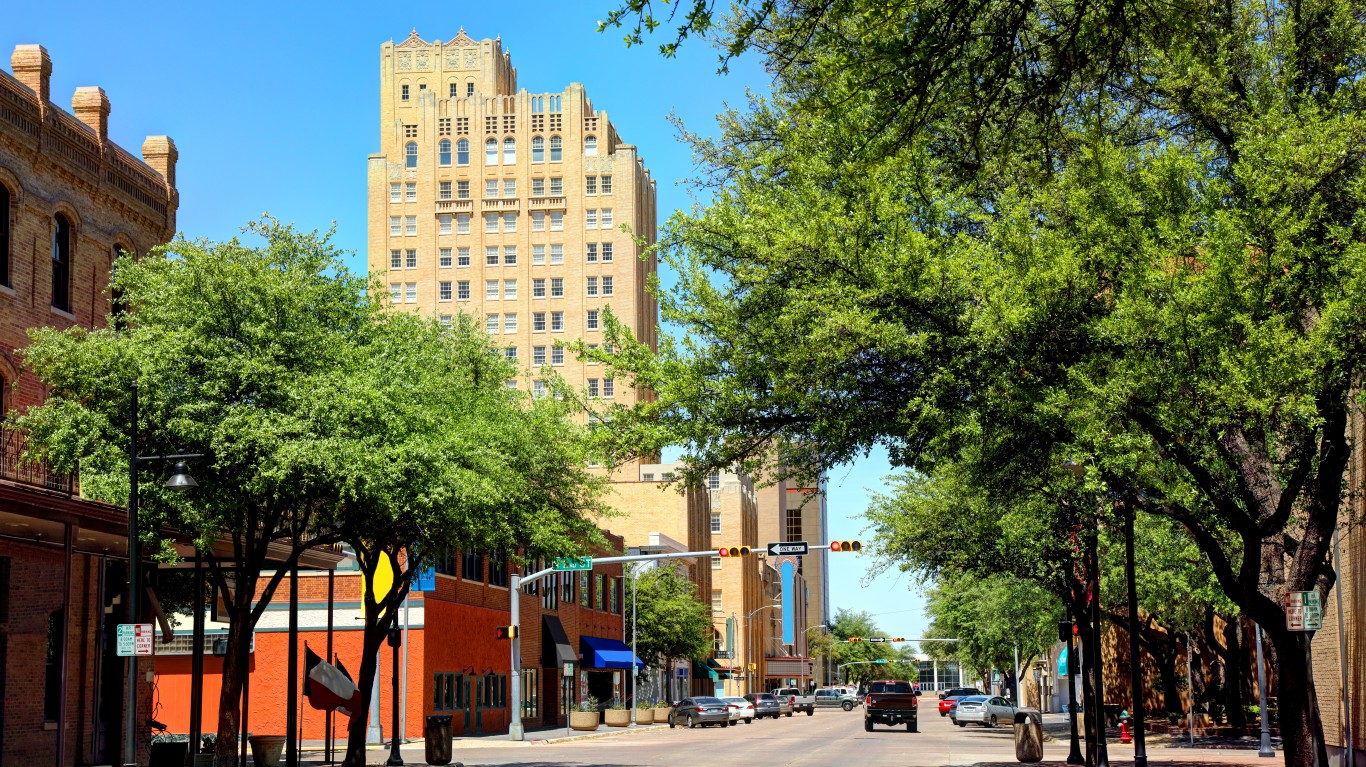
39. San Antonio, Texas
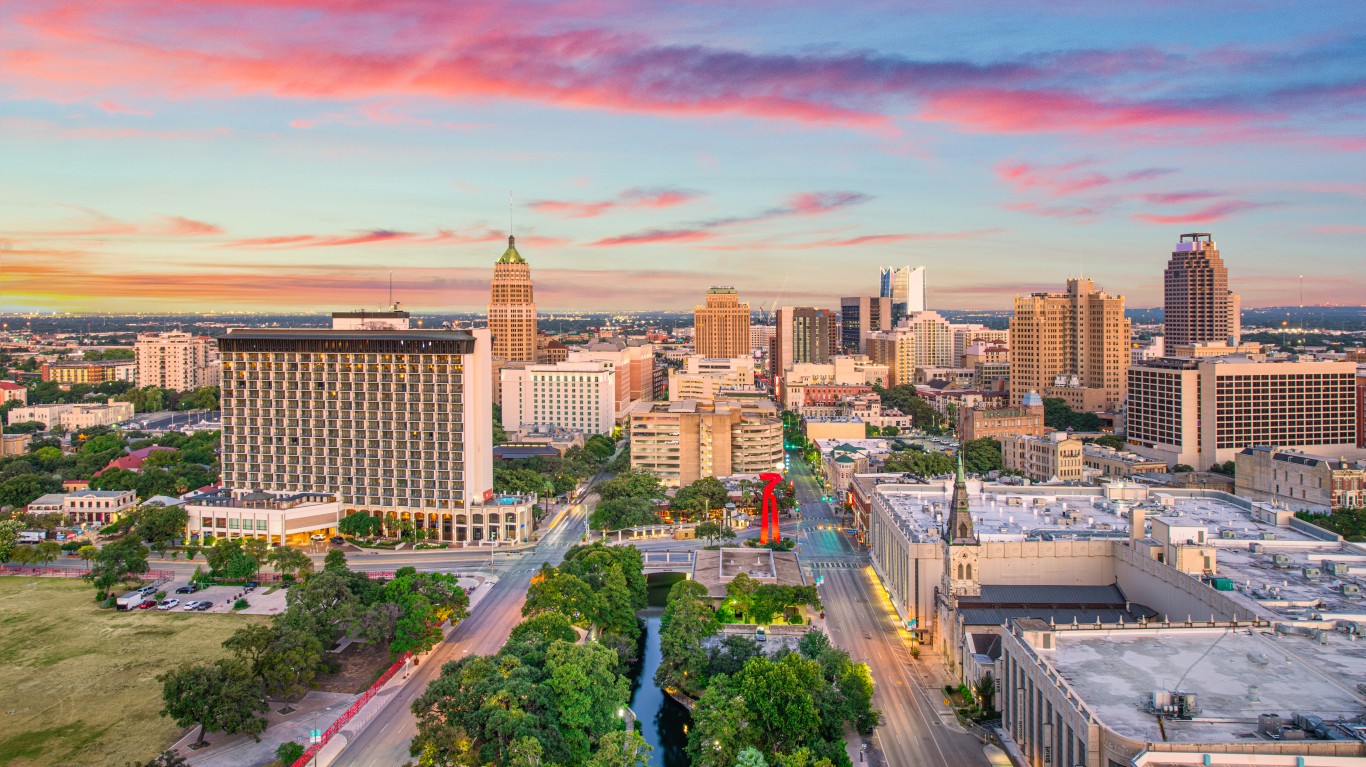
Source: Kruck20 / iStock via Getty Images
- Population change in downtown tracts from 2012 to 2022: -10.6%
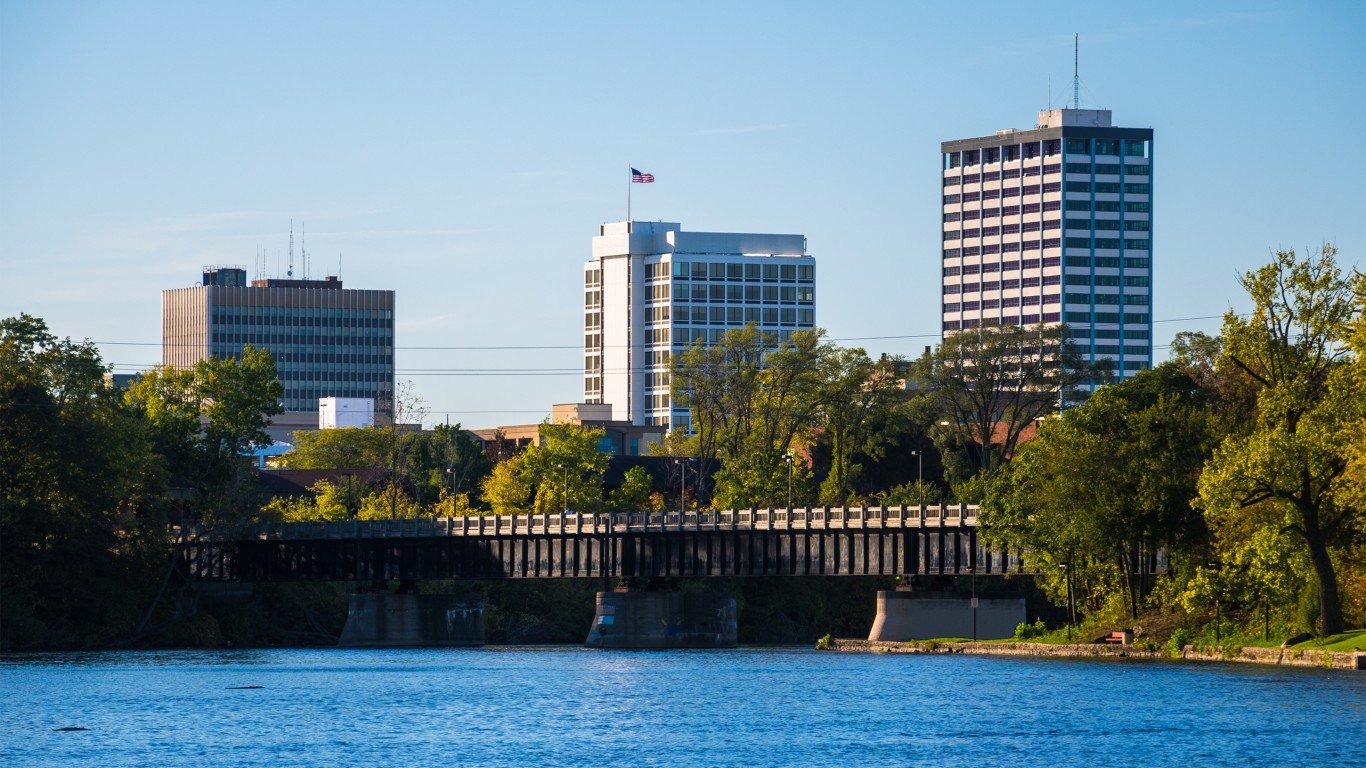
- Population change of non-downtown tracts from 2012 to 2022: +7.5%
- Per capita income chg in downtown tracts from 2012 to 2022: +28.5%
- Per capita income chg in non-downtown tracts from 2012 to 2022: +8.0%
38. St. Joseph, Missouri
Source: Davel5957 / iStock via Getty Images
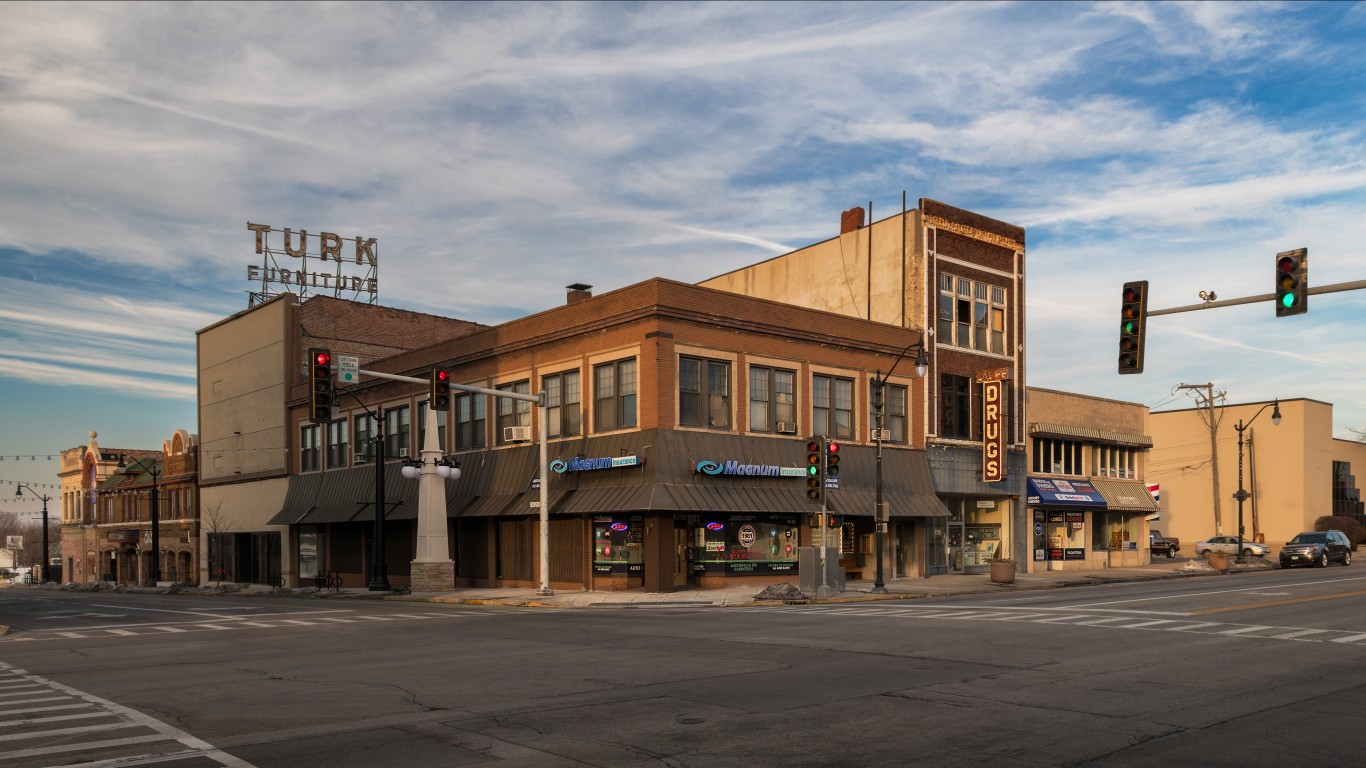
- Population change in downtown tracts from 2012 to 2022: -10.9%
- Population change of non-downtown tracts from 2012 to 2022: -1.7%
- Per capita income chg in downtown tracts from 2012 to 2022: +9.1%
- Per capita income chg in non-downtown tracts from 2012 to 2022: +11.5%
37. Springfield, Illinois

Source: fotoguy22 / iStock via Getty Images
- Population change in downtown tracts from 2012 to 2022: -10.9%
- Population change of non-downtown tracts from 2012 to 2022: -2.0%
- Per capita income chg in downtown tracts from 2012 to 2022: +9.5%
- Per capita income chg in non-downtown tracts from 2012 to 2022: +8.2%
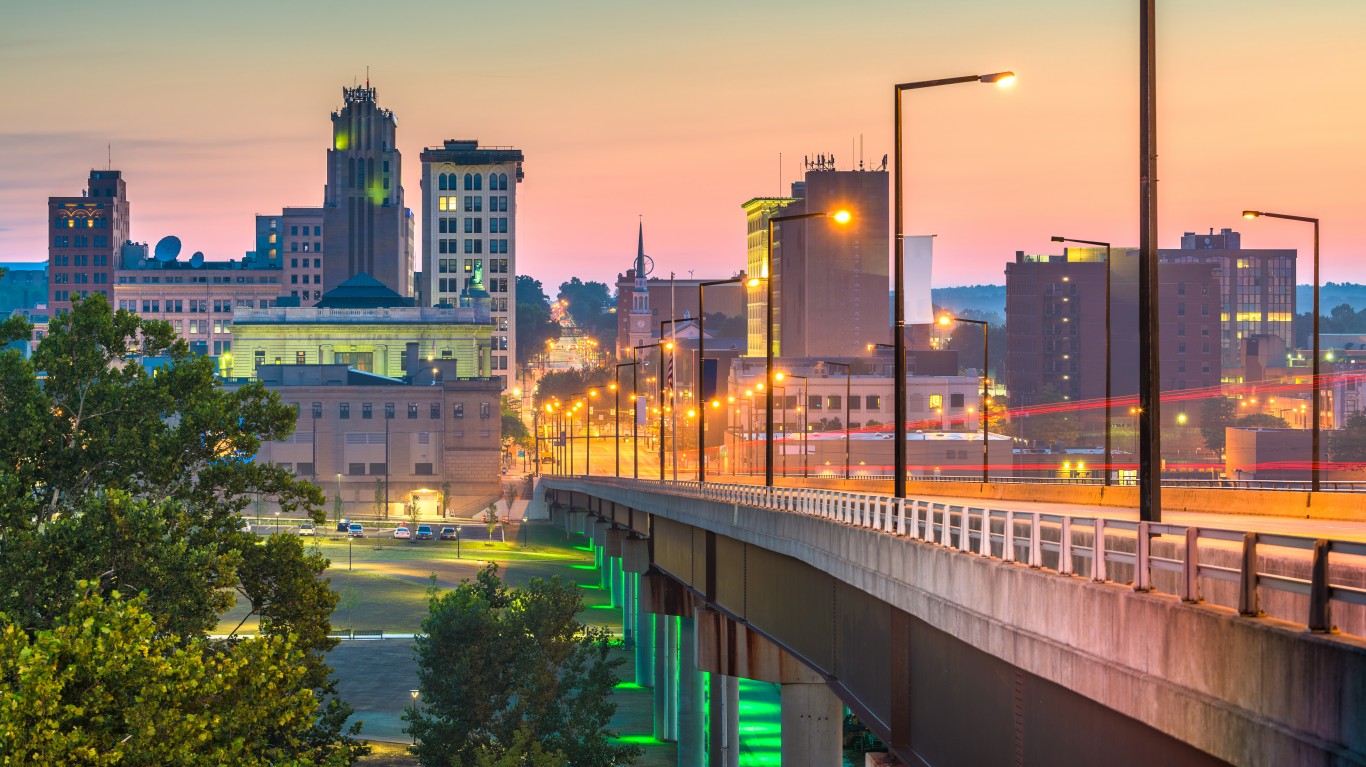
36. Youngstown, Ohio
Source: Sean Pavone / iStock via Getty Images
- Population change in downtown tracts from 2012 to 2022: -11.1%
- Population change of non-downtown tracts from 2012 to 2022: -7.4%
- Per capita income chg in downtown tracts from 2012 to 2022: +21.5%
- Per capita income chg in non-downtown tracts from 2012 to 2022: +2.2%
35. Canton, Ohio

Source: benkrut / iStock via Getty Images
- Population change in downtown tracts from 2012 to 2022: -11.3%
- Population change of non-downtown tracts from 2012 to 2022: -2.8%
- Per capita income chg in downtown tracts from 2012 to 2022: +4.6%
- Per capita income chg in non-downtown tracts from 2012 to 2022: +11.1%
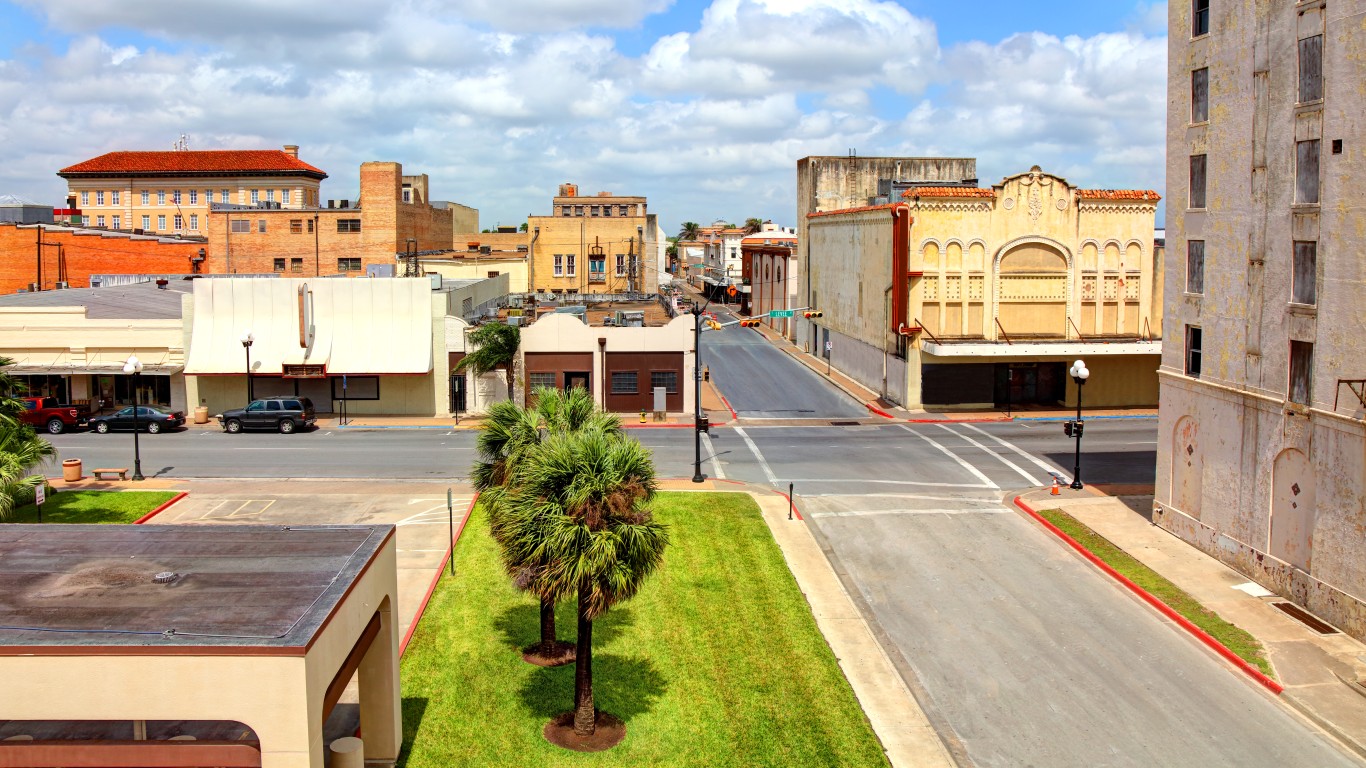
34. Brownsville, Texas
Source: DenisTangneyJr / iStock via Getty Images
- Population change in downtown tracts from 2012 to 2022: -11.5%
- Population change of non-downtown tracts from 2012 to 2022: +0.6%
- Per capita income chg in downtown tracts from 2012 to 2022: +11.5%
- Per capita income chg in non-downtown tracts from 2012 to 2022: +9.8%
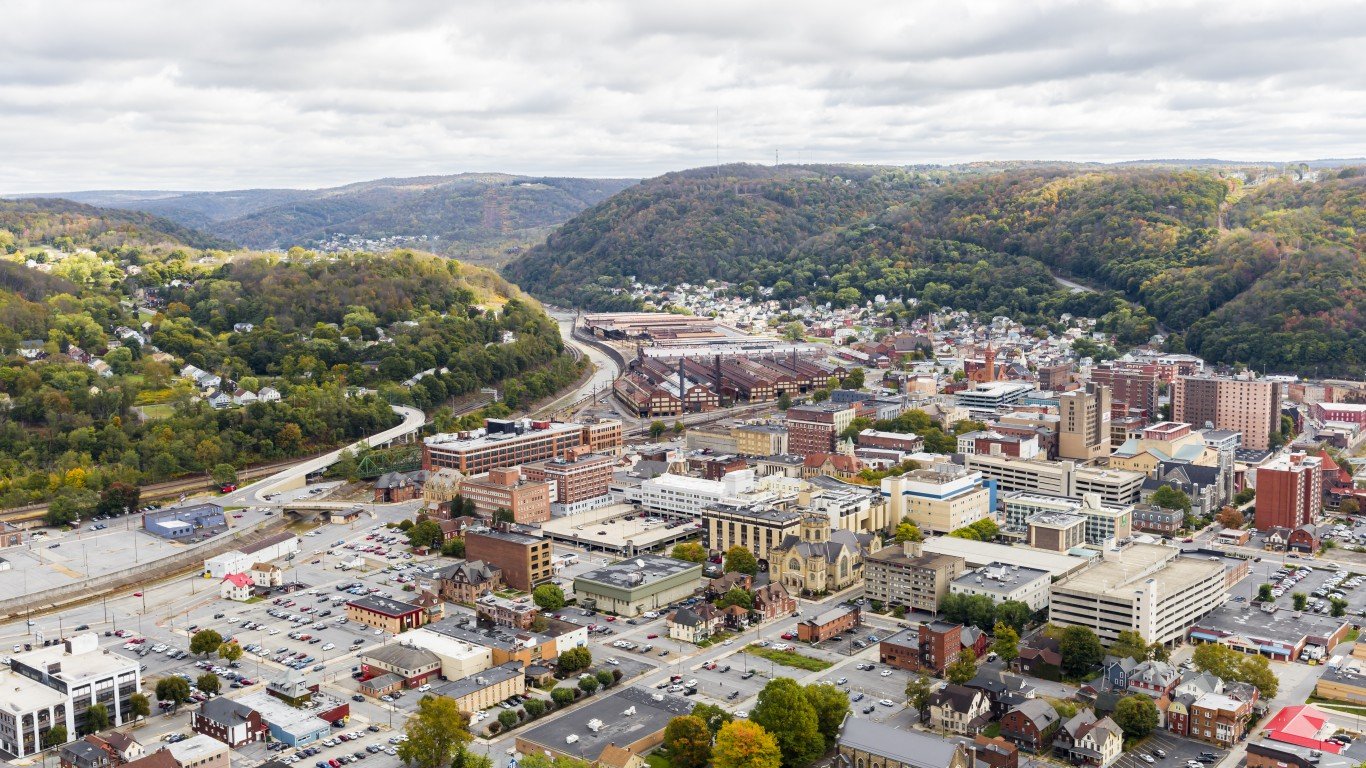
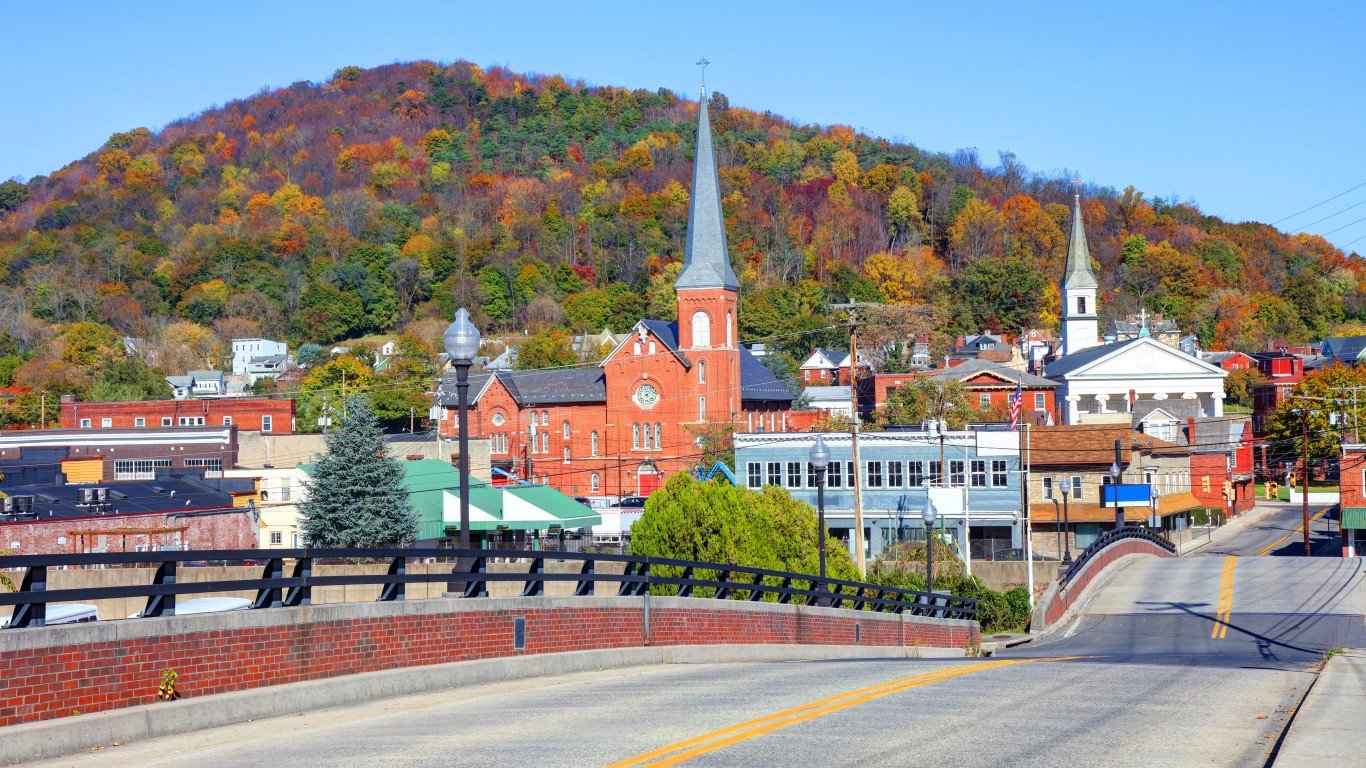
33. Johnstown, Pennsylvania
Source: WilliamSherman / iStock via Getty Images
- Population change in downtown tracts from 2012 to 2022: -11.6%
- Population change of non-downtown tracts from 2012 to 2022: -12.4%
- Per capita income chg in downtown tracts from 2012 to 2022: +23.9%
- Per capita income chg in non-downtown tracts from 2012 to 2022: -1.5%
32. Amarillo, Texas
Source: DenisTangneyJr / iStock via Getty Images
- Population change in downtown tracts from 2012 to 2022: -11.6%
- Population change of non-downtown tracts from 2012 to 2022: +1.8%
- Per capita income chg in downtown tracts from 2012 to 2022: +14.1%
- Per capita income chg in non-downtown tracts from 2012 to 2022: +6.2%
31. Hattiesburg, Mississippi

Source: DenisTangneyJr / iStock via Getty Images
- Population change in downtown tracts from 2012 to 2022: -11.7%
- Population change of non-downtown tracts from 2012 to 2022: +9.2%
- Per capita income chg in downtown tracts from 2012 to 2022: +21.2%
- Per capita income chg in non-downtown tracts from 2012 to 2022: +0.8%
30. Valdosta, Georgia

Source: miroslav_1 / iStock Editorial via Getty Images
- Population change in downtown tracts from 2012 to 2022: -12.6%
- Population change of non-downtown tracts from 2012 to 2022: +4.5%
- Per capita income chg in downtown tracts from 2012 to 2022: +26.0%
- Per capita income chg in non-downtown tracts from 2012 to 2022: +5.0%
29. El Paso, Texas
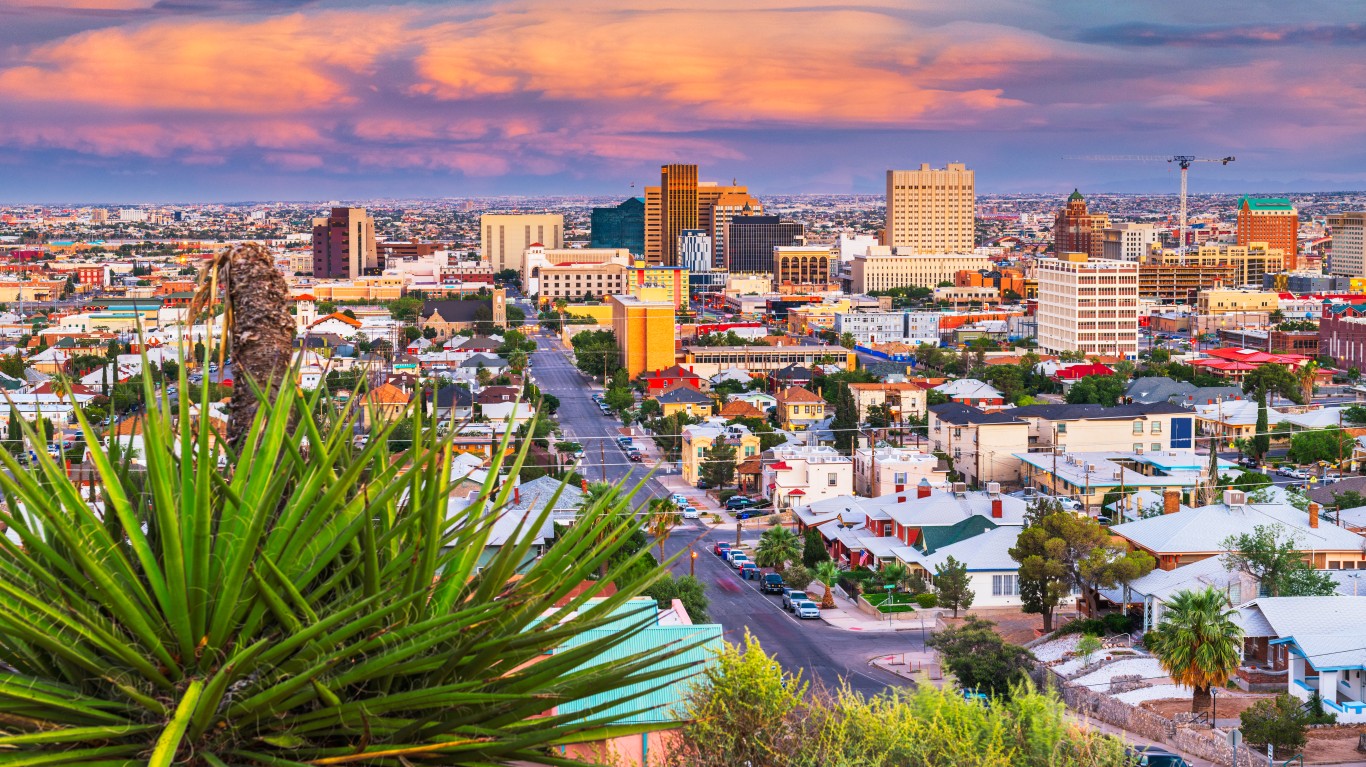
Source: Sean Pavone / iStock via Getty Images
- Population change in downtown tracts from 2012 to 2022: -12.7%
- Population change of non-downtown tracts from 2012 to 2022: -3.2%
- Per capita income chg in downtown tracts from 2012 to 2022: +17.9%
- Per capita income chg in non-downtown tracts from 2012 to 2022: +8.5%
28. Jackson, Mississippi
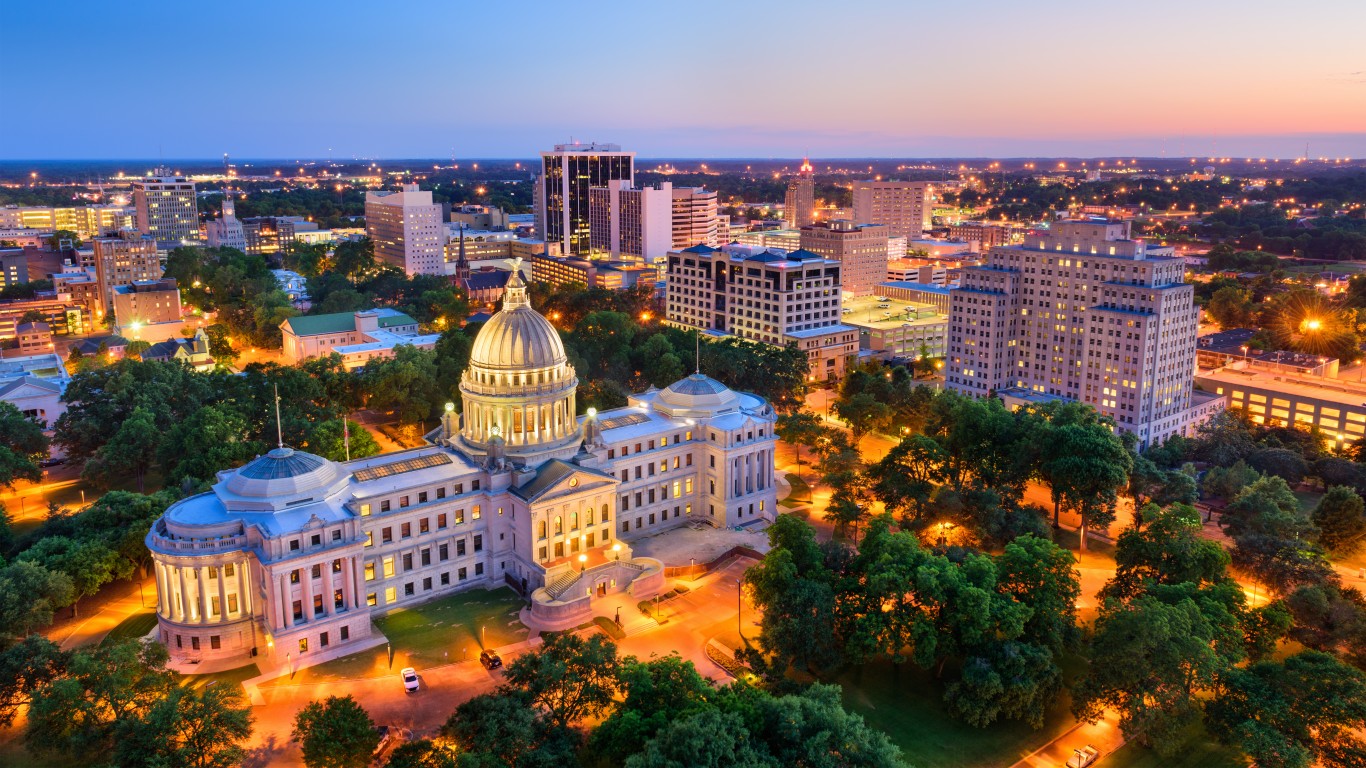
Source: SeanPavonePhoto / iStock via Getty Images
- Population change in downtown tracts from 2012 to 2022: -13.2%
- Population change of non-downtown tracts from 2012 to 2022: -12.6%
- Per capita income chg in downtown tracts from 2012 to 2022: +33.1%
- Per capita income chg in non-downtown tracts from 2012 to 2022: +5.4%
27. Casper, Wyoming
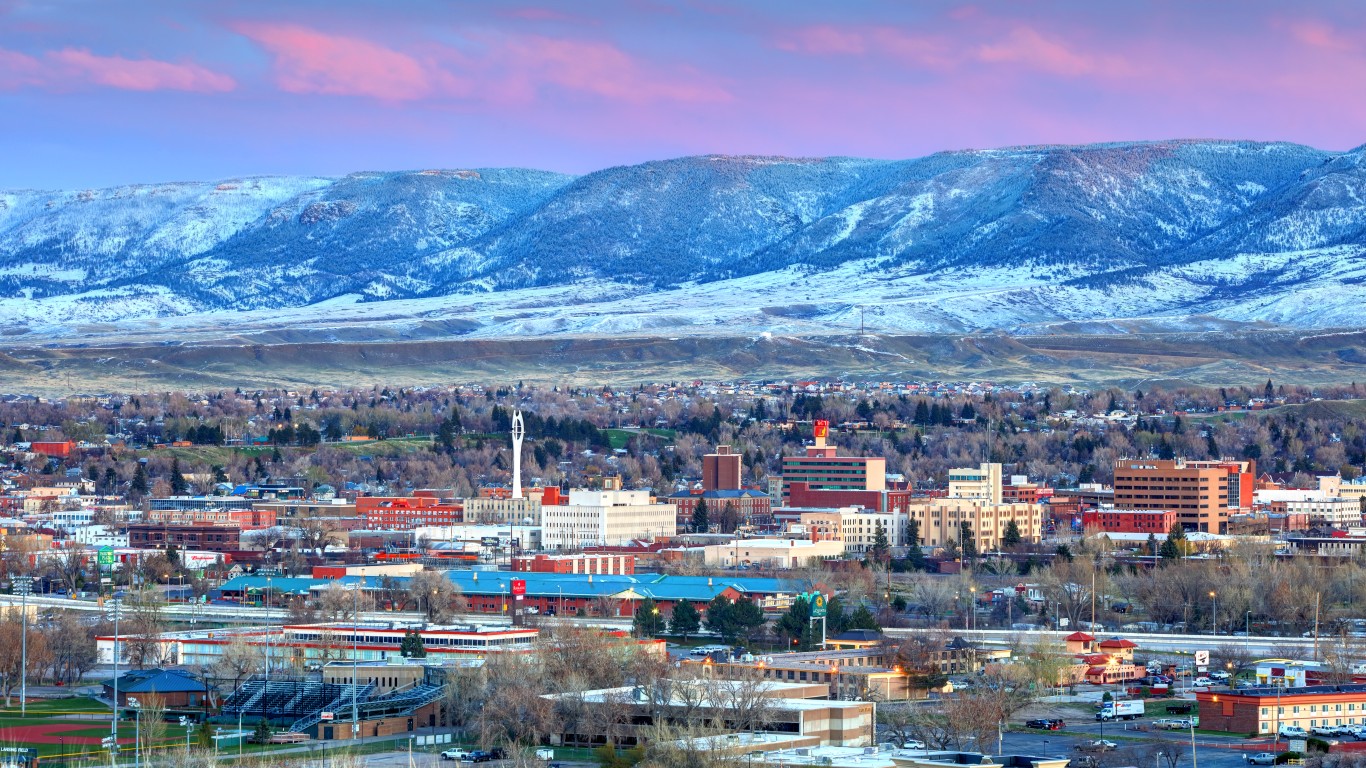
Source: DenisTangneyJr / E+ via Getty Images
- Population change in downtown tracts from 2012 to 2022: -13.2%
- Population change of non-downtown tracts from 2012 to 2022: +1.5%
- Per capita income chg in downtown tracts from 2012 to 2022: +11.6%
- Per capita income chg in non-downtown tracts from 2012 to 2022: -3.6%
26. Gadsden, Alabama
Source: Carol M. Highsmith / Wikimedia Commons
- Population change in downtown tracts from 2012 to 2022: -13.3%
- Population change of non-downtown tracts from 2012 to 2022: -6.4%
- Per capita income chg in downtown tracts from 2012 to 2022: +5.2%
- Per capita income chg in non-downtown tracts from 2012 to 2022: +7.4%
25. Abilene, Texas
Source: DenisTangneyJr / iStock via Getty Images
- Population change in downtown tracts from 2012 to 2022: -13.3%
- Population change of non-downtown tracts from 2012 to 2022: +3.3%
- Per capita income chg in downtown tracts from 2012 to 2022: +4.8%
- Per capita income chg in non-downtown tracts from 2012 to 2022: +7.5%
24. Cumberland, Maryland
Source: DenisTangneyJr / iStock via Getty Images
- Population change in downtown tracts from 2012 to 2022: -13.4%
- Population change of non-downtown tracts from 2012 to 2022: -7.4%
- Per capita income chg in downtown tracts from 2012 to 2022: +5.1%
- Per capita income chg in non-downtown tracts from 2012 to 2022: +14.8%
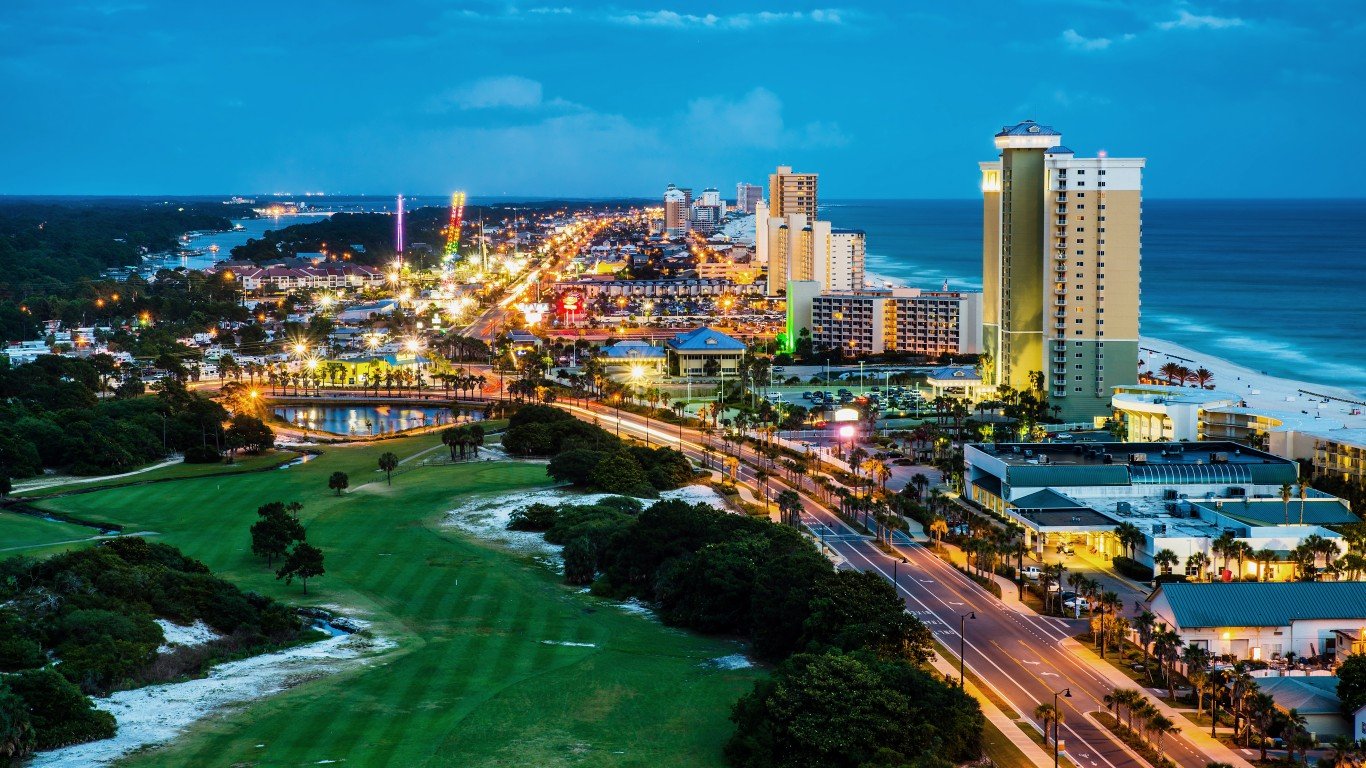
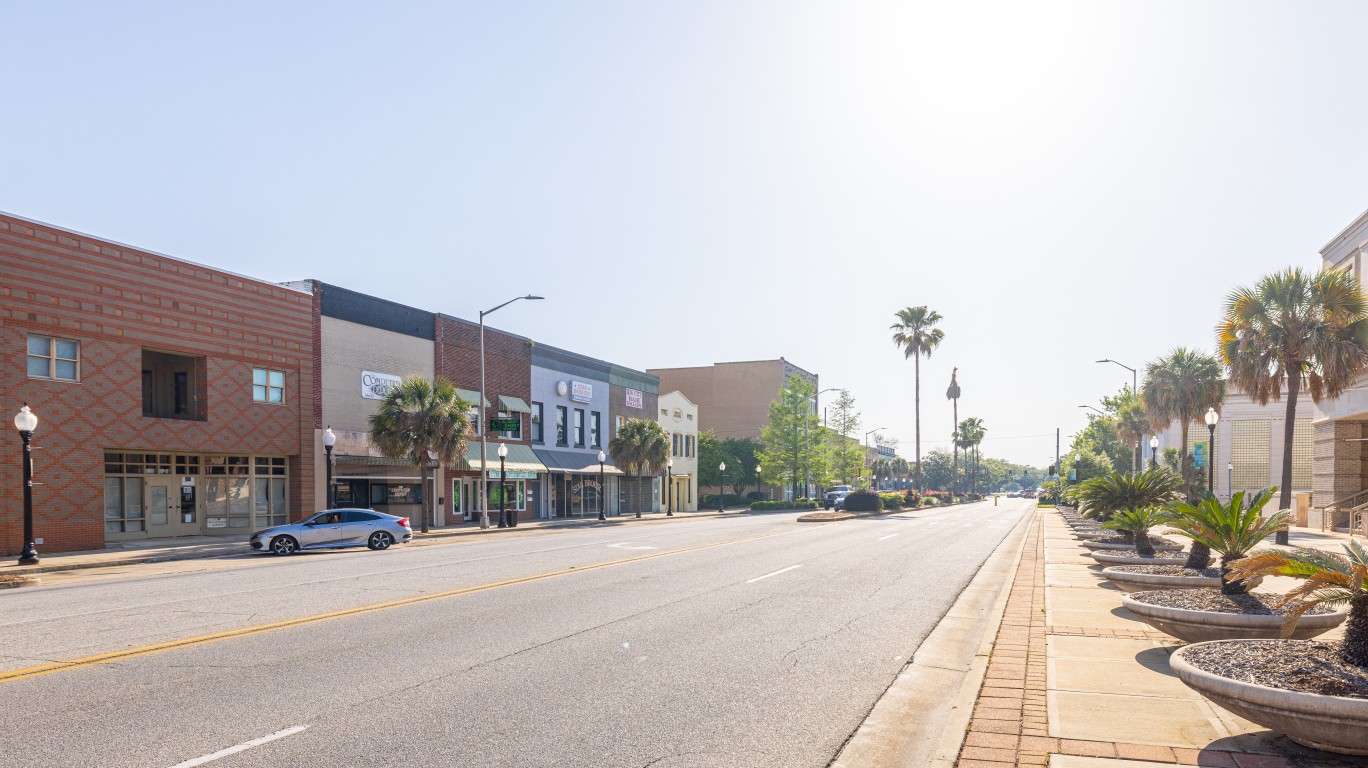
23. Panama City, Florida
Source: RobHainer / iStock via Getty Images
- Population change in downtown tracts from 2012 to 2022: -13.8%
- Population change of non-downtown tracts from 2012 to 2022: -7.9%
- Per capita income chg in downtown tracts from 2012 to 2022: +20.6%
- Per capita income chg in non-downtown tracts from 2012 to 2022: +17.1%
22. Decatur, Illinois

Source: Westhoff / E+ via Getty Images
- Population change in downtown tracts from 2012 to 2022: -14.7%
- Population change of non-downtown tracts from 2012 to 2022: -7.4%
- Per capita income chg in downtown tracts from 2012 to 2022: +9.4%
- Per capita income chg in non-downtown tracts from 2012 to 2022: +6.2%
21. Kankakee, Illinois
Source: gnagel / iStock Editorial via Getty Images
- Population change in downtown tracts from 2012 to 2022: -14.9%
- Population change of non-downtown tracts from 2012 to 2022: +3.6%
- Per capita income chg in downtown tracts from 2012 to 2022: +19.4%
- Per capita income chg in non-downtown tracts from 2012 to 2022: +2.7%
20. Naples, Florida

Source: Sean Pavone / iStock via Getty Images
- Population change in downtown tracts from 2012 to 2022: -15.0%
- Population change of non-downtown tracts from 2012 to 2022: +3.3%
- Per capita income chg in downtown tracts from 2012 to 2022: +31.1%
- Per capita income chg in non-downtown tracts from 2012 to 2022: +29.3%
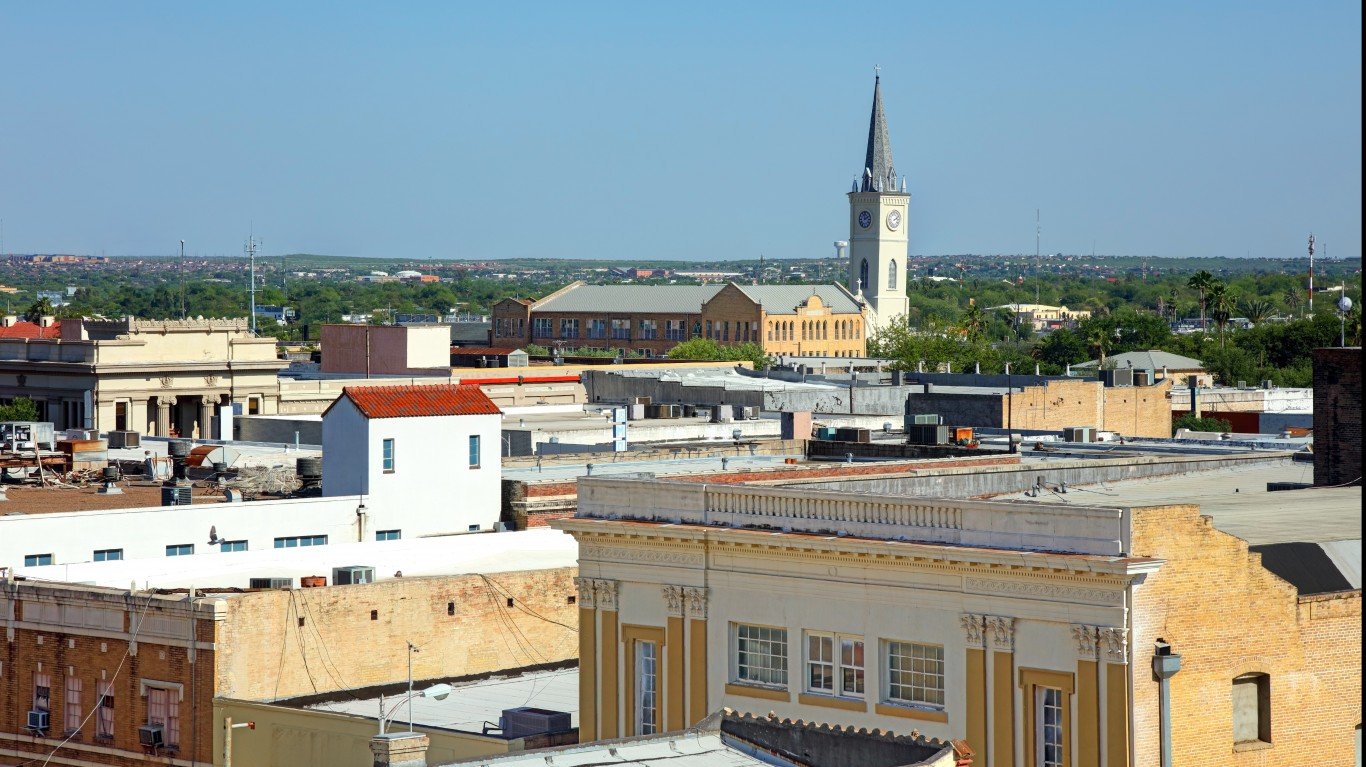
19. Laredo, Texas
Source: DenisTangneyJr / iStock via Getty Images
- Population change in downtown tracts from 2012 to 2022: -15.4%
- Population change of non-downtown tracts from 2012 to 2022: +5.4%
- Per capita income chg in downtown tracts from 2012 to 2022: +27.8%
- Per capita income chg in non-downtown tracts from 2012 to 2022: +22.2%
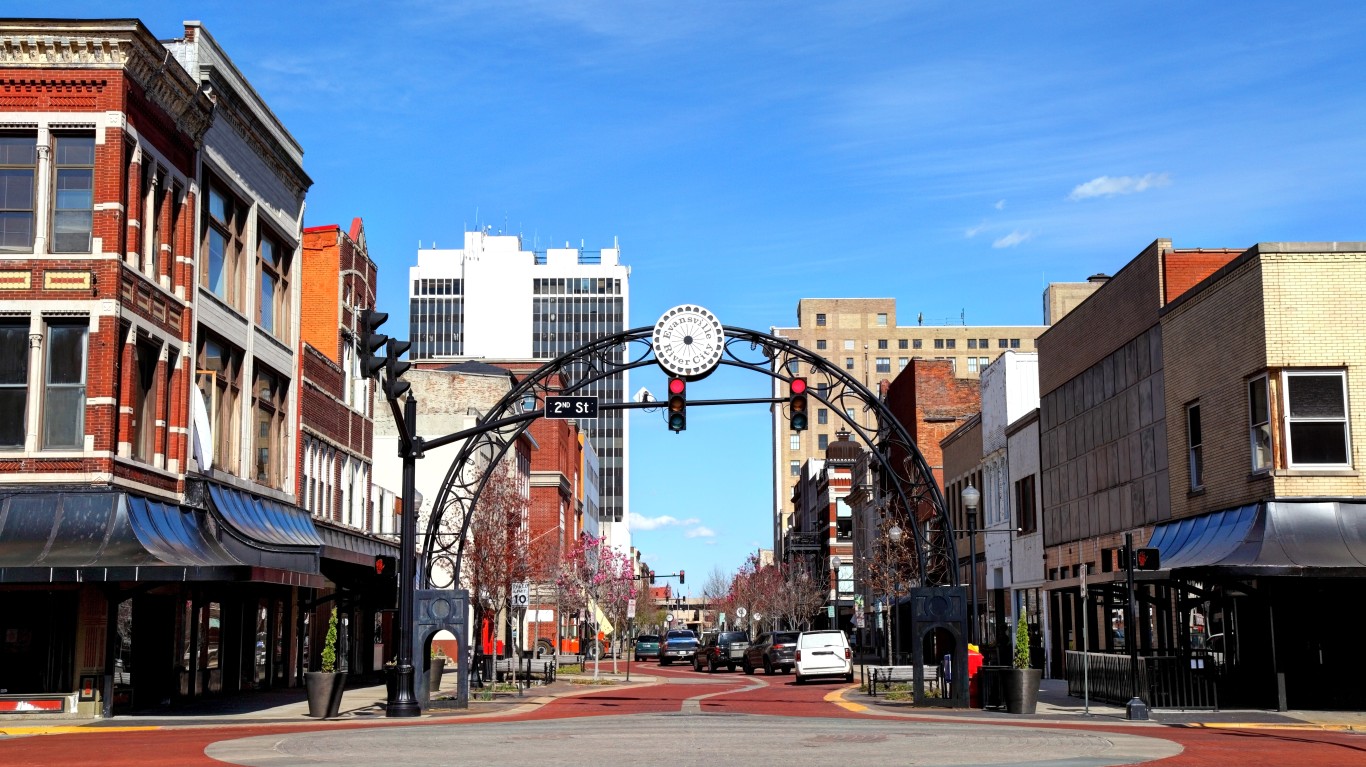
18. Evansville, Indiana
Source: DenisTangneyJr / iStock via Getty Images
- Population change in downtown tracts from 2012 to 2022: -15.6%
- Population change of non-downtown tracts from 2012 to 2022: +0.2%
- Per capita income chg in downtown tracts from 2012 to 2022: +10.5%
- Per capita income chg in non-downtown tracts from 2012 to 2022: +8.6%
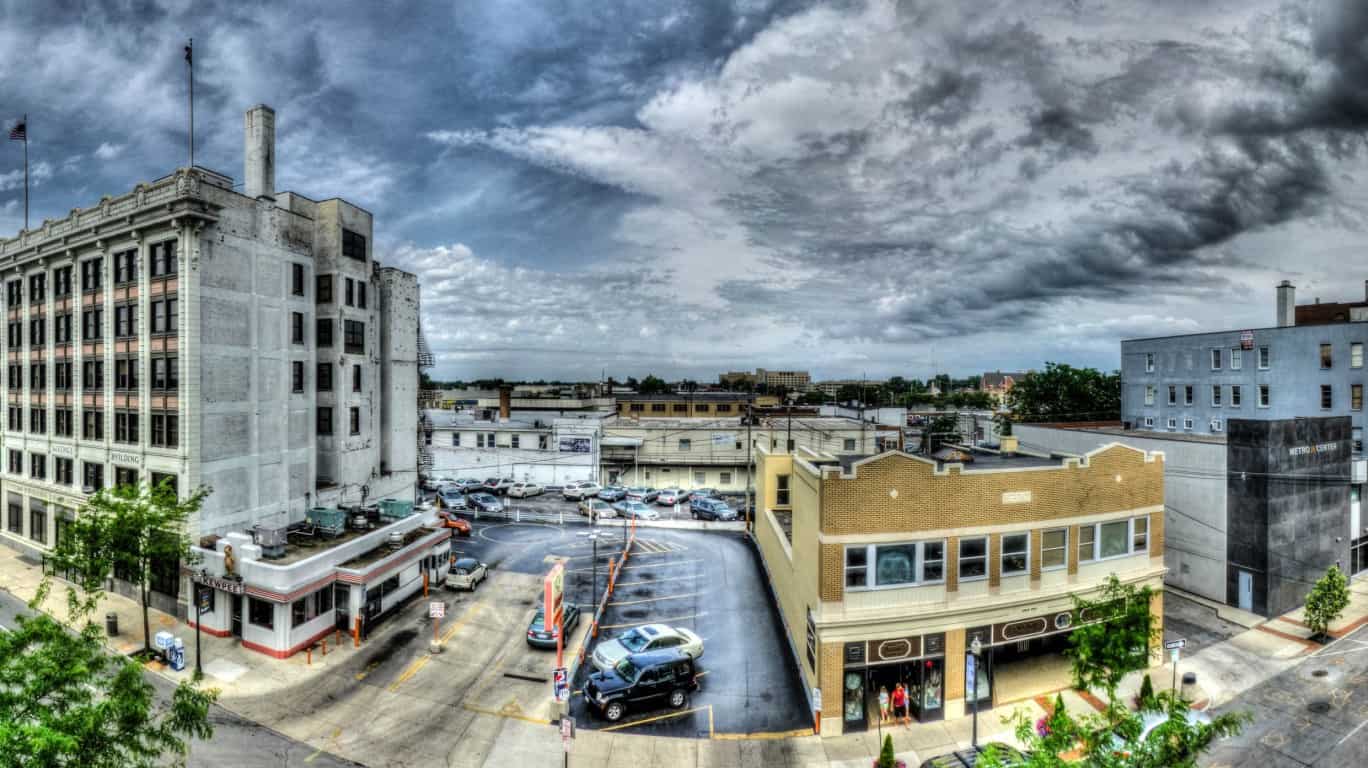
17. Lima, Ohio
Source: wclaphotography / Flickr
- Population change in downtown tracts from 2012 to 2022: -16.0%
- Population change of non-downtown tracts from 2012 to 2022: +8.3%
- Per capita income chg in downtown tracts from 2012 to 2022: +17.7%
- Per capita income chg in non-downtown tracts from 2012 to 2022: -1.3%
16. Flint, Michigan
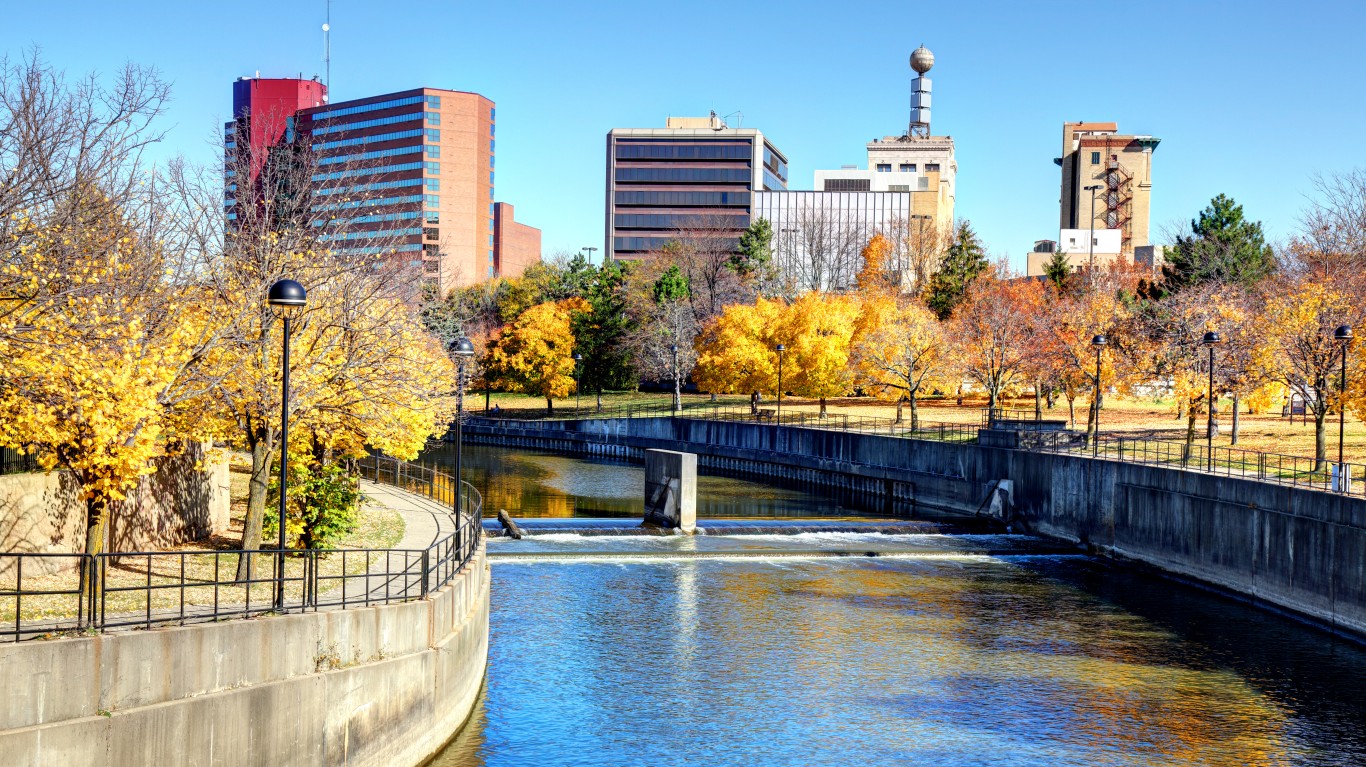
Source: DenisTangneyJr / iStock via Getty Images
- Population change in downtown tracts from 2012 to 2022: -16.9%
- Population change of non-downtown tracts from 2012 to 2022: -22.0%
- Per capita income chg in downtown tracts from 2012 to 2022: +19.1%
- Per capita income chg in non-downtown tracts from 2012 to 2022: +7.1%
15. Yuma, Arizona
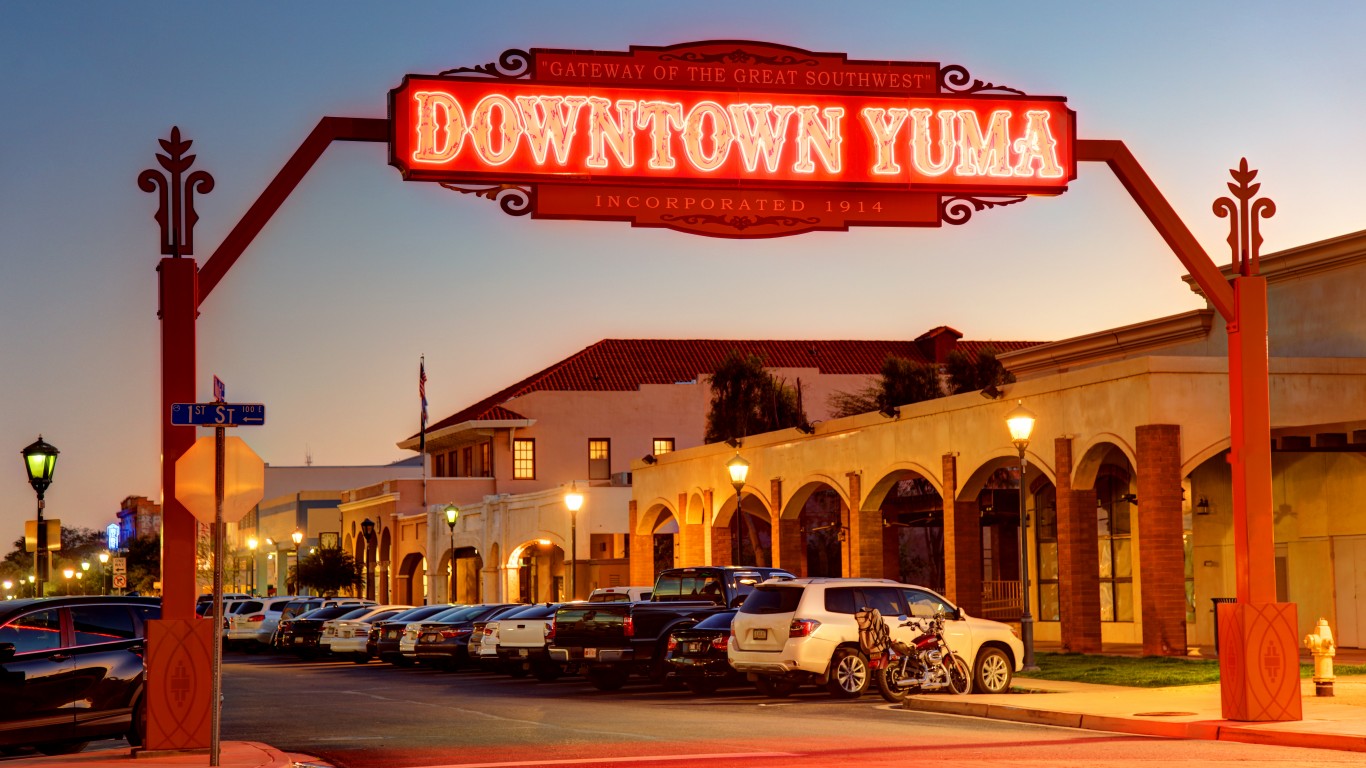
Source: DenisTangneyJr / iStock via Getty Images
- Population change in downtown tracts from 2012 to 2022: -17.0%
- Population change of non-downtown tracts from 2012 to 2022: -5.4%
- Per capita income chg in downtown tracts from 2012 to 2022: +23.6%
- Per capita income chg in non-downtown tracts from 2012 to 2022: +19.6%
14. Bangor, Maine
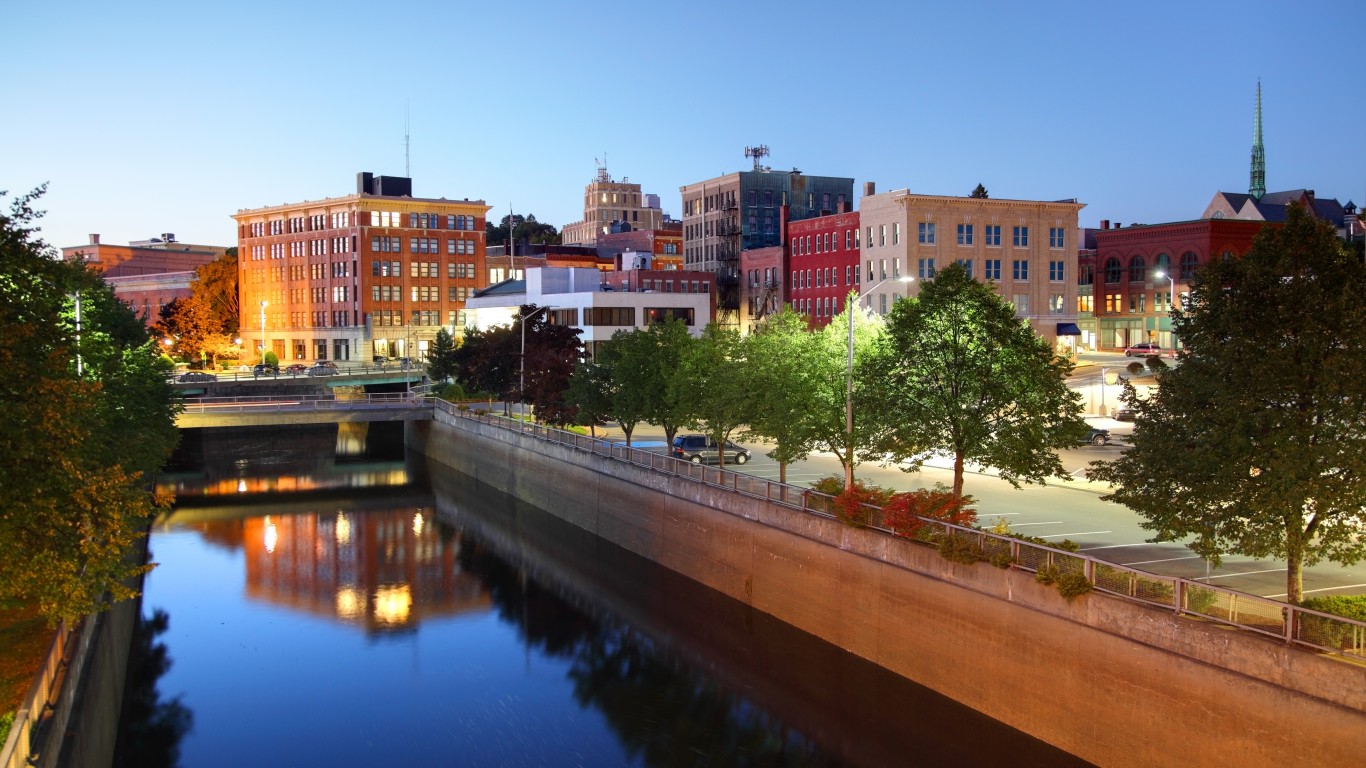
Source: DenisTangneyJr / iStock via Getty Images
- Population change in downtown tracts from 2012 to 2022: -17.2%
- Population change of non-downtown tracts from 2012 to 2022: +4.4%
- Per capita income chg in downtown tracts from 2012 to 2022: +25.7%
- Per capita income chg in non-downtown tracts from 2012 to 2022: +16.7%
13. Victoria, Texas
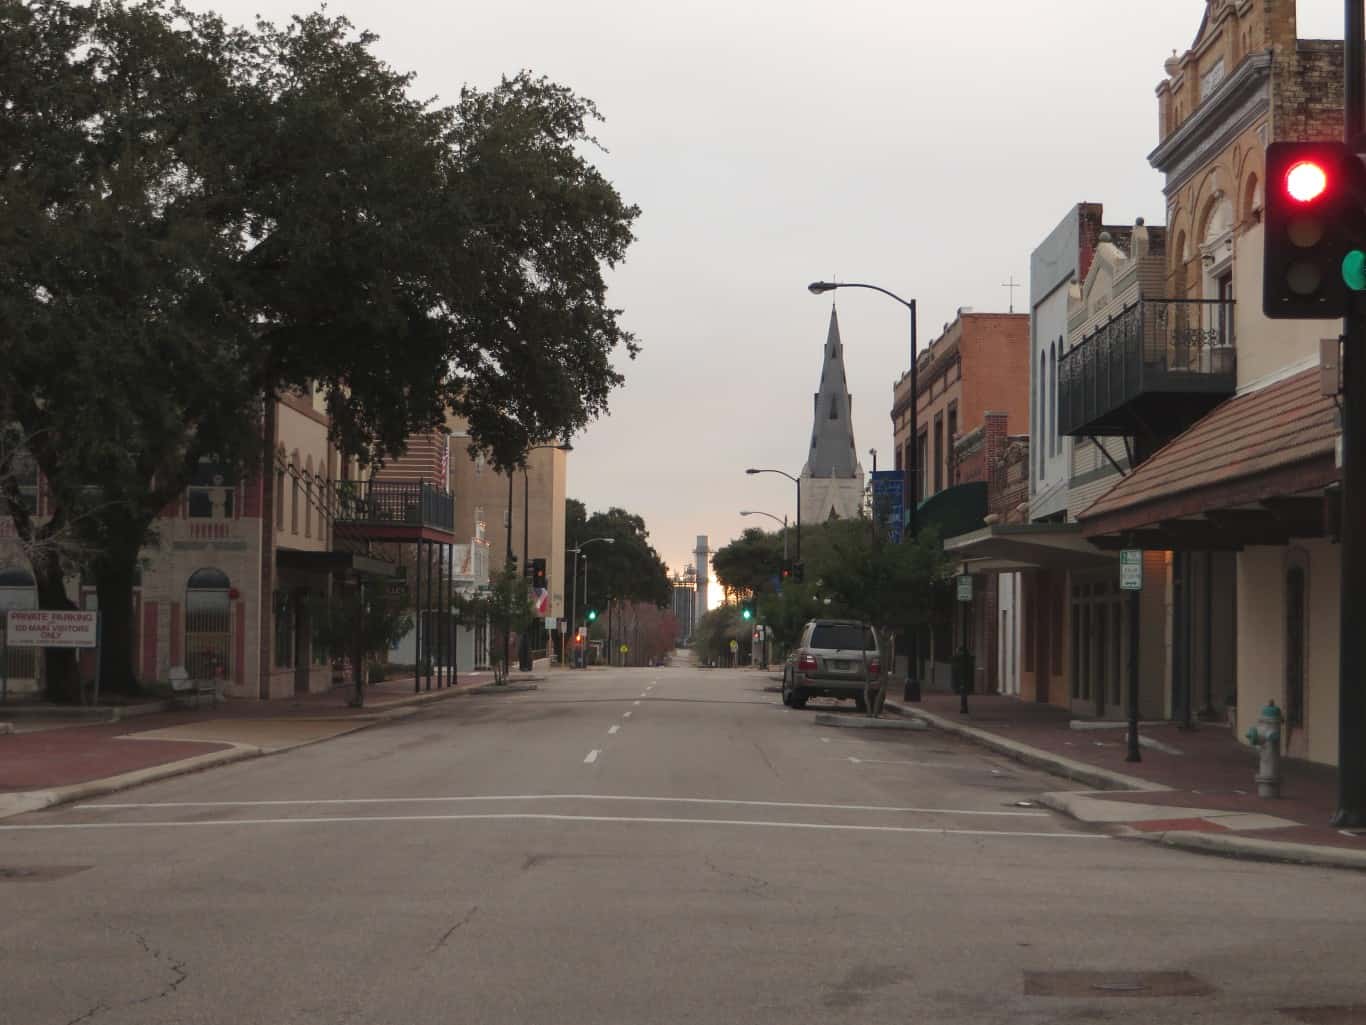
Source: kenlund / Flickr
- Population change in downtown tracts from 2012 to 2022: -17.8%
- Population change of non-downtown tracts from 2012 to 2022: +5.7%
- Per capita income chg in downtown tracts from 2012 to 2022: -6.3%
- Per capita income chg in non-downtown tracts from 2012 to 2022: +2.1%
12. Topeka, Kansas
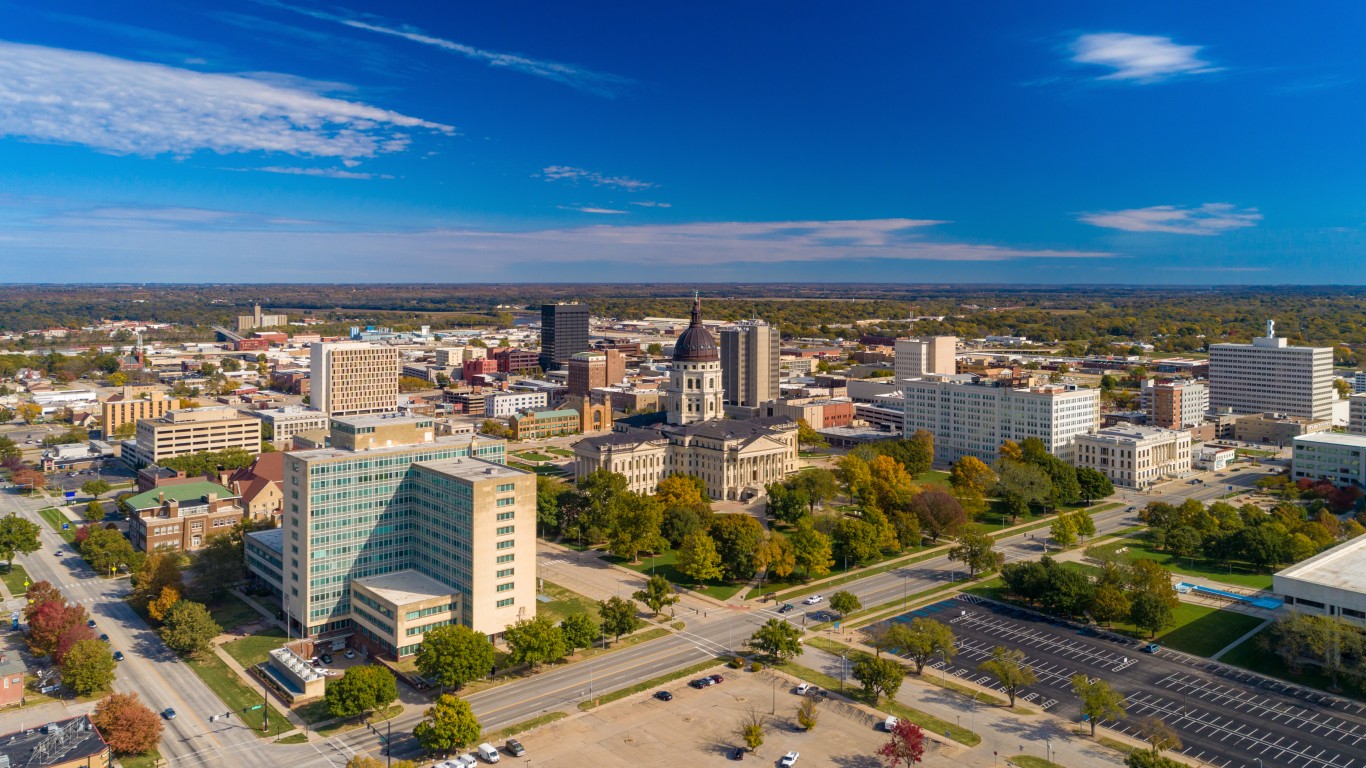
Source: Davel5957 / E+ via Getty Images
- Population change in downtown tracts from 2012 to 2022: -18.4%
- Population change of non-downtown tracts from 2012 to 2022: +3.2%
- Per capita income chg in downtown tracts from 2012 to 2022: +33.2%
- Per capita income chg in non-downtown tracts from 2012 to 2022: +5.0%
11. Savannah, Georgia
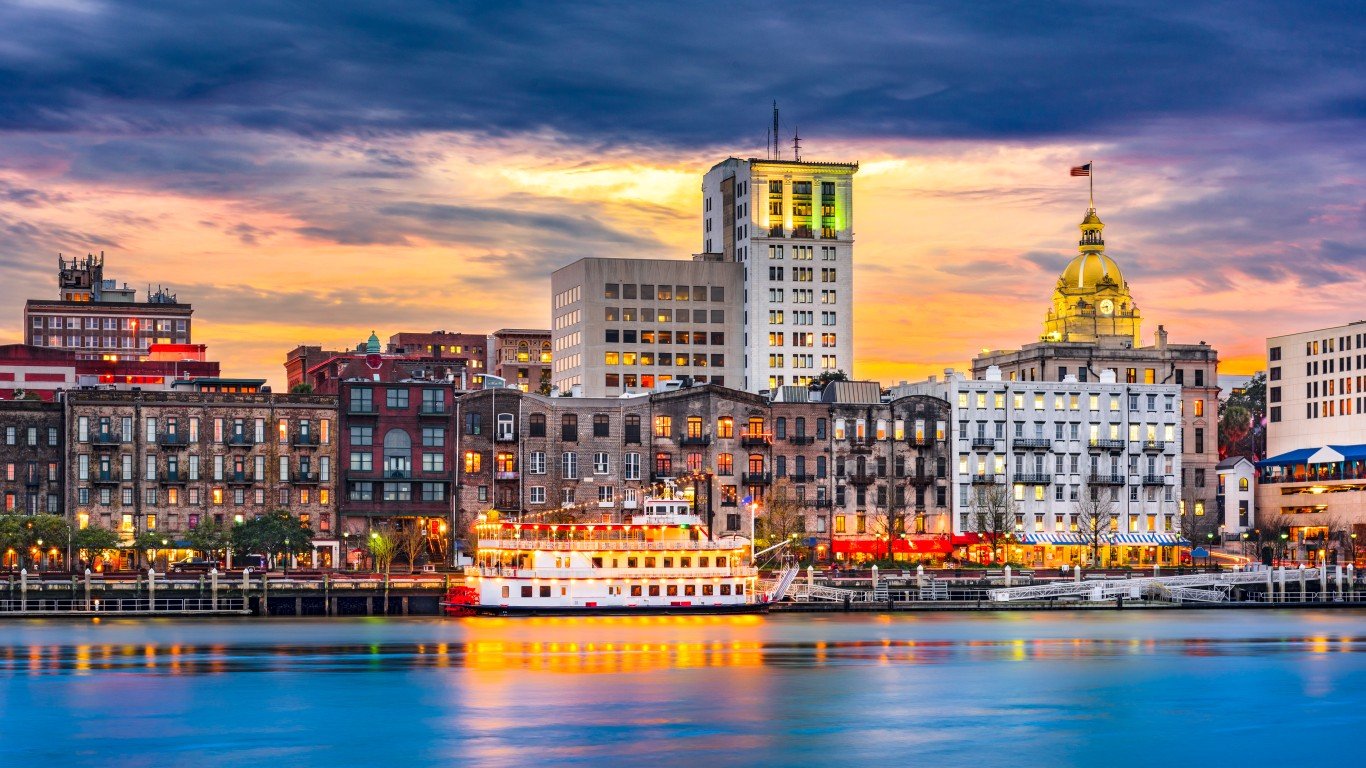
Source: SeanPavonePhoto / iStock via Getty Images
- Population change in downtown tracts from 2012 to 2022: -18.4%
- Population change of non-downtown tracts from 2012 to 2022: +1.8%
- Per capita income chg in downtown tracts from 2012 to 2022: +76.9%
- Per capita income chg in non-downtown tracts from 2012 to 2022: +15.2%
10. Texarkana, Texas
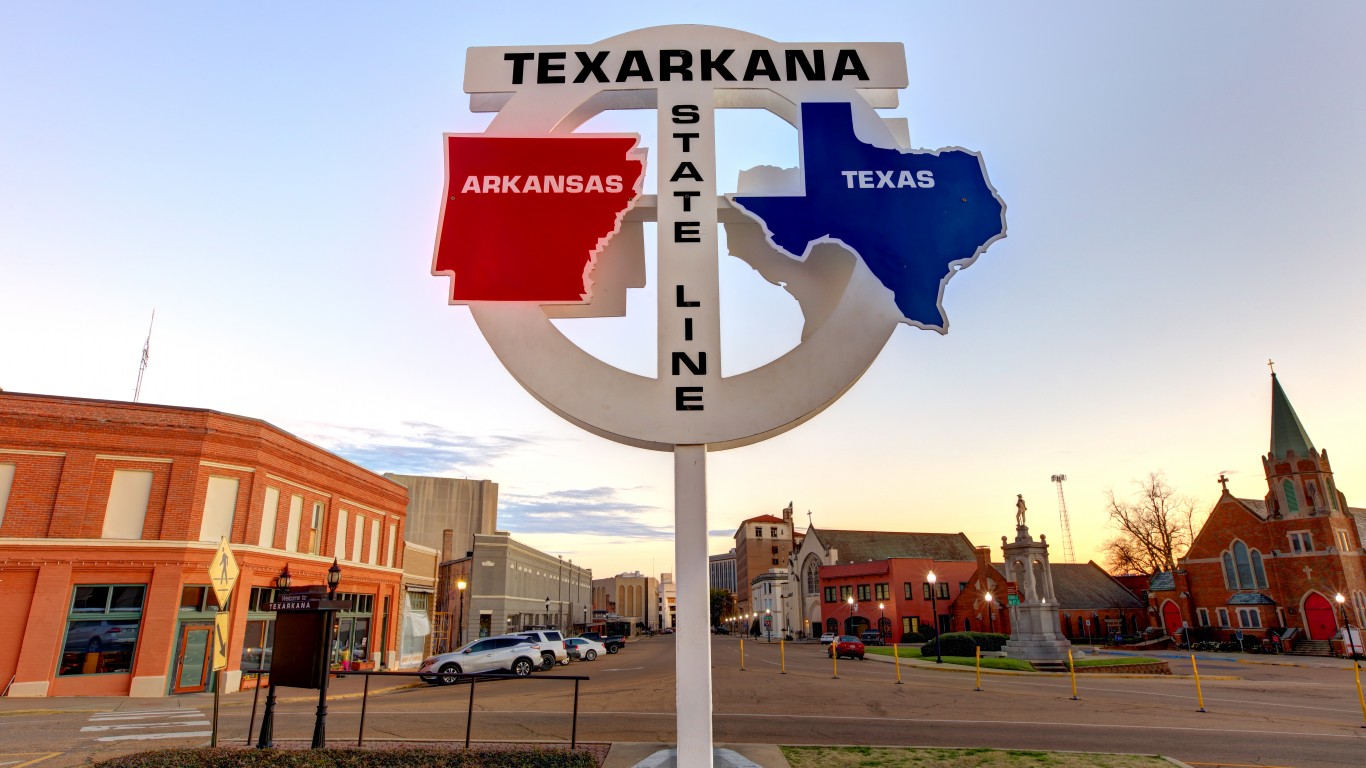
Source: DenisTangneyJr / iStock via Getty Images
- Population change in downtown tracts from 2012 to 2022: -19.9%
- Population change of non-downtown tracts from 2012 to 2022: -2.2%
- Per capita income chg in downtown tracts from 2012 to 2022: +28.7%
- Per capita income chg in non-downtown tracts from 2012 to 2022: +1.3%
9. Saginaw, Michigan
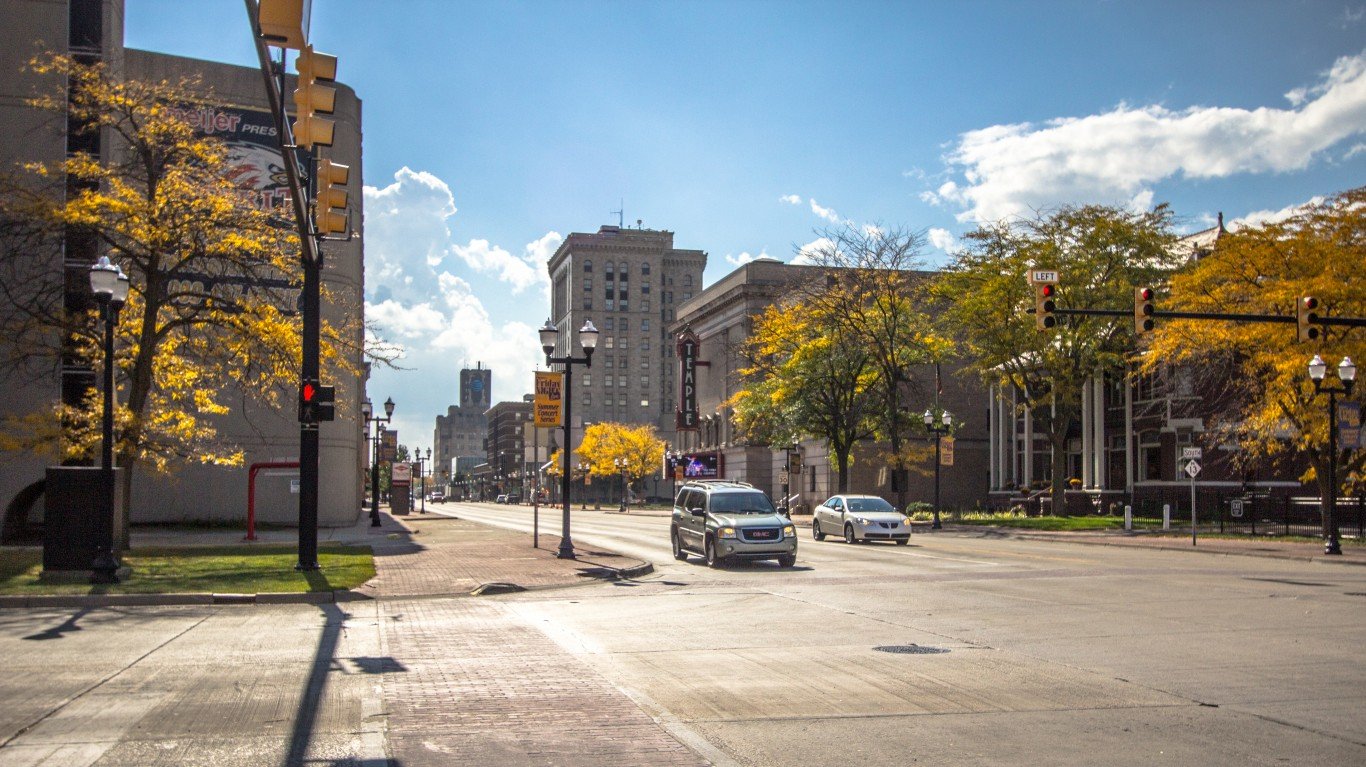
Source: ehrlif / iStock Editorial via Getty Images
- Population change in downtown tracts from 2012 to 2022: -20.2%
- Population change of non-downtown tracts from 2012 to 2022: -11.8%
- Per capita income chg in downtown tracts from 2012 to 2022: +26.4%
- Per capita income chg in non-downtown tracts from 2012 to 2022: -0.6%
8. Sumter, South Carolina

Source: ovidiuhrubaru / iStock via Getty Images
- Population change in downtown tracts from 2012 to 2022: -21.0%
- Population change of non-downtown tracts from 2012 to 2022: +9.6%
- Per capita income chg in downtown tracts from 2012 to 2022: -7.5%
- Per capita income chg in non-downtown tracts from 2012 to 2022: -9.5%
7. Shreveport, Louisiana
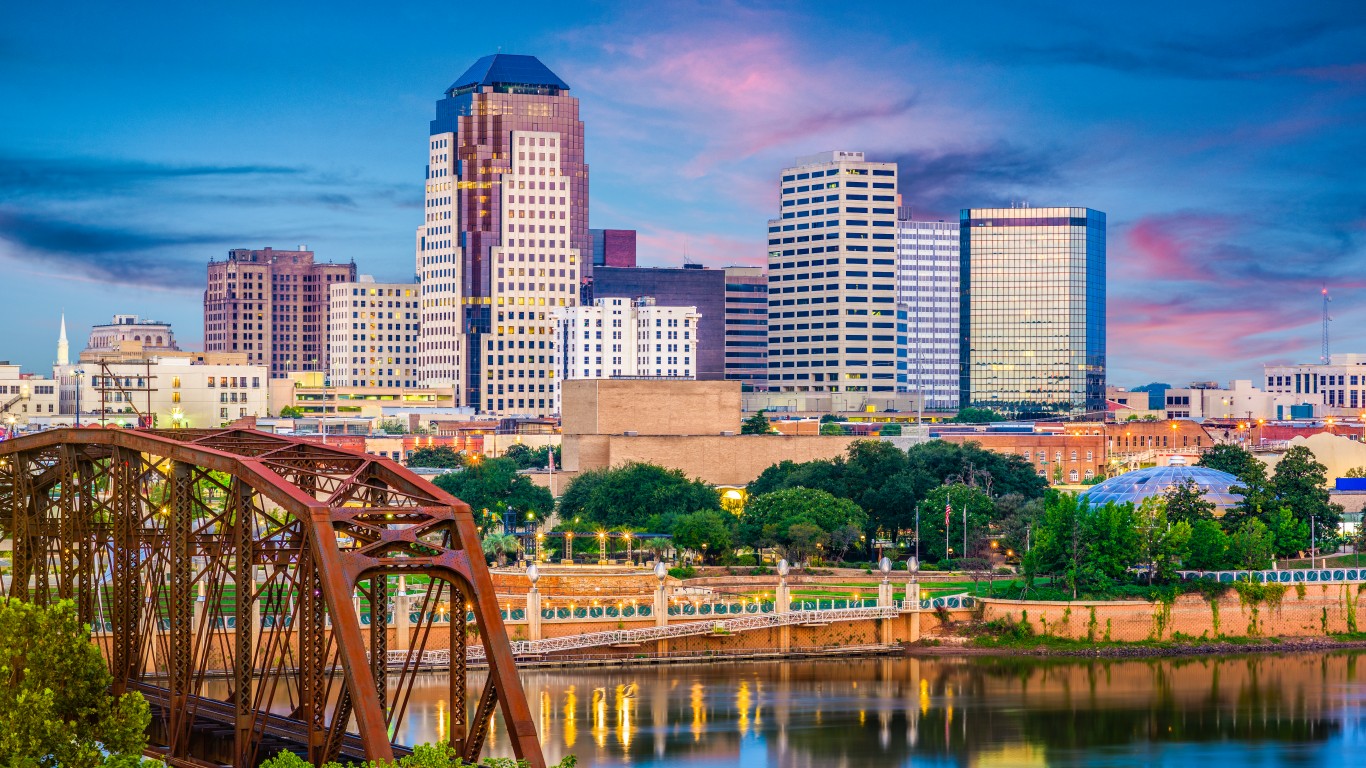
Source: Sean Pavone / iStock via Getty Images
- Population change in downtown tracts from 2012 to 2022: -21.0%
- Population change of non-downtown tracts from 2012 to 2022: -8.9%
- Per capita income chg in downtown tracts from 2012 to 2022: +92.2%
- Per capita income chg in non-downtown tracts from 2012 to 2022: -1.2%
6. Alexandria, Louisiana
Source: DenisTangneyJr / iStock via Getty Images
- Population change in downtown tracts from 2012 to 2022: -21.3%
- Population change of non-downtown tracts from 2012 to 2022: -1.0%
- Per capita income chg in downtown tracts from 2012 to 2022: +29.3%
- Per capita income chg in non-downtown tracts from 2012 to 2022: -10.3%
5. Anniston, Alabama
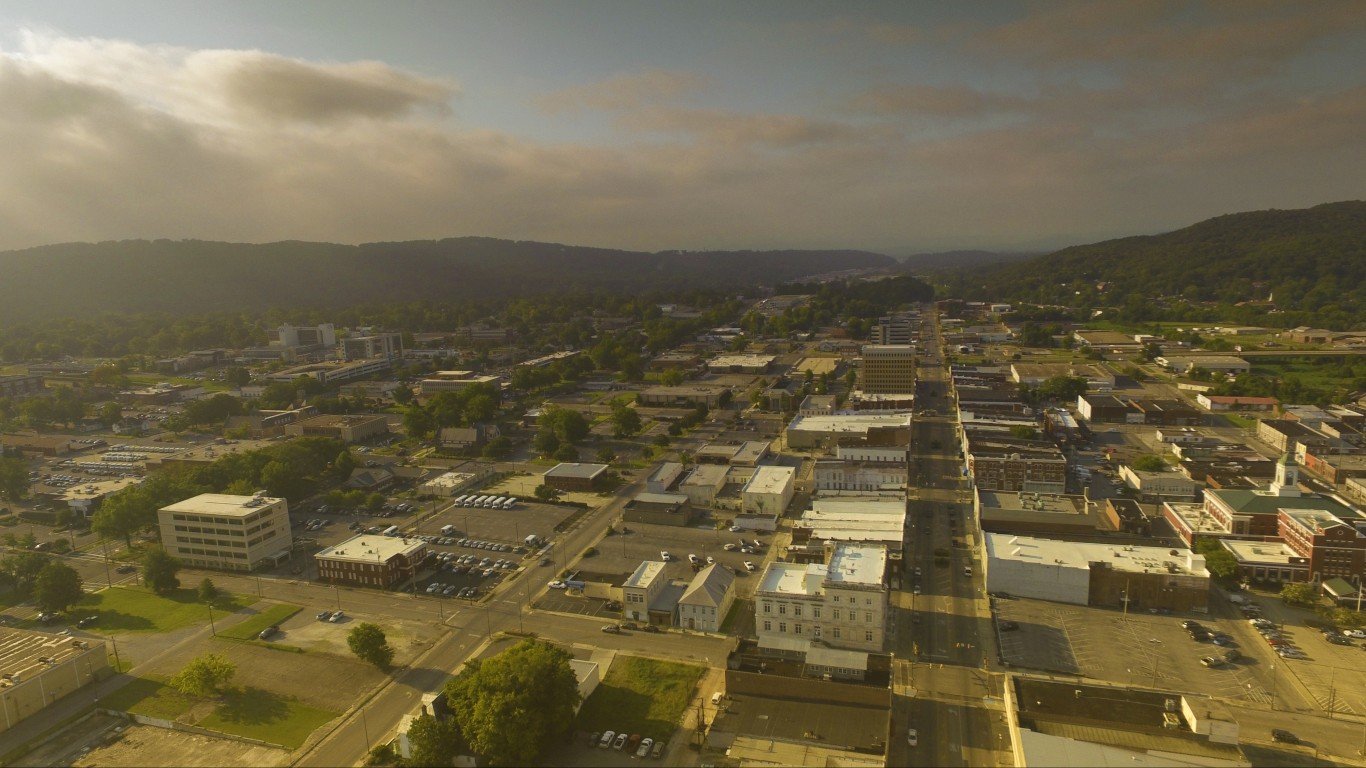
Source: jjneff / iStock via Getty Images
- Population change in downtown tracts from 2012 to 2022: -22.2%
- Population change of non-downtown tracts from 2012 to 2022: +5.9%
- Per capita income chg in downtown tracts from 2012 to 2022: +10.5%
- Per capita income chg in non-downtown tracts from 2012 to 2022: +4.9%
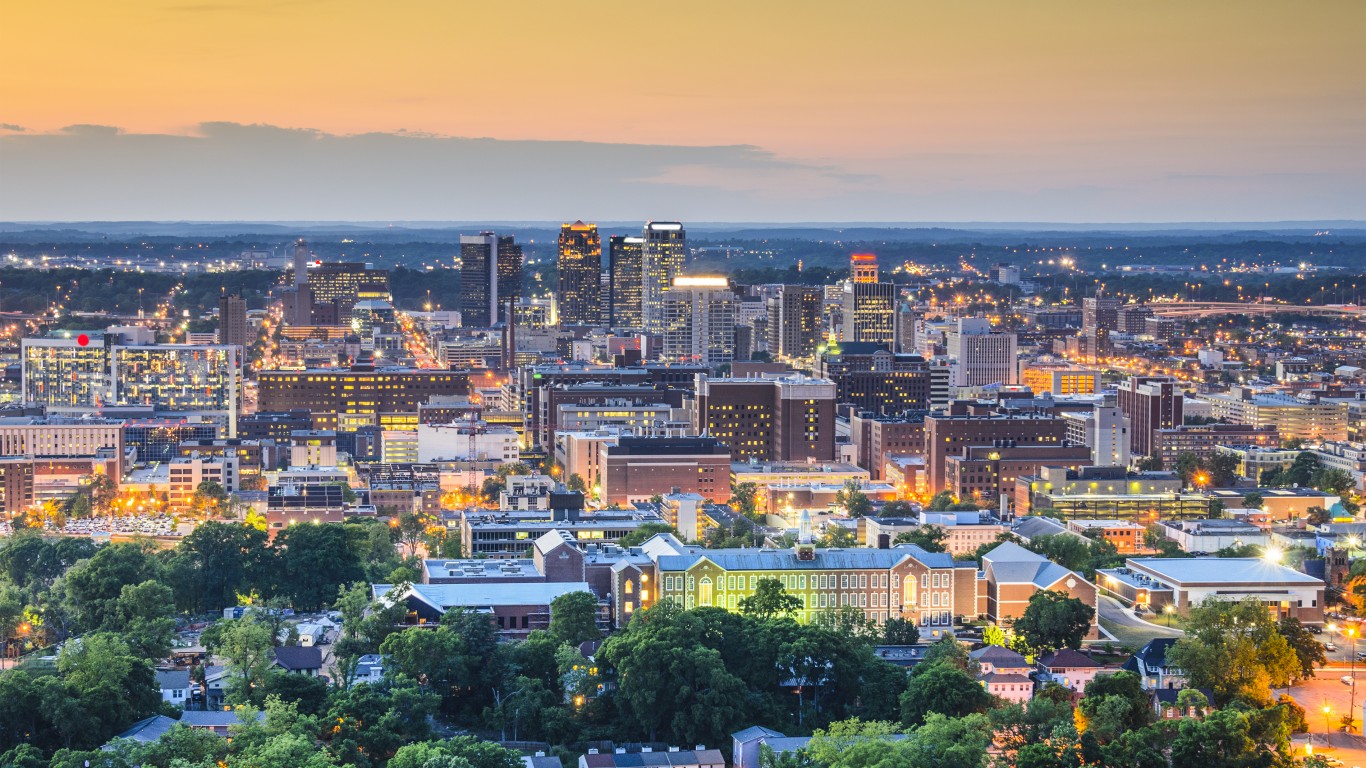
4. Birmingham, Alabama

Source: ESB Professional/Shutterstock
- Population change in downtown tracts from 2012 to 2022: -22.5%
- Population change of non-downtown tracts from 2012 to 2022: -9.6%
- Per capita income chg in downtown tracts from 2012 to 2022: +28.7%
- Per capita income chg in non-downtown tracts from 2012 to 2022: +15.6%
3. Columbus, Georgia
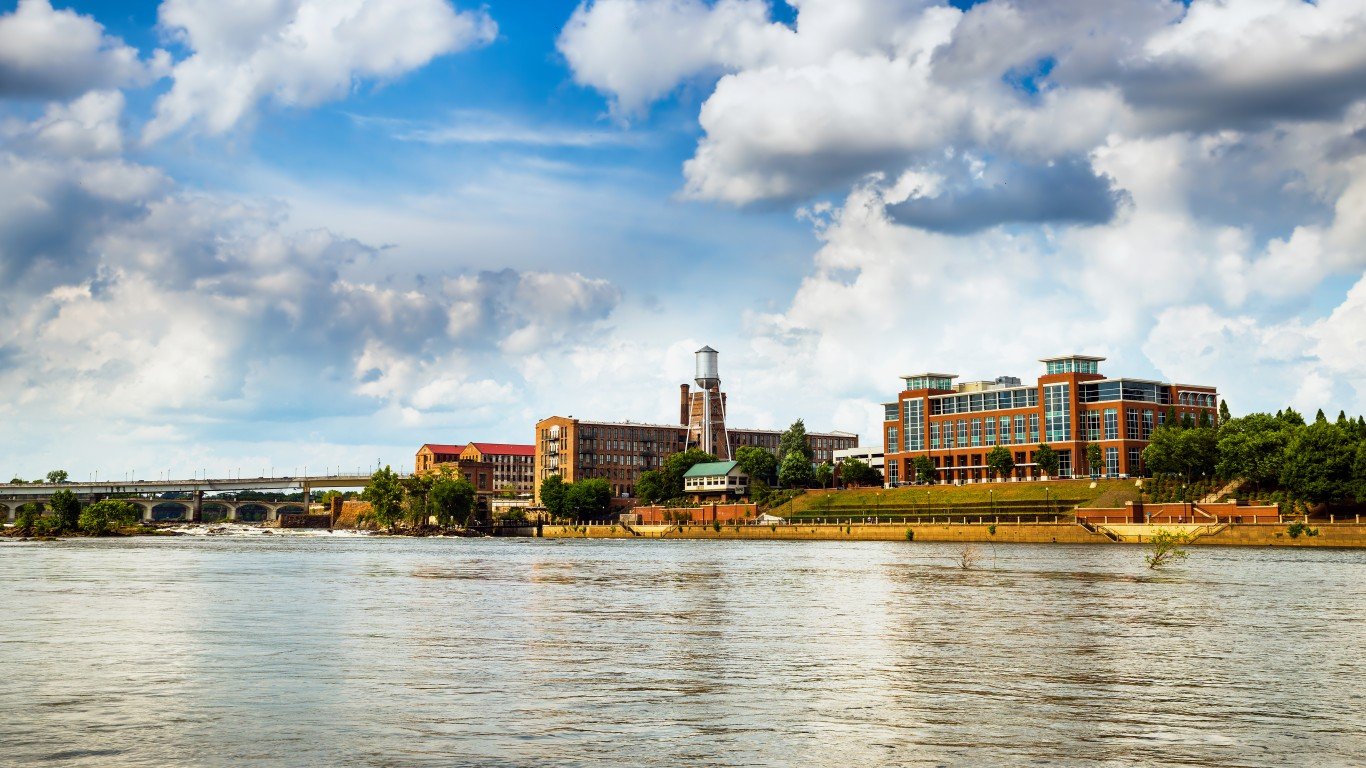
Source: RobHainer / iStock via Getty Images
- Population change in downtown tracts from 2012 to 2022: -25.4%
- Population change of non-downtown tracts from 2012 to 2022: +3.6%
- Per capita income chg in downtown tracts from 2012 to 2022: +41.4%
- Per capita income chg in non-downtown tracts from 2012 to 2022: +1.0%
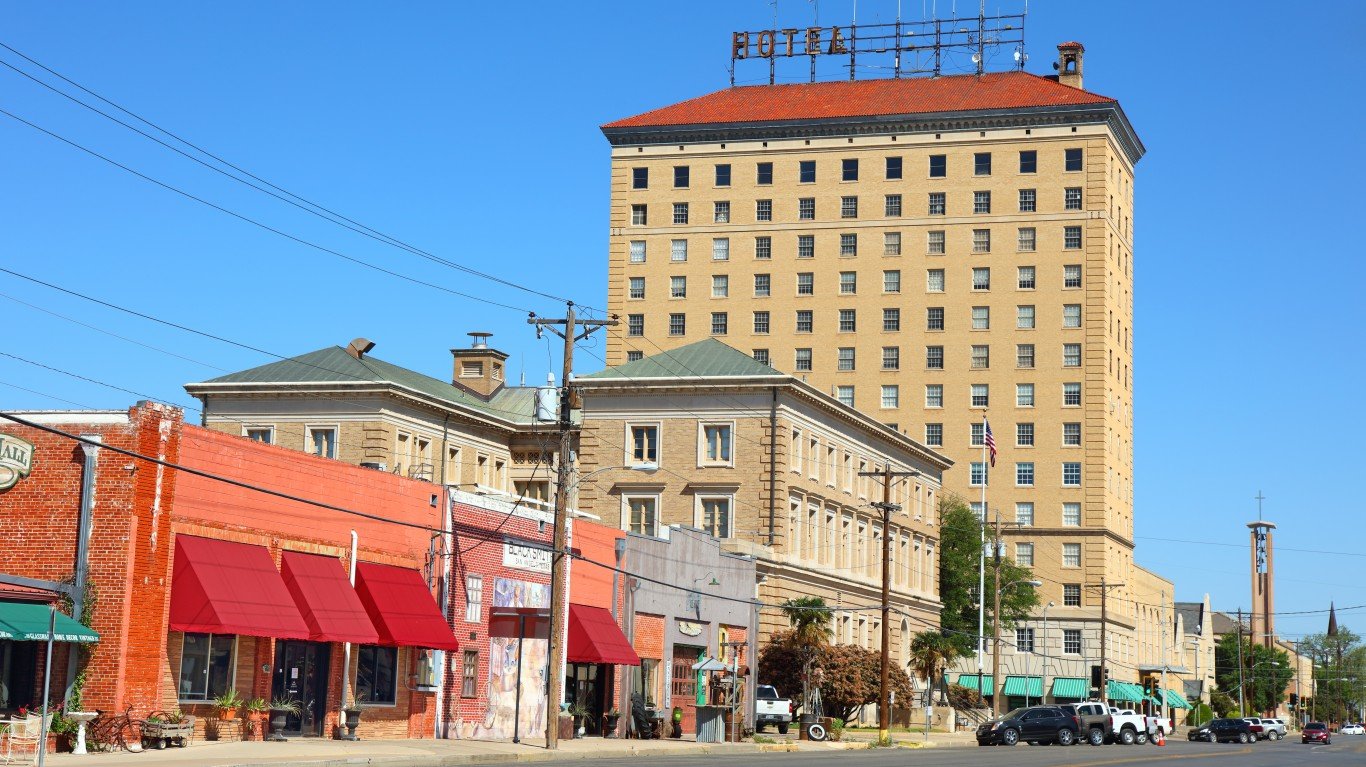
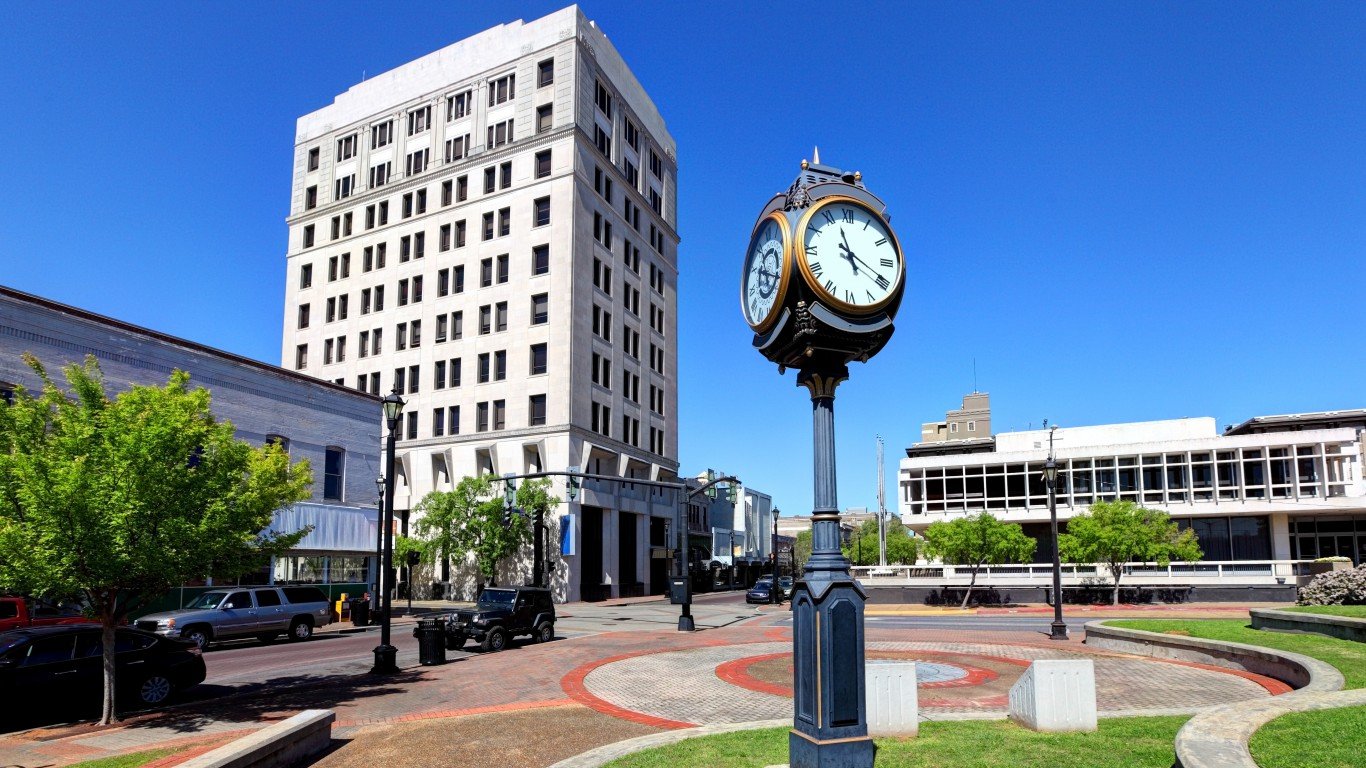
2. Pine Bluff, Arkansas
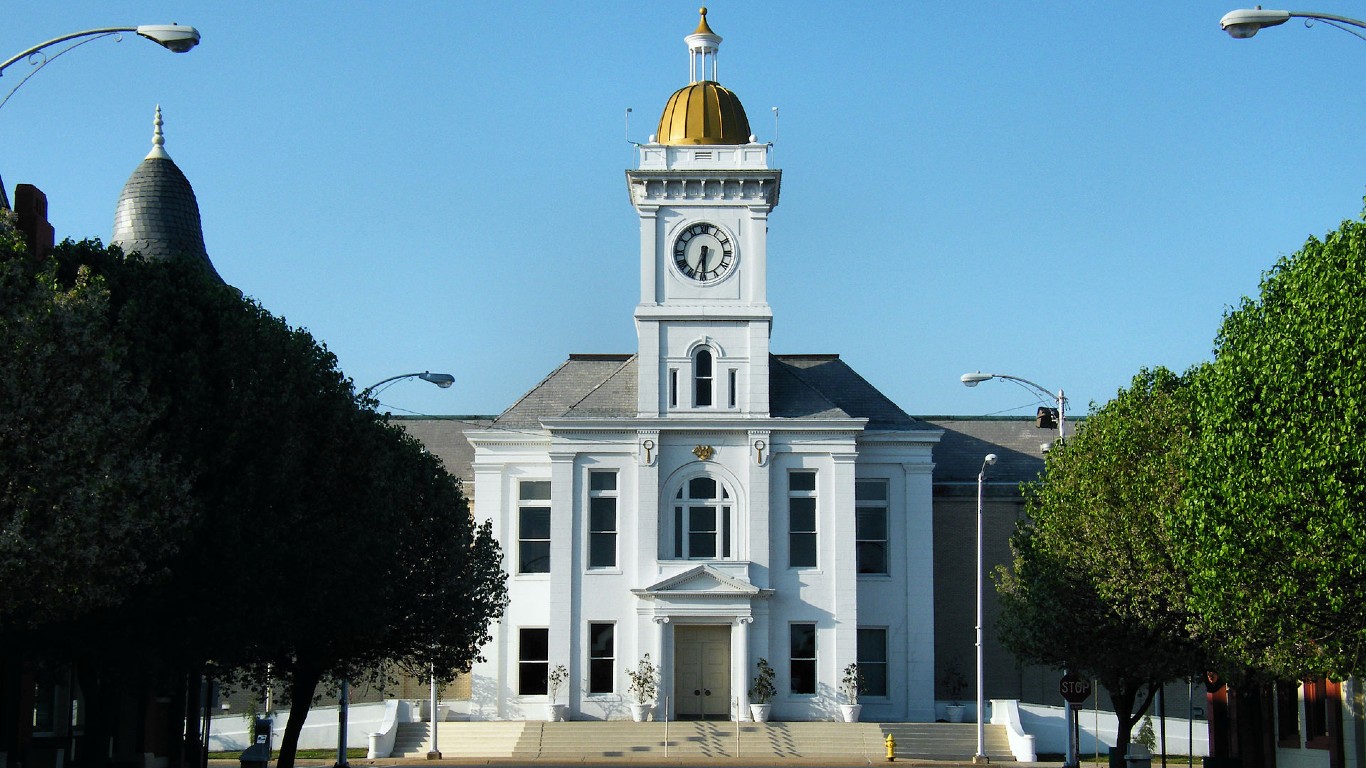
Source: Public Domain / Wikimedia Commons
- Population change in downtown tracts from 2012 to 2022: -30.5%
- Population change of non-downtown tracts from 2012 to 2022: -10.0%
- Per capita income chg in downtown tracts from 2012 to 2022: +19.1%
- Per capita income chg in non-downtown tracts from 2012 to 2022: +1.4%
1. Albany, Georgia
Source: Roberto Galan / iStock Editorial via Getty Images
- Population change in downtown tracts from 2012 to 2022: -39.3%
- Population change of non-downtown tracts from 2012 to 2022: -4.0%
- Per capita income chg in downtown tracts from 2012 to 2022: +23.7%
- Per capita income chg in non-downtown tracts from 2012 to 2022: +1.9%
Take This Retirement Quiz To Get Matched With A Financial Advisor (Sponsored)
Take the quiz below to get matched with a financial advisor today.
Each advisor has been vetted by SmartAsset and is held to a fiduciary standard to act in your best interests.
Here’s how it works:
1. Answer SmartAsset advisor match quiz
2. Review your pre-screened matches at your leisure. Check out the advisors’ profiles.
3. Speak with advisors at no cost to you. Have an introductory call on the phone or introduction in person and choose whom to work with in the future
Take the retirement quiz right here.
Thank you for reading! Have some feedback for us?
Contact the 24/7 Wall St. editorial team.
Editors' Picks