
America is a country that is known for its stark inequality in income. The richest part of the population (top 1%) owned 32.3% of the nation’s wealth, according to a report in 2022. This is in stark contrast to the bottom 90% which holds only 30.2% of the nation’s wealth.
Since hitting a multi-decade high in June 2022, the pace of inflation in the United States has cooled. Still, consumer prices are rising at nearly double the 2% annual target set by the Federal Reserve – and Americans are feeling the pinch. According to a report from Moody’s Analytics, the same goods and services cost the typical American household $709 more in July 2023 than in July 2021.
Using metro area-level data on median household income from the U.S. Census Bureau’s 2022 American Community Survey, 24/7 Wall St. identified the poorest city in every state. Additional income and population data also came from the ACS. Four states – Delaware, New Hampshire, Rhode Island, and Vermont – have only one metropolitan area. As a result, the cities listed in these states rank as the poorest by default only. (Here is a look at the cities where most people make over $90k a year.)
In most metropolitan areas on this list, the share of households earning less than $10,000 a year exceeds the comparable statewide share – and in all but six metro areas on this list, residents are more likely to live below the poverty line than the typical resident of the state as a whole. (Here is a look at the 31 poorest states in America.)
Here is the poorest city in every state. All information is for 2022.
Alabama: Anniston-Oxford
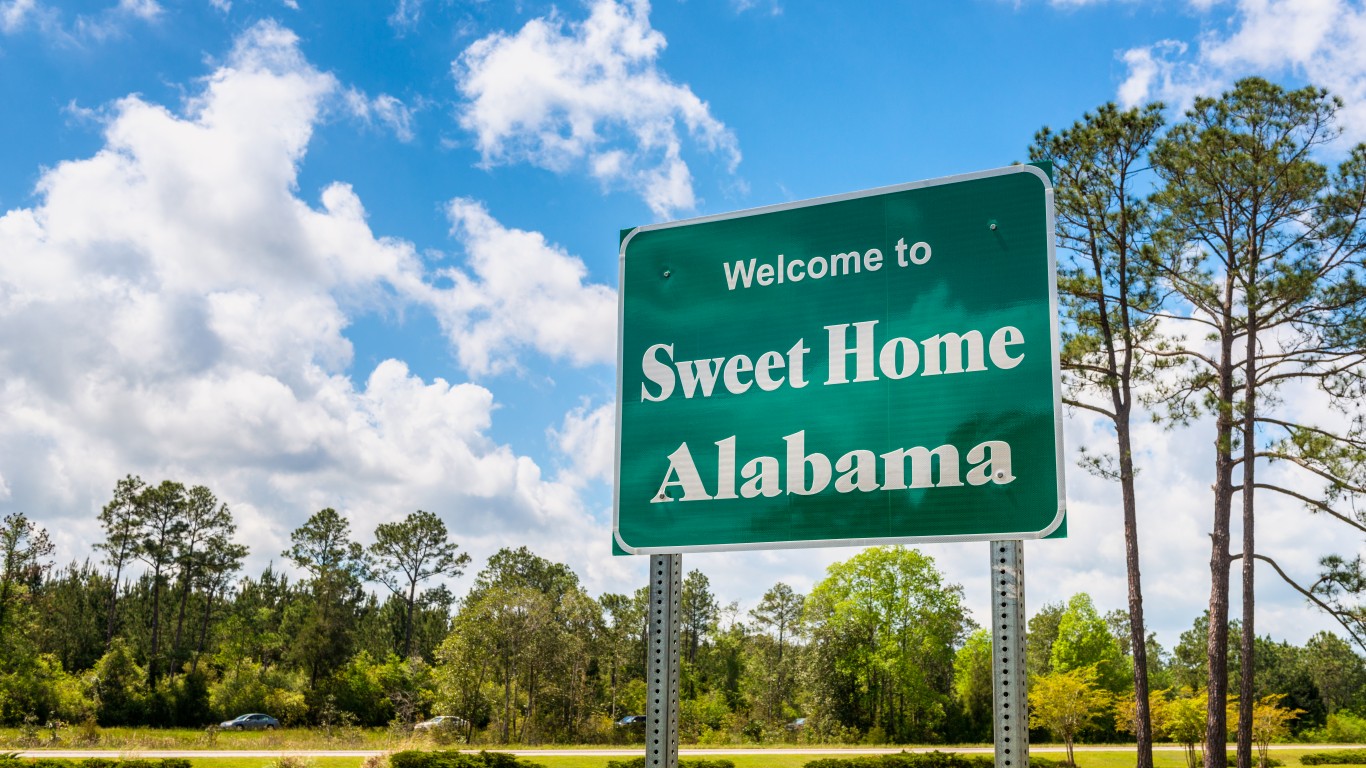
Source: Allard1 / iStock via Getty Images
- Household income (median): $59,674 – the lowest of 12 metro areas in state
- Statewide median household income: $59,674 – #44 highest of 50 states
- Poverty rate of the metro area: 20,450 (18.3% – #46 highest out of 384 U.S. metro areas)
- Households with an income of under $10,000: 4,151 (9.1% – #20 highest out of 384 U.S. metro areas)
- Population: 115,788
Alaska: Fairbanks

Source: FloridaStock / Shutterstock.com
- Household income (median): $88,121 – the lowest of 2 metro areas in state
- Statewide median household income: $88,121 – #11 highest of 50 states
- Poverty rate of the metro area: 6,528 (7.1% – #379 highest out of 384 U.S. metro areas)
- Households with an income of under $10,000: 1,462 (3.9% – #340 highest out of 384 U.S. metro areas)
- Population: 95,356
Arizona: Yuma
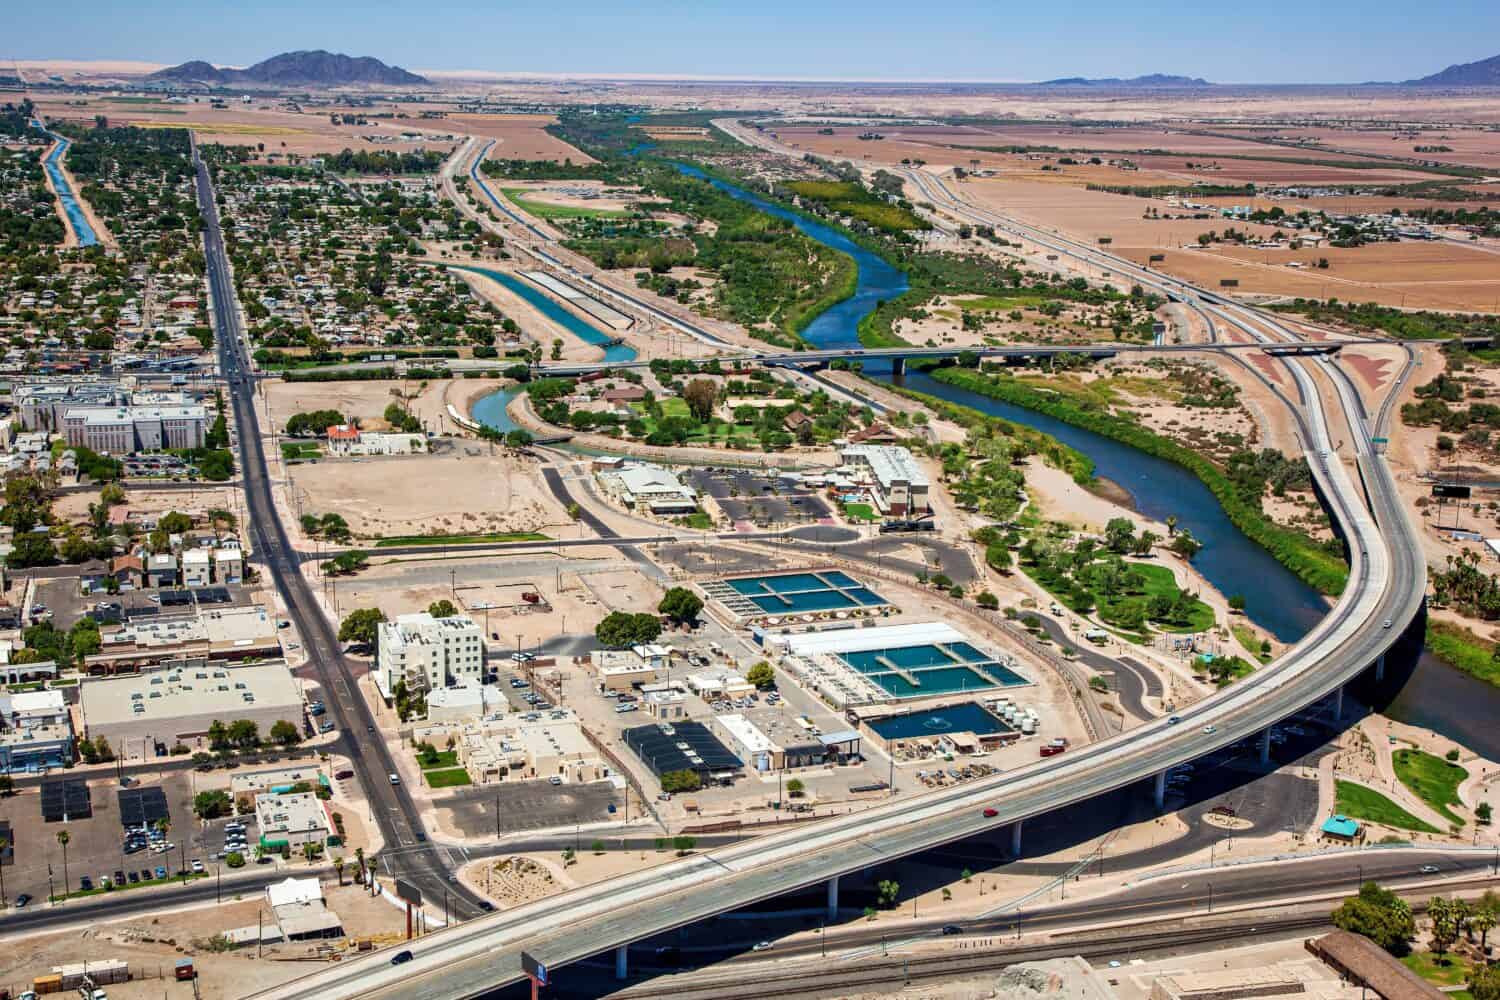
Source: Tim Roberts Photography / Shutterstock.com
- Household income (median): $74,568 – the lowest of 7 metro areas in state
- Statewide median household income: $74,568 – #19 highest of 50 states
- Poverty rate of the metro area: 26,544 (13.2% – #186 highest out of 384 U.S. metro areas)
- Households with an income of under $10,000: 4,044 (5.0% – #241 highest out of 384 U.S. metro areas)
- Population: 207,842
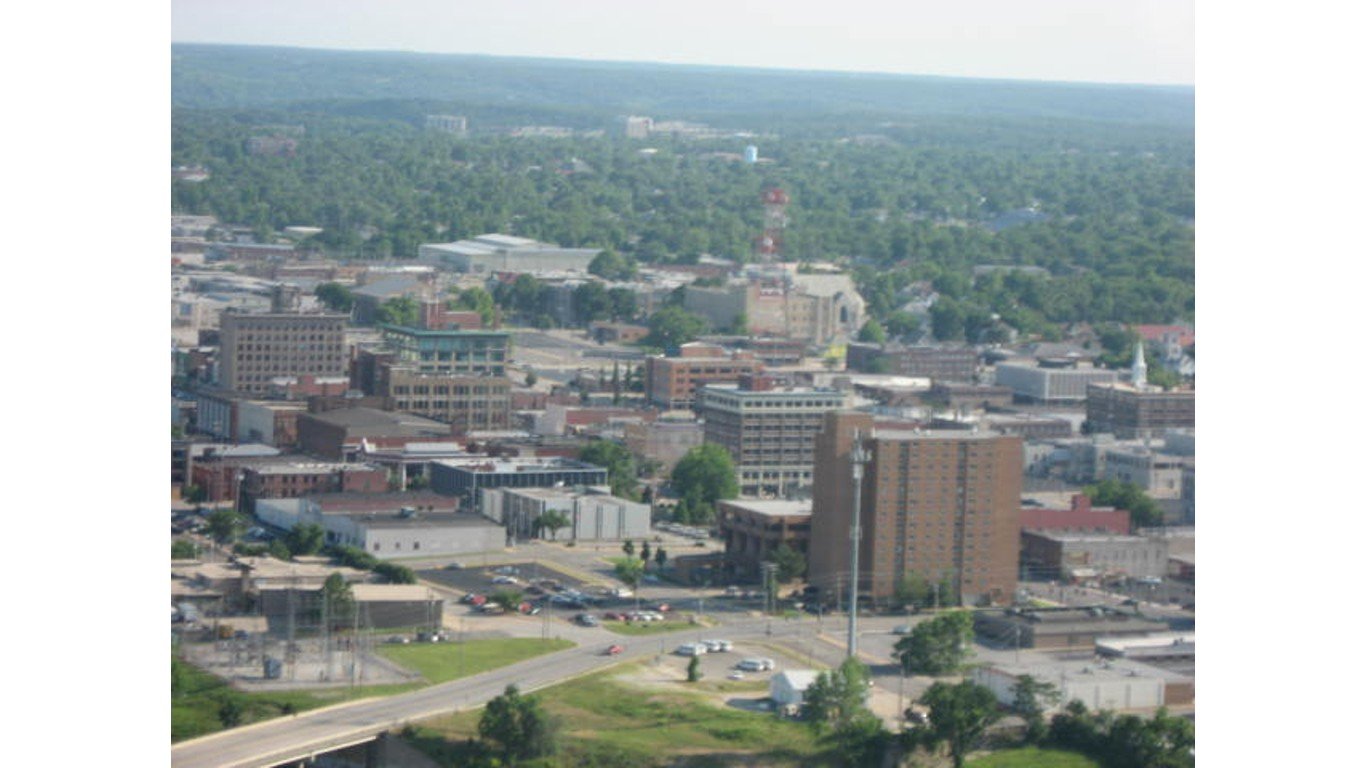
Arkansas: Pine Bluff

Source: Public Domain / Wikimedia Commons
- Household income (median): $55,432 – the lowest of 6 metro areas in state
- Statewide median household income: $55,432 – #47 highest of 50 states
- Poverty rate of the metro area: 14,580 (19.5% – #24 highest out of 384 U.S. metro areas)
- Households with an income of under $10,000: 2,595 (8.5% – #32 highest out of 384 U.S. metro areas)
- Population: 84,460
California: El Centro
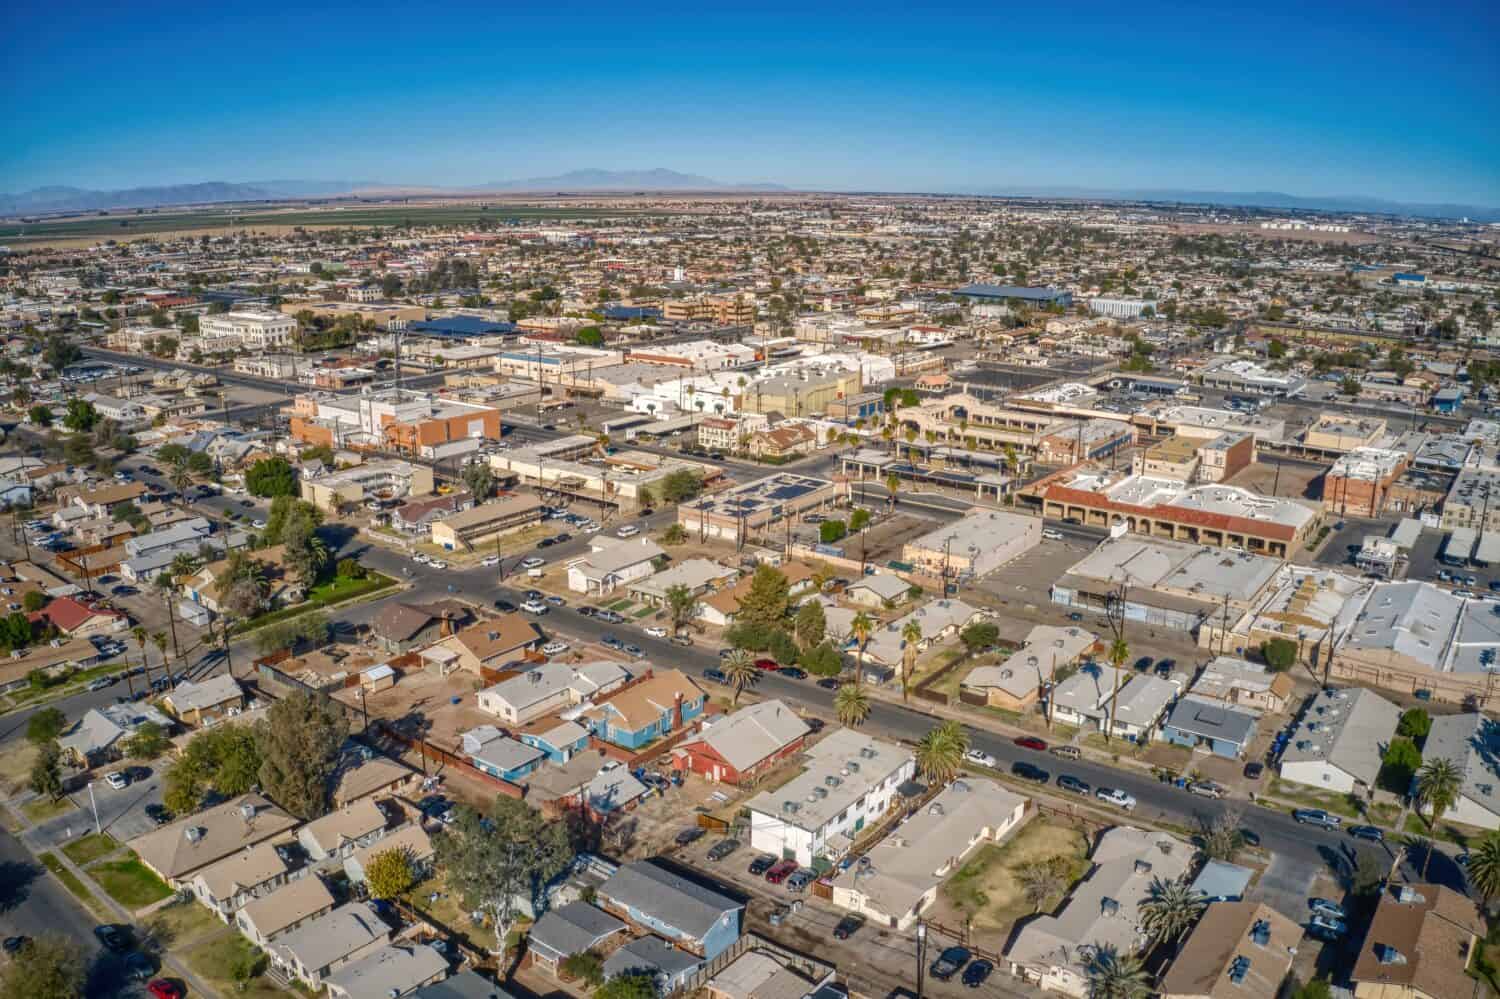
Source: Jacob Boomsma / Shutterstock.com
- Household income (median): $91,551 – the lowest of 26 metro areas in state
- Statewide median household income: $91,551 – #5 highest of 50 states
- Poverty rate of the metro area: 38,933 (22.6% – #7 highest out of 384 U.S. metro areas)
- Households with an income of under $10,000: 4,944 (9.7% – #13 highest out of 384 U.S. metro areas)
- Population: 178,713
Colorado: Pueblo
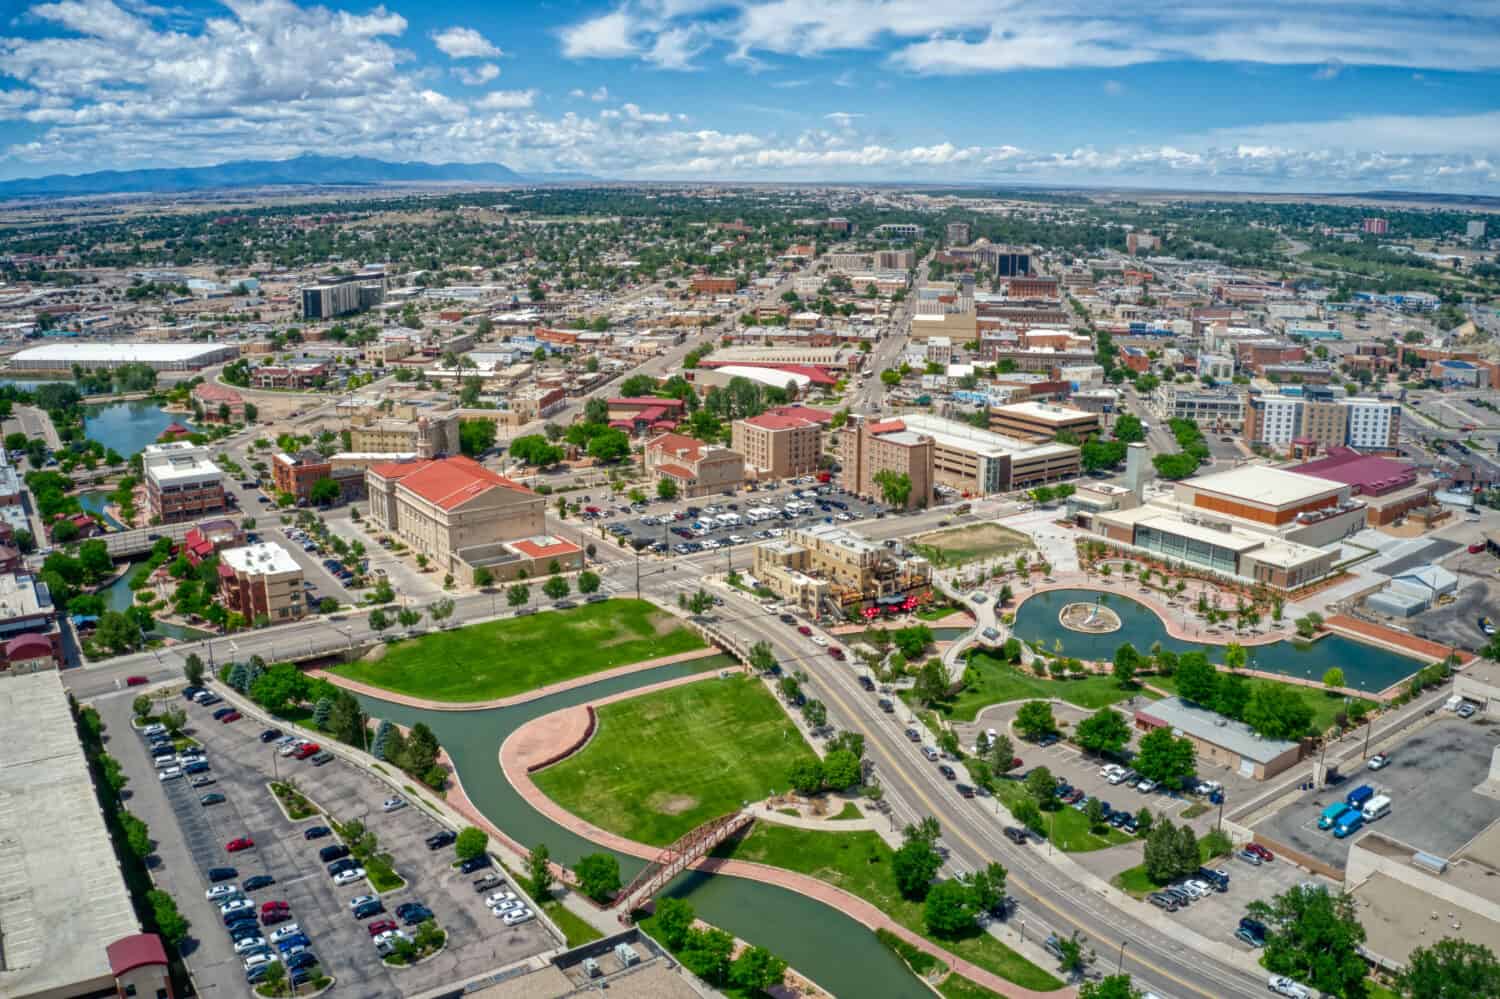
Source: Jacob Boomsma / Shutterstock.com
- Household income (median): $89,302 – the lowest of 7 metro areas in state
- Statewide median household income: $89,302 – #8 highest of 50 states
- Poverty rate of the metro area: 24,389 (14.8% – #130 highest out of 384 U.S. metro areas)
- Households with an income of under $10,000: 4,485 (6.6% – #101 highest out of 384 U.S. metro areas)
- Population: 169,544
Connecticut: New Haven-Milford

Source: Renata Ty / Shutterstock.com
- Household income (median): $88,429 – the lowest of 4 metro areas in state
- Statewide median household income: $88,429 – #10 highest of 50 states
- Poverty rate of the metro area: 87,834 (10.5% – #303 highest out of 384 U.S. metro areas)
- Households with an income of under $10,000: 18,942 (5.5% – #187 highest out of 384 U.S. metro areas)
- Population: 870,163
Delaware: Dover

Source: benkrut / iStock via Getty Images
- Household income (median): $82,174 (only metro area in state, lowest by default)
- Statewide median household income: $82,174 – #14 highest of 50 states
- Poverty rate of the metro area: 17,094 (9.4% – #336 highest out of 384 U.S. metro areas)
- Households with an income of under $10,000: 2,854 (3.9% – #342 highest out of 384 U.S. metro areas)
- Population: 186,946
Florida: Homosassa Springs

Source: David Byron Keener / Shutterstock.com
- Household income (median): $69,303 – the lowest of 22 metro areas in state
- Statewide median household income: $69,303 – #33 highest of 50 states
- Poverty rate of the metro area: 29,597 (18.5% – #42 highest out of 384 U.S. metro areas)
- Households with an income of under $10,000: 4,327 (6.1% – #142 highest out of 384 U.S. metro areas)
- Population: 162,529
Georgia: Albany

Source: airwayphoto / Shutterstock.com
- Household income (median): $72,837 – the lowest of 14 metro areas in state
- Statewide median household income: $72,837 – #21 highest of 50 states
- Poverty rate of the metro area: 37,026 (26.2% – #2 highest out of 384 U.S. metro areas)
- Households with an income of under $10,000: 5,264 (9.1% – #18 highest out of 384 U.S. metro areas)
- Population: 146,387
Hawaii: Kahului-Wailuku-Lahaina

Source: Art Wager / E+ via Getty Images
- Household income (median): $92,458 – the lowest of 2 metro areas in state
- Statewide median household income: $92,458 – #4 highest of 50 states
- Poverty rate of the metro area: 13,326 (8.2% – #366 highest out of 384 U.S. metro areas)
- Households with an income of under $10,000: 1,812 (3.2% – #371 highest out of 384 U.S. metro areas)
- Population: 164,365
Idaho: Pocatello

Source: Lane V. Erickson / Shutterstock.com
- Household income (median): $72,785 – the lowest of 6 metro areas in state
- Statewide median household income: $72,785 – #22 highest of 50 states
- Poverty rate of the metro area: 12,684 (13.2% – #181 highest out of 384 U.S. metro areas)
- Households with an income of under $10,000: 1,822 (4.9% – #254 highest out of 384 U.S. metro areas)
- Population: 98,560
Illinois: Danville

Source: Denise comr / Shutterstock.com
- Household income (median): $76,708 – the lowest of 10 metro areas in state
- Statewide median household income: $76,708 – #17 highest of 50 states
- Poverty rate of the metro area: 11,640 (16.8% – #78 highest out of 384 U.S. metro areas)
- Households with an income of under $10,000: 1,999 (6.5% – #116 highest out of 384 U.S. metro areas)
- Population: 72,337
Indiana: Muncie

Source: Roberto Galan / iStock Editorial via Getty Images
- Household income (median): $66,785 – the lowest of 12 metro areas in state
- Statewide median household income: $66,785 – #38 highest of 50 states
- Poverty rate of the metro area: 19,540 (18.8% – #36 highest out of 384 U.S. metro areas)
- Households with an income of under $10,000: 3,774 (7.9% – #42 highest out of 384 U.S. metro areas)
- Population: 112,031
Iowa: Waterloo-Cedar Falls

Source: Gia Javarova / Shutterstock.com
- Household income (median): $69,588 – the lowest of 8 metro areas in state
- Statewide median household income: $69,588 – #31 highest of 50 states
- Poverty rate of the metro area: 24,601 (15.3% – #114 highest out of 384 U.S. metro areas)
- Households with an income of under $10,000: 3,253 (4.7% – #276 highest out of 384 U.S. metro areas)
- Population: 167,889
Kansas: Manhattan

Source: Jacob Boomsma / Shutterstock.com
- Household income (median): $68,925 – the lowest of 4 metro areas in state
- Statewide median household income: $68,925 – #34 highest of 50 states
- Poverty rate of the metro area: 21,286 (17.5% – #60 highest out of 384 U.S. metro areas)
- Households with an income of under $10,000: 3,726 (7.2% – #79 highest out of 384 U.S. metro areas)
- Population: 133,072
Kentucky: Bowling Green

Source: Daniele Novati / Shutterstock.com
- Household income (median): $59,341 – the lowest of 5 metro areas in state
- Statewide median household income: $59,341 – #46 highest of 50 states
- Poverty rate of the metro area: 33,170 (18.5% – #41 highest out of 384 U.S. metro areas)
- Households with an income of under $10,000: 6,294 (8.7% – #29 highest out of 384 U.S. metro areas)
- Population: 184,636
Louisiana: Monroe

Source: Heather Raulerson / Shutterstock.com
- Household income (median): $55,416 – the lowest of 9 metro areas in state
- Statewide median household income: $55,416 – #48 highest of 50 states
- Poverty rate of the metro area: 48,925 (24.9% – #3 highest out of 384 U.S. metro areas)
- Households with an income of under $10,000: 9,265 (11.2% – #2 highest out of 384 U.S. metro areas)
- Population: 202,869
Maine: Bangor

Source: Gchapel / Shutterstock.com
- Household income (median): $69,543 – the lowest of 3 metro areas in state
- Statewide median household income: $69,543 – #32 highest of 50 states
- Poverty rate of the metro area: 22,358 (15.1% – #122 highest out of 384 U.S. metro areas)
- Households with an income of under $10,000: 3,865 (5.9% – #160 highest out of 384 U.S. metro areas)
- Population: 153,704
Maryland: Cumberland

Source: JAIRTELLO / Shutterstock.com
- Household income (median): $94,991 – the lowest of 5 metro areas in state
- Statewide median household income: $94,991 – #2 highest of 50 states
- Poverty rate of the metro area: 16,587 (18.9% – #33 highest out of 384 U.S. metro areas)
- Households with an income of under $10,000: 2,903 (7.9% – #45 highest out of 384 U.S. metro areas)
- Population: 94,122
Massachusetts: Springfield

Source: JGPR / Shutterstock.com
- Household income (median): $94,488 – the lowest of 5 metro areas in state
- Statewide median household income: $94,488 – #3 highest of 50 states
- Poverty rate of the metro area: 103,885 (15.7% – #101 highest out of 384 U.S. metro areas)
- Households with an income of under $10,000: 19,842 (7.1% – #80 highest out of 384 U.S. metro areas)
- Population: 694,523
Michigan: Saginaw
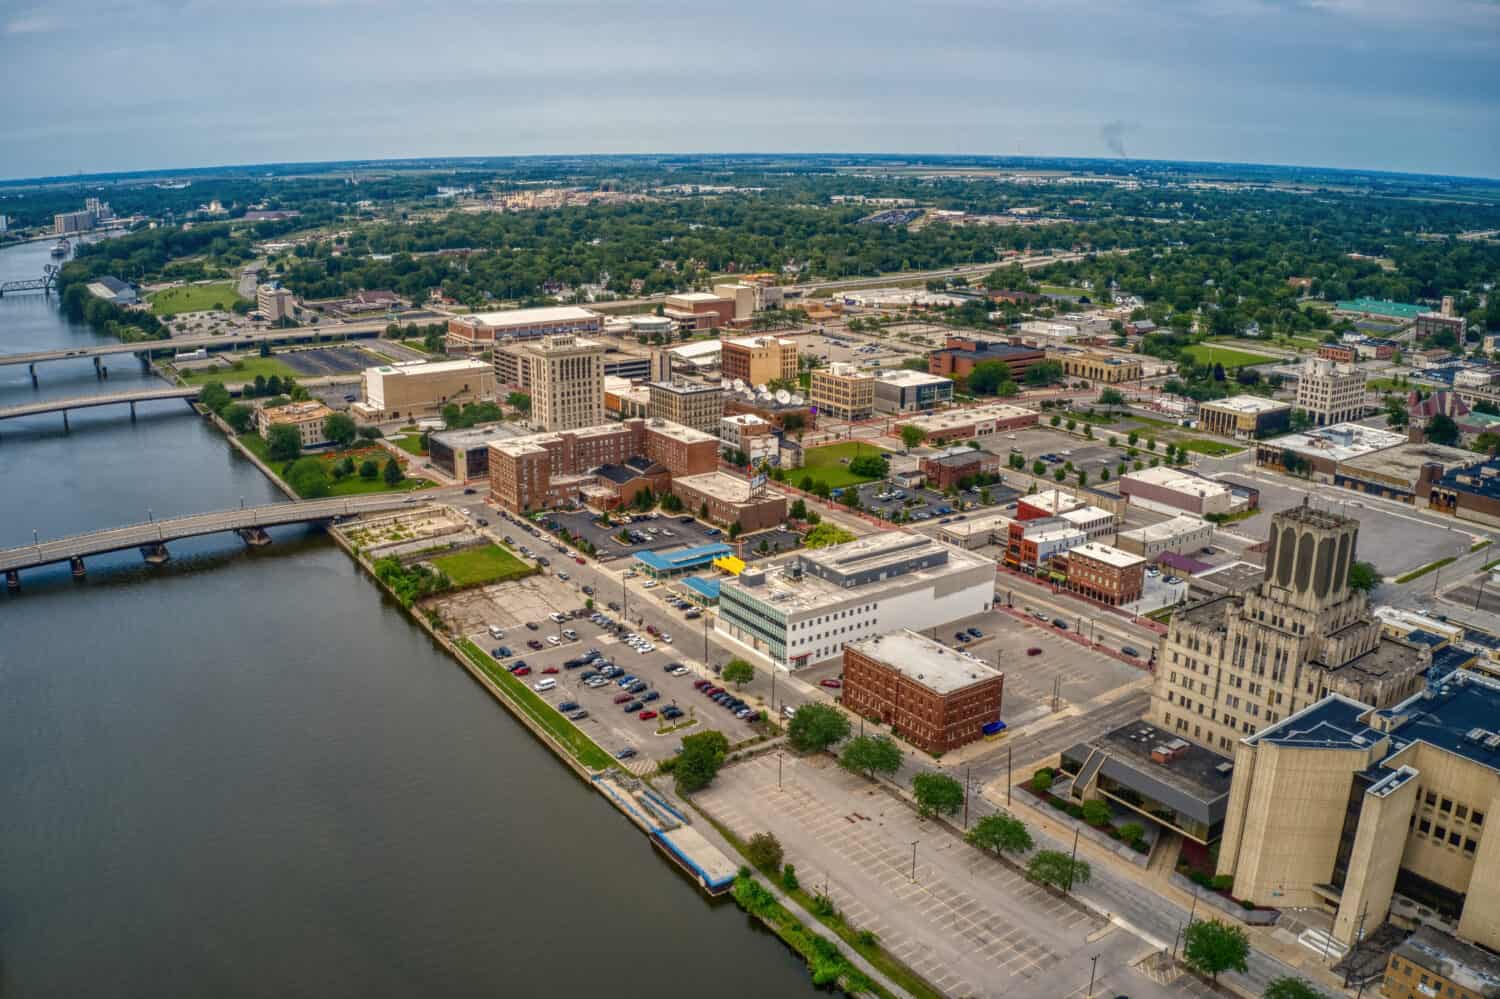
Source: Jacob Boomsma / Shutterstock.com
- Household income (median): $66,986 – the lowest of 14 metro areas in state
- Statewide median household income: $66,986 – #37 highest of 50 states
- Poverty rate of the metro area: 33,598 (18.4% – #45 highest out of 384 U.S. metro areas)
- Households with an income of under $10,000: 6,108 (7.7% – #52 highest out of 384 U.S. metro areas)
- Population: 188,330
Minnesota: Duluth

Source: Cody Markhart / Shutterstock.com
- Household income (median): $82,338 – the lowest of 5 metro areas in state
- Statewide median household income: $82,338 – #13 highest of 50 states
- Poverty rate of the metro area: 37,601 (13.2% – #179 highest out of 384 U.S. metro areas)
- Households with an income of under $10,000: 7,974 (6.3% – #121 highest out of 384 U.S. metro areas)
- Population: 291,931
Mississippi: Hattiesburg

Source: Queenwannabe / Shutterstock.com
- Household income (median): $52,719 – the lowest of 3 metro areas in state
- Statewide median household income: $52,719 – #50 highest of 50 states
- Poverty rate of the metro area: 33,197 (20.0% – #20 highest out of 384 U.S. metro areas)
- Households with an income of under $10,000: 4,915 (7.4% – #71 highest out of 384 U.S. metro areas)
- Population: 172,263
Missouri: Joplin
Source: Public Domain / Wikimedia Commons
- Household income (median): $64,811 – the lowest of 8 metro areas in state
- Statewide median household income: $64,811 – #41 highest of 50 states
- Poverty rate of the metro area: 32,842 (18.3% – #47 highest out of 384 U.S. metro areas)
- Households with an income of under $10,000: 3,702 (5.2% – #214 highest out of 384 U.S. metro areas)
- Population: 184,086
Montana: Great Falls

Source: Victoria Ditkovsky / Shutterstock.com
- Household income (median): $67,631 – the lowest of 3 metro areas in state
- Statewide median household income: $67,631 – #35 highest of 50 states
- Poverty rate of the metro area: 12,275 (14.9% – #126 highest out of 384 U.S. metro areas)
- Households with an income of under $10,000: 1,674 (4.7% – #269 highest out of 384 U.S. metro areas)
- Population: 84,864
Nebraska: Lincoln

Source: Jacob Boomsma / iStock via Getty Images
- Household income (median): $69,597 – the lowest of 3 metro areas in state
- Statewide median household income: $69,597 – #30 highest of 50 states
- Poverty rate of the metro area: 41,309 (12.7% – #207 highest out of 384 U.S. metro areas)
- Households with an income of under $10,000: 7,717 (5.6% – #175 highest out of 384 U.S. metro areas)
- Population: 341,229
Nevada: Carson City

Source: esfera / Shutterstock.com
- Household income (median): $72,333 – the lowest of 3 metro areas in state
- Statewide median household income: $72,333 – #23 highest of 50 states
- Poverty rate of the metro area: 8,438 (15.4% – #109 highest out of 384 U.S. metro areas)
- Households with an income of under $10,000: 1,506 (6.5% – #114 highest out of 384 U.S. metro areas)
- Population: 58,130
New Hampshire: Manchester-Nashua

Source: Sean Pavone / iStock via Getty Images
- Household income (median): $89,992 (only metro area in state, lowest by default)
- Statewide median household income: $89,992 – #7 highest of 50 states
- Poverty rate of the metro area: 25,980 (6.2% – #383 highest out of 384 U.S. metro areas)
- Households with an income of under $10,000: 3,996 (2.4% – #382 highest out of 384 U.S. metro areas)
- Population: 426,594
New Jersey: Vineland-Bridgeton

Source: AUDREY SCRIPP / iStock via Getty Images
- Household income (median): $96,346 – the lowest of 4 metro areas in state
- Statewide median household income: $96,346 – #1 highest of 50 states
- Poverty rate of the metro area: 22,154 (15.3% – #113 highest out of 384 U.S. metro areas)
- Households with an income of under $10,000: 2,512 (4.6% – #287 highest out of 384 U.S. metro areas)
- Population: 151,356
New Mexico: Farmington

Source: Shoppy22 / Shutterstock.com
- Household income (median): $59,726 – the lowest of 4 metro areas in state
- Statewide median household income: $59,726 – #43 highest of 50 states
- Poverty rate of the metro area: 28,693 (24.1% – #6 highest out of 384 U.S. metro areas)
- Households with an income of under $10,000: 3,752 (9.0% – #23 highest out of 384 U.S. metro areas)
- Population: 120,418
New York: Elmira

Source: Jacob Boomsma / Shutterstock.com
- Household income (median): $79,557 – the lowest of 13 metro areas in state
- Statewide median household income: $79,557 – #16 highest of 50 states
- Poverty rate of the metro area: 12,348 (15.8% – #99 highest out of 384 U.S. metro areas)
- Households with an income of under $10,000: 1,859 (5.4% – #192 highest out of 384 U.S. metro areas)
- Population: 81,426
North Carolina: Rocky Mount

Source: Sierra Tango / Shutterstock.com
- Household income (median): $67,481 – the lowest of 15 metro areas in state
- Statewide median household income: $67,481 – #36 highest of 50 states
- Poverty rate of the metro area: 20,187 (14.2% – #151 highest out of 384 U.S. metro areas)
- Households with an income of under $10,000: 3,987 (6.8% – #94 highest out of 384 U.S. metro areas)
- Population: 144,090
North Dakota: Grand Forks
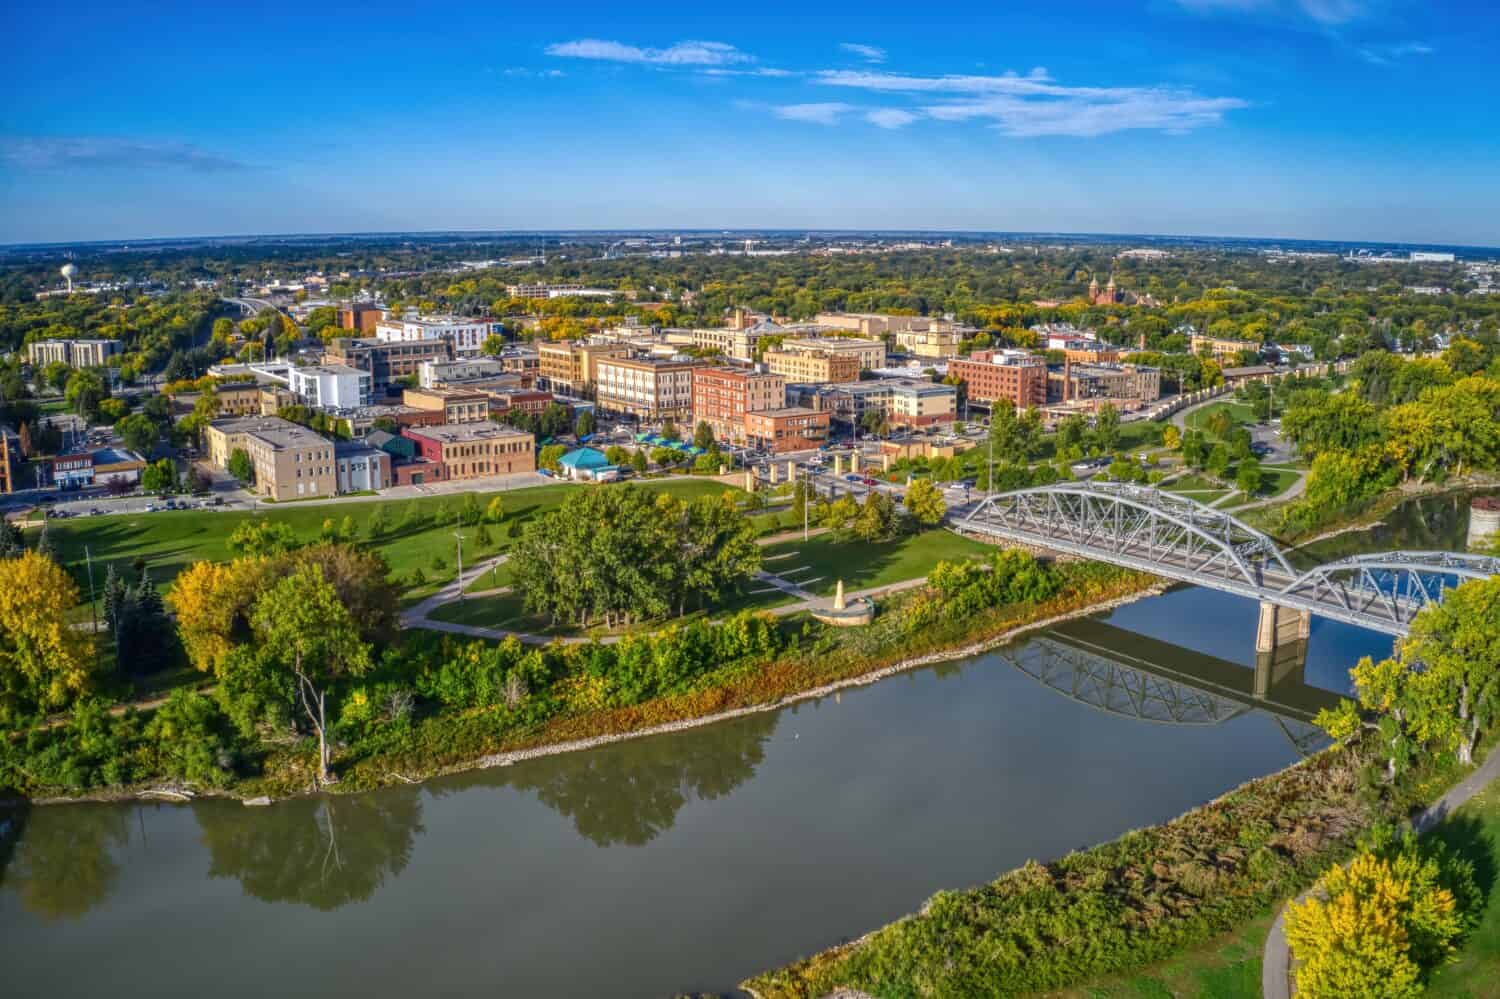
Source: Jacob Boomsma / Shutterstock.com
- Household income (median): $71,970 – the lowest of 3 metro areas in state
- Statewide median household income: $71,970 – #25 highest of 50 states
- Poverty rate of the metro area: 12,127 (12.5% – #217 highest out of 384 U.S. metro areas)
- Households with an income of under $10,000: 2,996 (7.0% – #86 highest out of 384 U.S. metro areas)
- Population: 103,144
Ohio: Mansfield

Source: aceshot1 / Shutterstock.com
- Household income (median): $65,720 – the lowest of 11 metro areas in state
- Statewide median household income: $65,720 – #39 highest of 50 states
- Poverty rate of the metro area: 17,898 (15.2% – #117 highest out of 384 U.S. metro areas)
- Households with an income of under $10,000: 2,326 (4.6% – #282 highest out of 384 U.S. metro areas)
- Population: 125,319
Oklahoma: Enid

Source: BOB WESTON / iStock via Getty Images
- Household income (median): $59,673 – the lowest of 4 metro areas in state
- Statewide median household income: $59,673 – #45 highest of 50 states
- Poverty rate of the metro area: 9,611 (16.1% – #91 highest out of 384 U.S. metro areas)
- Households with an income of under $10,000: 1,158 (5.0% – #236 highest out of 384 U.S. metro areas)
- Population: 61,920
Oregon: Grants Pass
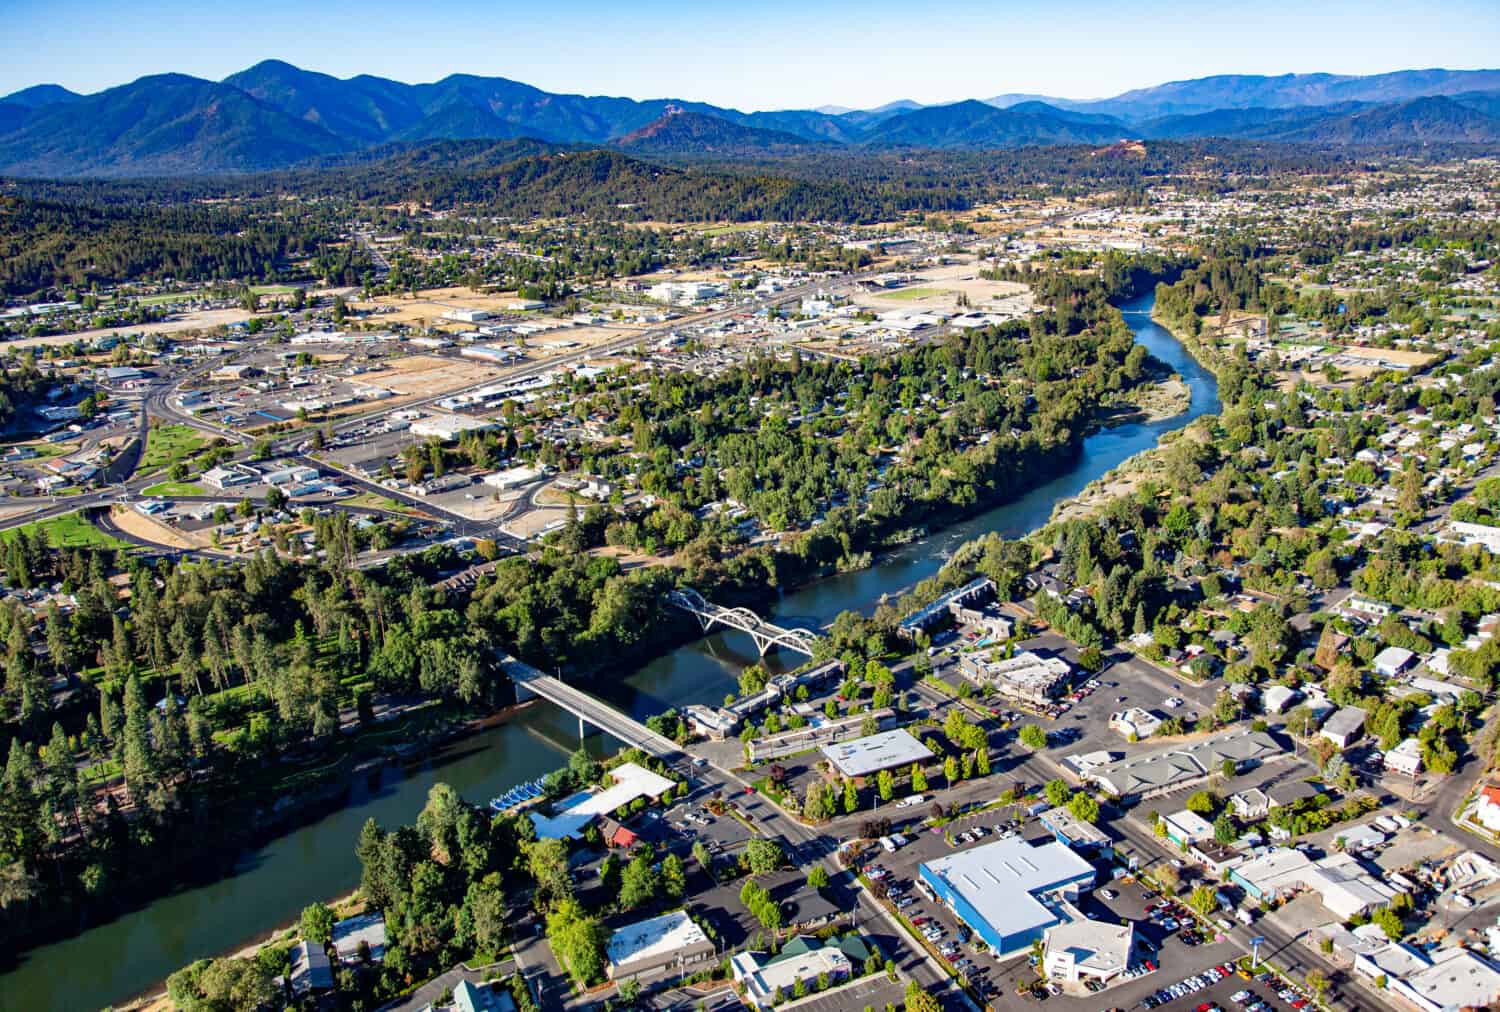
Source: Bob Pool / Shutterstock.com
- Household income (median): $75,657 – the lowest of 8 metro areas in state
- Statewide median household income: $75,657 – #18 highest of 50 states
- Poverty rate of the metro area: 16,458 (19.0% – #32 highest out of 384 U.S. metro areas)
- Households with an income of under $10,000: 3,304 (9.0% – #24 highest out of 384 U.S. metro areas)
- Population: 87,730
Pennsylvania: Johnstown
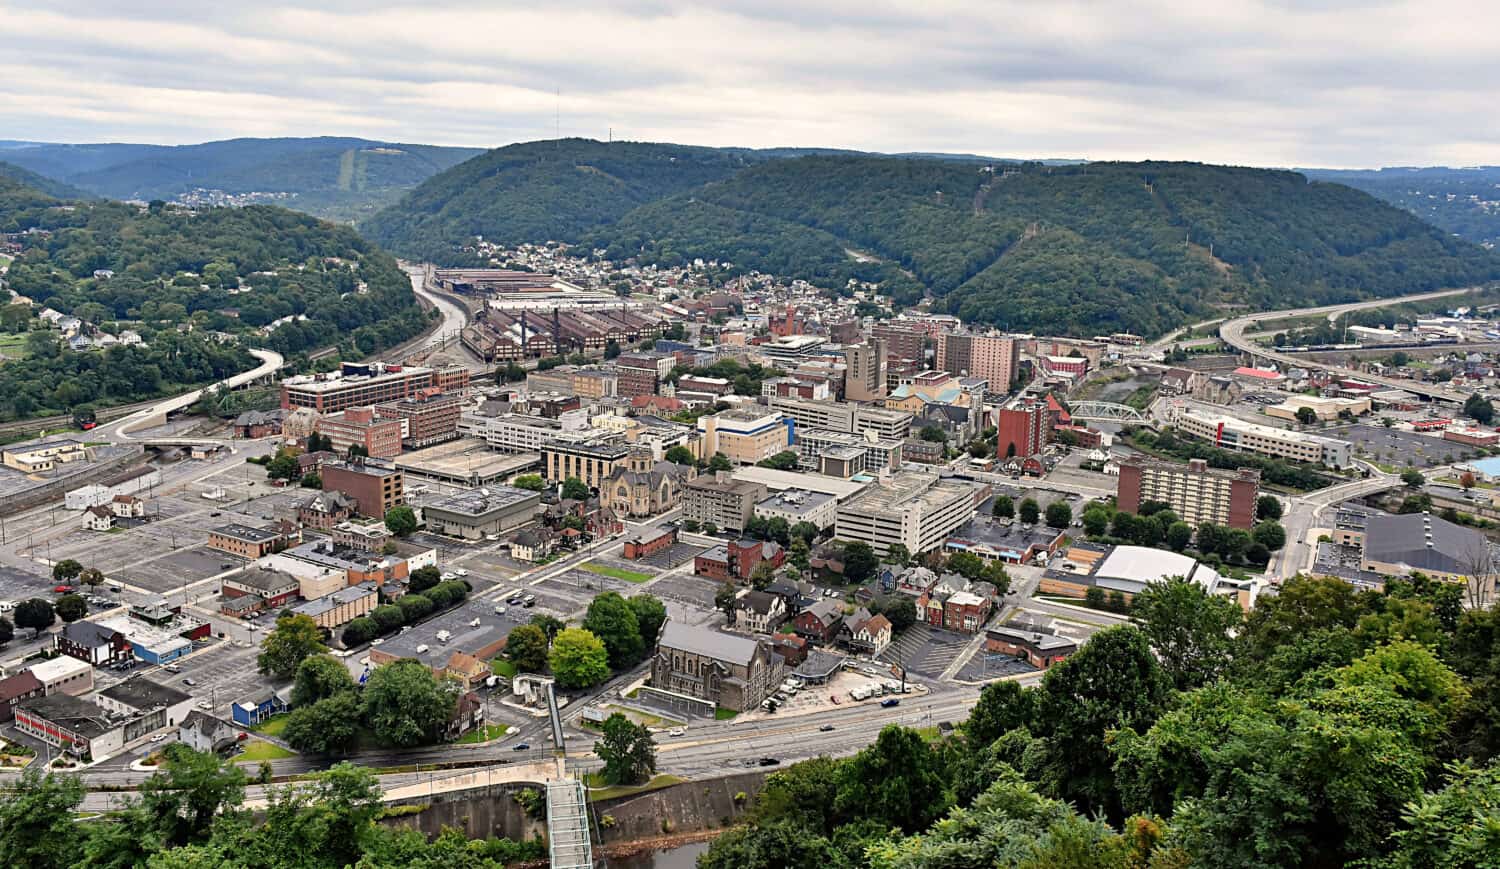
Source: Wirestock Creators / Shutterstock.com
- Household income (median): $71,798 – the lowest of 18 metro areas in state
- Statewide median household income: $71,798 – #26 highest of 50 states
- Poverty rate of the metro area: 21,104 (16.8% – #79 highest out of 384 U.S. metro areas)
- Households with an income of under $10,000: 4,061 (7.4% – #73 highest out of 384 U.S. metro areas)
- Population: 131,441
Rhode Island: Providence-Warwick

Source: NayaDadara / Shutterstock.com
- Household income (median): $81,854 (only metro area in state, lowest by default)
- Statewide median household income: $81,854 – #15 highest of 50 states
- Poverty rate of the metro area: 178,889 (11.0% – #272 highest out of 384 U.S. metro areas)
- Households with an income of under $10,000: 37,768 (5.6% – #177 highest out of 384 U.S. metro areas)
- Population: 1,673,802
South Carolina: Florence

Source: DenisTangneyJr / iStock via Getty Images
- Household income (median): $64,115 – the lowest of 8 metro areas in state
- Statewide median household income: $64,115 – #42 highest of 50 states
- Poverty rate of the metro area: 41,125 (21.1% – #12 highest out of 384 U.S. metro areas)
- Households with an income of under $10,000: 7,216 (9.1% – #21 highest out of 384 U.S. metro areas)
- Population: 199,119
South Dakota: Rapid City

Source: Sopotnicki / Shutterstock.com
- Household income (median): $69,728 – the lowest of 2 metro areas in state
- Statewide median household income: $69,728 – #29 highest of 50 states
- Poverty rate of the metro area: 17,767 (12.7% – #206 highest out of 384 U.S. metro areas)
- Households with an income of under $10,000: 2,751 (4.6% – #285 highest out of 384 U.S. metro areas)
- Population: 144,890
Tennessee: Kingsport-Bristol

Source: DenisTangneyJr / iStock via Getty Images
- Household income (median): $65,254 – the lowest of 10 metro areas in state
- Statewide median household income: $65,254 – #40 highest of 50 states
- Poverty rate of the metro area: 44,438 (14.5% – #135 highest out of 384 U.S. metro areas)
- Households with an income of under $10,000: 7,265 (5.5% – #188 highest out of 384 U.S. metro areas)
- Population: 310,483
Texas: Texarkana
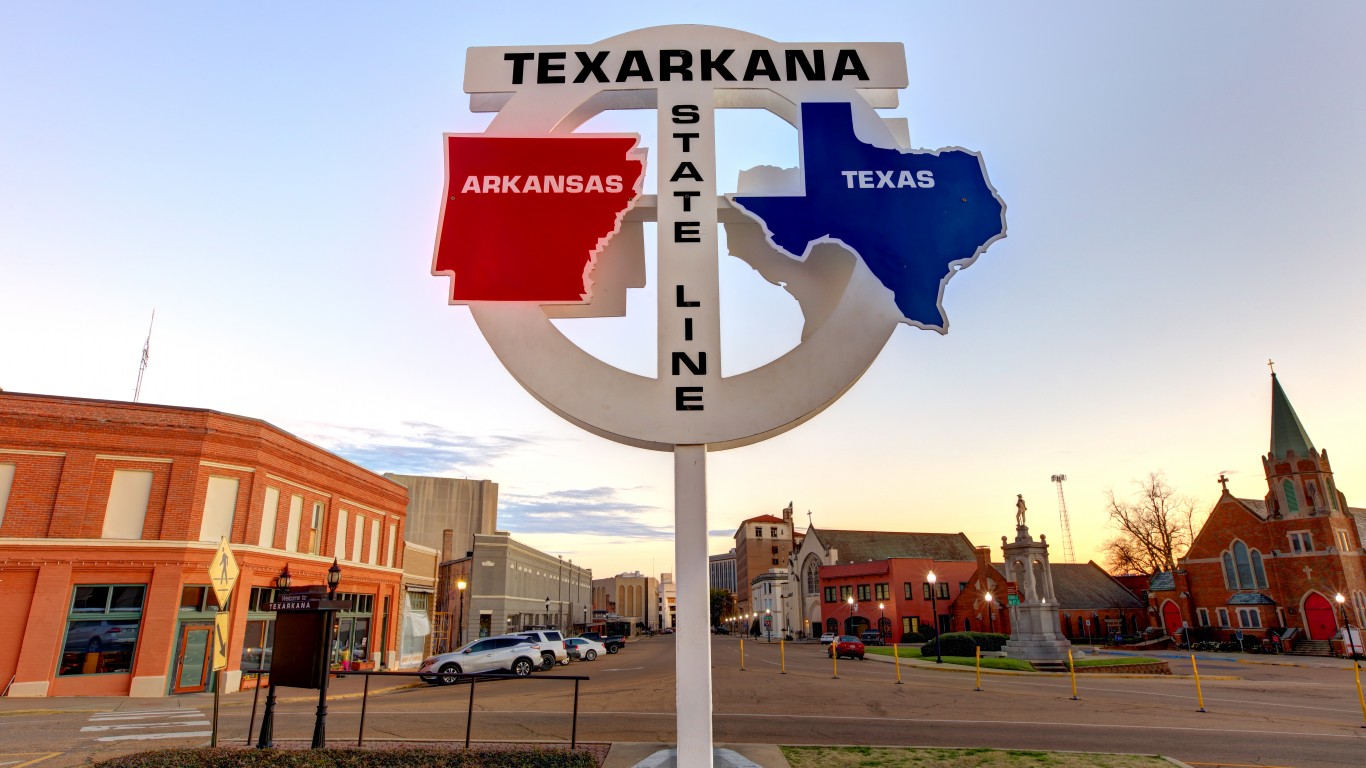
Source: DenisTangneyJr / iStock via Getty Images
- Household income (median): $72,284 – the lowest of 25 metro areas in state
- Statewide median household income: $72,284 – #24 highest of 50 states
- Poverty rate of the metro area: 29,830 (21.6% – #10 highest out of 384 U.S. metro areas)
- Households with an income of under $10,000: 6,031 (10.8% – #5 highest out of 384 U.S. metro areas)
- Population: 144,322
Utah: St. George

Source: Layne V. Naylor / Shutterstock.com
- Household income (median): $89,168 – the lowest of 5 metro areas in state
- Statewide median household income: $89,168 – #9 highest of 50 states
- Poverty rate of the metro area: 20,179 (10.3% – #308 highest out of 384 U.S. metro areas)
- Households with an income of under $10,000: 1,969 (2.7% – #380 highest out of 384 U.S. metro areas)
- Population: 197,680
Vermont: Burlington-South Burlington

Source: Sean Pavone / Shutterstock.com
- Household income (median): $73,991 (only metro area in state, lowest by default)
- Statewide median household income: $73,991 – #20 highest of 50 states
- Poverty rate of the metro area: 22,814 (10.5% – #301 highest out of 384 U.S. metro areas)
- Households with an income of under $10,000: 4,654 (4.8% – #262 highest out of 384 U.S. metro areas)
- Population: 228,270
Virginia: Lynchburg

Source: Sean Pavone / Shutterstock.com
- Household income (median): $85,873 – the lowest of 9 metro areas in state
- Statewide median household income: $85,873 – #12 highest of 50 states
- Poverty rate of the metro area: 32,466 (13.0% – #191 highest out of 384 U.S. metro areas)
- Households with an income of under $10,000: 4,757 (4.6% – #280 highest out of 384 U.S. metro areas)
- Population: 262,458
Washington: Yakima

Source: brostad / Flickr
- Household income (median): $91,306 – the lowest of 11 metro areas in state
- Statewide median household income: $91,306 – #6 highest of 50 states
- Poverty rate of the metro area: 42,108 (16.6% – #82 highest out of 384 U.S. metro areas)
- Households with an income of under $10,000: 4,661 (5.3% – #202 highest out of 384 U.S. metro areas)
- Population: 257,001
West Virginia: Beckley

Source: J K Laws / Shutterstock.com
- Household income (median): $54,329 – the lowest of 7 metro areas in state
- Statewide median household income: $54,329 – #49 highest of 50 states
- Poverty rate of the metro area: 21,439 (19.8% – #21 highest out of 384 U.S. metro areas)
- Households with an income of under $10,000: 4,452 (10.1% – #9 highest out of 384 U.S. metro areas)
- Population: 112,369
Wisconsin: Sheboygan
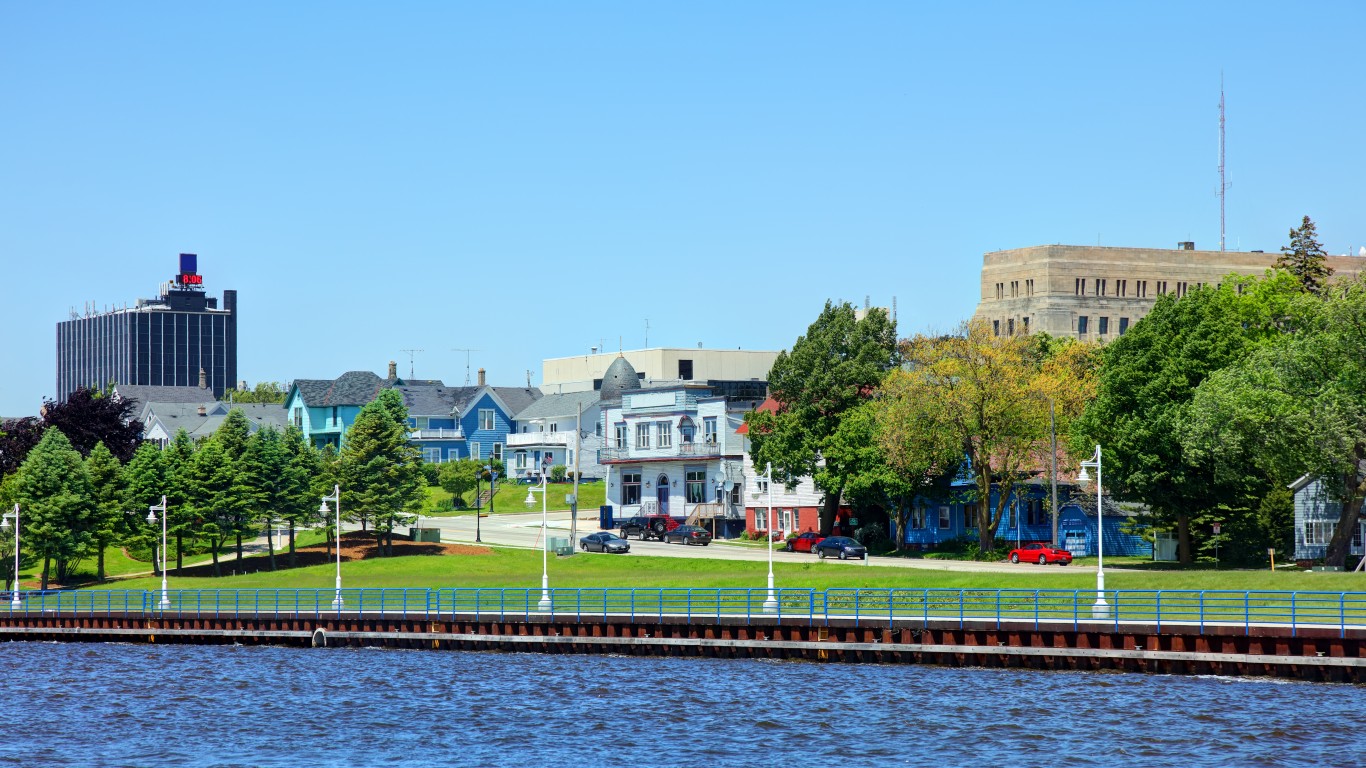
Source: DenisTangneyJr / iStock via Getty Images
- Household income (median): $70,996 – the lowest of 12 metro areas in state
- Statewide median household income: $70,996 – #27 highest of 50 states
- Poverty rate of the metro area: 11,395 (10.0% – #320 highest out of 384 U.S. metro areas)
- Households with an income of under $10,000: 2,999 (5.9% – #150 highest out of 384 U.S. metro areas)
- Population: 117,841
Wyoming: Casper
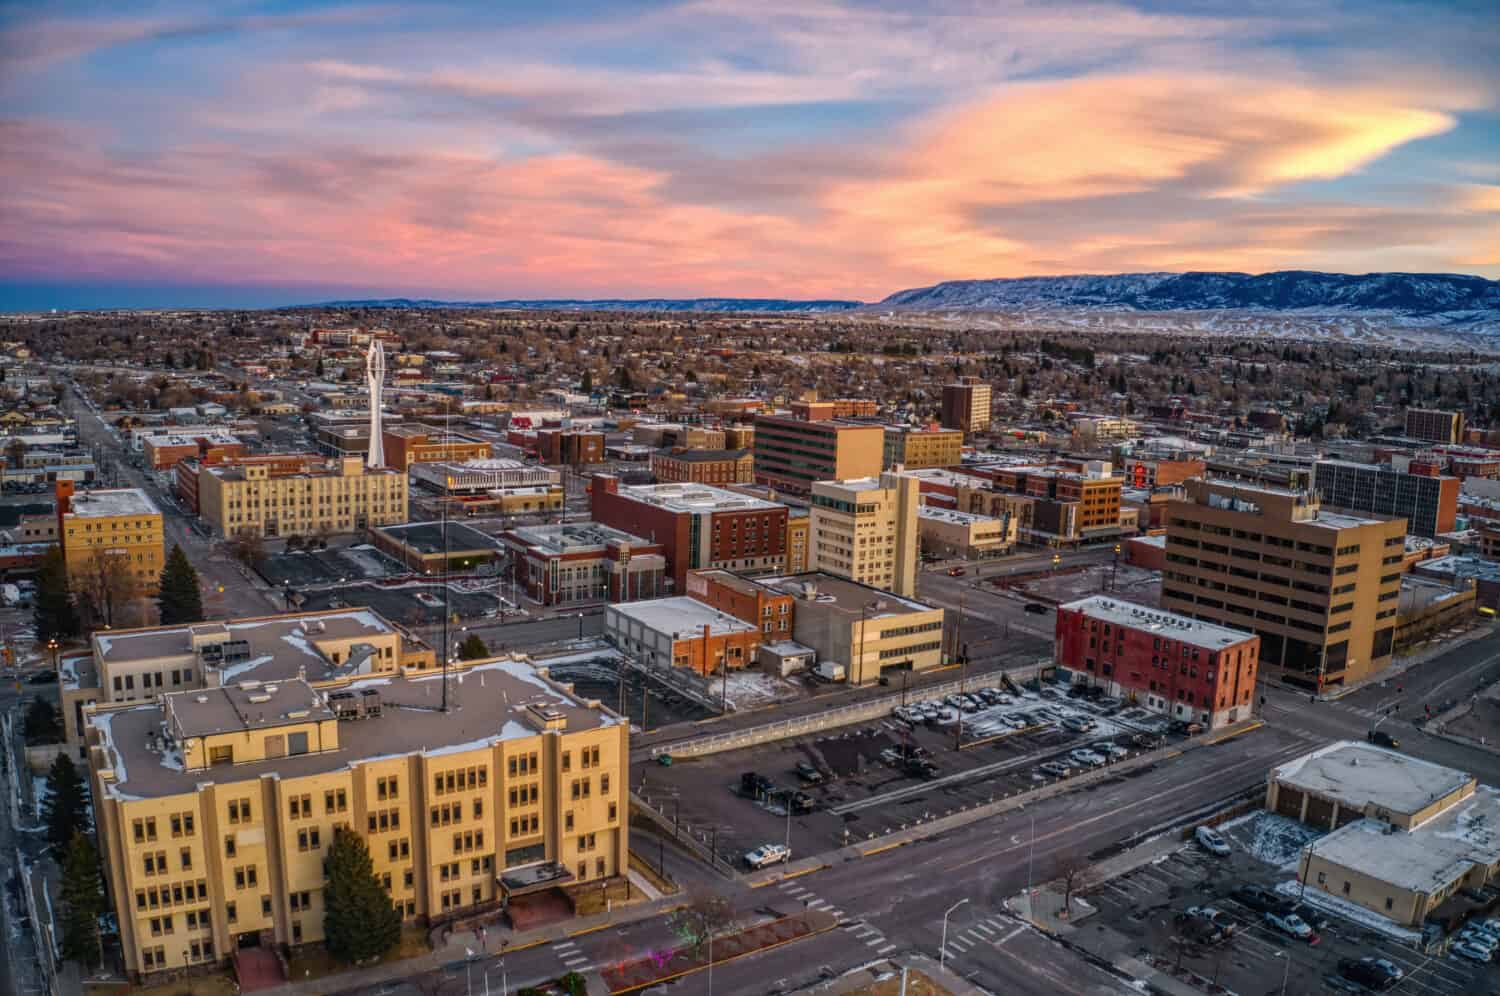
Source: Jacob Boomsma / Shutterstock.com
- Household income (median): $70,042 – the lowest of 2 metro areas in state
- Statewide median household income: $70,042 – #28 highest of 50 states
- Poverty rate of the metro area: 7,047 (9.0% – #347 highest out of 384 U.S. metro areas)
- Households with an income of under $10,000: 1,031 (3.1% – #373 highest out of 384 U.S. metro areas)
- Population: 79,601
Smart Investors Are Quietly Loading Up on These “Dividend Legends” (Sponsored)
If you want your portfolio to pay you cash like clockwork, it’s time to stop blindly following conventional wisdom like relying on Dividend Aristocrats. There’s a better option, and we want to show you. We’re offering a brand-new report on 2 stocks we believe offer the rare combination of a high dividend yield and significant stock appreciation upside. If you’re tired of feeling one step behind in this market, this free report is a must-read for you.
Click here to download your FREE copy of “2 Dividend Legends to Hold Forever” and start improving your portfolio today.
Thank you for reading! Have some feedback for us?
Contact the 24/7 Wall St. editorial team.
Editors' Picks