
Every year in the United States, tens of millions of Americans move to a new home. According to the U.S. Census Bureau, the bulk of these moves are motivated by personal circumstances, often relating to housing, family, or employment. But when it comes to deciding on a place to live, it can also be helpful to weigh other, less subjective factors.
As a means of gauging and comparing degrees of development between countries — beyond standard measures like gross domestic product and economic growth — the United Nations created the Human Development Index. By accounting for factors related to health and well-being, educational attainment, and standards of living, the HDI offers an assessment of overall quality of life at the individual level within a given geography.
When applied to communities within the United States, the core principles of the HDI reveal that some parts of the country are far better places to live than others.
Using an index inspired by the HDI, 24/7 Wall St. identified the best counties in Illinois to live in. Counties are ranked on a combination of three measures – average life expectancy at birth, the share of adults with a bachelor’s degree or higher, and the poverty rate. Of the 102 counties in Illinois, we ranked the 30 with the highest HDI score.
Across all of Illinois, average life expectancy at birth is 78.6 years. Additionally, 11.8% of the population live below the poverty line and 36.7% of adults have a bachelor’s degree or higher. Of the 30 counties on this list, three compare favorably to the state as a whole in each of these metrics.
Among these 30 Illinois counties, average life expectancy at birth ranges from 76.3 years to 81.9 years. Meanwhile, poverty rates vary between 4.3% and 18.7%, and bachelor’s degree attainment rates range from about 20% to over 50%.
Data used to calculate rankings are from the U.S. Census Bureau’s 2022 American Community Survey and County Health Rankings & Roadmaps, a joint program of the Robert Wood Johnson Foundation and the University of Wisconsin Population Health Institute. All ACS data are five-year averages.
Why It Matters

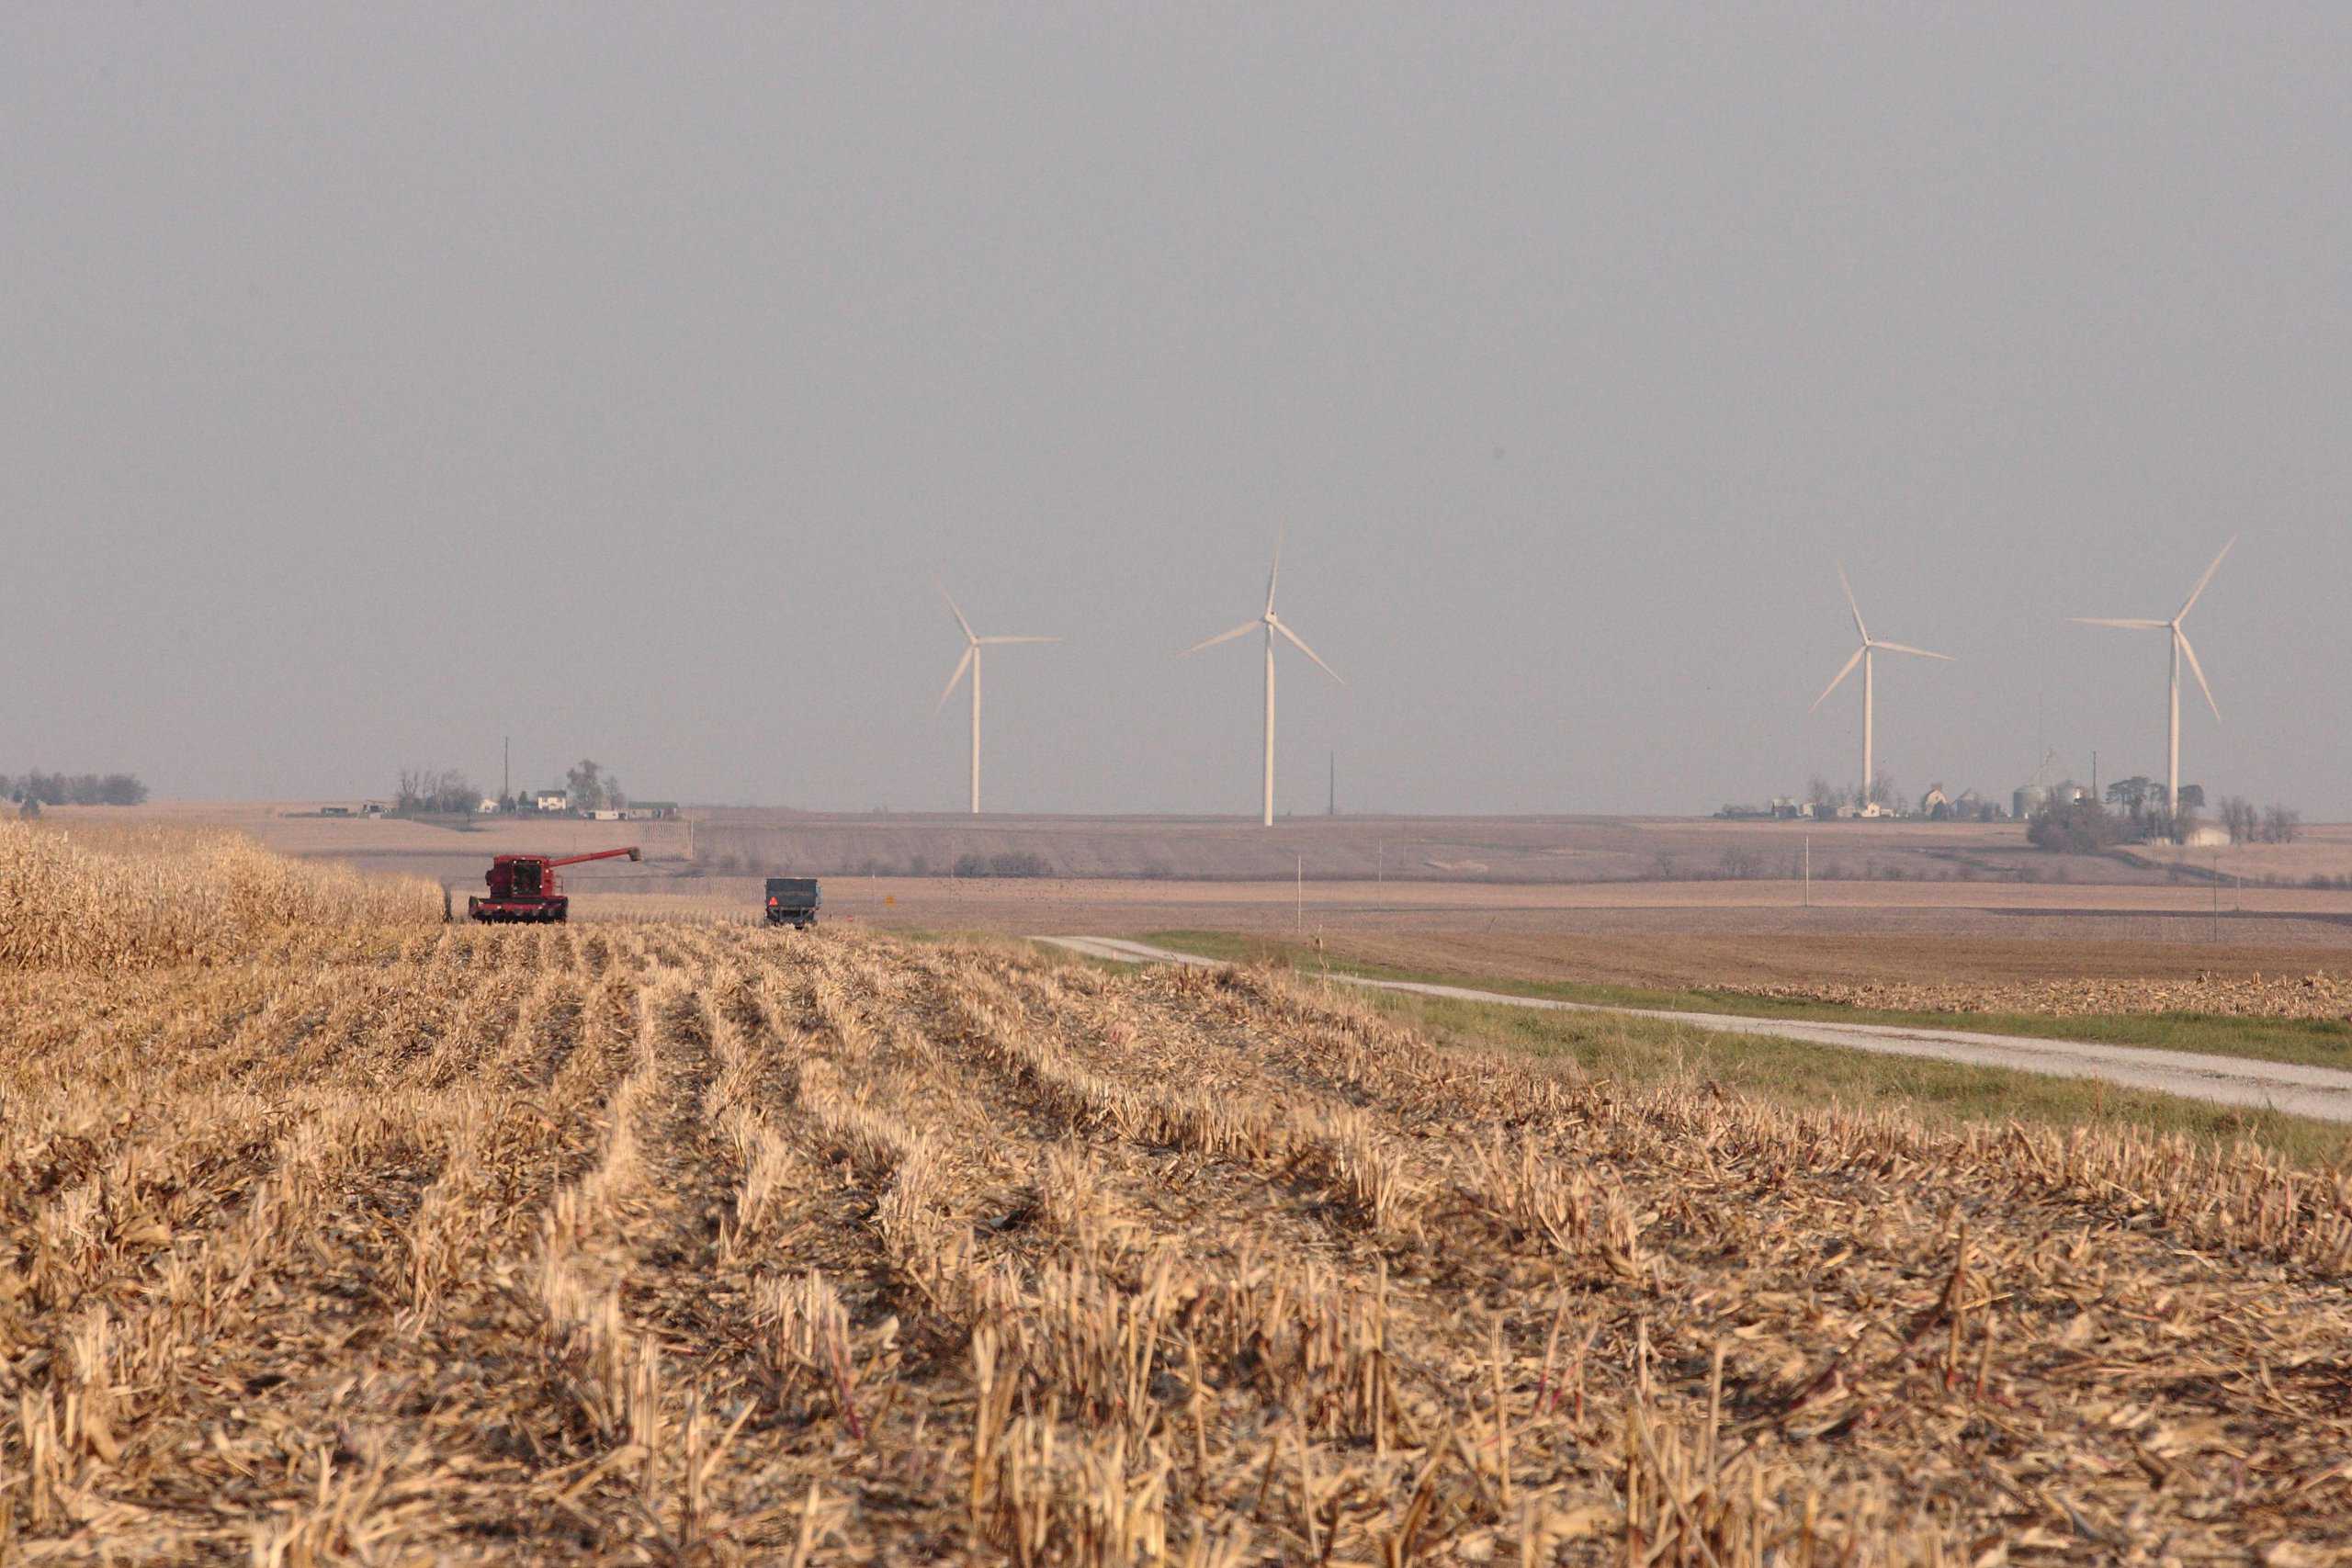
Source: Darren415 / iStock via Getty Images
Many of the most commonly cited economic indicators — including unemployment, GDP, and industrial output — are useful gauges of prosperity and productive capacity in a given area. But when it comes to measuring overall quality of life, any single metric inevitably falls short. To address these shortcomings, the HDI combines three key social and economic measures into a single index score, allowing for objective comparisons between communities across the United States.
30. Adams County

Source: Public Domain / Wikimedia Commons
- Avg. life expectancy at birth: 77.8 years
- Poverty rate: 12.1%
- Adults with a bachelor’s degree: 26.9%
- Median household income: $63,767
- Population: 65,583
29. Madison County
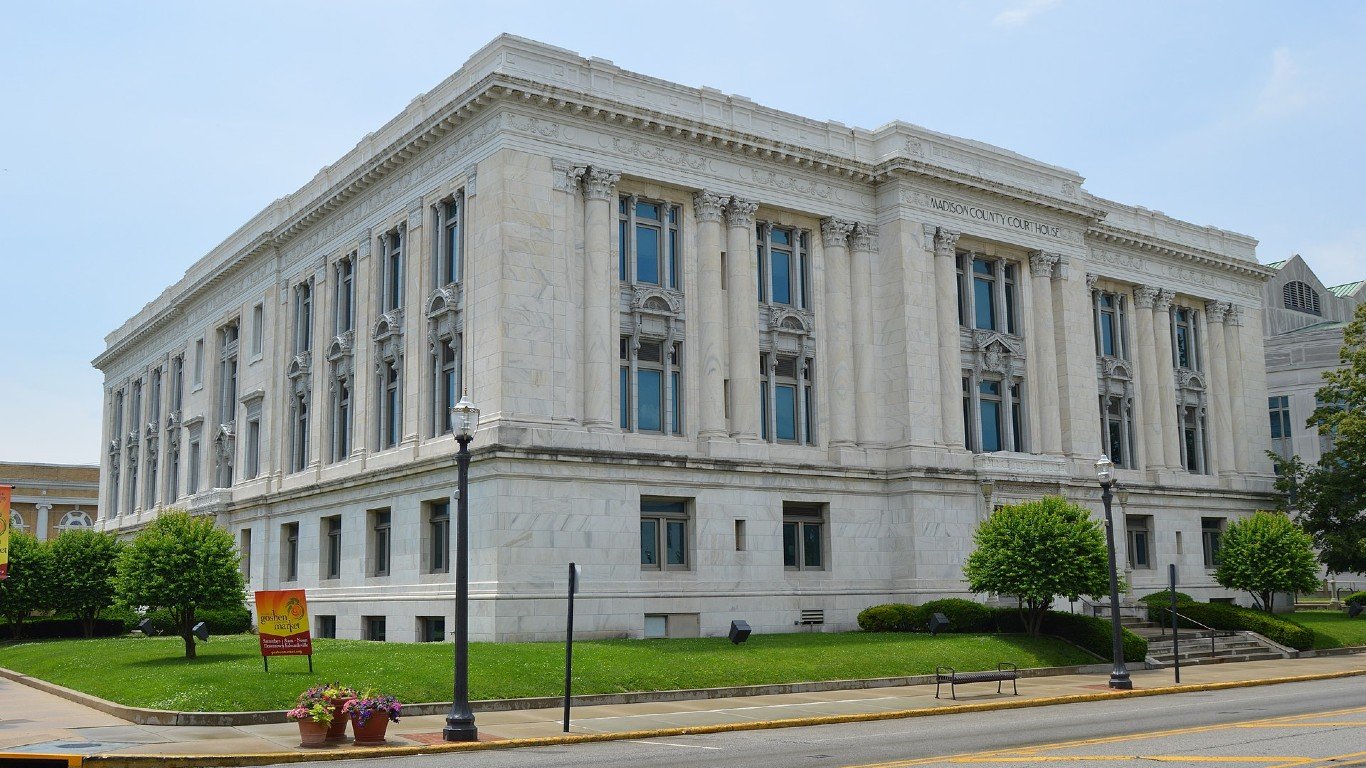
Source: By Nyttend - Own work, Public Domain, https://commons.wikimedia.org/w/index.php?curid=33203519 / Wikimedia Commons
- Avg. life expectancy at birth: 76.3 years
- Poverty rate: 12.0%
- Adults with a bachelor’s degree: 29.4%
- Median household income: $71,759
- Population: 265,512
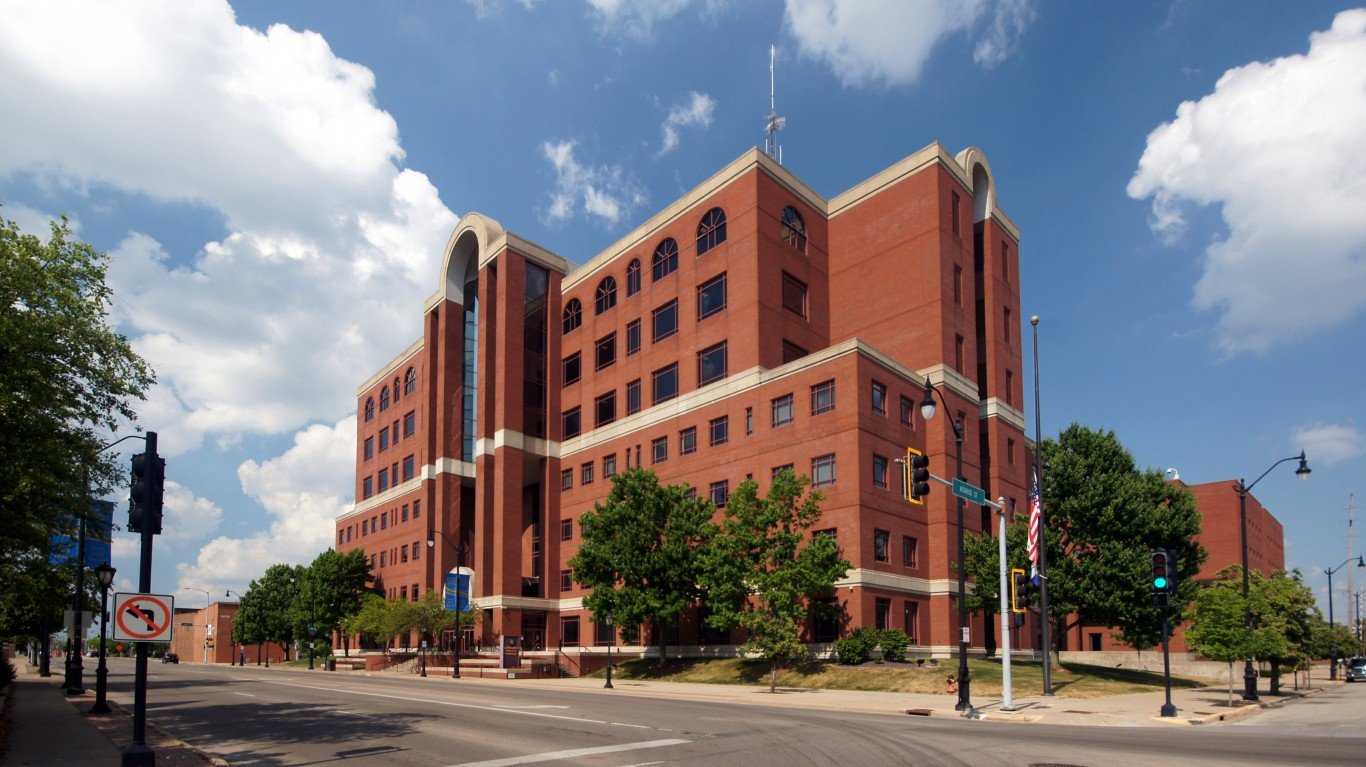
28. Peoria County

Source: ghornephoto / iStock via Getty Images
- Avg. life expectancy at birth: 76.8 years
- Poverty rate: 15.5%
- Adults with a bachelor’s degree: 33.7%
- Median household income: $63,409
- Population: 181,186
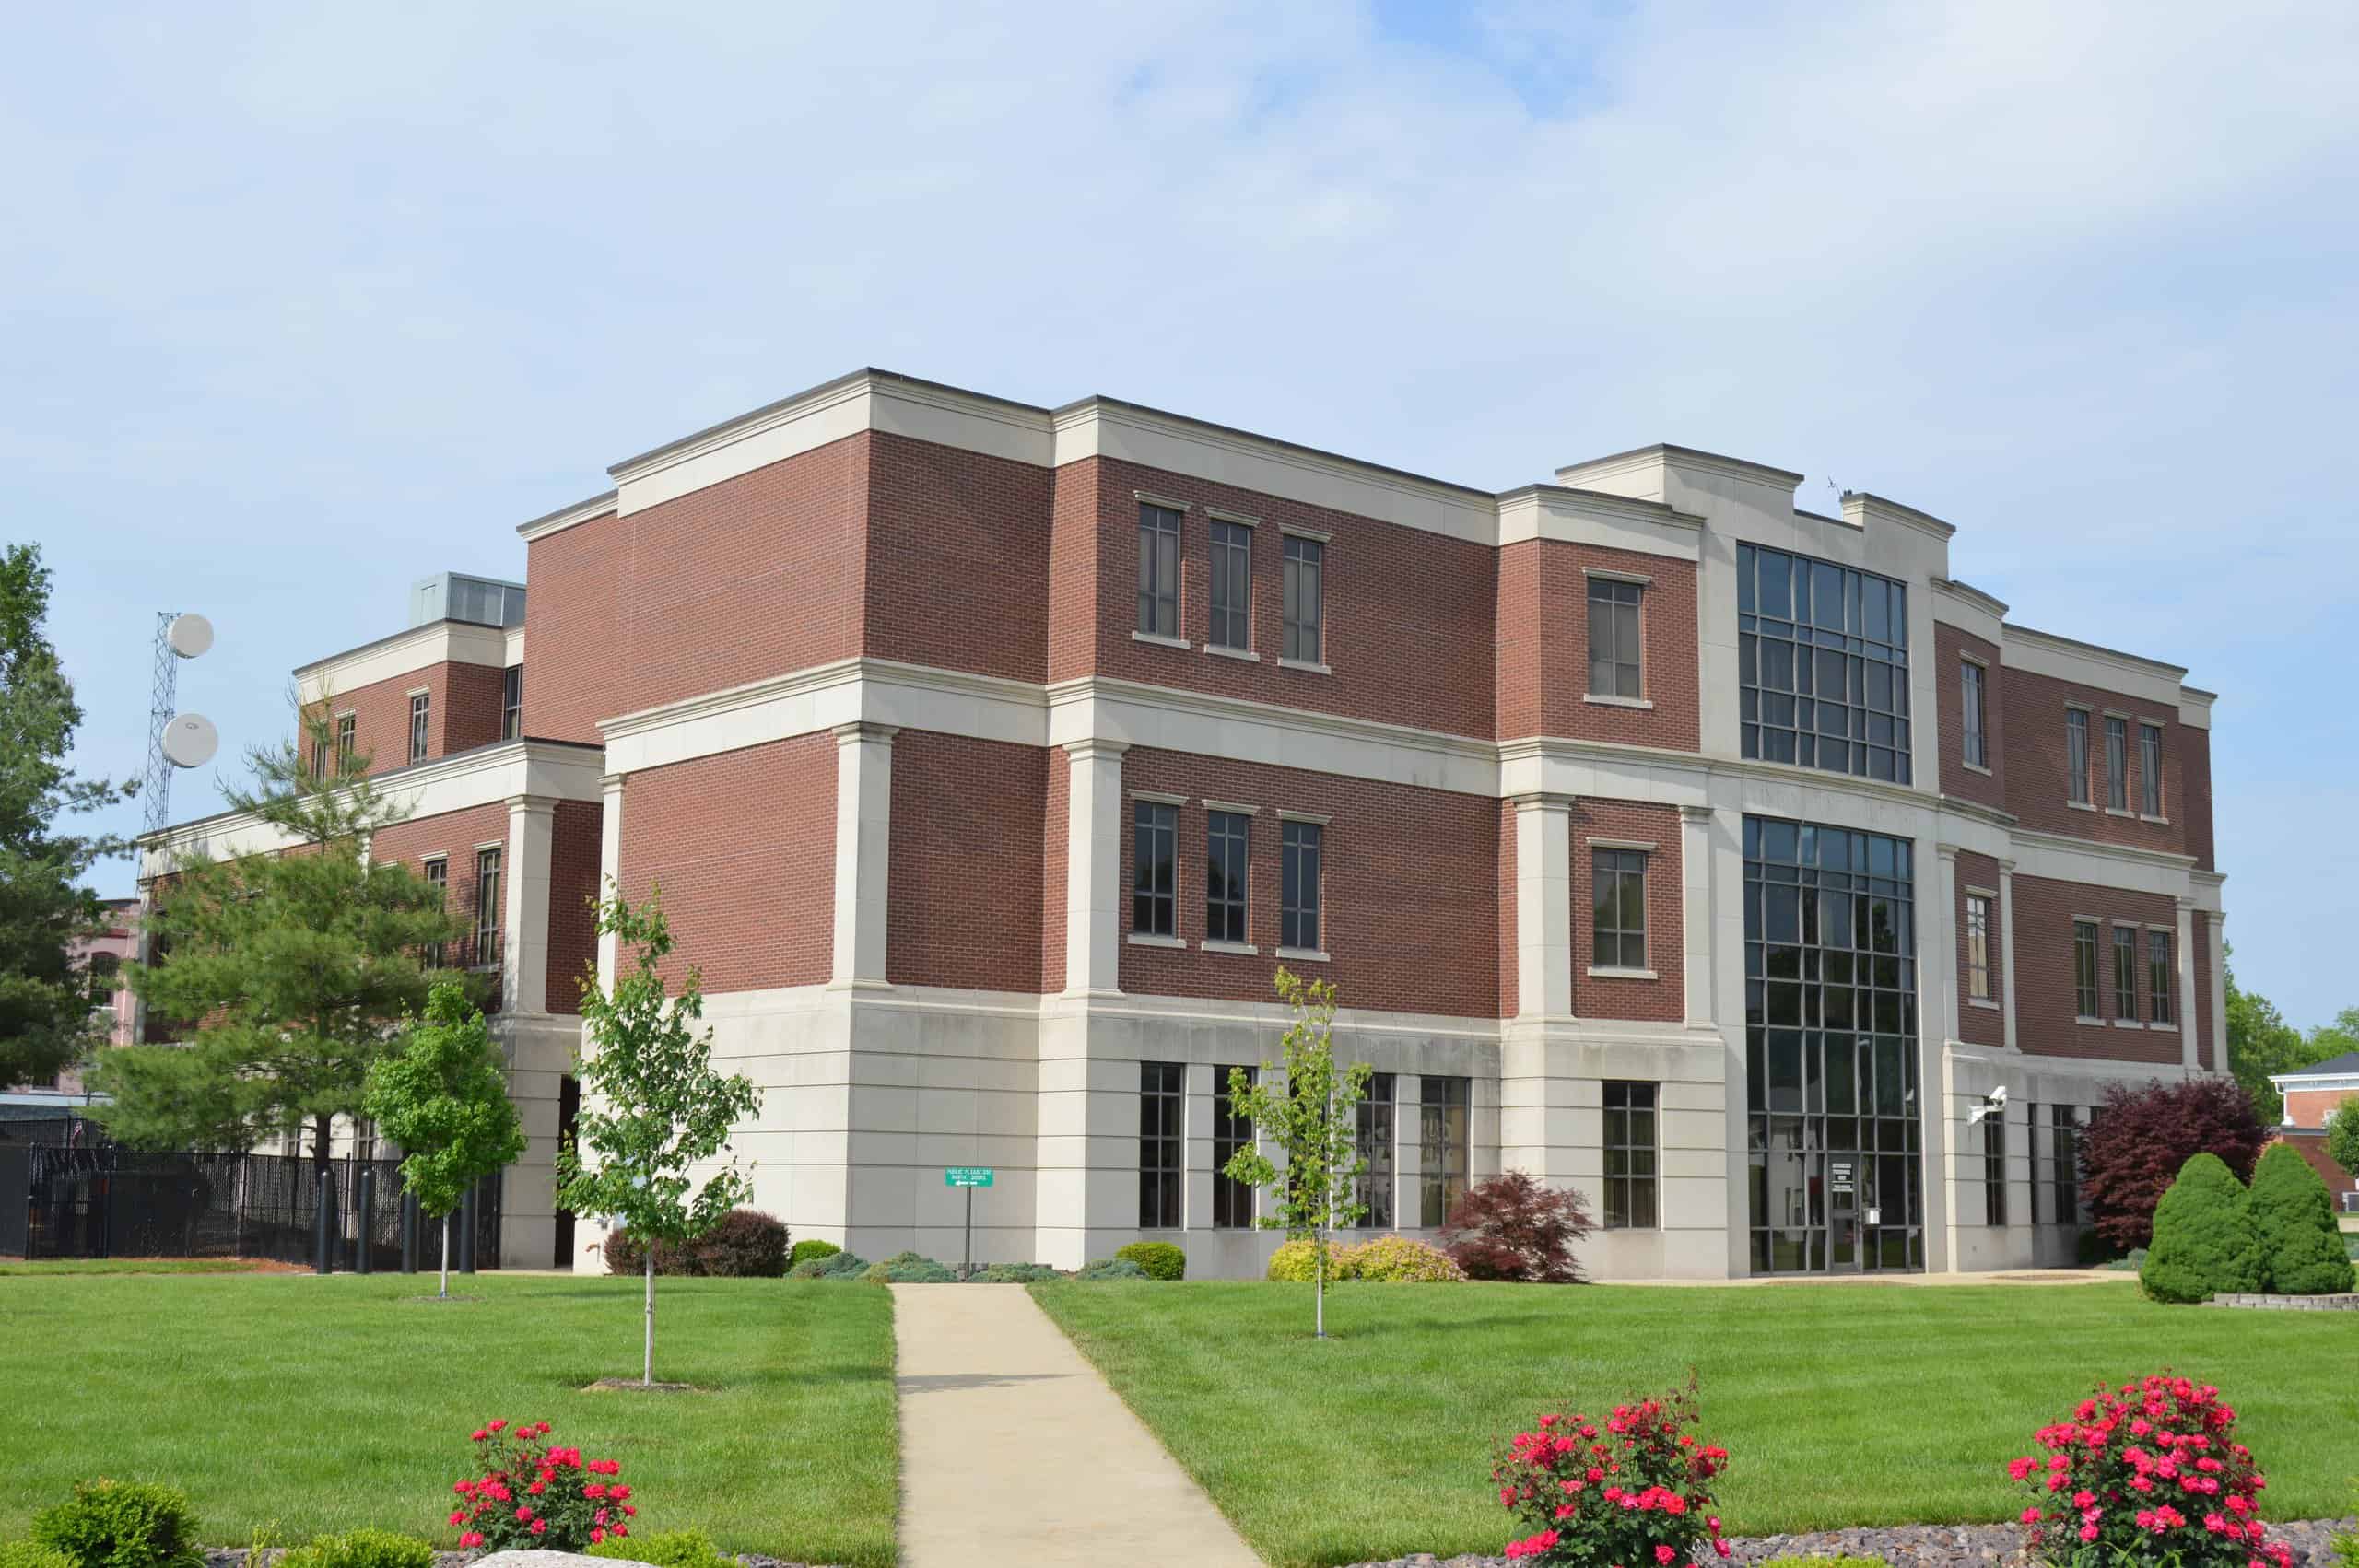
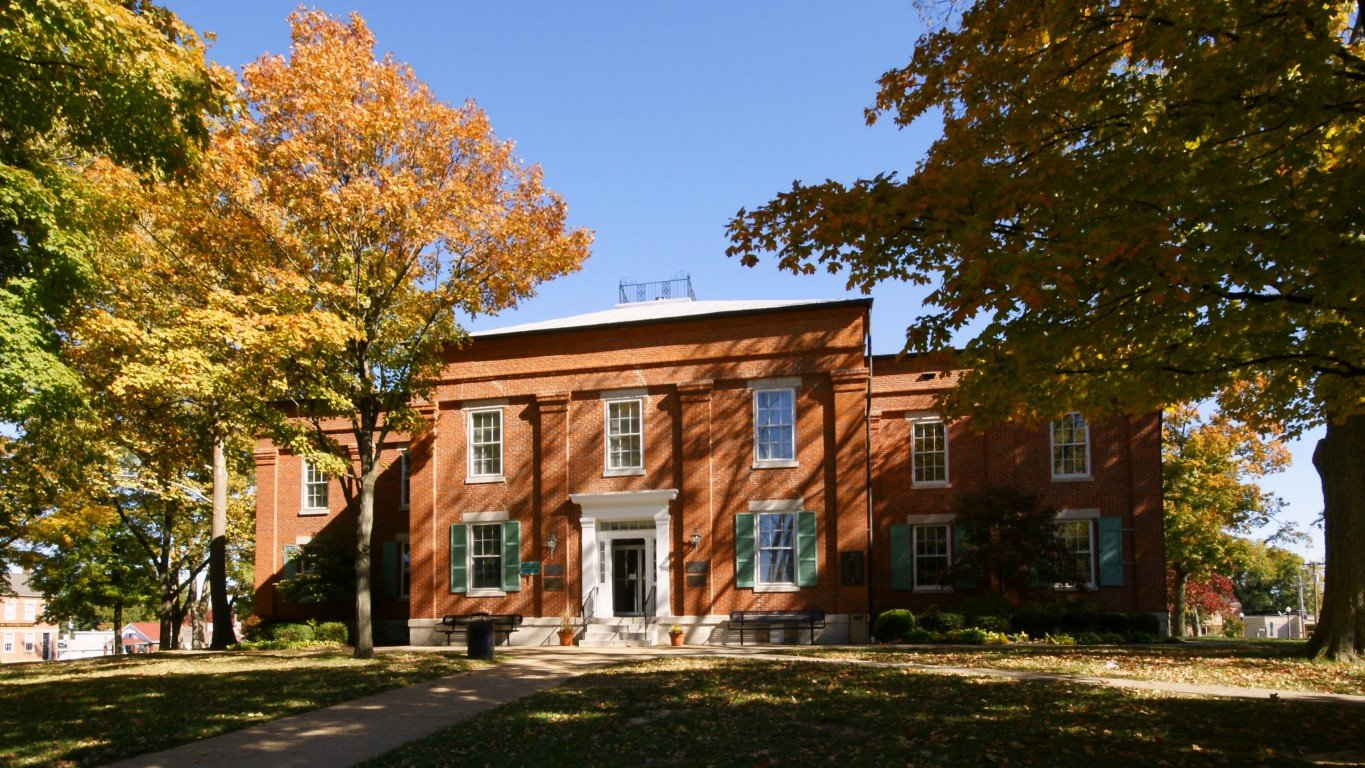
27. Effingham County

Source: Public Domain / Wikimedia Commons
- Avg. life expectancy at birth: 77.7 years
- Poverty rate: 10.8%
- Adults with a bachelor’s degree: 25.9%
- Median household income: $73,181
- Population: 34,594
26. Calhoun County

- Avg. life expectancy at birth: 80.4 years
- Poverty rate: 8.4%
- Adults with a bachelor’s degree: 19.5%
- Median household income: $88,059
- Population: 4,472
25. Henry County
Source: Nicola Patterson / iStock via Getty Images
- Avg. life expectancy at birth: 78.1 years
- Poverty rate: 9.2%
- Adults with a bachelor’s degree: 24.7%
- Median household income: $66,313
- Population: 49,157
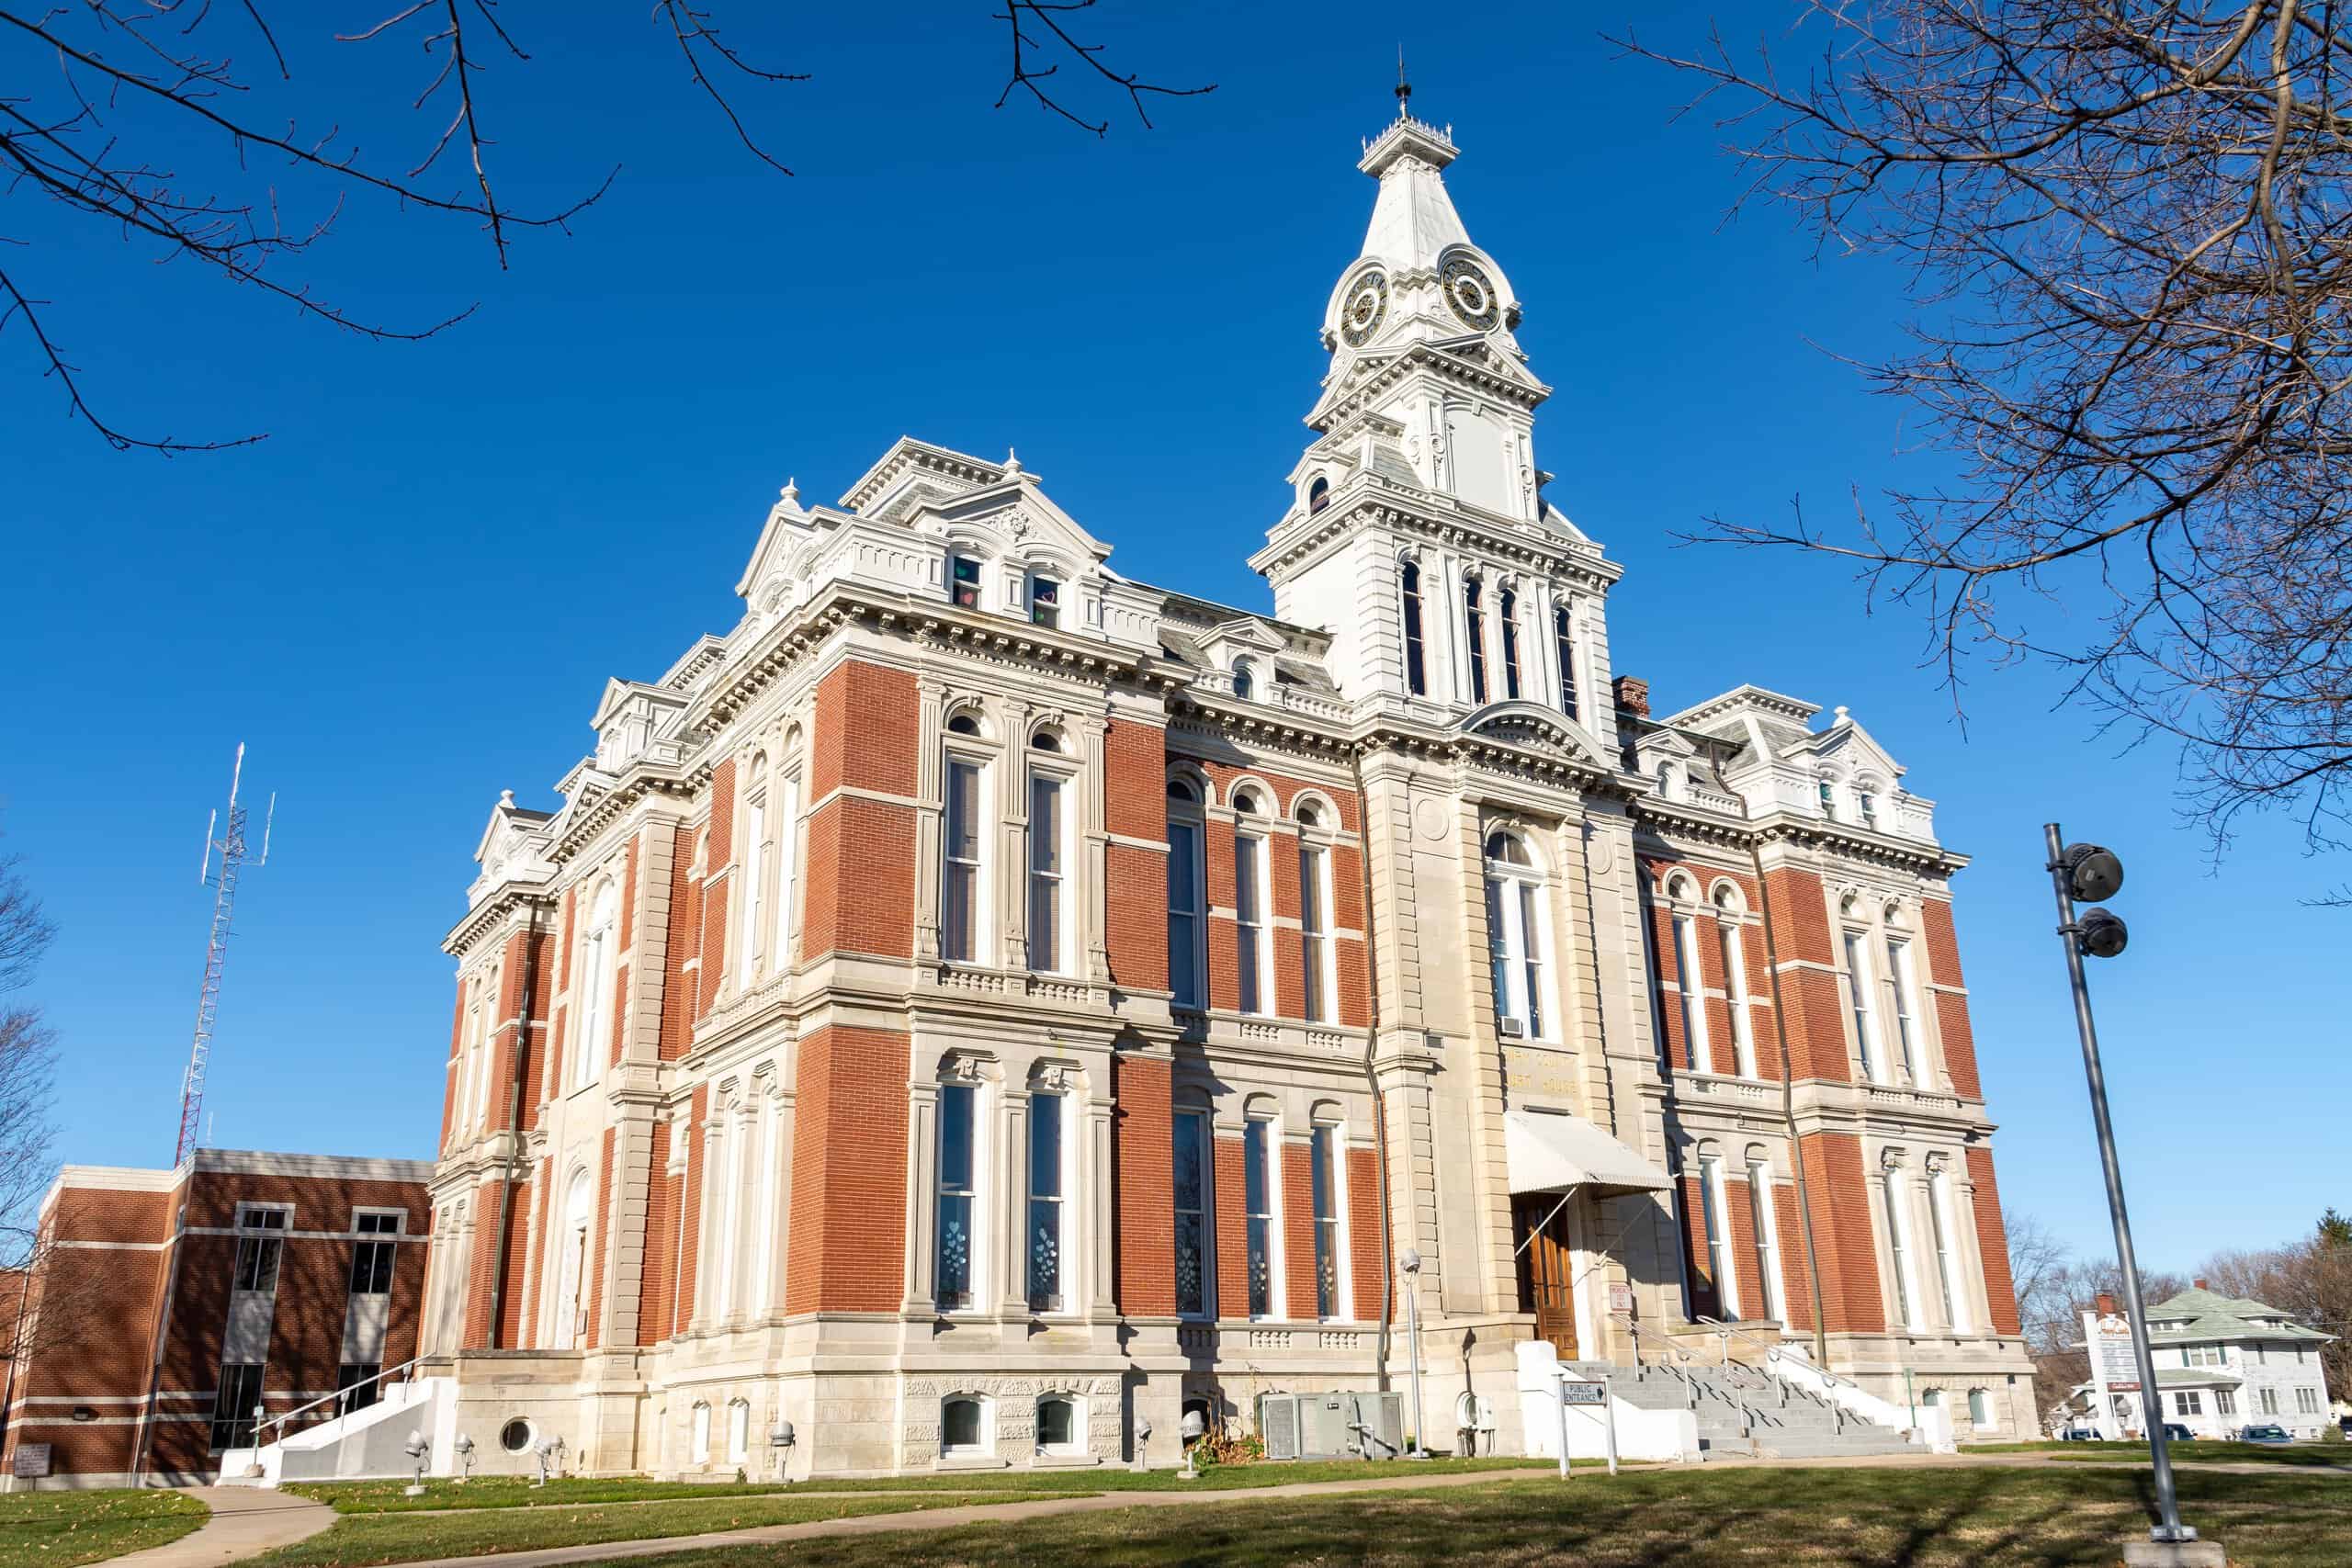
24. Boone County
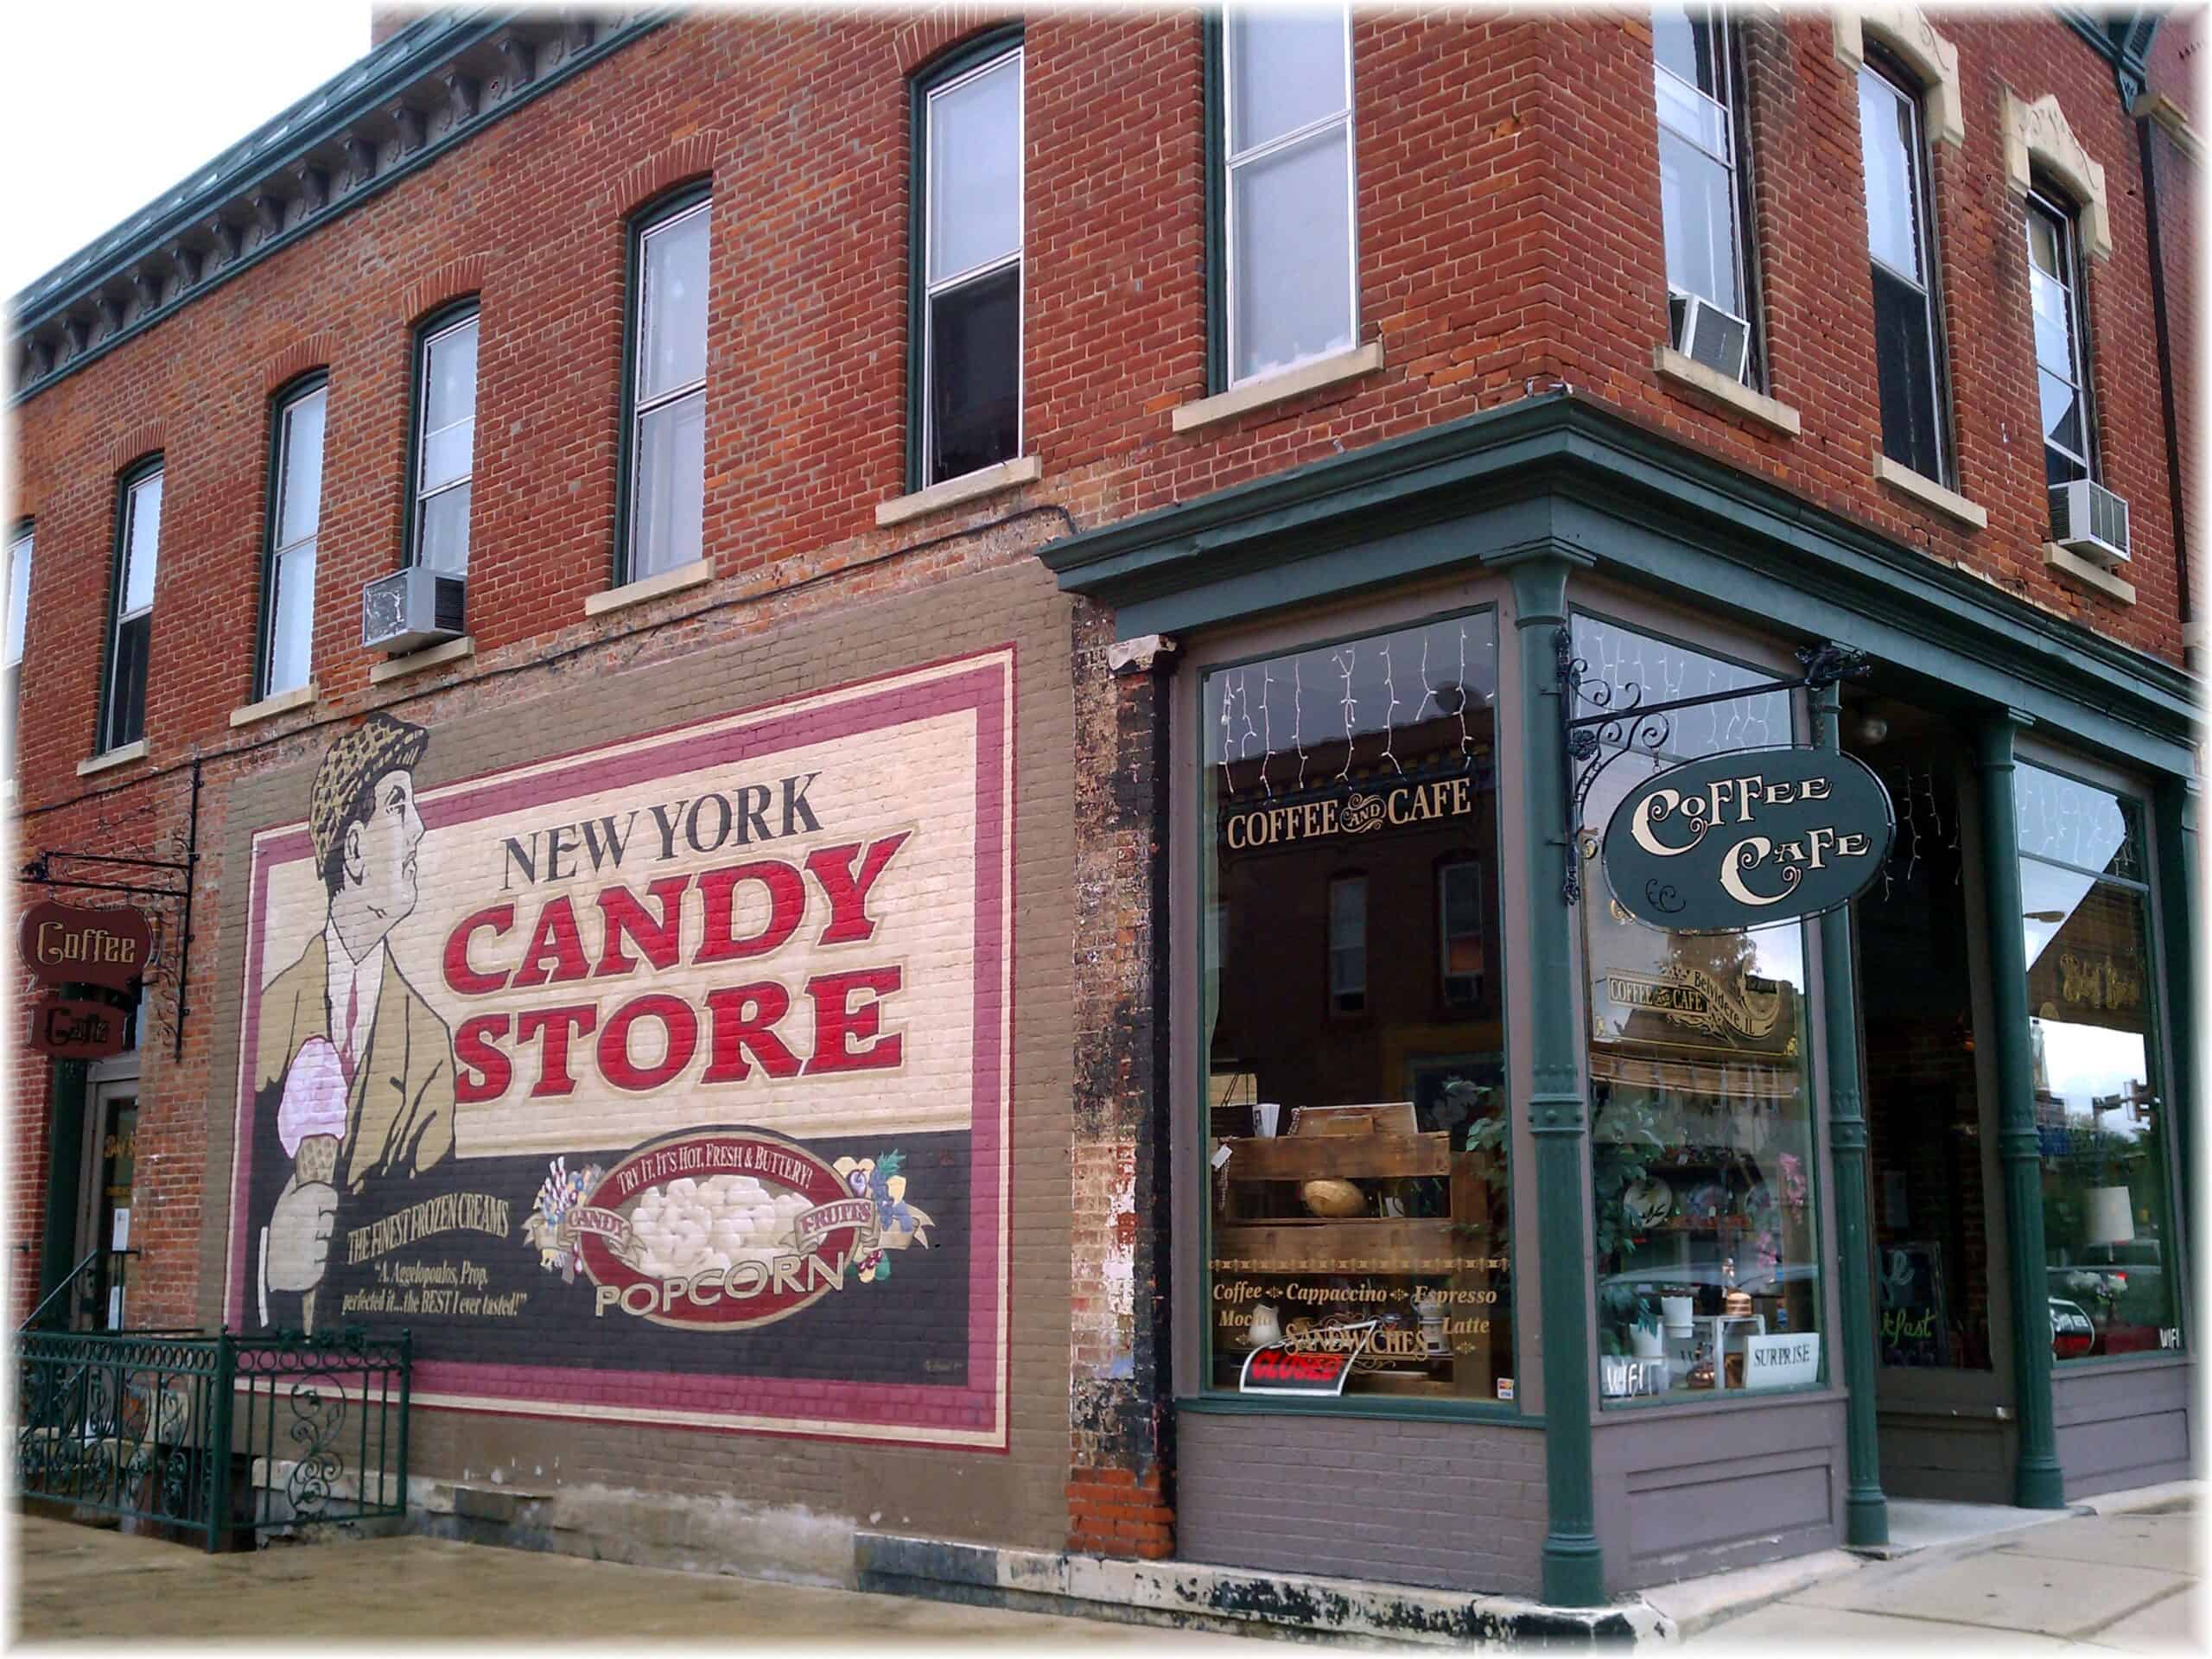
Source: RSchulenburg / Wikimedia Commons
- Avg. life expectancy at birth: 79.3 years
- Poverty rate: 9.8%
- Adults with a bachelor’s degree: 24.0%
- Median household income: $80,502
- Population: 53,459
23. Ogle County

- Avg. life expectancy at birth: 78.5 years
- Poverty rate: 8.3%
- Adults with a bachelor’s degree: 23.4%
- Median household income: $75,782
- Population: 51,672
22. Jasper County
Source: Public Domain / Wikimedia Commons
- Avg. life expectancy at birth: 81.2 years
- Poverty rate: 9.2%
- Adults with a bachelor’s degree: 21.4%
- Median household income: $67,429
- Population: 9,295
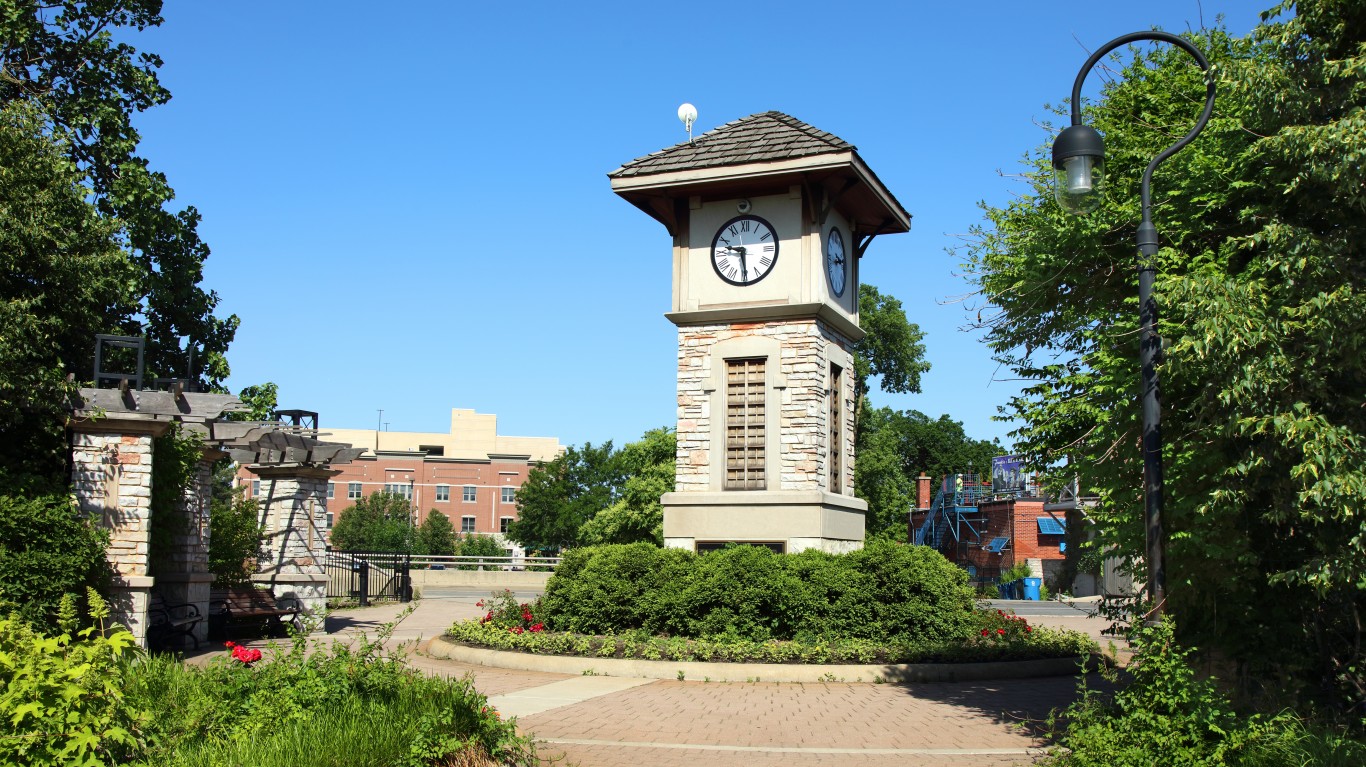
21. DeKalb County

Source: jenjen42 / E+ via Getty Images
- Avg. life expectancy at birth: 78.7 years
- Poverty rate: 15.4%
- Adults with a bachelor’s degree: 34.1%
- Median household income: $68,617
- Population: 100,686
20. Washington County

- Avg. life expectancy at birth: 79.4 years
- Poverty rate: 8.0%
- Adults with a bachelor’s degree: 23.1%
- Median household income: $75,111
- Population: 13,781
19. Putnam County

Source: EJ_Rodriquez / iStock via Getty Images
- Avg. life expectancy at birth: 80.8 years
- Poverty rate: 8.8%
- Adults with a bachelor’s degree: 23.5%
- Median household income: $75,726
- Population: 5,628
18. Tazewell County

Source: benkrut / iStock via Getty Images
- Avg. life expectancy at birth: 78.3 years
- Poverty rate: 8.7%
- Adults with a bachelor’s degree: 27.5%
- Median household income: $74,606
- Population: 131,276
17. Grundy County

Source: benkrut / iStock via Getty Images
- Avg. life expectancy at birth: 77.2 years
- Poverty rate: 6.0%
- Adults with a bachelor’s degree: 25.7%
- Median household income: $89,993
- Population: 52,624
16. Sangamon County
Source: BOB WESTON / Getty Images
- Avg. life expectancy at birth: 77.7 years
- Poverty rate: 12.9%
- Adults with a bachelor’s degree: 34.6%
- Median household income: $71,653
- Population: 196,122
15. Clinton County
Source: Public Domain / Wikimedia Commons
- Avg. life expectancy at birth: 80.2 years
- Poverty rate: 7.2%
- Adults with a bachelor’s degree: 23.6%
- Median household income: $78,054
- Population: 36,998
14. Menard County

Source: Sanya Kushak / iStock via Getty Images
- Avg. life expectancy at birth: 79.9 years
- Poverty rate: 7.9%
- Adults with a bachelor’s degree: 25.9%
- Median household income: $84,846
- Population: 12,284
13. Jo Daviess County
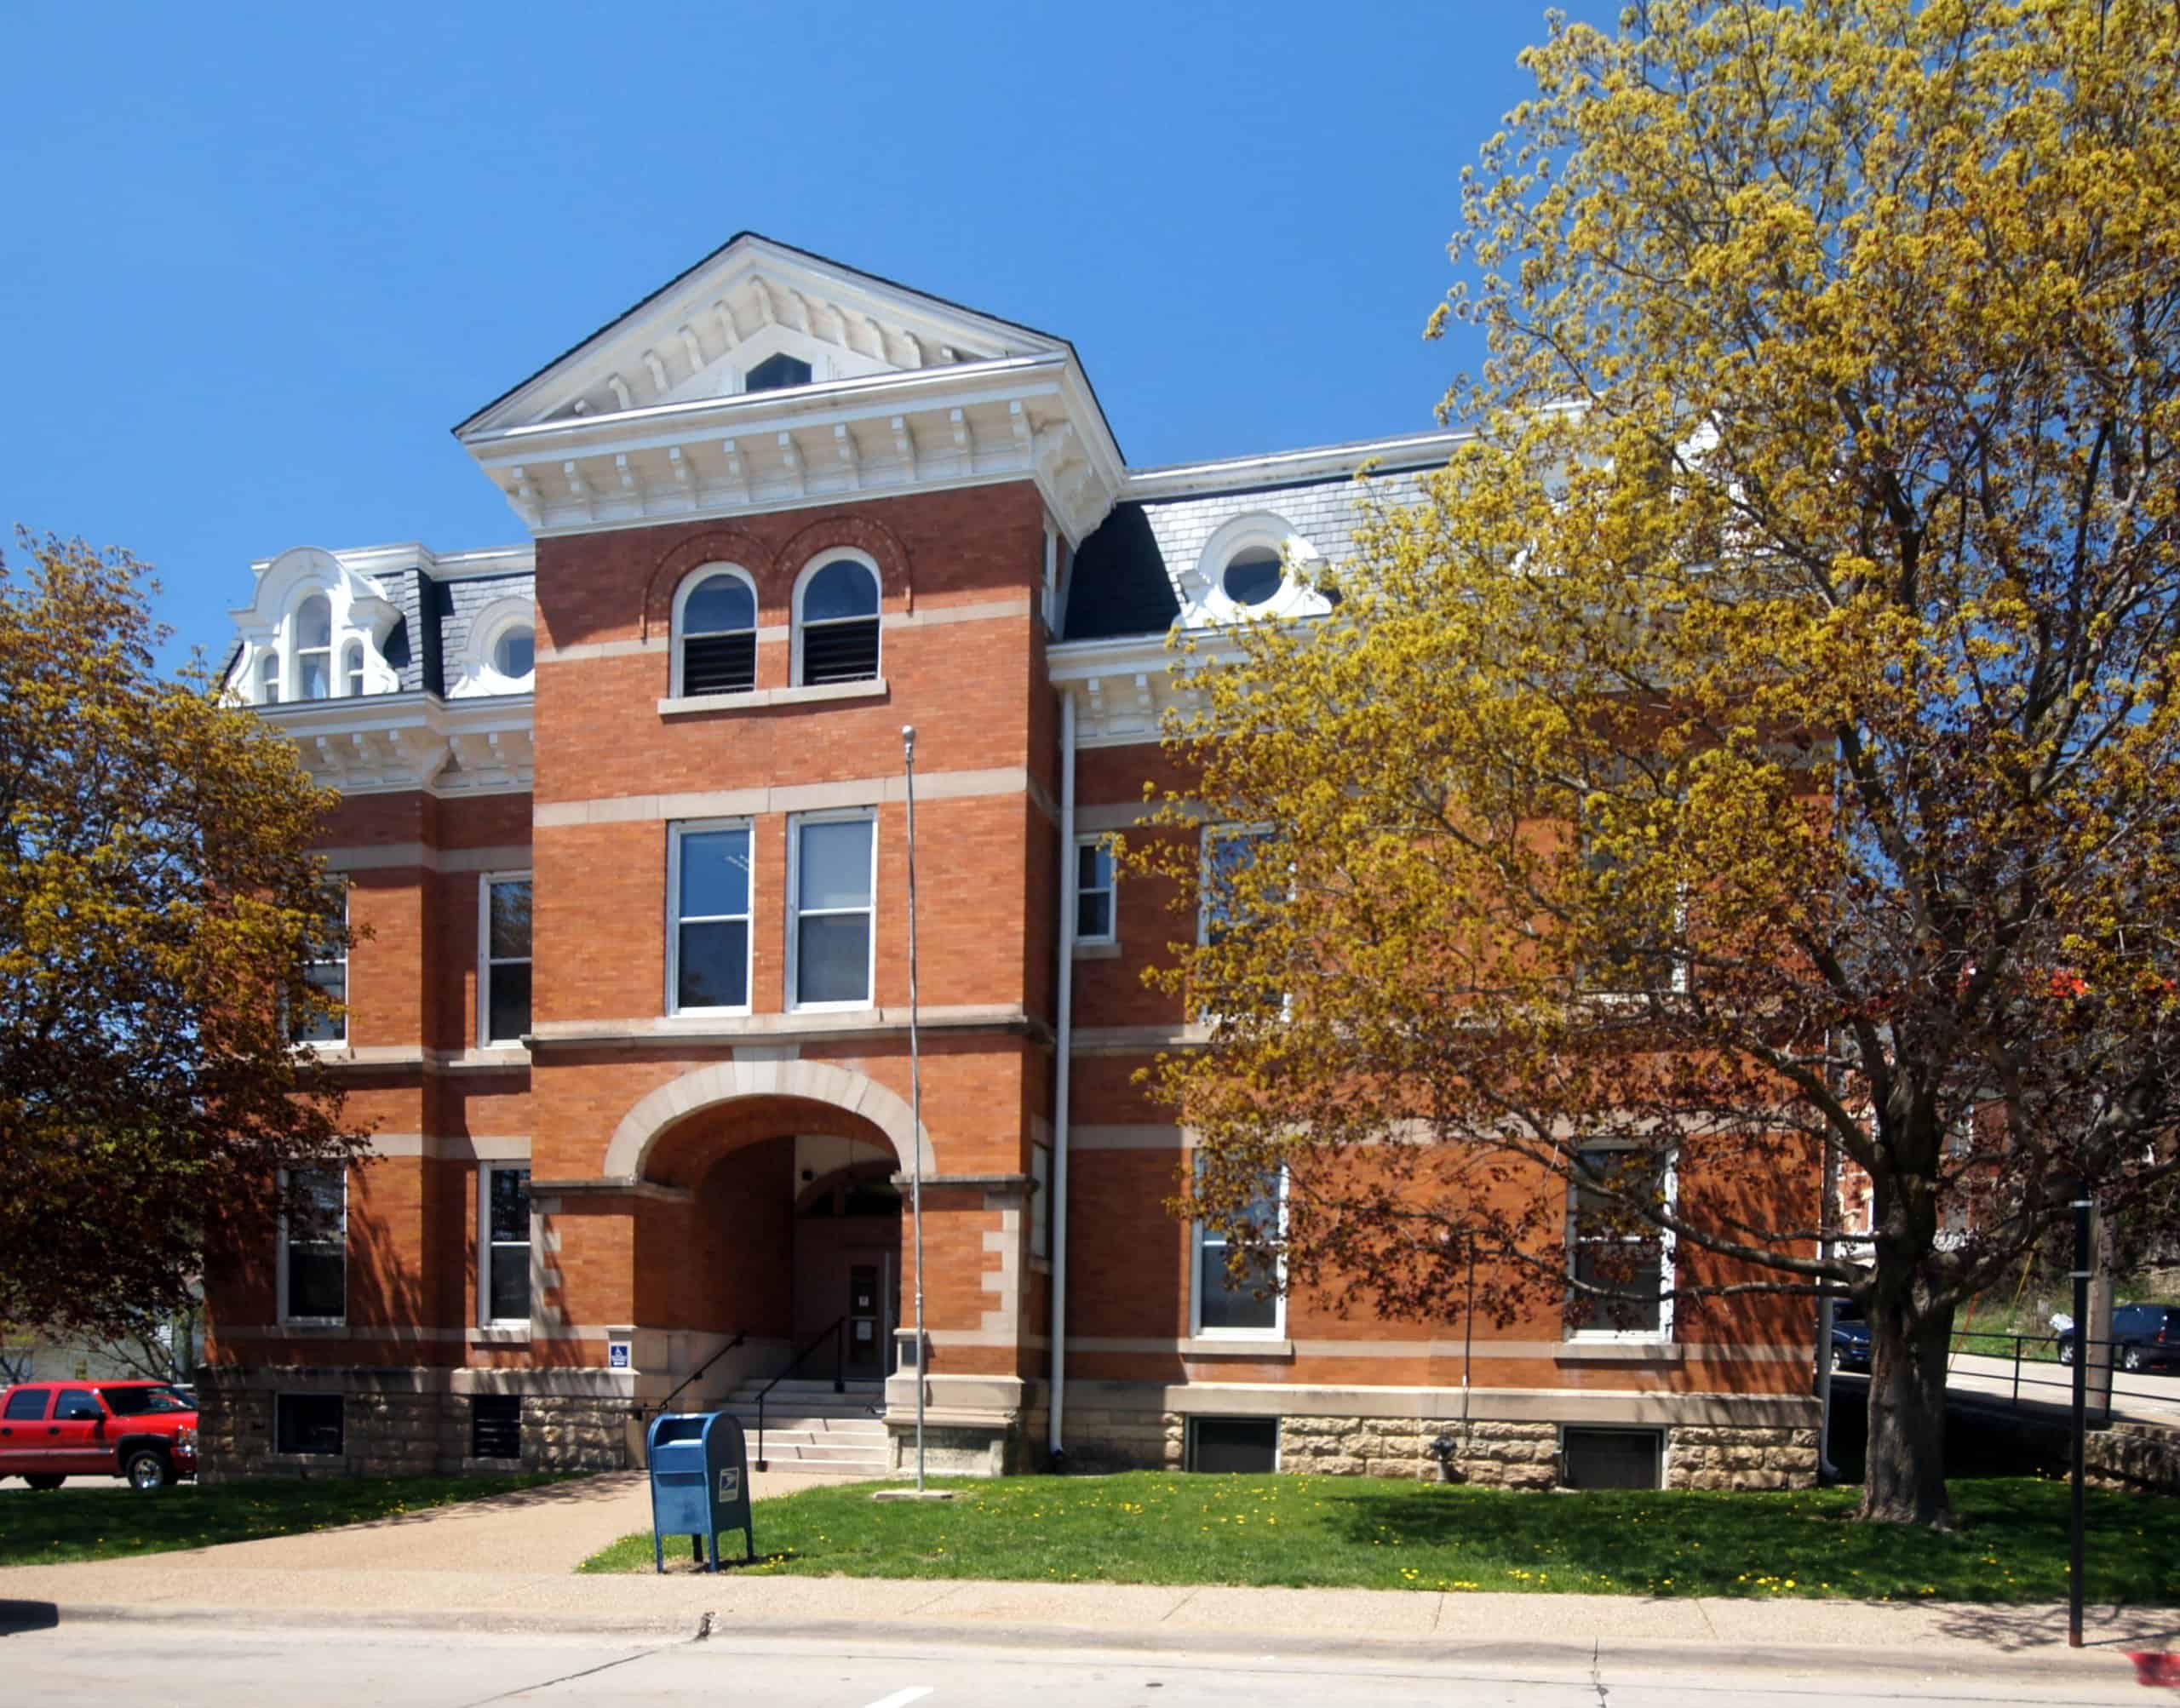
Source: BOB WESTON / iStock via Getty Images
- Avg. life expectancy at birth: 80.5 years
- Poverty rate: 7.8%
- Adults with a bachelor’s degree: 27.9%
- Median household income: $67,729
- Population: 21,942
12. Champaign County

- Avg. life expectancy at birth: 80.1 years
- Poverty rate: 18.7%
- Adults with a bachelor’s degree: 45.6%
- Median household income: $61,090
- Population: 206,525
11. Cook County

Source: franckreporter / E+ via Getty Images
- Avg. life expectancy at birth: 78.6 years
- Poverty rate: 13.4%
- Adults with a bachelor’s degree: 41.3%
- Median household income: $78,304
- Population: 5,225,367
10. Piatt County
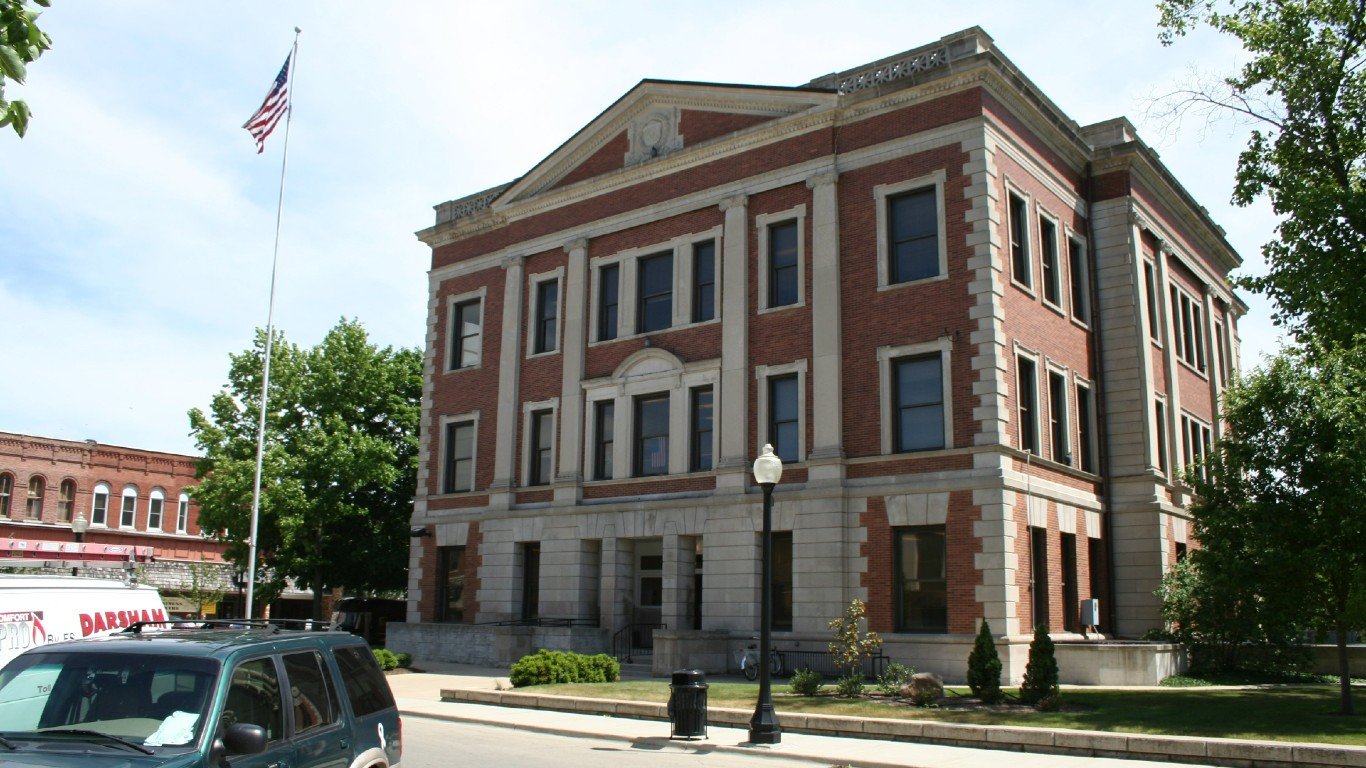
Source: Dual Freq, CC BY-SA 3.0 , via Wikimedia Commons
- Avg. life expectancy at birth: 80.0 years
- Poverty rate: 7.2%
- Adults with a bachelor’s degree: 30.8%
- Median household income: $81,151
- Population: 16,698
9. Woodford County

Source: David JE Sinn / iStock via Getty Images
- Avg. life expectancy at birth: 79.1 years
- Poverty rate: 7.5%
- Adults with a bachelor’s degree: 35.4%
- Median household income: $80,093
- Population: 38,414
8. McLean County
Source: Chimperil59 / iStock via Getty Images
- Avg. life expectancy at birth: 79.4 years
- Poverty rate: 14.2%
- Adults with a bachelor’s degree: 46.0%
- Median household income: $75,356
- Population: 171,284
7. Will County
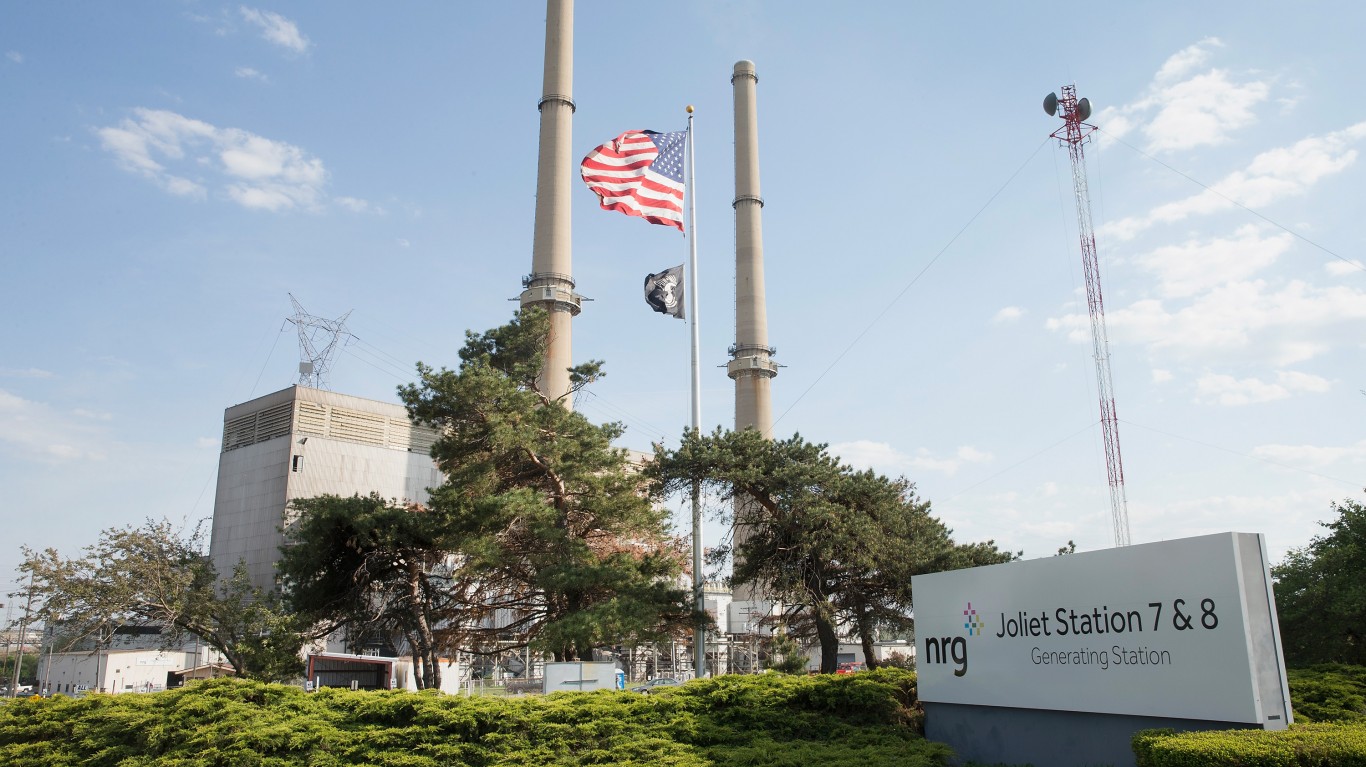
Source: Scott Olson / Getty Images News via Getty Images
- Avg. life expectancy at birth: 79.2 years
- Poverty rate: 6.7%
- Adults with a bachelor’s degree: 36.1%
- Median household income: $103,678
- Population: 696,774
6. Kane County

Source: DenisTangneyJr / iStock via Getty Images
- Avg. life expectancy at birth: 81.0 years
- Poverty rate: 8.3%
- Adults with a bachelor’s degree: 36.3%
- Median household income: $96,400
- Population: 517,254
5. McHenry County

Source: stevegeer / iStock via Getty Images
- Avg. life expectancy at birth: 80.4 years
- Poverty rate: 6.0%
- Adults with a bachelor’s degree: 35.3%
- Median household income: $100,101
- Population: 311,133
4. Kendall County

Source: DenisTangneyJr / iStock via Getty Images
- Avg. life expectancy at birth: 81.2 years
- Poverty rate: 4.7%
- Adults with a bachelor’s degree: 35.8%
- Median household income: $106,358
- Population: 132,795
3. Monroe County
Source: BOB WESTON / iStock via Getty Images
- Avg. life expectancy at birth: 80.7 years
- Poverty rate: 4.3%
- Adults with a bachelor’s degree: 37.9%
- Median household income: $100,685
- Population: 34,905
2. Lake County

Source: benkrut / iStock via Getty Images
- Avg. life expectancy at birth: 81.0 years
- Poverty rate: 7.8%
- Adults with a bachelor’s degree: 46.9%
- Median household income: $104,553
- Population: 713,159
1. DuPage County
Source: DenisTangneyJr / iStock via Getty Images
- Avg. life expectancy at birth: 81.9 years
- Poverty rate: 6.3%
- Adults with a bachelor’s degree: 51.1%
- Median household income: $107,035
- Population: 930,559
| Rank | County | Avg. life expectancy at birth (yrs.) | Adults with a bachelor’s degree (%) | Poverty rate (%) | Population |
|---|---|---|---|---|---|
| 1 | DuPage, Illinois | 81.9 | 51.1 | 6.3 | 930,559 |
| 2 | Lake, Illinois | 81.0 | 46.9 | 7.8 | 713,159 |
| 3 | Monroe, Illinois | 80.7 | 37.9 | 4.3 | 34,905 |
| 4 | Kendall, Illinois | 81.2 | 35.8 | 4.7 | 132,795 |
| 5 | McHenry, Illinois | 80.4 | 35.3 | 6.0 | 311,133 |
| 6 | Kane, Illinois | 81.0 | 36.3 | 8.3 | 517,254 |
| 7 | Will, Illinois | 79.2 | 36.1 | 6.7 | 696,774 |
| 8 | McLean, Illinois | 79.4 | 46.0 | 14.2 | 171,284 |
| 9 | Woodford, Illinois | 79.1 | 35.4 | 7.5 | 38,414 |
| 10 | Piatt, Illinois | 80.0 | 30.8 | 7.2 | 16,698 |
| 11 | Cook, Illinois | 78.6 | 41.3 | 13.4 | 5,225,367 |
| 12 | Champaign, Illinois | 80.1 | 45.6 | 18.7 | 206,525 |
| 13 | Jo Daviess, Illinois | 80.5 | 27.9 | 7.8 | 21,942 |
| 14 | Menard, Illinois | 79.9 | 25.9 | 7.9 | 12,284 |
| 15 | Clinton, Illinois | 80.2 | 23.6 | 7.2 | 36,998 |
| 16 | Sangamon, Illinois | 77.7 | 34.6 | 12.9 | 196,122 |
| 17 | Grundy, Illinois | 77.2 | 25.7 | 6.0 | 52,624 |
| 18 | Tazewell, Illinois | 78.3 | 27.5 | 8.7 | 131,276 |
| 19 | Putnam, Illinois | 80.8 | 23.5 | 8.8 | 5,628 |
| 20 | Washington, Illinois | 79.4 | 23.1 | 8.0 | 13,781 |
| 21 | DeKalb, Illinois | 78.7 | 34.1 | 15.4 | 100,686 |
| 22 | Jasper, Illinois | 81.2 | 21.4 | 9.2 | 9,295 |
| 23 | Ogle, Illinois | 78.5 | 23.4 | 8.3 | 51,672 |
| 24 | Boone, Illinois | 79.3 | 24.0 | 9.8 | 53,459 |
| 25 | Henry, Illinois | 78.1 | 24.7 | 9.2 | 49,157 |
| 26 | Calhoun, Illinois | 80.4 | 19.5 | 8.4 | 4,472 |
| 27 | Effingham, Illinois | 77.7 | 25.9 | 10.8 | 34,594 |
| 28 | Peoria, Illinois | 76.8 | 33.7 | 15.5 | 181,186 |
| 29 | Madison, Illinois | 76.3 | 29.4 | 12.0 | 265,512 |
| 30 | Adams, Illinois | 77.8 | 26.9 | 12.1 | 65,583 |
Take This Retirement Quiz To Get Matched With An Advisor Now (Sponsored)
Are you ready for retirement? Planning for retirement can be overwhelming, that’s why it could be a good idea to speak to a fiduciary financial advisor about your goals today.
Start by taking this retirement quiz right here from SmartAsset that will match you with up to 3 financial advisors that serve your area and beyond in 5 minutes. Smart Asset is now matching over 50,000 people a month.
Click here now to get started.
Thank you for reading! Have some feedback for us?
Contact the 24/7 Wall St. editorial team.
Editors' Picks