
Rates of migration and geographic mobility have been falling for decades in the United States. In each of the last three years of available data, fewer than 30 million Americans moved to a new home. For comparison, an average of more than 35 million people moved every year in the decade of the 2010’s, over 39 million in the first decade of the 2000’s, and nearly 43 million in the 1990’s.
Even though Americans are less likely to move now than at any time since record keeping began in the 1940’s, the long-term national trend belies the mass exodus underway in many major cities across the country. Excluding international moves, the country’s 25 most populous metropolitan areas have reported a combined net-loss of over 2 million residents to migration alone since the start of the COVID-19 pandemic.
While the surge in outbound migration has not been felt across all major metro areas, in some U.S. cities, the trend is particularly acute.
Using data from the U.S. Census Bureau, 24/7 Wall St. identified the cities Americans are leaving in droves. For each of the 387 U.S. metro areas, we reviewed population change due to net-migration — the difference between outbound moves and inbound moves — and identified the 30 cities with the largest relative population decline between April 1, 2020 and July 1, 2023.
Among the metro areas on this list, population decline attributable to net-migration ranges from 2% nearly 6%. In these places, outbound moves between 2020 and 2023 exceed the number of inbound moves by anywhere from about 1,200 people to more than 730,000 people. Many of the largest U.S. metro areas, including Chicago, Los Angeles, New York, and San Francisco, rank on this list. Many of these cities are also among the most expensive and least affordable places in the country — particularly in regard to housing, currently the most commonly cited reason for moving in the United States. (Here is a look at the cities where the most people cannot afford a new home.)
Notably, outbound migration from these places has been driven exclusively by people relocating to other parts of the U.S., as every city on this list has reported a net-increase in new residents from foreign countries since 2020.
While this ranking is based solely on net-migration, even when accounting for births and deaths, the vast majority of these cities have shrinking populations. When factoring in both migration and natural population change, only two metro areas on this list are larger now than they were in 2020. (Here is a look at the cities with the largest influx of new residents.)
Why It Matters

Source: Sparky2000 / Getty Images
High rates of outbound moves from major metropolitan areas has become one of the most notable migration patterns in recent years. The metro areas Americans are most likely to leave behind include places like New York, Los Angeles, and San Francisco, which are among the largest and most expensive places in the country. Still, smaller, more affordable cities are not immune. In places like Elmira, New York and Minot, North Dakota, the volume of outbound migration has greatly surpassed the number of inbound moves in the last few years.
30. Trenton-Princeton, NJ

Source: ChrisBoswell / iStock via Getty Images
- Population change from net-migration, 2020-2023: -2.0% (-7,620)
- Population change from domestic migration, 2020-2023: -3.5% (-13,443)
- Population change from international migration, 2020-2023: +1.5% (+5,823)
- Total population change, 2020-2023: -1.5% (-5,657)
- Total population in 2023: 381,671
29. Hanford-Corcoran, CA

- Population change from net-migration, 2020-2023: -2.0% (-3,010)
- Population change from domestic migration, 2020-2023: -2.1% (-3,254)
- Population change from international migration, 2020-2023: +0.2% (+244)
- Total population change, 2020-2023: +0.1% (+196)
- Total population in 2023: 152,682
28. San Diego-Chula Vista-Carlsbad, CA

Source: Art Wager / E+ via Getty Images
- Population change from net-migration, 2020-2023: -2.0% (-65,280)
- Population change from domestic migration, 2020-2023: -2.6% (-87,347)
- Population change from international migration, 2020-2023: +0.7% (+22,067)
- Total population change, 2020-2023: -0.9% (-28,675)
- Total population in 2023: 3,269,973
27. Grand Forks, ND-MN

Source: DenisTangneyJr / iStock via Getty Images
- Population change from net-migration, 2020-2023: -2.0% (-2,074)
- Population change from domestic migration, 2020-2023: -2.6% (-2,719)
- Population change from international migration, 2020-2023: +0.6% (+645)
- Total population change, 2020-2023: -1.2% (-1,246)
- Total population in 2023: 103,120
26. Eagle Pass, TX
Source: halbergman / iStock via Getty Images
- Population change from net-migration, 2020-2023: -2.1% (-1,223)
- Population change from domestic migration, 2020-2023: -2.6% (-1,531)
- Population change from international migration, 2020-2023: +0.5% (+308)
- Total population change, 2020-2023: -0.2% (-122)
- Total population in 2023: 57,762
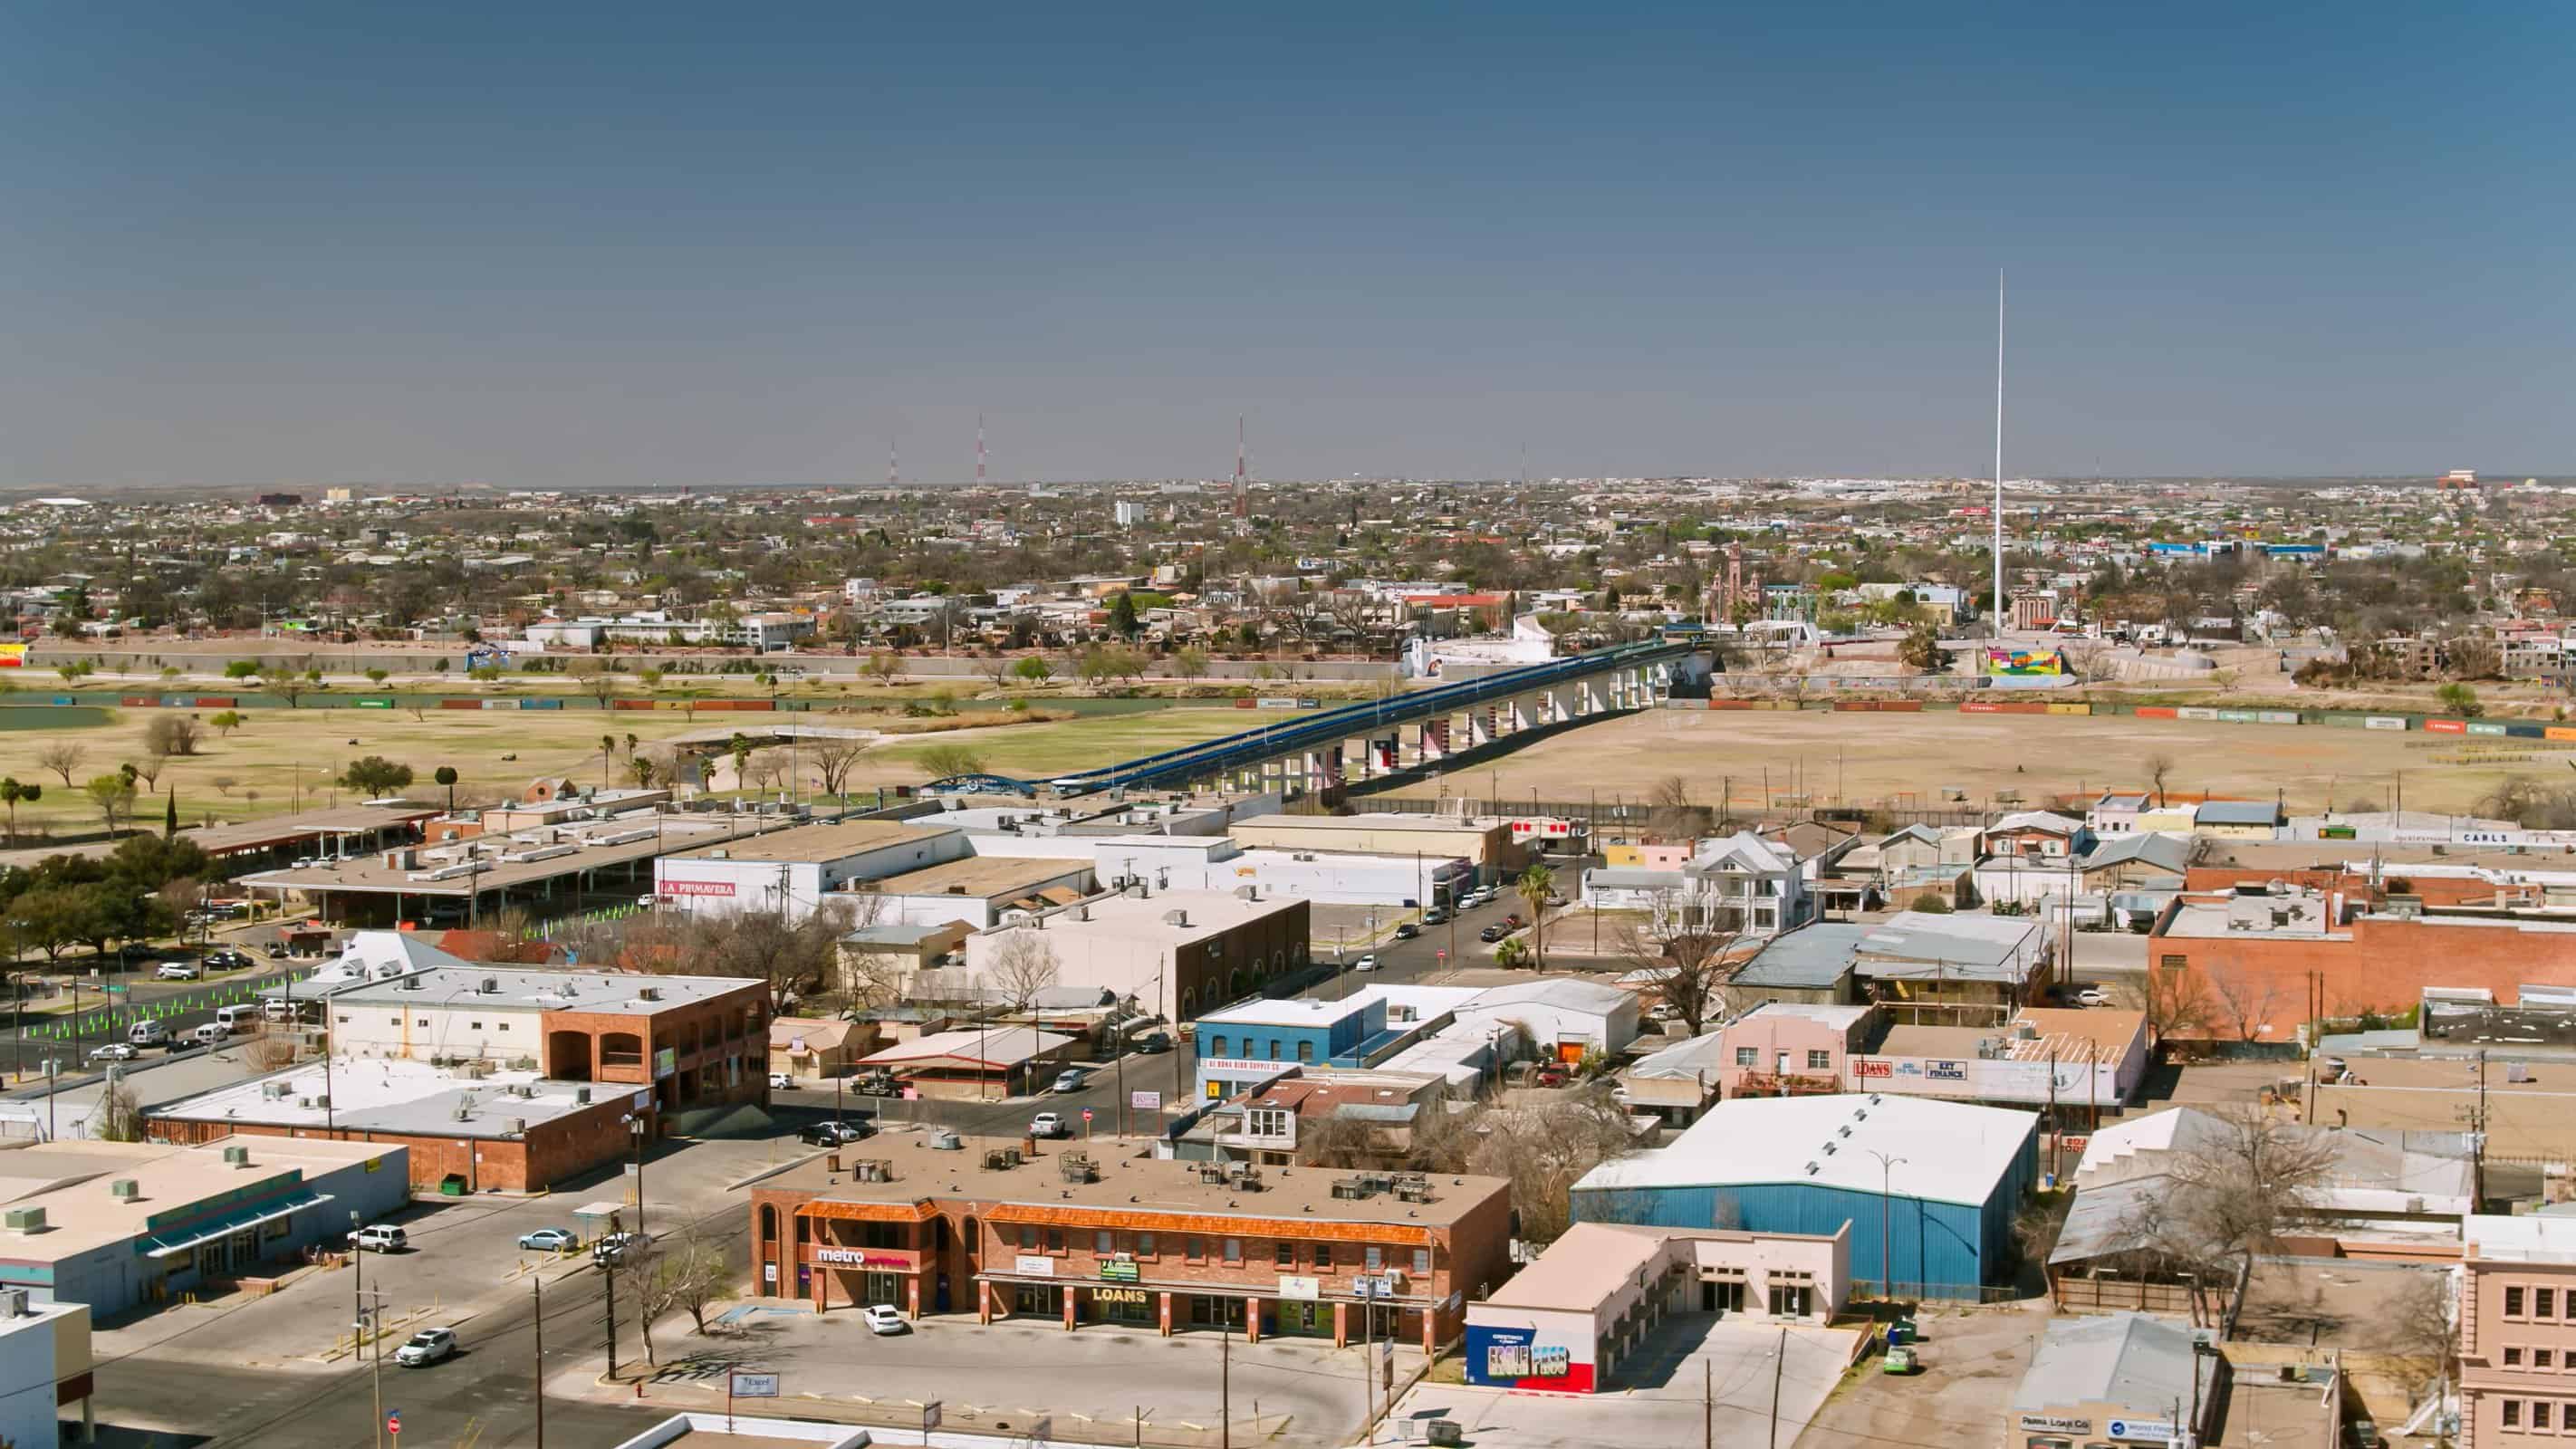
25. Laredo, TX

Source: DenisTangneyJr / iStock via Getty Images
- Population change from net-migration, 2020-2023: -2.2% (-5,791)
- Population change from domestic migration, 2020-2023: -2.9% (-7,770)
- Population change from international migration, 2020-2023: +0.7% (+1,979)
- Total population change, 2020-2023: +0.8% (+2,035)
- Total population in 2023: 269,148
24. Ann Arbor, MI

Source: Davel5957 / iStock Unreleased via Getty Images
- Population change from net-migration, 2020-2023: -2.2% (-8,095)
- Population change from domestic migration, 2020-2023: -3.3% (-12,418)
- Population change from international migration, 2020-2023: +1.2% (+4,323)
- Total population change, 2020-2023: -1.8% (-6,722)
- Total population in 2023: 365,536
23. Alexandria, LA

Source: DenisTangneyJr / iStock via Getty Images
- Population change from net-migration, 2020-2023: -2.2% (-3,323)
- Population change from domestic migration, 2020-2023: -2.4% (-3,581)
- Population change from international migration, 2020-2023: +0.2% (+258)
- Total population change, 2020-2023: -2.6% (-4,013)
- Total population in 2023: 148,171
22. Elmira, NY

Source: DenisTangneyJr / iStock via Getty Images
- Population change from net-migration, 2020-2023: -2.3% (-1,938)
- Population change from domestic migration, 2020-2023: -2.5% (-2,139)
- Population change from international migration, 2020-2023: +0.2% (+201)
- Total population change, 2020-2023: -3.3% (-2,817)
- Total population in 2023: 81,325
21. Shreveport-Bossier City, LA

Source: SeanPavonePhoto / iStock Editorial via Getty Images
- Population change from net-migration, 2020-2023: -2.3% (-9,233)
- Population change from domestic migration, 2020-2023: -2.6% (-10,230)
- Population change from international migration, 2020-2023: +0.3% (+997)
- Total population change, 2020-2023: -2.6% (-10,114)
- Total population in 2023: 383,295
20. Oxnard-Thousand Oaks-Ventura, CA

Source: benedek / iStock via Getty Images
- Population change from net-migration, 2020-2023: -2.4% (-20,266)
- Population change from domestic migration, 2020-2023: -2.7% (-22,837)
- Population change from international migration, 2020-2023: +0.3% (+2,571)
- Total population change, 2020-2023: -1.7% (-14,250)
- Total population in 2023: 829,590
19. Chicago-Naperville-Elgin, IL-IN

Source: Sean Pavone / Shutterstock
- Population change from net-migration, 2020-2023: -2.5% (-234,239)
- Population change from domestic migration, 2020-2023: -3.2% (-305,428)
- Population change from international migration, 2020-2023: +0.8% (+71,189)
- Total population change, 2020-2023: -2.0% (-187,479)
- Total population in 2023: 9,262,825
18. Decatur, IL

Source: JHVEPhoto / iStock Editorial via Getty Images
- Population change from net-migration, 2020-2023: -2.6% (-2,658)
- Population change from domestic migration, 2020-2023: -2.9% (-3,021)
- Population change from international migration, 2020-2023: +0.3% (+363)
- Total population change, 2020-2023: -3.3% (-3,393)
- Total population in 2023: 100,591
17. Odessa, TX

Source: DenisTangneyJr / iStock via Getty Images
- Population change from net-migration, 2020-2023: -2.9% (-4,743)
- Population change from domestic migration, 2020-2023: -4.2% (-6,985)
- Population change from international migration, 2020-2023: +1.4% (+2,242)
- Total population change, 2020-2023: -0.4% (-676)
- Total population in 2023: 164,494
16. Santa Maria-Santa Barbara, CA

Source: travelview / iStock via Getty Images
- Population change from net-migration, 2020-2023: -2.9% (-12,885)
- Population change from domestic migration, 2020-2023: -3.5% (-15,845)
- Population change from international migration, 2020-2023: +0.7% (+2,960)
- Total population change, 2020-2023: -1.6% (-6,963)
- Total population in 2023: 441,257
15. Napa, CA

Source: Spondylolithesis / iStock via Getty Images
- Population change from net-migration, 2020-2023: -3.2% (-4,457)
- Population change from domestic migration, 2020-2023: -3.6% (-4,982)
- Population change from international migration, 2020-2023: +0.4% (+525)
- Total population change, 2020-2023: -3.5% (-4,797)
- Total population in 2023: 133,216
14. Urban Honolulu, HI

Source: sorincolac / iStock via Getty Images
- Population change from net-migration, 2020-2023: -3.4% (-34,111)
- Population change from domestic migration, 2020-2023: -4.3% (-43,273)
- Population change from international migration, 2020-2023: +0.9% (+9,162)
- Total population change, 2020-2023: -2.7% (-27,099)
- Total population in 2023: 989,408
13. Los Angeles-Long Beach-Anaheim, CA

Source: LeoPatrizi / E+ via Getty Images
- Population change from net-migration, 2020-2023: -3.5% (-468,472)
- Population change from domestic migration, 2020-2023: -4.4% (-583,250)
- Population change from international migration, 2020-2023: +0.9% (+114,778)
- Total population change, 2020-2023: -3.0% (-401,873)
- Total population in 2023: 12,799,100
12. Fairbanks-College, AK

Source: FloridaStock / Shutterstock.com
- Population change from net-migration, 2020-2023: -3.6% (-3,459)
- Population change from domestic migration, 2020-2023: -4.1% (-3,901)
- Population change from international migration, 2020-2023: +0.5% (+442)
- Total population change, 2020-2023: -0.9% (-820)
- Total population in 2023: 94,840
11. Santa Cruz-Watsonville, CA

Source: nata_rass / iStock via Getty Images
- Population change from net-migration, 2020-2023: -3.6% (-9,872)
- Population change from domestic migration, 2020-2023: -3.9% (-10,649)
- Population change from international migration, 2020-2023: +0.3% (+777)
- Total population change, 2020-2023: -3.4% (-9,323)
- Total population in 2023: 261,547
10. New York-Newark-Jersey City, NY-NJ

Source: Eloi_Omella / iStock via Getty Images
- Population change from net-migration, 2020-2023: -3.6% (-732,334)
- Population change from domestic migration, 2020-2023: -4.9% (-974,919)
- Population change from international migration, 2020-2023: +1.2% (+242,585)
- Total population change, 2020-2023: -2.9% (-583,741)
- Total population in 2023: 19,498,249
9. Manhattan, KS

Source: DenisTangneyJr / iStock via Getty Images
- Population change from net-migration, 2020-2023: -3.7% (-4,974)
- Population change from domestic migration, 2020-2023: -4.4% (-5,944)
- Population change from international migration, 2020-2023: +0.7% (+970)
- Total population change, 2020-2023: -0.9% (-1,211)
- Total population in 2023: 132,831
8. Salinas, CA

Source: Jim Ekstrand / iStock via Getty Images
- Population change from net-migration, 2020-2023: -3.8% (-16,674)
- Population change from domestic migration, 2020-2023: -4.3% (-19,085)
- Population change from international migration, 2020-2023: +0.5% (+2,411)
- Total population change, 2020-2023: -1.9% (-8,312)
- Total population in 2023: 430,723
7. San Jose-Sunnyvale-Santa Clara, CA

Source: Bill_Dally / iStock via Getty Images
- Population change from net-migration, 2020-2023: -3.9% (-77,756)
- Population change from domestic migration, 2020-2023: -6.2% (-123,379)
- Population change from international migration, 2020-2023: +2.3% (+45,623)
- Total population change, 2020-2023: -2.7% (-54,722)
- Total population in 2023: 1,945,767
6. Watertown-Fort Drum, NY
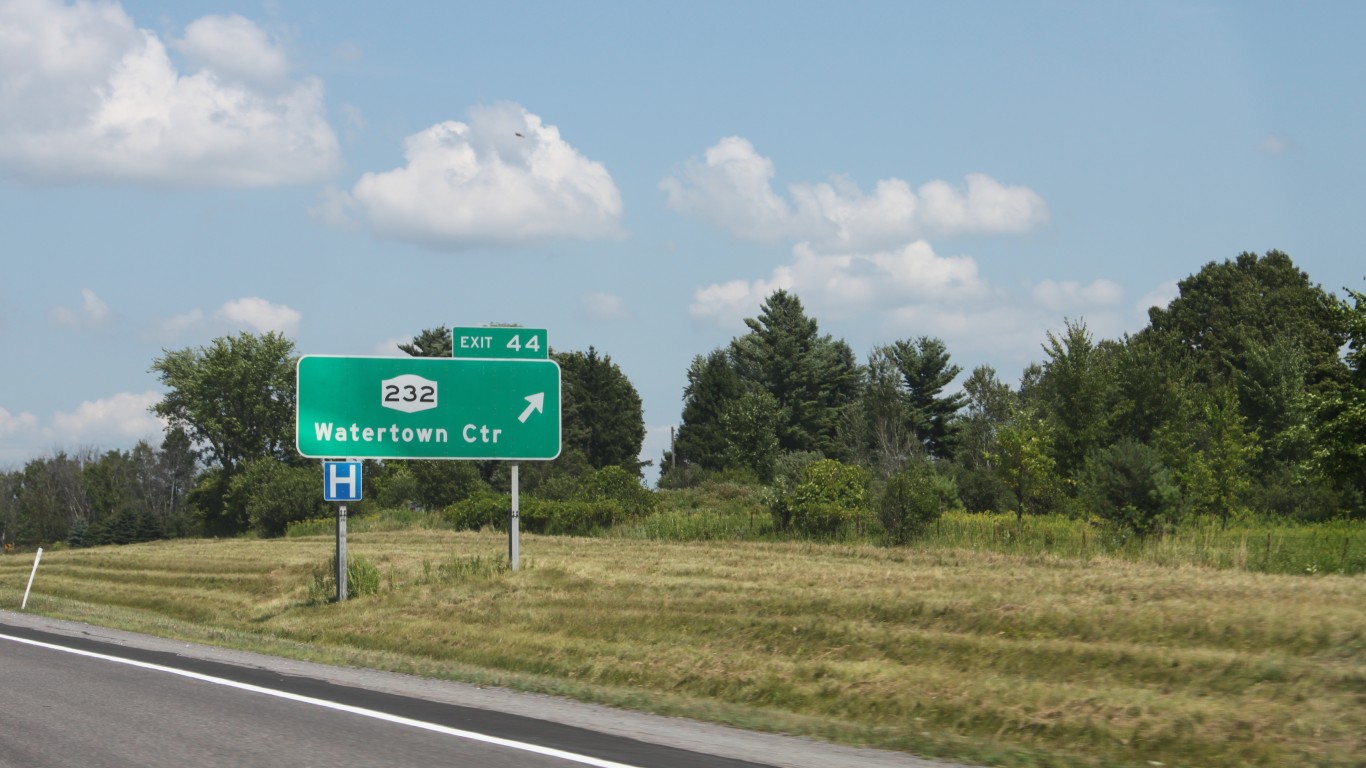
Source: KathyKafka / iStock via Getty Images
- Population change from net-migration, 2020-2023: -3.9% (-4,567)
- Population change from domestic migration, 2020-2023: -4.4% (-5,081)
- Population change from international migration, 2020-2023: +0.4% (+514)
- Total population change, 2020-2023: -1.6% (-1,924)
- Total population in 2023: 114,787
5. Minot, ND

Source: Feifei Cui-Paoluzzo / Moment via Getty Images
- Population change from net-migration, 2020-2023: -4.0% (-3,111)
- Population change from domestic migration, 2020-2023: -4.4% (-3,383)
- Population change from international migration, 2020-2023: +0.4% (+272)
- Total population change, 2020-2023: -2.3% (-1,819)
- Total population in 2023: 75,742
4. Houma-Bayou Cane-Thibodaux, LA

- Population change from net-migration, 2020-2023: -4.4% (-9,024)
- Population change from domestic migration, 2020-2023: -4.5% (-9,417)
- Population change from international migration, 2020-2023: +0.2% (+393)
- Total population change, 2020-2023: -4.1% (-8,470)
- Total population in 2023: 198,672
3. San Francisco-Oakland-Fremont, CA

Source: bluejayphoto / iStock via Getty Images
- Population change from net-migration, 2020-2023: -4.5% (-214,106)
- Population change from domestic migration, 2020-2023: -5.9% (-282,473)
- Population change from international migration, 2020-2023: +1.4% (+68,367)
- Total population change, 2020-2023: -3.8% (-182,021)
- Total population in 2023: 4,566,961
2. New Orleans-Metairie, LA

Source: f11photo / iStock via Getty Images
- Population change from net-migration, 2020-2023: -4.8% (-48,678)
- Population change from domestic migration, 2020-2023: -5.7% (-57,147)
- Population change from international migration, 2020-2023: +0.8% (+8,469)
- Total population change, 2020-2023: -4.5% (-45,121)
- Total population in 2023: 962,165
1. Lake Charles, LA

Source: DenisTangneyJr / iStock via Getty Images
- Population change from net-migration, 2020-2023: -5.6% (-14,297)
- Population change from domestic migration, 2020-2023: -6.0% (-15,165)
- Population change from international migration, 2020-2023: +0.3% (+868)
- Total population change, 2020-2023: -5.7% (-14,569)
- Total population in 2023: 240,082
Take This Retirement Quiz To Get Matched With An Advisor Now (Sponsored)
Are you ready for retirement? Planning for retirement can be overwhelming, that’s why it could be a good idea to speak to a fiduciary financial advisor about your goals today.
Start by taking this retirement quiz right here from SmartAsset that will match you with up to 3 financial advisors that serve your area and beyond in 5 minutes. Smart Asset is now matching over 50,000 people a month.
Click here now to get started.
Thank you for reading! Have some feedback for us?
Contact the 24/7 Wall St. editorial team.
Editors' Picks