
The prospect of an income tax audit by the Internal Revenue Service is a daunting one. The IRS audits about 1.1 million tax returns each year. To minimize the likelihood of a mistake — and reduce the risk of an audit — an estimated 60% of U.S. taxpayers sought professional help to fill out their 1040 form in 2017.
Fortunately, the likelihood of being audited by the IRS is very low. Each year, there are only about 7.7 audits for every 1,000 returns. Audit rates are not even across the country, however. Depending on the state, audit rates range from as low as 6.9 per 1,000 in New Hampshire to as high as 8.9 per 1,000 in Mississippi. Rates vary even more at the city level, and in most states, there is at least one metro area where taxpayers are more likely than the typical taxpayer nationwide to be targeted by the IRS.
Using data on tax returns and audits compiled by tax analysis website Tax Notes, 24/7 Wall St. reviewed audit rates in 382 metropolitan areas to identify the most audited city in each state. It is important to note that four states — Delaware, New Hampshire, Rhode Island, and Vermont — have only one metro area, and as a result, the city listed is the most audited by default.
Many might assume that wealthier Americans are more likely to be audited than low-income Americans. Afterall, higher incomes mean greater revenue for the IRS and perhaps higher potential of errors on 1040 forms. The opposite, however, appears to be true. Poverty is more common in 37 of the 50 cities on this list than it is across the respective state as a whole. In many of the cities on this list, poverty is a bigger problem than it is anywhere else in the state. Here is a full list of the cities hit hardest by extreme poverty in by state.
This is no coincidence. Many low-income households claim the earned income tax credit, or EITC, a program designed to ease financial hardship for the working poor. According to a 2018 report released by ProPublica, a nonprofit investigative publication, EITC recipients are disproportionately targeted for audit to better ensure no one is unfairly taking advantage of the system. Further reinforcing evidence of the trend, only 13 cities on this list have a higher median annual household income than the median nationwide of $57,652.
Ultimately, which tax return is selected for audit is up the IRS. However, there are measures taxpayers can take to minimize errors and reduce the risk of raising potential red flags. These are the 19 most common tax mistakes and how to avoid them.
Click here to see the most audited city in every state
Click here to read our methodology

1. Alabama: Mobile
> Audits per 1,000 tax returns: 8.69 (state: 8.20)
> Median household income: $45,802 (state: $46,472)
> Poverty rate: 19.3% (state: 18.0%)
> Adults with a bachelor’s degree: 23.0% (state: 24.5%)
[in-text-ad]

2. Alaska: Anchorage
> Audits per 1,000 tax returns: 6.99 (state: 7.02)
> Median household income: $80,724 (state: $76,114)
> Poverty rate: 8.5% (state: 10.2%)
> Adults with a bachelor’s degree: 31.0% (state: 29.0%)
[recirclink id=531165]

3. Arizona: Yuma
> Audits per 1,000 tax returns: 9.25 (state: 7.87)
> Median household income: $43,253 (state: $53,510)
> Poverty rate: 19.7% (state: 17.0%)
> Adults with a bachelor’s degree: 14.3% (state: 28.4%)

4. Arkansas: Pine Bluff
> Audits per 1,000 tax returns: 8.75 (state: 8.16)
> Median household income: $38,547 (state: $43,813)
> Poverty rate: 23.4% (state: 18.1%)
> Adults with a bachelor’s degree: 15.4% (state: 22.0%)
[in-text-ad-2]

5. California: El Centro
> Audits per 1,000 tax returns: 9.71 (state: 7.96)
> Median household income: $44,779 (state: $67,169)
> Poverty rate: 23.8% (state: 15.1%)
> Adults with a bachelor’s degree: 14.3% (state: 32.6%)

6. Colorado: Pueblo
> Audits per 1,000 tax returns: 7.76 (state: 7.36)
> Median household income: $42,386 (state: $65,458)
> Poverty rate: 19.8% (state: 11.5%)
> Adults with a bachelor’s degree: 21.7% (state: 39.4%)
[in-text-ad]

7. Connecticut: Bridgeport-Stamford-Norwalk
> Audits per 1,000 tax returns: 8.17 (state: 7.39)
> Median household income: $89,773 (state: $73,781)
> Poverty rate: 8.8% (state: 10.1%)
> Adults with a bachelor’s degree: 46.5% (state: 38.4%)
[recirclink id=510120]

8. Delaware: Dover
> Audits per 1,000 tax returns: 7.37 (state: 7.31)
> Median household income: $57,647 (state: $63,036)
> Poverty rate: 13.0% (state: 12.1%)
> Adults with a bachelor’s degree: 23.5% (state: 31.0%)

9. Florida: Miami-Fort Lauderdale-West Palm Beach
> Audits per 1,000 tax returns: 8.74 (state: 8.21)
> Median household income: $51,758 (state: $50,883)
> Poverty rate: 16.1% (state: 15.5%)
> Adults with a bachelor’s degree: 30.6% (state: 28.5%)
[in-text-ad-2]

10. Georgia: Albany
> Audits per 1,000 tax returns: 9.39 (state: 8.40)
> Median household income: $40,612 (state: $52,977)
> Poverty rate: 25.7% (state: 16.9%)
> Adults with a bachelor’s degree: 19.5% (state: 29.9%)

11. Hawaii: Kahului-Wailuku-Lahaina
> Audits per 1,000 tax returns: 7.60 (state: 7.39)
> Median household income: $72,743 (state: $74,923)
> Poverty rate: 10.0% (state: 10.3%)
> Adults with a bachelor’s degree: 26.3% (state: 32.0%)
[in-text-ad]

12. Idaho: Idaho Falls
> Audits per 1,000 tax returns: 7.79 (state: 7.69)
> Median household income: $54,663 (state: $50,985)
> Poverty rate: 11.5% (state: 14.5%)
> Adults with a bachelor’s degree: 27.5% (state: 26.8%)
[recirclink id=554829]

13. Illinois: Danville
> Audits per 1,000 tax returns: 7.67 (state: 7.49)
> Median household income: $44,930 (state: $61,229)
> Poverty rate: 19.8% (state: 13.5%)
> Adults with a bachelor’s degree: 14.6% (state: 33.4%)

14. Indiana: South Bend-Mishawaka
> Audits per 1,000 tax returns: 7.52 (state: 7.31)
> Median household income: $48,681 (state: $52,182)
> Poverty rate: 16.5% (state: 14.6%)
> Adults with a bachelor’s degree: 26.7% (state: 25.3%)
[in-text-ad-2]

15. Iowa: Sioux City
> Audits per 1,000 tax returns: 7.35 (state: 7.03)
> Median household income: $54,474 (state: $56,570)
> Poverty rate: 12.9% (state: 12.0%)
> Adults with a bachelor’s degree: 21.7% (state: 27.7%)

16. Kansas: Wichita
> Audits per 1,000 tax returns: 7.33 (state: 7.30)
> Median household income: $53,953 (state: $55,477)
> Poverty rate: 13.9% (state: 12.8%)
> Adults with a bachelor’s degree: 30.0% (state: 32.3%)
[in-text-ad]

17. Kentucky: Bowling Green
> Audits per 1,000 tax returns: 7.79 (state: 7.76)
> Median household income: $46,716 (state: $46,535)
> Poverty rate: 18.7% (state: 18.3%)
> Adults with a bachelor’s degree: 25.1% (state: 23.2%)
[recirclink id=540809]

18. Louisiana: Monroe
> Audits per 1,000 tax returns: 8.92 (state: 8.39)
> Median household income: $39,904 (state: $46,710)
> Poverty rate: 24.2% (state: 19.6%)
> Adults with a bachelor’s degree: 22.8% (state: 23.4%)

19. Maine: Lewiston-Auburn
> Audits per 1,000 tax returns: 7.29 (state: 7.17)
> Median household income: $49,538 (state: $53,024)
> Poverty rate: 14.3% (state: 12.9%)
> Adults with a bachelor’s degree: 22.1% (state: 30.3%)
[in-text-ad-2]

20. Maryland: Salisbury
> Audits per 1,000 tax returns: 7.54 (state: 7.36)
> Median household income: $56,283 (state: $78,916)
> Poverty rate: 13.3% (state: 9.7%)
> Adults with a bachelor’s degree: 25.8% (state: 39.0%)

21. Massachusetts: Boston-Cambridge-Newton
> Audits per 1,000 tax returns: 7.28 (state: 7.24)
> Median household income: $81,838 (state: $74,167)
> Poverty rate: 10.0% (state: 11.1%)
> Adults with a bachelor’s degree: 46.4% (state: 42.1%)
[in-text-ad]
22. Michigan: Niles-Benton Harbor
> Audits per 1,000 tax returns: 7.73 (state: 7.40)
> Median household income: $47,132 (state: $52,668)
> Poverty rate: 17.2% (state: 15.6%)
> Adults with a bachelor’s degree: 26.7% (state: 28.1%)
[recirclink id=531165]

23. Minnesota: Minneapolis-St. Paul-Bloomington
> Audits per 1,000 tax returns: 7.01 (state: 6.99)
> Median household income: $73,735 (state: $65,699)
> Poverty rate: 9.4% (state: 10.5%)
> Adults with a bachelor’s degree: 40.5% (state: 34.8%)

24. Mississippi: Jackson
> Audits per 1,000 tax returns: 8.76 (state: 8.86)
> Median household income: $49,381 (state: $42,009)
> Poverty rate: 18.5% (state: 21.5%)
> Adults with a bachelor’s degree: 29.7% (state: 21.3%)
[in-text-ad-2]

25. Missouri: Joplin
> Audits per 1,000 tax returns: 7.93 (state: 7.57)
> Median household income: $45,913 (state: $51,542)
> Poverty rate: 15.9% (state: 14.6%)
> Adults with a bachelor’s degree: 21.6% (state: 28.2%)

26. Montana: Missoula
> Audits per 1,000 tax returns: 7.32 (state: 7.43)
> Median household income: $49,412 (state: $50,801)
> Poverty rate: 15.9% (state: 14.4%)
> Adults with a bachelor’s degree: 42.6% (state: 30.7%)
[in-text-ad]

27. Nebraska: Grand Island
> Audits per 1,000 tax returns: 7.48 (state: 7.16)
> Median household income: $54,479 (state: $56,675)
> Poverty rate: 12.3% (state: 12.0%)
> Adults with a bachelor’s degree: 20.3% (state: 30.6%)
[recirclink id=510120]

28. Nevada: Las Vegas-Henderson-Paradise
> Audits per 1,000 tax returns: 7.73 (state: 7.64)
> Median household income: $54,882 (state: $55,434)
> Poverty rate: 14.6% (state: 14.2%)
> Adults with a bachelor’s degree: 23.3% (state: 23.7%)

29. New Hampshire: Manchester-Nashua
> Audits per 1,000 tax returns: 6.91 (state: 6.91)
> Median household income: $75,777 (state: $71,305)
> Poverty rate: 8.6% (state: 8.1%)
> Adults with a bachelor’s degree: 36.5% (state: 36.0%)
[in-text-ad-2]

30. New Jersey: Trenton
> Audits per 1,000 tax returns: 7.65 (state: 7.52)
> Median household income: $77,027 (state: $76,475)
> Poverty rate: 11.3% (state: 10.7%)
> Adults with a bachelor’s degree: 41.5% (state: 38.1%)

31. New Mexico: Las Cruces
> Audits per 1,000 tax returns: 8.66 (state: 8.13)
> Median household income: $39,114 (state: $46,718)
> Poverty rate: 27.9% (state: 20.6%)
> Adults with a bachelor’s degree: 27.4% (state: 26.9%)
[in-text-ad]

32. New York: New York-Newark-Jersey City
> Audits per 1,000 tax returns: 7.97 (state: 7.82)
> Median household income: $72,205 (state: $62,765)
> Poverty rate: 13.8% (state: 15.1%)
> Adults with a bachelor’s degree: 38.7% (state: 35.3%)
[recirclink id=554829]

33. North Carolina: Rocky Mount
> Audits per 1,000 tax returns: 8.63 (state: 7.87)
> Median household income: $41,593 (state: $50,320)
> Poverty rate: 19.1% (state: 16.1%)
> Adults with a bachelor’s degree: 17.2% (state: 29.9%)

34. North Dakota: Grand Forks
> Audits per 1,000 tax returns: 6.81 (state: 6.98)
> Median household income: $52,377 (state: $61,285)
> Poverty rate: 15.5% (state: 11.0%)
> Adults with a bachelor’s degree: 30.8% (state: 28.9%)
[in-text-ad-2]

35. Ohio: Toledo
> Audits per 1,000 tax returns: 7.33 (state: 7.23)
> Median household income: $48,284 (state: $52,407)
> Poverty rate: 17.8% (state: 14.9%)
> Adults with a bachelor’s degree: 26.4% (state: 27.2%)

36. Oklahoma: Lawton
> Audits per 1,000 tax returns: 7.95 (state: 7.82)
> Median household income: $49,608 (state: $49,767)
> Poverty rate: 16.6% (state: 16.2%)
> Adults with a bachelor’s degree: 21.5% (state: 24.8%)
[in-text-ad]

37. Oregon: Grants Pass
> Audits per 1,000 tax returns: 7.95 (state: 7.35)
> Median household income: $40,705 (state: $56,119)
> Poverty rate: 18.6% (state: 14.9%)
> Adults with a bachelor’s degree: 17.6% (state: 32.3%)
[recirclink id=540809]

38. Pennsylvania: Philadelphia-Camden-Wilmington
> Audits per 1,000 tax returns: 7.51 (state: 7.19)
> Median household income: $66,285 (state: $56,951)
> Poverty rate: 13.1% (state: 13.1%)
> Adults with a bachelor’s degree: 36.2% (state: 30.1%)

39. Rhode Island: Providence-Warwick
> Audits per 1,000 tax returns: 7.16 (state: 7.26)
> Median household income: $61,536 (state: $61,043)
> Poverty rate: 13.0% (state: 13.4%)
> Adults with a bachelor’s degree: 31.0% (state: 33.0%)
[in-text-ad-2]
40. South Carolina: Florence
> Audits per 1,000 tax returns: 8.71 (state: 8.02)
> Median household income: $40,888 (state: $48,781)
> Poverty rate: 20.6% (state: 16.6%)
> Adults with a bachelor’s degree: 21.0% (state: 27.0%)

41. South Dakota: Rapid City
> Audits per 1,000 tax returns: 7.27 (state: 7.34)
> Median household income: $52,683 (state: $54,126)
> Poverty rate: 13.0% (state: 13.9%)
> Adults with a bachelor’s degree: 28.3% (state: 27.8%)
[in-text-ad]

42. Tennessee: Memphis
> Audits per 1,000 tax returns: 8.63 (state: 7.92)
> Median household income: $50,194 (state: $48,708)
> Poverty rate: 18.9% (state: 16.7%)
> Adults with a bachelor’s degree: 27.2% (state: 26.1%)
[recirclink id=531165]

43. Texas: McAllen-Edinburg-Mission
> Audits per 1,000 tax returns: 9.86 (state: 8.13)
> Median household income: $37,097 (state: $57,051)
> Poverty rate: 31.8% (state: 16.0%)
> Adults with a bachelor’s degree: 17.8% (state: 28.7%)

44. Utah: St. George
> Audits per 1,000 tax returns: 7.69 (state: 7.24)
> Median household income: $55,175 (state: $65,325)
> Poverty rate: 14.2% (state: 11.0%)
> Adults with a bachelor’s degree: 28.1% (state: 32.5%)
[in-text-ad-2]

45. Vermont: Burlington-South Burlington
> Audits per 1,000 tax returns: 6.81 (state: 7.10)
> Median household income: $65,476 (state: $57,808)
> Poverty rate: 10.4% (state: 11.4%)
> Adults with a bachelor’s degree: 43.4% (state: 36.8%)

46. Virginia: Virginia Beach-Norfolk-Newport News
> Audits per 1,000 tax returns: 7.53 (state: 7.55)
> Median household income: $61,889 (state: $68,766)
> Poverty rate: 12.2% (state: 11.2%)
> Adults with a bachelor’s degree: 30.8% (state: 37.6%)
[in-text-ad]

47. Washington: Yakima
> Audits per 1,000 tax returns: 7.92 (state: 7.23)
> Median household income: $47,470 (state: $66,174)
> Poverty rate: 19.0% (state: 12.2%)
> Adults with a bachelor’s degree: 15.9% (state: 34.5%)
[recirclink id=510120]

48. West Virginia: Beckley
> Audits per 1,000 tax returns: 7.63 (state: 7.44)
> Median household income: $41,141 (state: $44,061)
> Poverty rate: 18.5% (state: 17.8%)
> Adults with a bachelor’s degree: 17.1% (state: 19.9%)

49. Wisconsin: Milwaukee-Waukesha-West Allis
> Audits per 1,000 tax returns: 7.20 (state: 6.93)
> Median household income: $57,531 (state: $56,759)
> Poverty rate: 14.5% (state: 12.3%)
> Adults with a bachelor’s degree: 34.5% (state: 29.0%)
[in-text-ad-2]
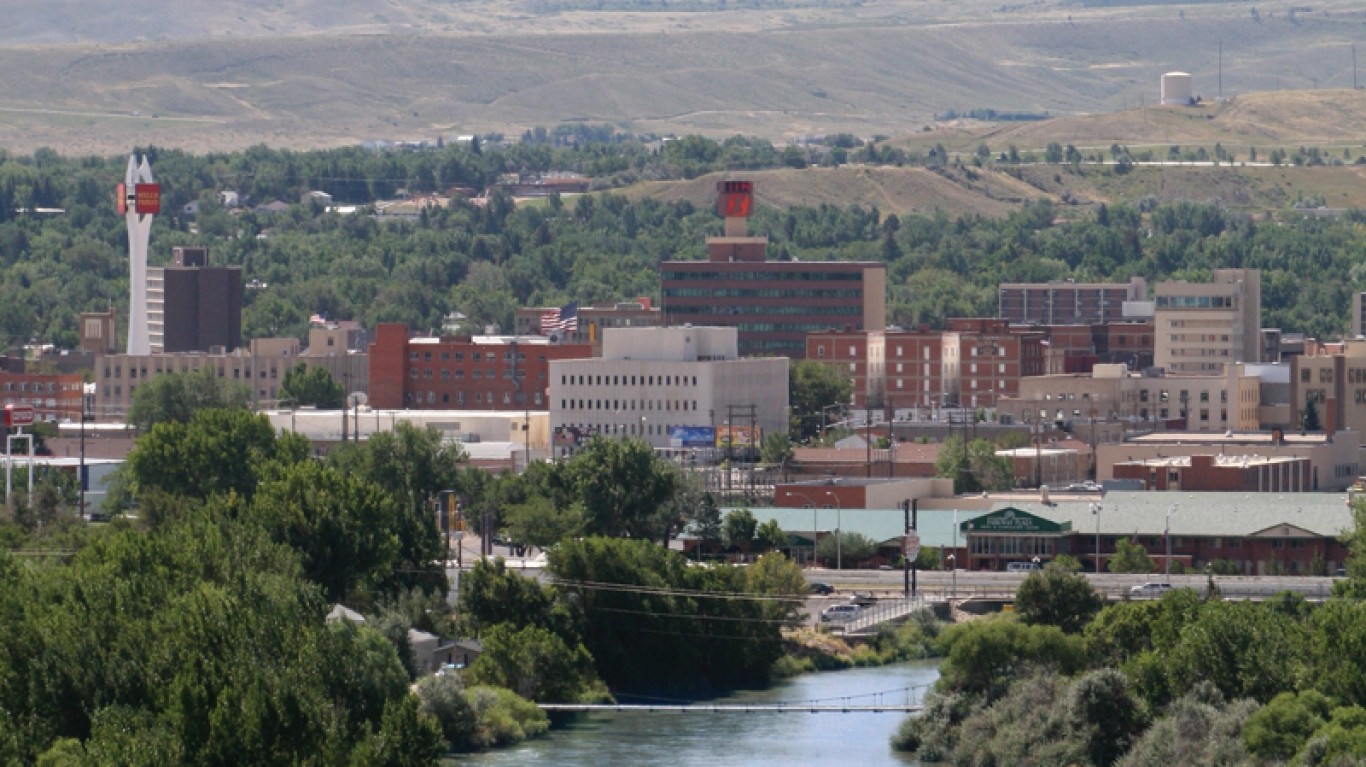
50. Wyoming: Casper
> Audits per 1,000 tax returns: 7.15 (state: 7.14)
> Median household income: $59,400 (state: $60,938)
> Poverty rate: 9.9% (state: 11.1%)
> Adults with a bachelor’s degree: 22.8% (state: 26.7%)
Methodology
To identify the city in each state where you are most likely to be audited, 24/7 Wall St. analyzed data on tax returns and audits, originally compiled by Tax Notes, on the metropolitan statistical area (MSA) level. Weighted averages for audit rates were calculated using American Community Survey (ACS) 2017 5-Year Estimates for population on a county level.
Median household income, poverty rates, and educational attainment by MSA and state also came from the ACS.
Contact [email protected] for any questions or corrections.