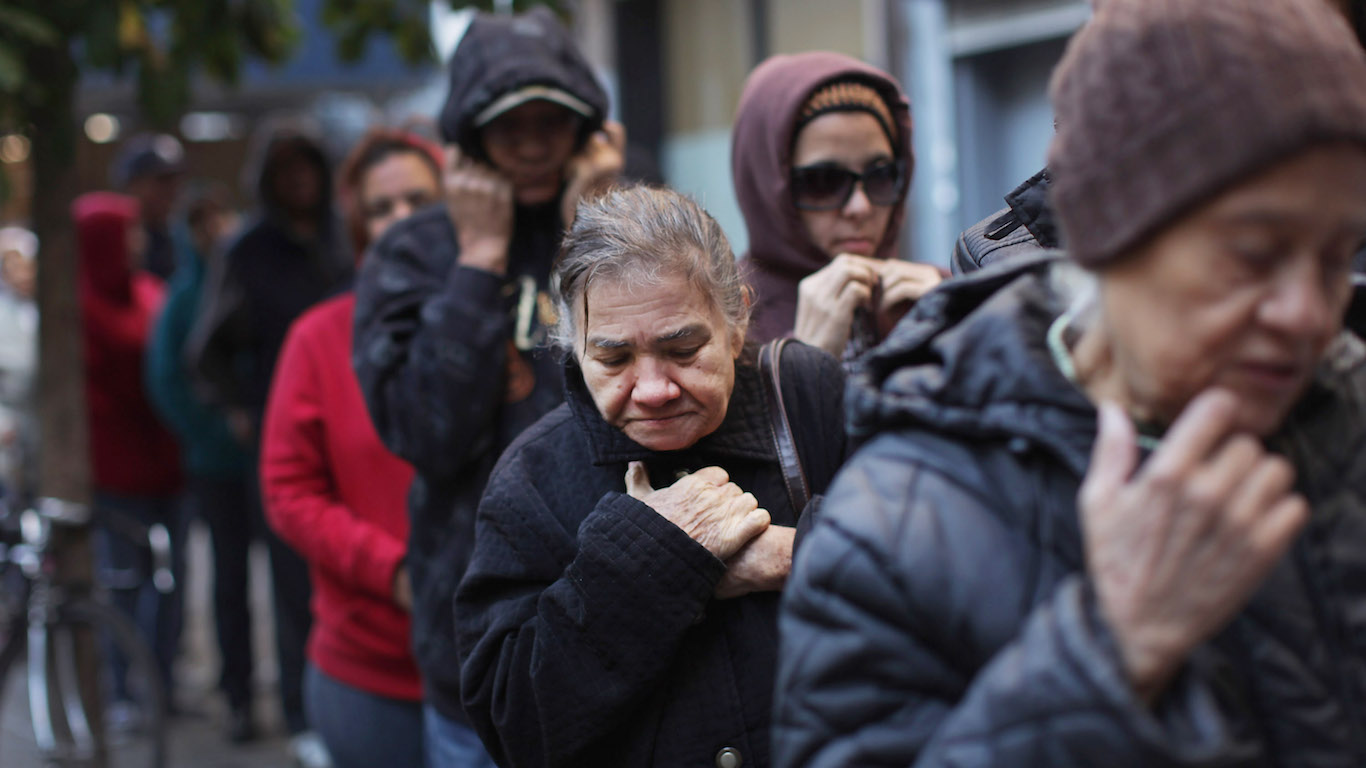
There are almost 40 million people in the 48 contiguous U.S. states – about one in eight – living below the poverty level. That is defined as those with an annual income threshold of $12,880 for an individual and $26,500 for a family of four (Alaska and Hawaii have a slightly higher threshold).
All cities have poor neighborhoods, but some cities have a higher percentage of poorer districts than others. To identify the 25 cities hit hardest by extreme poverty, 24/7 Wall St. reviewed five-year data on concentrated poverty from the U.S. Census Bureau’s 2020 American Community Survey.
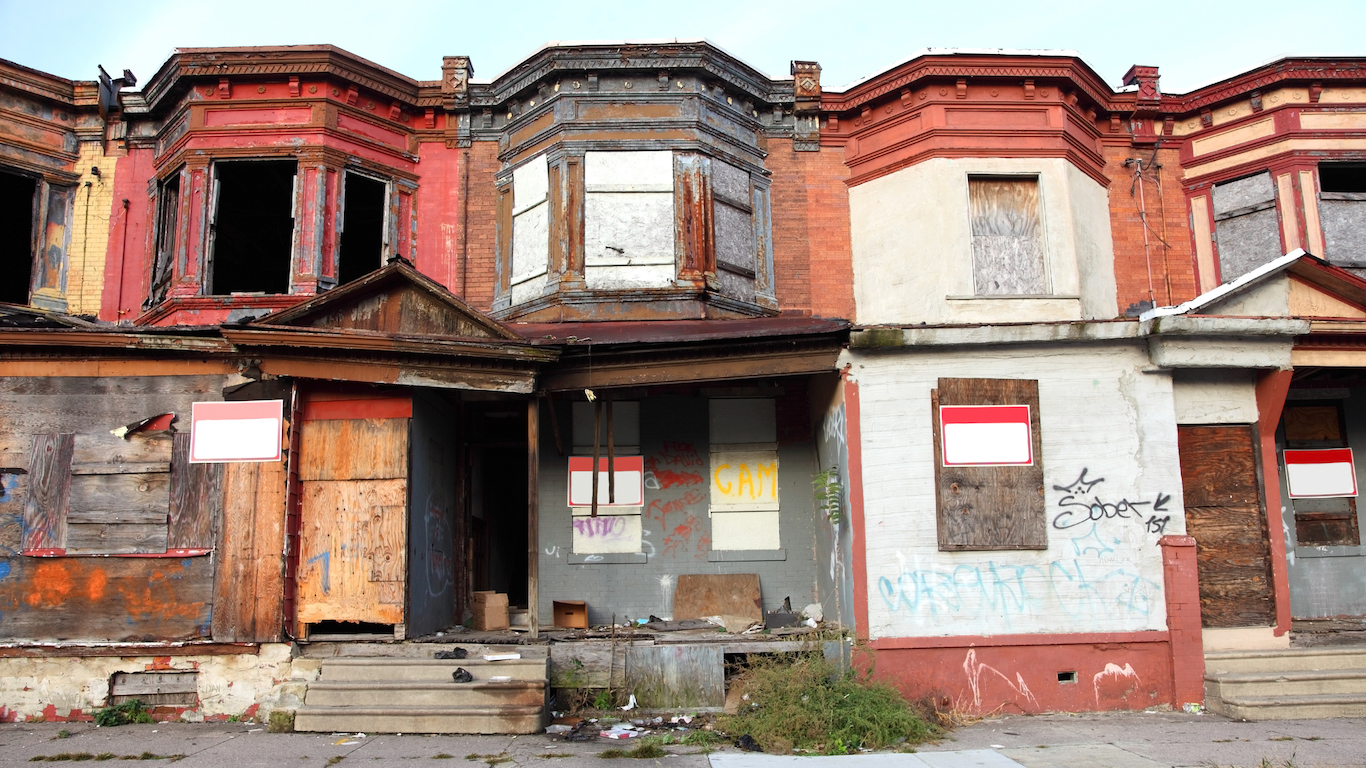
Metropolitan areas were ranked based on the share of poor residents who live in extreme poverty neighborhoods – census tracts with a poverty rate of 40% or higher. This measure is called the extreme or concentrated poverty rate, and is calculated by aggregating data from the census tract level to the metropolitan area level. (Here is the county where the fewest children live in poverty in every state).
Of the 25 cities on the list, almost one-third are in metropolitan areas in the South, including the two hardest-hit cities on the list – Albany and Macon-Bibb County, both in Georgia. Ten of the cities are in four Midwest states: Michigan (four), Ohio (three), and Indiana (two), and Illinois (one).
Albany, Georgia, the city with the most extreme poverty, is also the only metro area with the highest concentration of its poor population living in poor neighborhoods above 40%.
Click here to see the cities hit hardest by extreme poverty
Click here to see our full methodology

25. Detroit-Warren-Dearborn, MI
> Concentrated poverty rate: 23.0% of poor pop. living in poor neighborhoods
> Overall poverty rate: 13.8% (153rd highest of any MSA)
> Neighborhoods in extreme poverty: 113 of 1,288 tracts
> Avg. household income: $36,504 in poor tracts, $90,129 in all others
[in-text-ad]
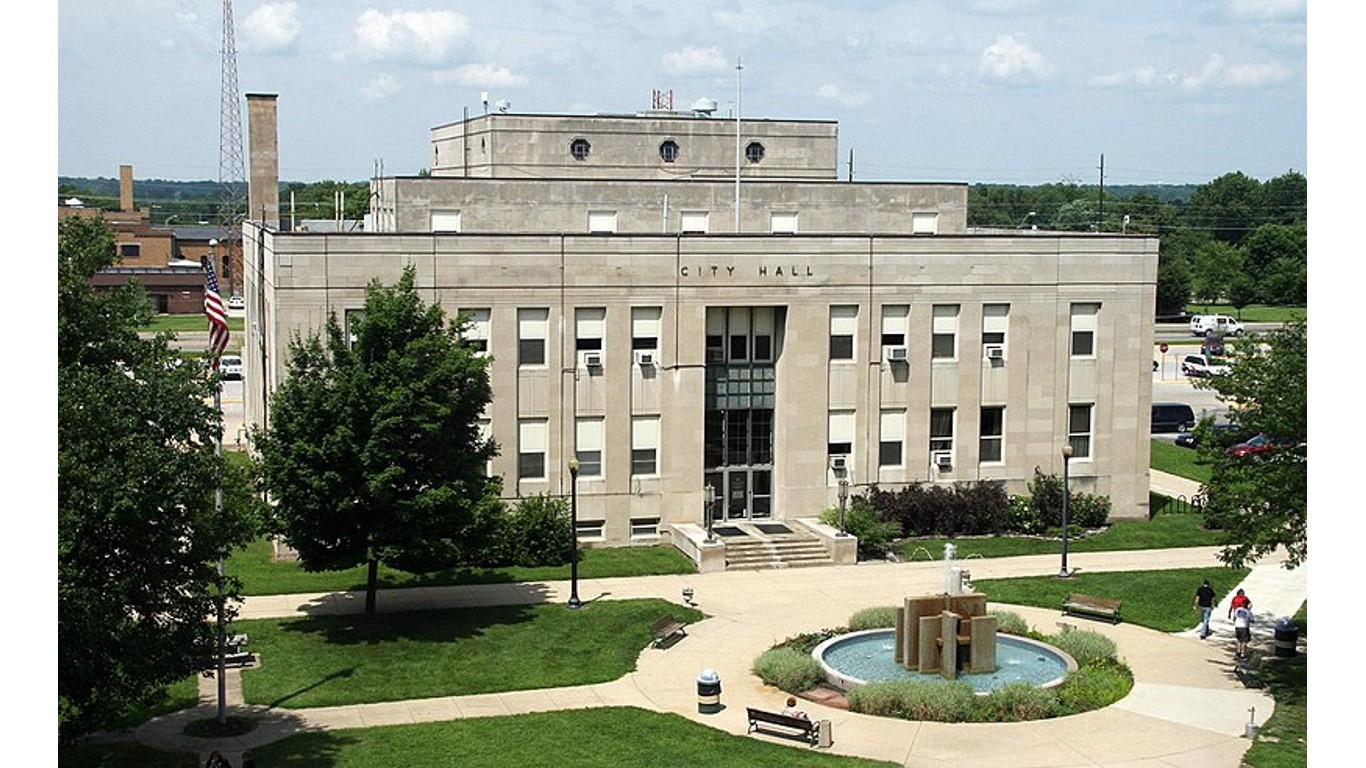
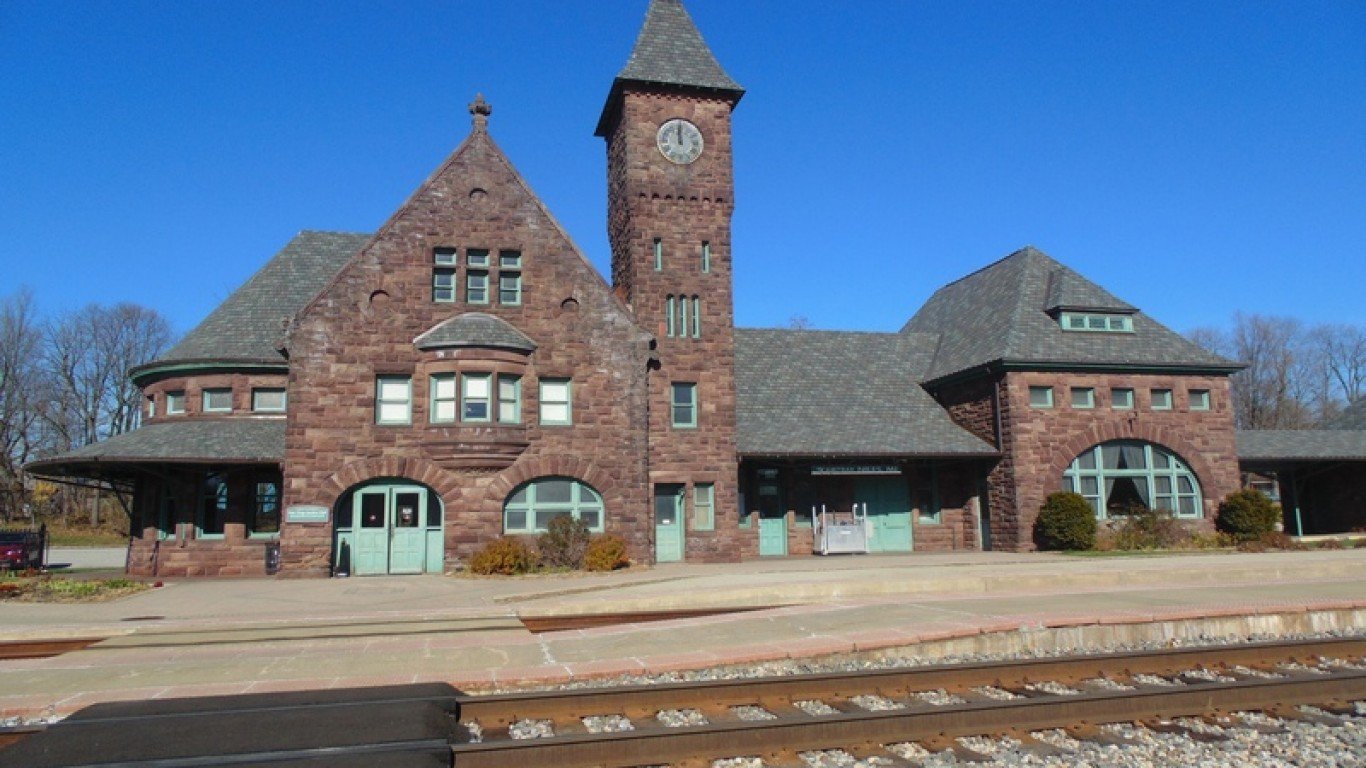
24. Terre Haute, IN
> Concentrated poverty rate: 23.1% of poor pop. living in poor neighborhoods
> Overall poverty rate: 16.0% (85th highest of any MSA)
> Neighborhoods in extreme poverty: 6 of 55 tracts
> Avg. household income: $33,694 in poor tracts, $67,726 in all others
[recirclink id=1147775]

23. Cleveland-Elyria, OH
> Concentrated poverty rate: 23.4% of poor pop. living in poor neighborhoods
> Overall poverty rate: 14.0% (144th highest of any MSA)
> Neighborhoods in extreme poverty: 54 of 620 tracts
> Avg. household income: $33,663 in poor tracts, $84,202 in all others

22. Memphis, TN-MS-AR
> Concentrated poverty rate: 23.8% of poor pop. living in poor neighborhoods
> Overall poverty rate: 17.3% (52nd highest of any MSA)
> Neighborhoods in extreme poverty: 44 of 348 tracts
> Avg. household income: $33,324 in poor tracts, $82,044 in all others
[in-text-ad-2]
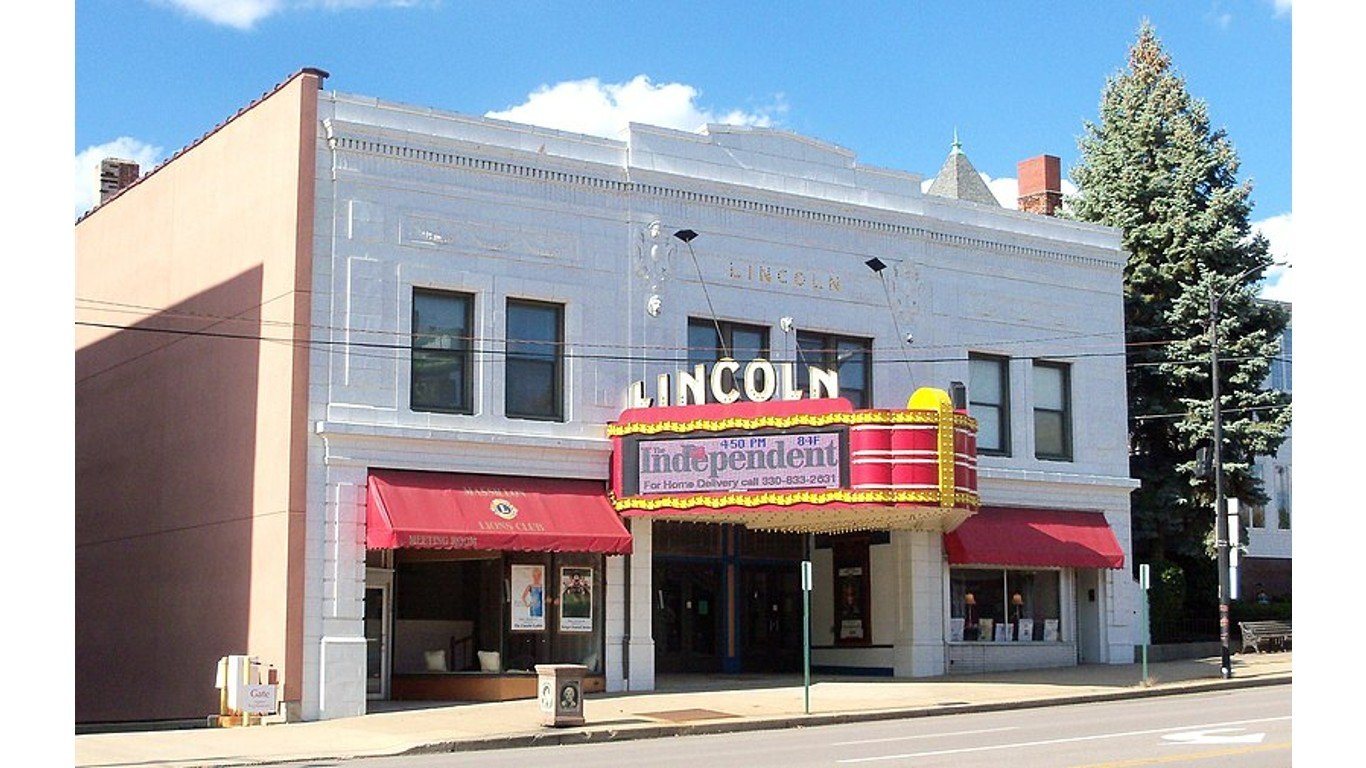
21. Canton-Massillon, OH
> Concentrated poverty rate: 23.8% of poor pop. living in poor neighborhoods
> Overall poverty rate: 13.3% (181st highest of any MSA)
> Neighborhoods in extreme poverty: 9 of 97 tracts
> Avg. household income: $34,573 in poor tracts, $74,279 in all others

20. Hattiesburg, MS
> Concentrated poverty rate: 23.9% of poor pop. living in poor neighborhoods
> Overall poverty rate: 21.8% (9th highest of any MSA)
> Neighborhoods in extreme poverty: 6 of 45 tracts
> Avg. household income: $40,700 in poor tracts, $72,057 in all others
[in-text-ad]

19. Madera, CA
> Concentrated poverty rate: 23.9% of poor pop. living in poor neighborhoods
> Overall poverty rate: 19.0% (21st highest of any MSA)
> Neighborhoods in extreme poverty: 3 of 34 tracts
> Avg. household income: $53,904 in poor tracts, $80,029 in all others
[recirclink id=1149201]

18. Jackson, MS
> Concentrated poverty rate: 24.0% of poor pop. living in poor neighborhoods
> Overall poverty rate: 16.7% (61st highest of any MSA)
> Neighborhoods in extreme poverty: 19 of 158 tracts
> Avg. household income: $36,281 in poor tracts, $78,557 in all others
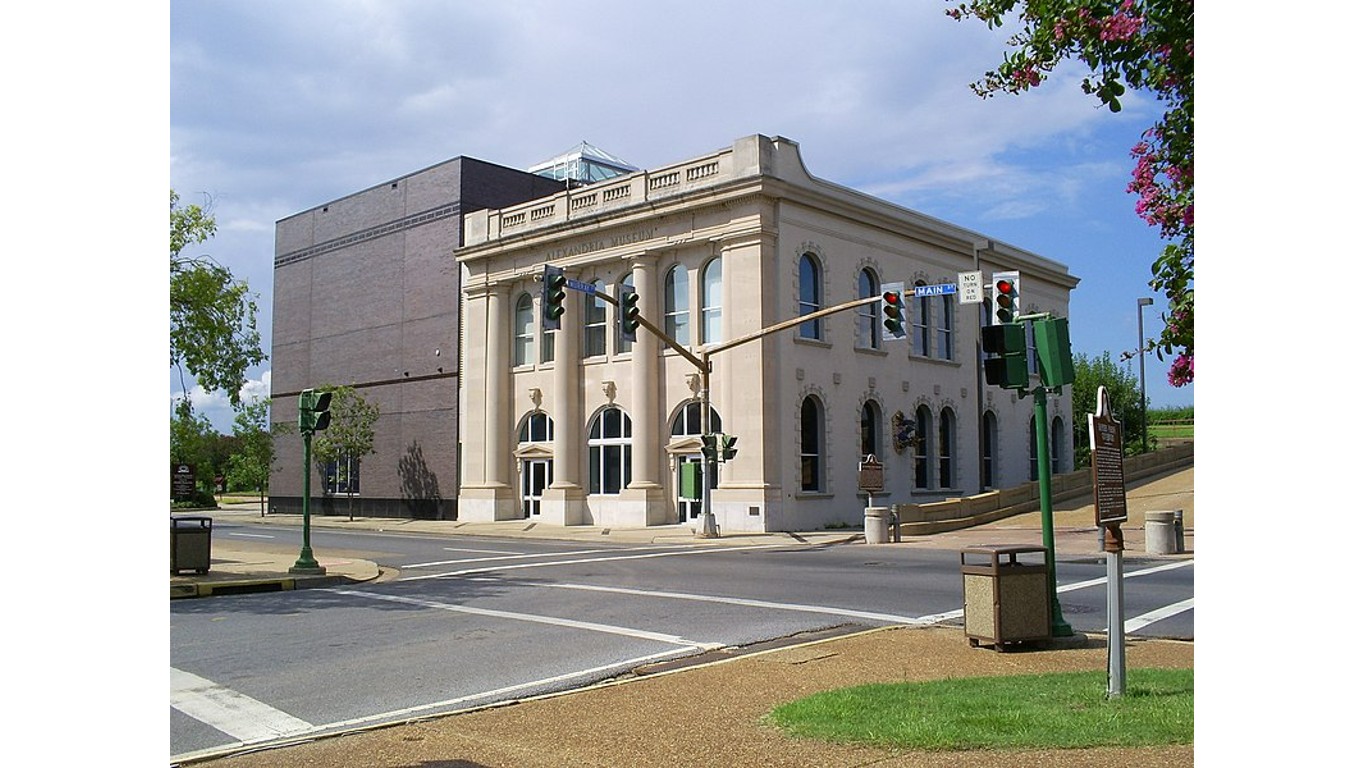
17. Alexandria, LA
> Concentrated poverty rate: 24.8% of poor pop. living in poor neighborhoods
> Overall poverty rate: 18.4% (31st highest of any MSA)
> Neighborhoods in extreme poverty: 5 of 45 tracts
> Avg. household income: $29,807 in poor tracts, $72,500 in all others
[in-text-ad-2]
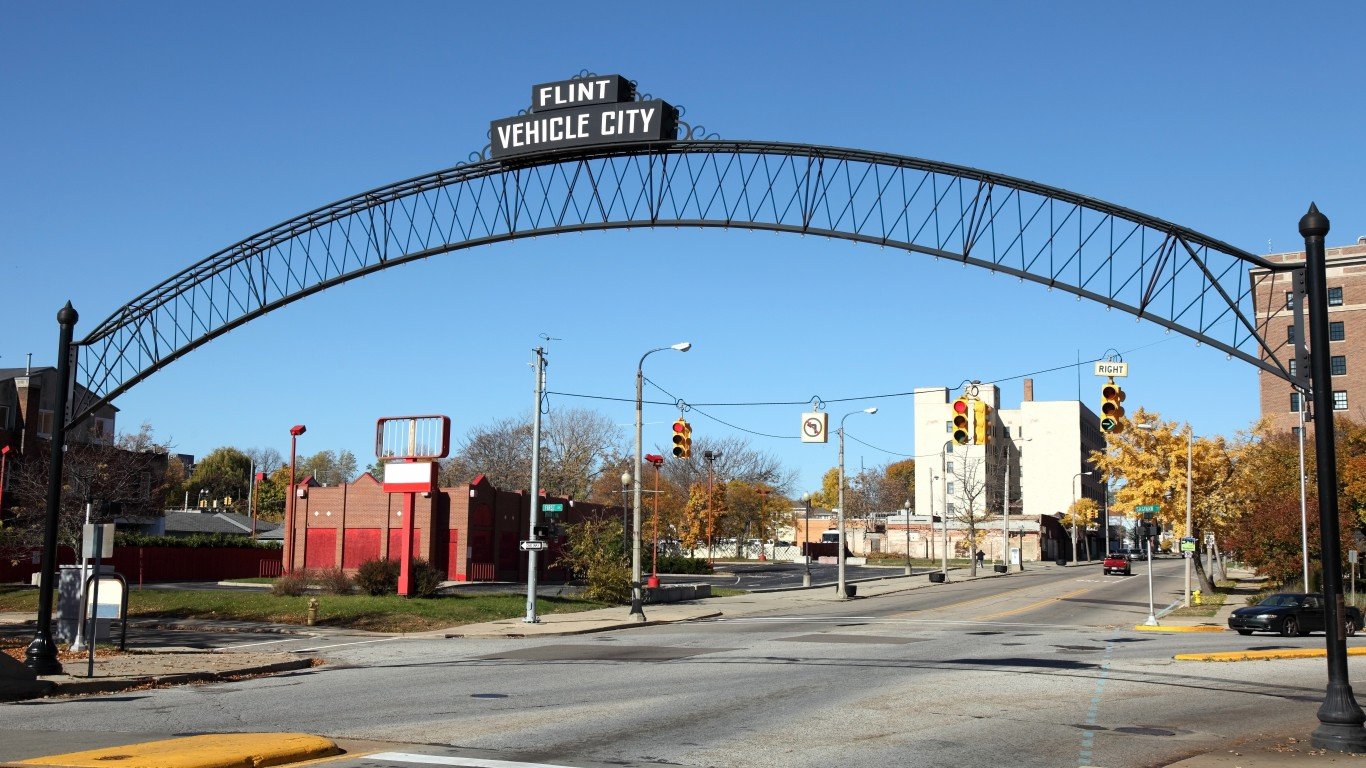
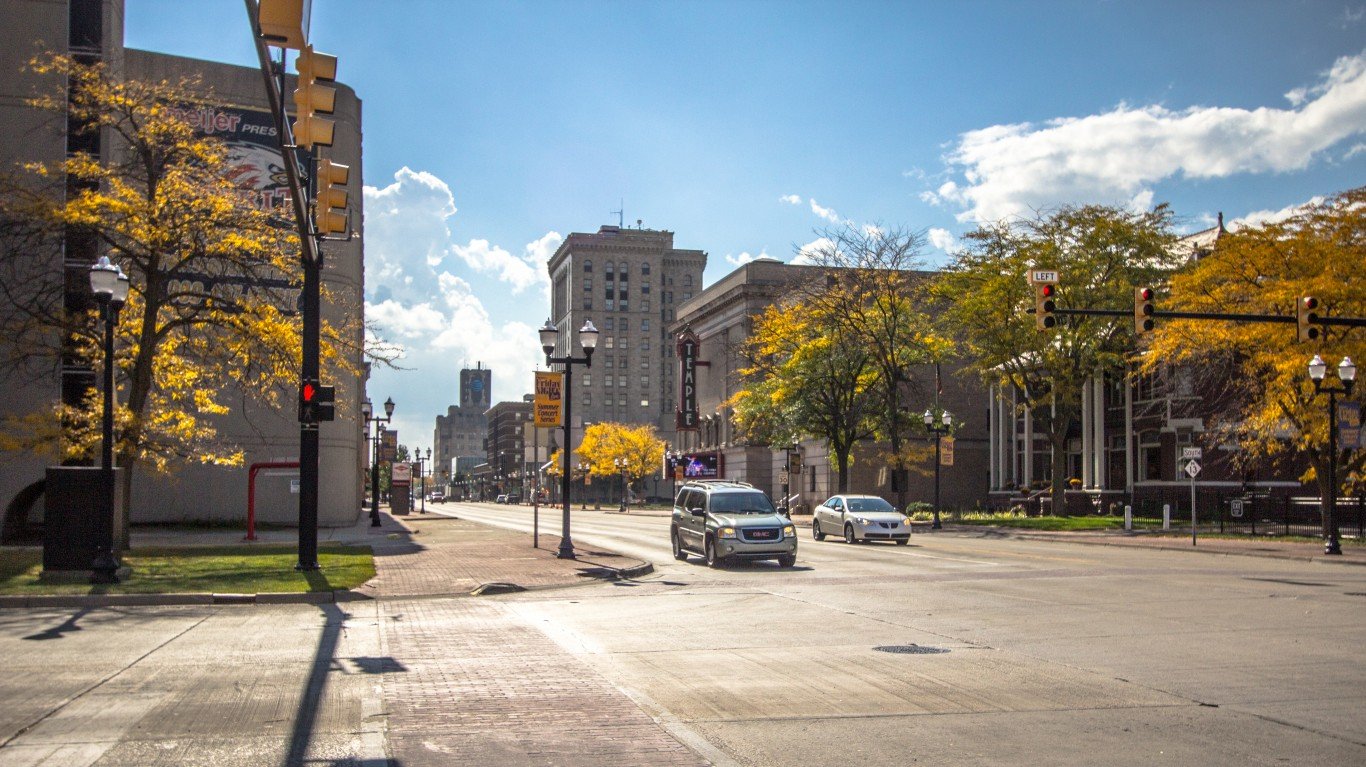
16. Flint, MI
> Concentrated poverty rate: 25.6% of poor pop. living in poor neighborhoods
> Overall poverty rate: 18.0% (38th highest of any MSA)
> Neighborhoods in extreme poverty: 19 of 132 tracts
> Avg. household income: $34,789 in poor tracts, $72,556 in all others

15. Gadsden, AL
> Concentrated poverty rate: 25.7% of poor pop. living in poor neighborhoods
> Overall poverty rate: 16.0% (87th highest of any MSA)
> Neighborhoods in extreme poverty: 5 of 33 tracts
> Avg. household income: $30,882 in poor tracts, $64,411 in all others
[in-text-ad]

14. Toledo, OH
> Concentrated poverty rate: 25.8% of poor pop. living in poor neighborhoods
> Overall poverty rate: 16.0% (86th highest of any MSA)
> Neighborhoods in extreme poverty: 26 of 220 tracts
> Avg. household income: $31,407 in poor tracts, $77,701 in all others
[recirclink id=1148209]
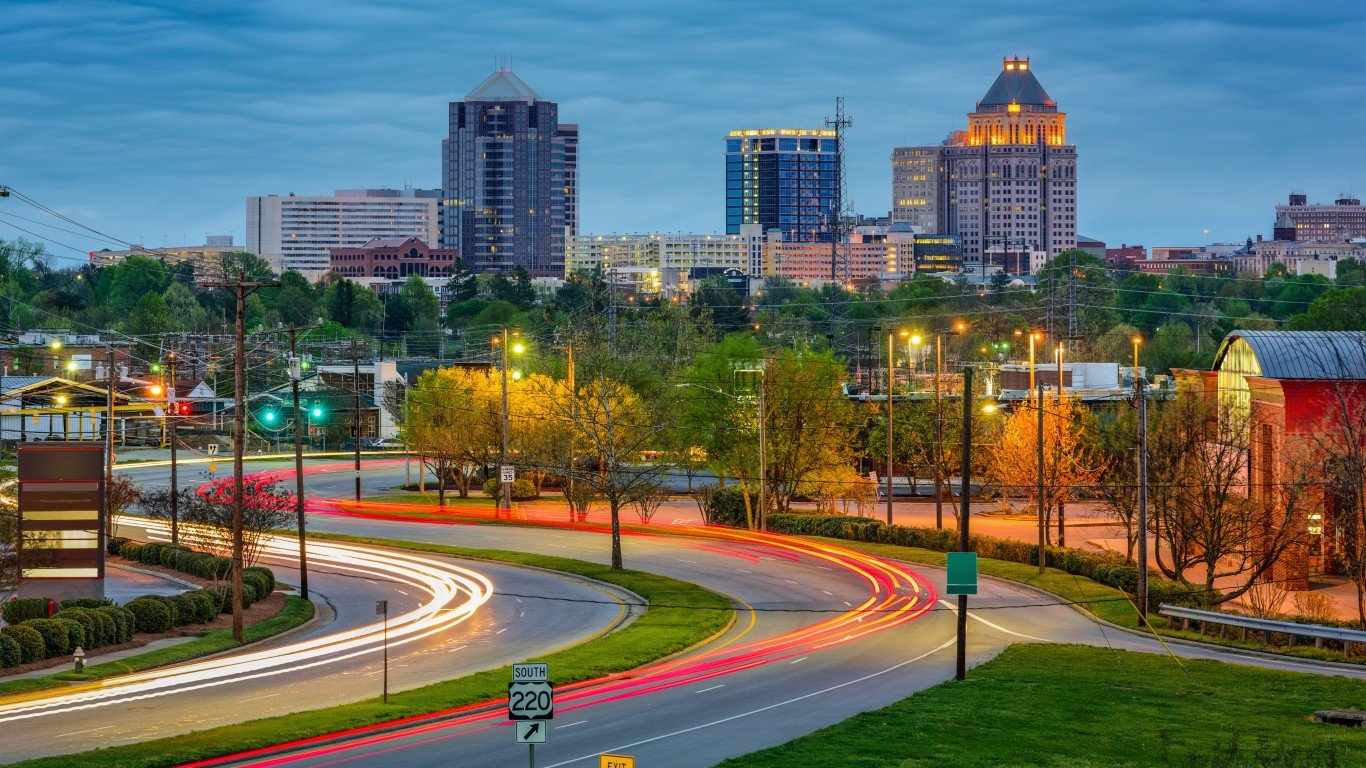
13. Goldsboro, NC
> Concentrated poverty rate: 26.3% of poor pop. living in poor neighborhoods
> Overall poverty rate: 18.7% (26th highest of any MSA)
> Neighborhoods in extreme poverty: 4 of 30 tracts
> Avg. household income: $39,193 in poor tracts, $68,466 in all others
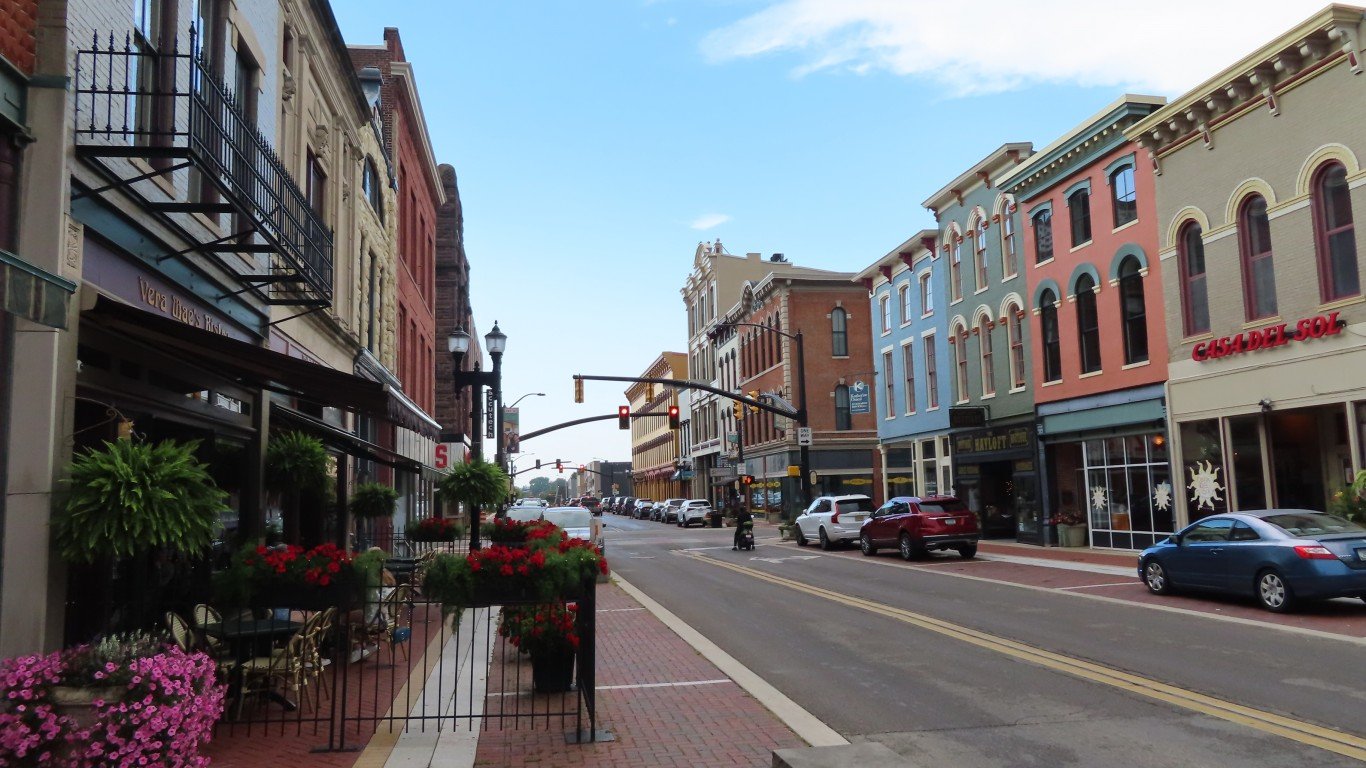
12. Muncie, IN
> Concentrated poverty rate: 26.6% of poor pop. living in poor neighborhoods
> Overall poverty rate: 17.9% (41st highest of any MSA)
> Neighborhoods in extreme poverty: 5 of 31 tracts
> Avg. household income: $39,382 in poor tracts, $66,633 in all others
[in-text-ad-2]
11. Niles, MI
> Concentrated poverty rate: 26.7% of poor pop. living in poor neighborhoods
> Overall poverty rate: 16.3% (73rd highest of any MSA)
> Neighborhoods in extreme poverty: 5 of 53 tracts
> Avg. household income: $30,492 in poor tracts, $77,896 in all others

10. Danville, IL
> Concentrated poverty rate: 26.7% of poor pop. living in poor neighborhoods
> Overall poverty rate: 19.0% (22nd highest of any MSA)
> Neighborhoods in extreme poverty: 3 of 24 tracts
> Avg. household income: $38,053 in poor tracts, $64,029 in all others
[in-text-ad]

9. Shreveport-Bossier City, LA
> Concentrated poverty rate: 27.8% of poor pop. living in poor neighborhoods
> Overall poverty rate: 20.9% (14th highest of any MSA)
> Neighborhoods in extreme poverty: 16 of 115 tracts
> Avg. household income: $35,163 in poor tracts, $83,317 in all others
[recirclink id=1147757]
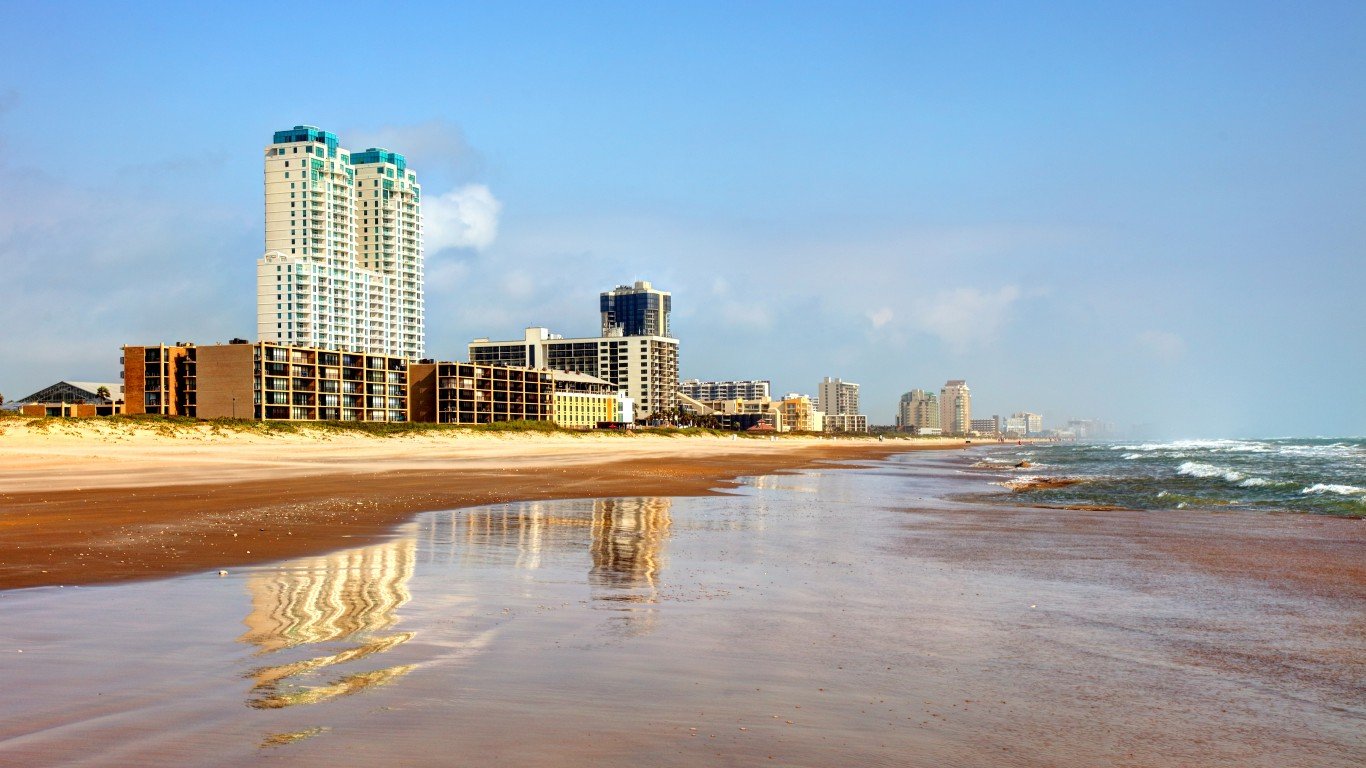
8. Brownsville-Harlingen, TX
> Concentrated poverty rate: 28.1% of poor pop. living in poor neighborhoods
> Overall poverty rate: 26.7% (2nd highest of any MSA)
> Neighborhoods in extreme poverty: 22 of 118 tracts
> Avg. household income: $36,723 in poor tracts, $61,429 in all others
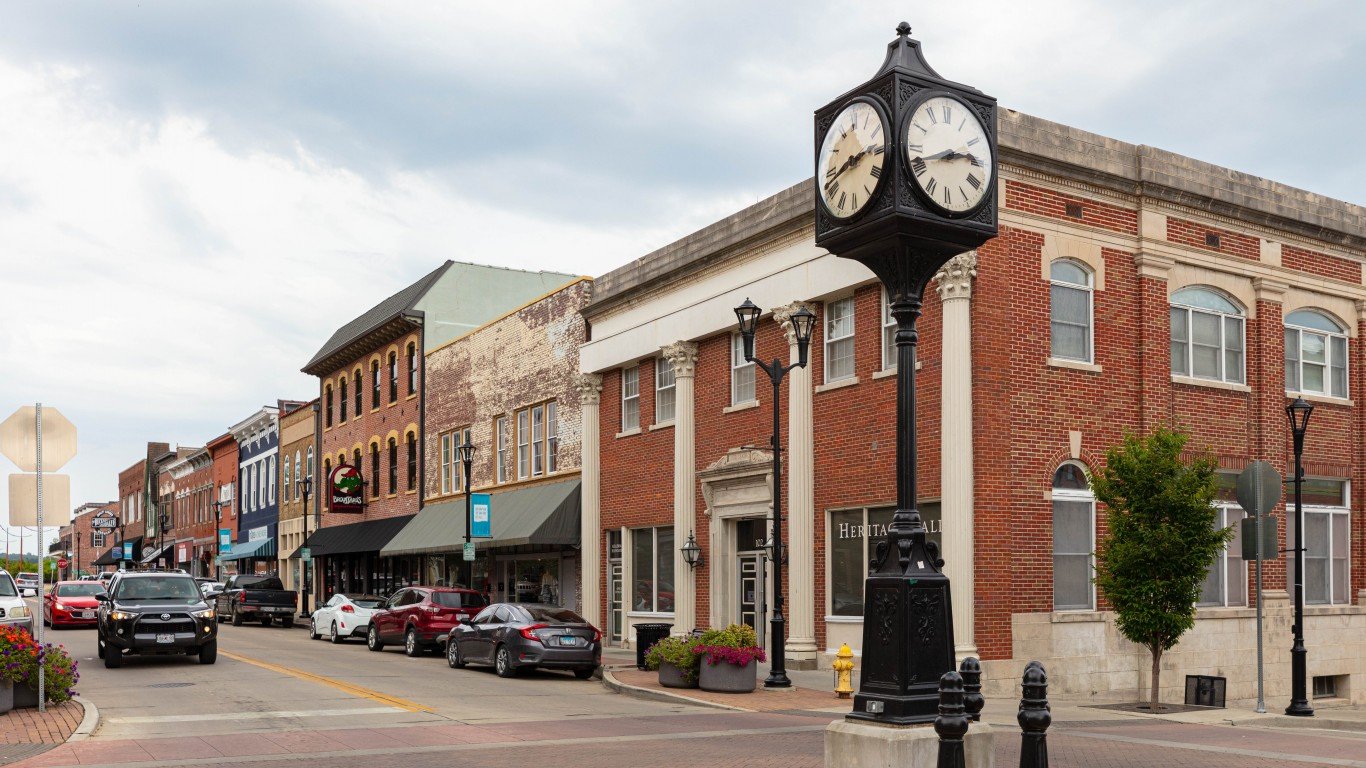
7. Cape Girardeau, MO-IL
> Concentrated poverty rate: 28.9% of poor pop. living in poor neighborhoods
> Overall poverty rate: 16.3% (74th highest of any MSA)
> Neighborhoods in extreme poverty: 4 of 25 tracts
> Avg. household income: $32,882 in poor tracts, $70,861 in all others
[in-text-ad-2]
6. Saginaw, MI
> Concentrated poverty rate: 32.4% of poor pop. living in poor neighborhoods
> Overall poverty rate: 17.4% (49th highest of any MSA)
> Neighborhoods in extreme poverty: 7 of 60 tracts
> Avg. household income: $37,533 in poor tracts, $72,601 in all others

5. Laredo, TX
> Concentrated poverty rate: 32.5% of poor pop. living in poor neighborhoods
> Overall poverty rate: 24.6% (4th highest of any MSA)
> Neighborhoods in extreme poverty: 15 of 68 tracts
> Avg. household income: $40,552 in poor tracts, $70,975 in all others
[in-text-ad]
4. McAllen-Edinburg-Mission, TX
> Concentrated poverty rate: 35.3% of poor pop. living in poor neighborhoods
> Overall poverty rate: 28.4% (1st highest of any MSA)
> Neighborhoods in extreme poverty: 45 of 210 tracts
> Avg. household income: $40,943 in poor tracts, $63,944 in all others
[recirclink id=1147775]

3. Monroe, LA
> Concentrated poverty rate: 38.4% of poor pop. living in poor neighborhoods
> Overall poverty rate: 23.4% (5th highest of any MSA)
> Neighborhoods in extreme poverty: 13 of 59 tracts
> Avg. household income: $31,202 in poor tracts, $69,834 in all others

2. Macon-Bibb County, GA
> Concentrated poverty rate: 39.2% of poor pop. living in poor neighborhoods
> Overall poverty rate: 21.3% (12nd highest of any MSA)
> Neighborhoods in extreme poverty: 14 of 67 tracts
> Avg. household income: $32,875 in poor tracts, $73,913 in all others
[in-text-ad-2]

1. Albany, GA
> Concentrated poverty rate: 41.9% of poor pop. living in poor neighborhoods
> Overall poverty rate: 23.0% (7th highest of any MSA)
> Neighborhoods in extreme poverty: 11 of 46 tracts
> Avg. household income: $32,999 in poor tracts, $68,610 in all others
Methodology
To identify the 25 cities hit hardest by extreme poverty, 24/7 Wall St. reviewed five-year data on concentrated poverty from the U.S. Census Bureau’s 2020 American Community Survey. Metropolitan areas were ranked based on the share of poor residents who live in extreme poverty neighborhoods – census tracts with a poverty rate of 40% or higher. This measure is called the extreme or concentrated poverty rate, and is calculated by aggregating data from the census tract level to the metropolitan area level.
In our analysis, we only considered census tracts with at least 500 people and college or graduate school enrollment below 50%. Metro areas were also excluded if over 20% of the population in tracts or neighborhoods of concentrated poverty were college or university students. Data was aggregated using boundary definitions for March 2020 from the Census Bureau.
All other data referenced, including educational attainment, homeownership, internet access, SNAP benefit recipiency, average household income, and unemployment are also from the 2020 ACS. Figures were aggregated from the census tract to the metropolitan level.
Contact [email protected] for any questions or corrections.