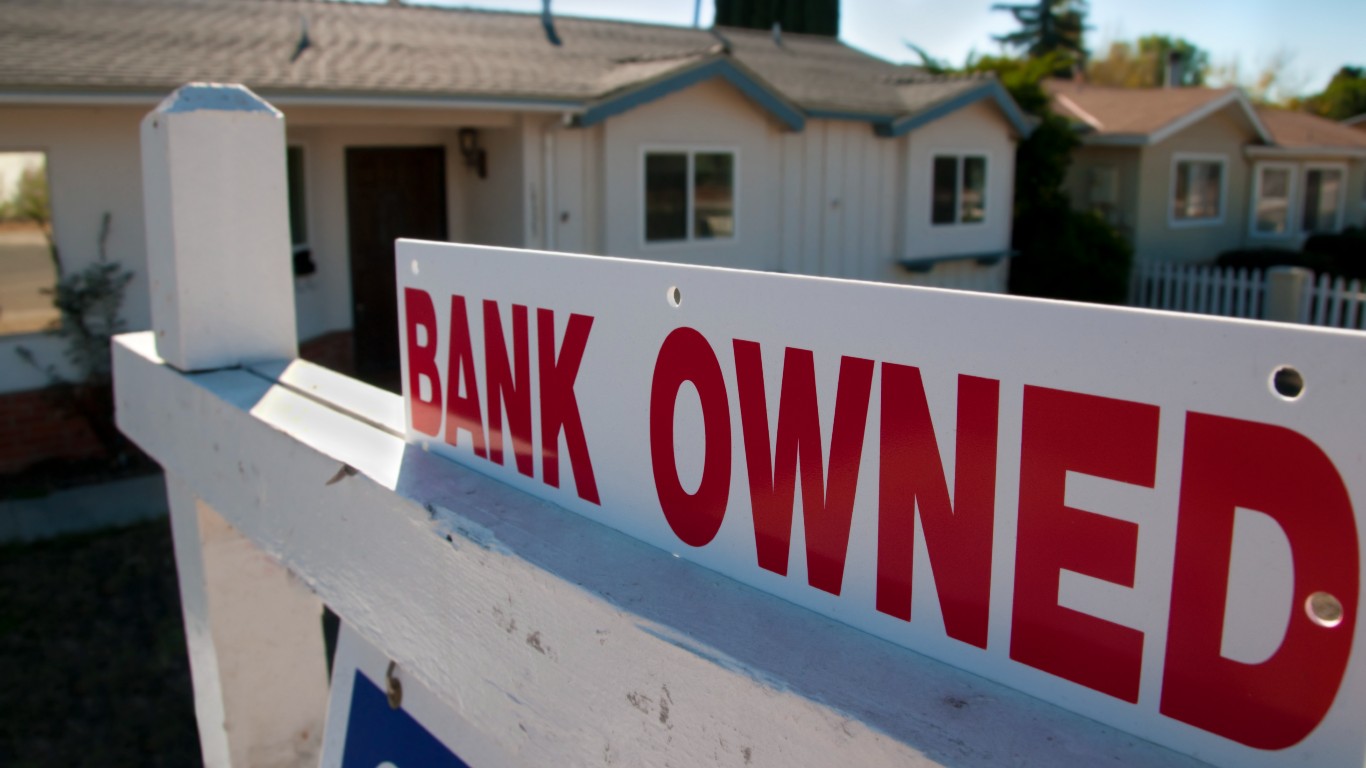
Foreclosure activity in the U.S. is on the rise. In the first six months of the year, default notices, scheduled auctions, or bank repossessions, increased by 13% compared to the first half of last year, and by 185% compared to the first six months of 2021, according to land, property, and real estate data provider ATTOM.
The highest number of foreclosure filings were reported in Illinois, New Jersey, and Maryland, while the largest increases in foreclosures occurred in Maryland, Oregon, and Alaska. Nationwide, 0.13% of properties had foreclosure filings from January to June, or 1 out of 752 properties. (Also see, America’s 25 least affordable housing markets.)
At a more granular level, metropolitan areas in Ohio, New Jersey, and North Carolina recently recorded the highest foreclosure rates.
To find the 30 cities with the highest foreclosure rates, 24/7 Wall St. reviewed the report Foreclosure Activity In First Half Of 2023 Ticks Upwards Toward Pre-Covid Levels from ATTOM. The report considered 223 metropolitan statistical areas with a population of at least 200,000. Foreclosure and population data is from ATTOM’s report, while sales data is from its report on home sales in the second quarter of 2023. For the sales data, ATTOM considered only metro areas with 1,000 or more sales in the second quarter of 2023.
The 30 cities on the list reported foreclosure rates of between 1 out of every 301 properties in the Cleveland-Elyria, Ohio, metro area to 1 out of 494 properties in South Bend-Mishawaka, which straddles the borders between Indiana and Michigan.
Foreclosure activity increased in 20 of these 30 metro areas compared to the first six months of 2022, led by the Baltimore area of Maryland and the Pensacola area of Florida. Five of these cities reported increases of more than 20% compared to the same period in last year.
Compared to the first six months of 2021, foreclosures have jumped by more than 200% in a dozen of these cities, led by a 391% jump in the Baltimore metro area, and a 313% leap in the Philadelphia metro area, which spans four states — Pennsylvania, New Jersey, Delaware, and Maryland. (Find if any of these cities are also among the American cities where renting is least affordable.)
In nine of the cities on the list, large increases in foreclosures compared to the first half of 2021 were followed by notable decreases compared to the first six months of last year. For example, foreclosure activity in Columbia, South Carolina, increased by 207% compared to January-June, 2021 but decreased by 2.4% compared to the first half of last year. Other metro areas that recorded similar rebounds include Trenton, New Jersey, and Akron, Ohio.
Despite a nationwide increase, foreclosure rates are not even close to what they were during and after the 2007-09 housing bubble burst and economic crisis. In the first half of 2010, foreclosure activity peaked at over 1.65 million properties with foreclosure filings. In the first half of 2023, there were 185,580 such properties. This figure is still lower than the 296,458 foreclosure filings in the first six months of 2019, before the coronavirus pandemic and the ensuing federal and state temporary moratoriums on foreclosures, but it is trending higher and foreclosure activity is likely to continue to increase in the coming years, according to ATTOM.
Here are the cities with the highest foreclosure rates.
30. South Bend-Mishawaka, IN-MI
> Foreclosure rate, Jan-Jun 2023: 1 in every 494 housing units
> Properties w/ FC filings, Jan-Jun 2023: 290 out of 143,182 housing units
> Chg in foreclosures from Jan-Jun 2022: -6.1%
> Chg in foreclosures from Jan-Jun 2021: +88.3%
> Chg in median sales price, Q2 2022-Q3 2023: +1.4% (from $182,500 to $185,000)
> Population: 323,681
[in-text-ad]
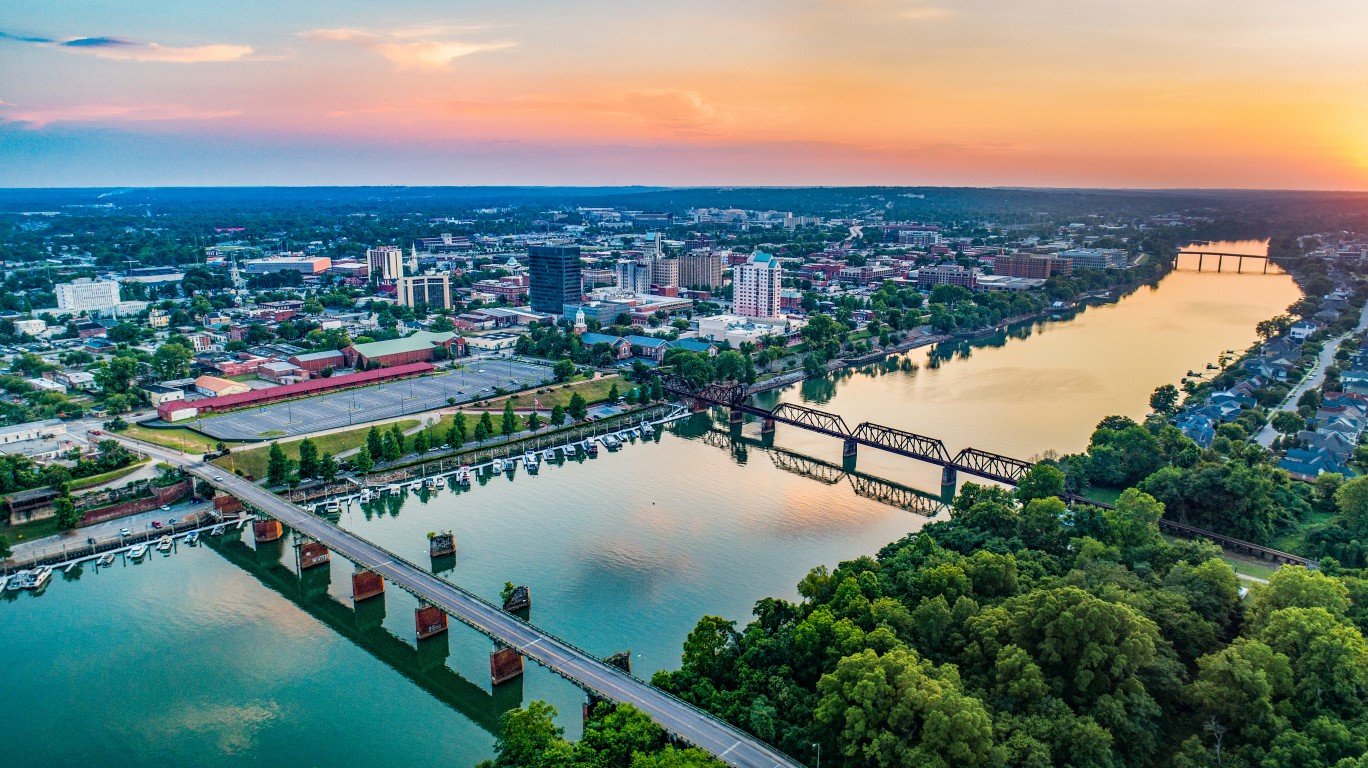
29. Augusta-Richmond County, GA-SC
> Foreclosure rate, Jan-Jun 2023: 1 in every 490 housing units
> Properties w/ FC filings, Jan-Jun 2023: 535 out of 261,944 housing units
> Chg in foreclosures from Jan-Jun 2022: +7.4%
> Chg in foreclosures from Jan-Jun 2021: +132.6%
> Chg in median sales price, Q2 2022-Q3 2023: +11.9% (from $210,000 to $235,000)
> Population: 607,673
[recirclink id=1215636]

28. Vallejo-Fairfield, CA
> Foreclosure rate, Jan-Jun 2023: 1 in every 486 housing units
> Properties w/ FC filings, Jan-Jun 2023: 332 out of 161,341 housing units
> Chg in foreclosures from Jan-Jun 2022: +21.2%
> Chg in foreclosures from Jan-Jun 2021: +228.7%
> Chg in median sales price, Q2 2022-Q3 2023: -5.6% (from $600,000 to $566,375)
> Population: 451,432
27. Palm Bay-Melbourne-Titusville, FL
> Foreclosure rate, Jan-Jun 2023: 1 in every 481 housing units
> Properties w/ FC filings, Jan-Jun 2023: 596 out of 286,497 housing units
> Chg in foreclosures from Jan-Jun 2022: +9.4%
> Chg in foreclosures from Jan-Jun 2021: +150.4%
> Chg in median sales price, Q2 2022-Q3 2023: +6.1% (from $330,000 to $350,000)
> Population: 601,573
[in-text-ad-2]
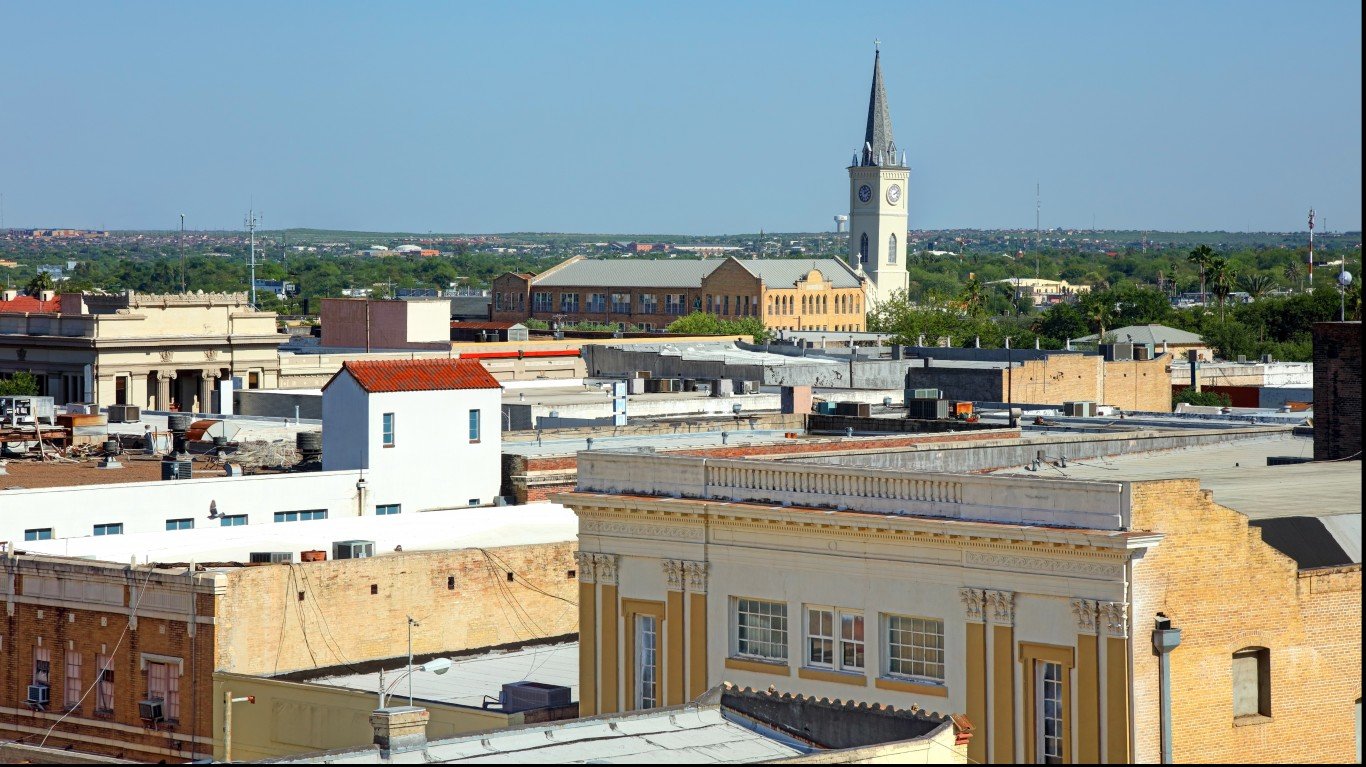
26. Laredo, TX
> Foreclosure rate, Jan-Jun 2023: 1 in every 477 housing units
> Properties w/ FC filings, Jan-Jun 2023: 176 out of 83,990 housing units
> Chg in foreclosures from Jan-Jun 2022: +16.6%
> Chg in foreclosures from Jan-Jun 2021: +193.3%
> Chg in median sales price, Q2 2022-Q3 2023: N/A
> Population: 266,963

25. Canton-Massillon, OH
> Foreclosure rate, Jan-Jun 2023: 1 in every 475 housing units
> Properties w/ FC filings, Jan-Jun 2023: 379 out of 180,171 housing units
> Chg in foreclosures from Jan-Jun 2022: 0.0%
> Chg in foreclosures from Jan-Jun 2021: +151.0%
> Chg in median sales price, Q2 2022-Q3 2023: +7.6% (from $170,000 to $183,000)
> Population: 401,578
[in-text-ad]
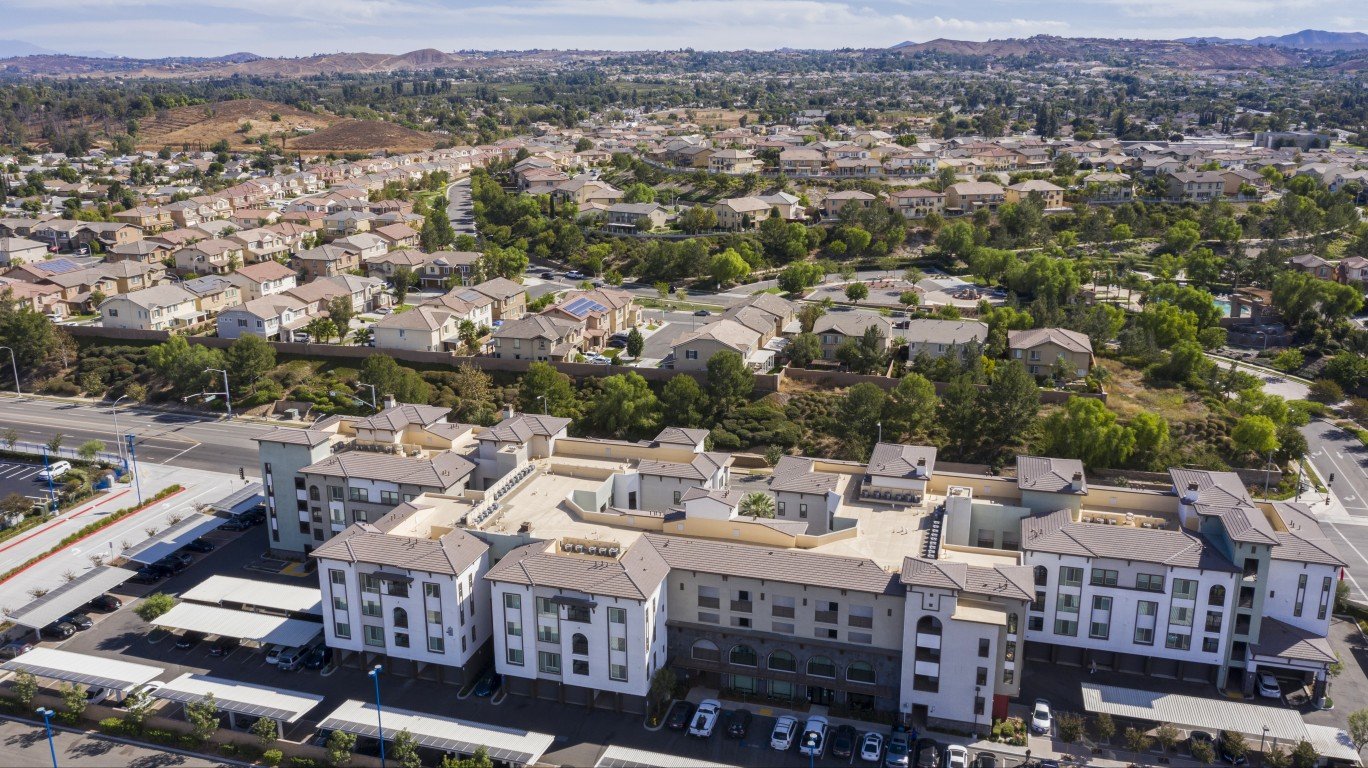
24. Riverside-San Bernardino-Ontario, CA
> Foreclosure rate, Jan-Jun 2023: 1 in every 474 housing units
> Properties w/ FC filings, Jan-Jun 2023: 3,321 out of 1,573,099 housing units
> Chg in foreclosures from Jan-Jun 2022: +12.5%
> Chg in foreclosures from Jan-Jun 2021: +153.7%
> Chg in median sales price, Q2 2022-Q3 2023: -1.8% (from $555,000 to $545,000)
> Population: 4,580,402
[recirclink id=1180521]

23. Bakersfield, CA
> Foreclosure rate, Jan-Jun 2023: 1 in every 473 housing units
> Properties w/ FC filings, Jan-Jun 2023: 634 out of 299,810 housing units
> Chg in foreclosures from Jan-Jun 2022: -4.8%
> Chg in foreclosures from Jan-Jun 2021: +123.2%
> Chg in median sales price, Q2 2022-Q3 2023: -1.5% (from $335,000 to $330,000)
> Population: 905,644
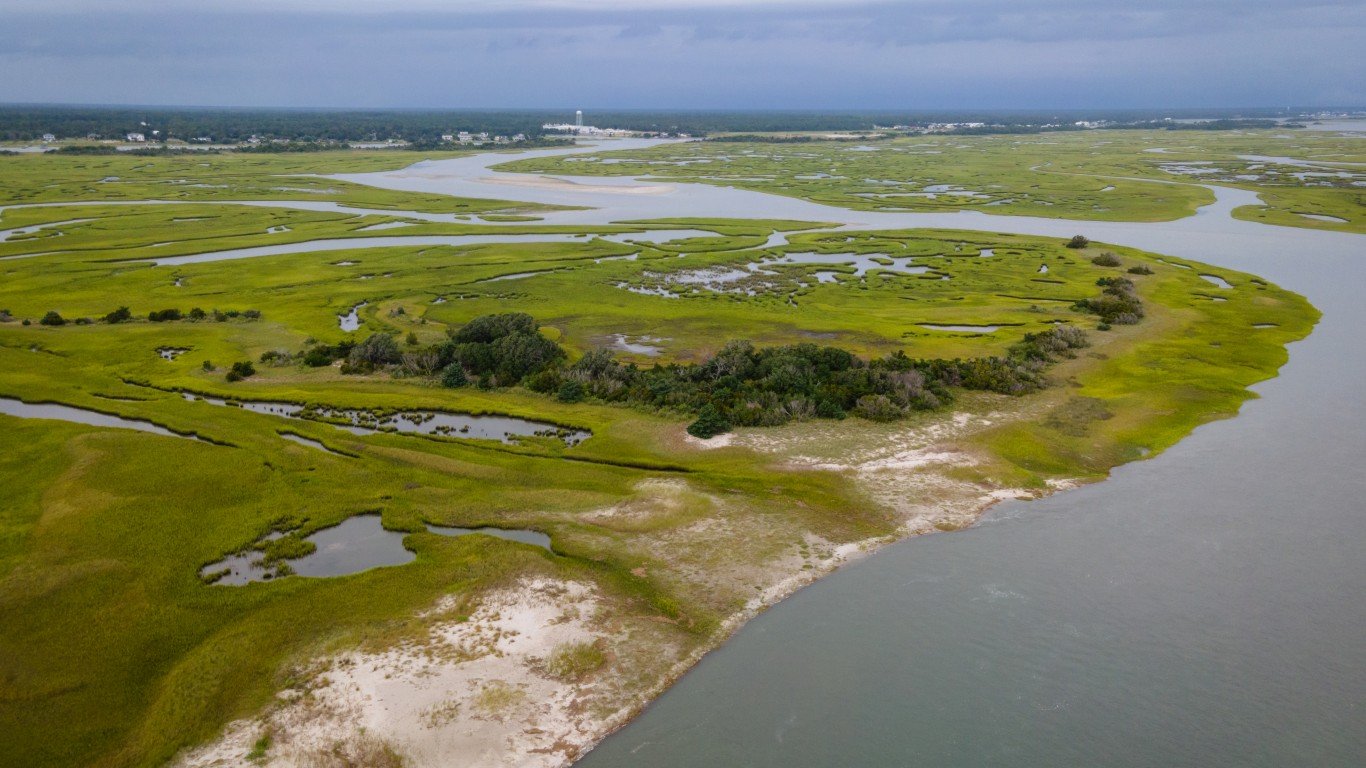
22. Jacksonville, NC
> Foreclosure rate, Jan-Jun 2023: 1 in every 465 housing units
> Properties w/ FC filings, Jan-Jun 2023: 179 out of 83,146 housing units
> Chg in foreclosures from Jan-Jun 2022: -31.7%
> Chg in foreclosures from Jan-Jun 2021: +82.7%
> Chg in median sales price, Q2 2022-Q3 2023: +9.6% (from $240,000 to $263,000)
> Population: 201,597
[in-text-ad-2]
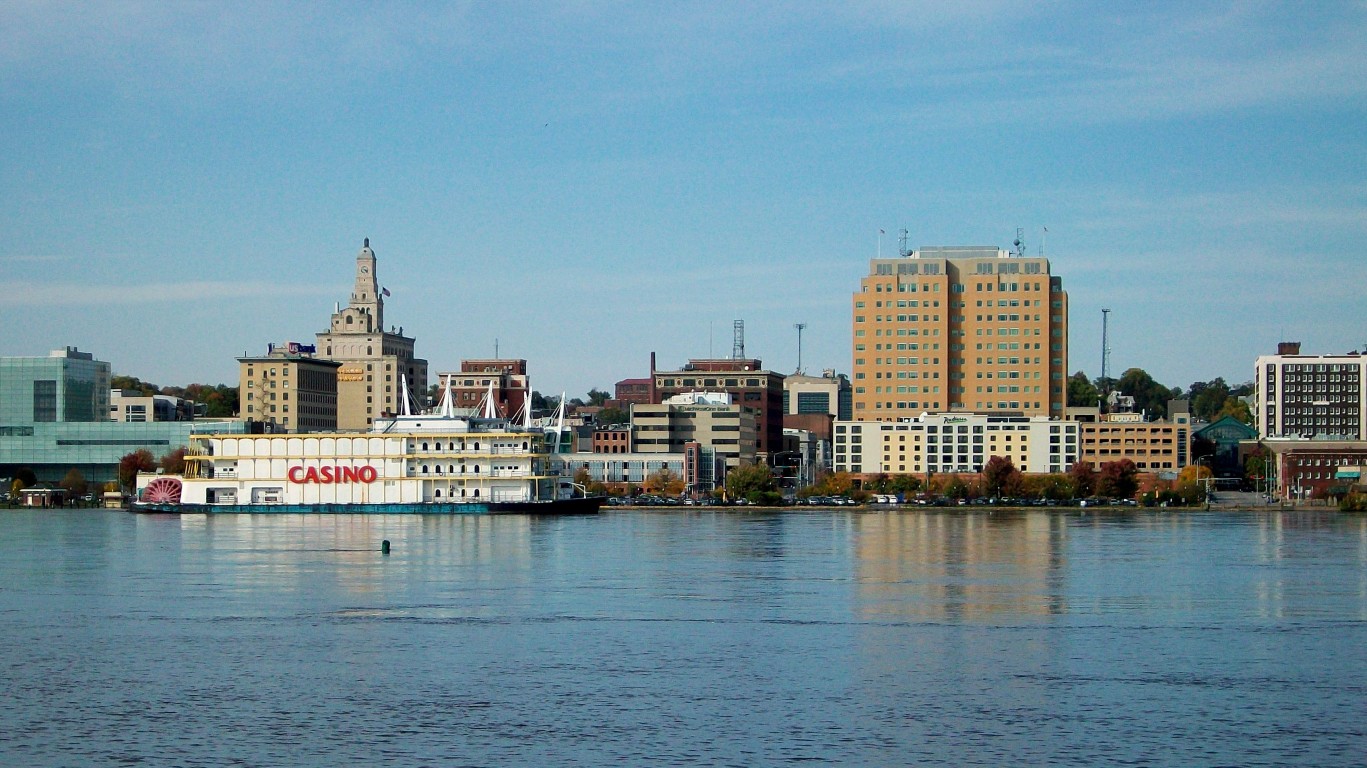
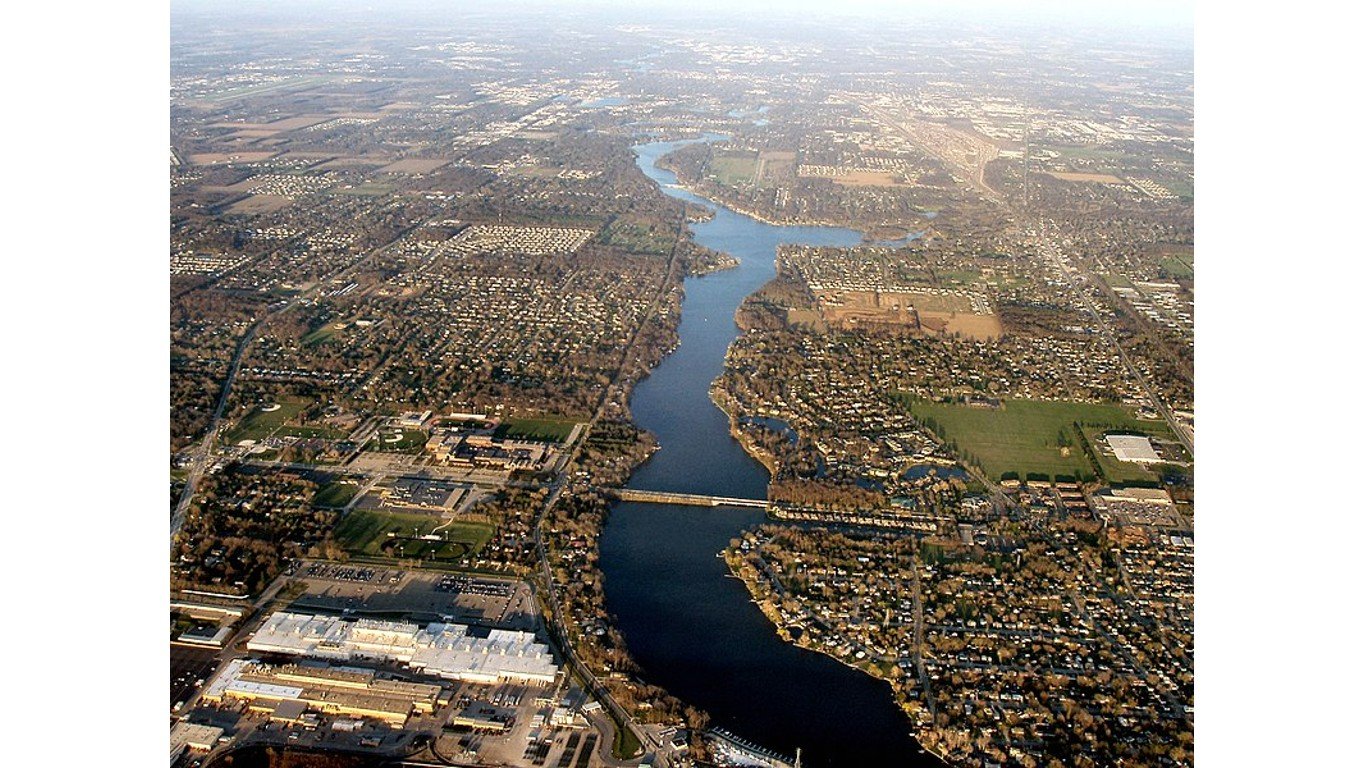
21. Davenport-Moline-Rock Island, IA-IL
> Foreclosure rate, Jan-Jun 2023: 1 in every 464 housing units
> Properties w/ FC filings, Jan-Jun 2023: 373 out of 173,256 housing units
> Chg in foreclosures from Jan-Jun 2022: +3.0%
> Chg in foreclosures from Jan-Jun 2021: +93.3%
> Chg in median sales price, Q2 2022-Q3 2023: N/A
> Population: 384,055

20. Trenton, NJ
> Foreclosure rate, Jan-Jun 2023: 1 in every 456 housing units
> Properties w/ FC filings, Jan-Jun 2023: 328 out of 149,573 housing units
> Chg in foreclosures from Jan-Jun 2022: -6.6%
> Chg in foreclosures from Jan-Jun 2021: +215.4%
> Chg in median sales price, Q2 2022-Q3 2023: N/A
> Population: 384,951
[in-text-ad]
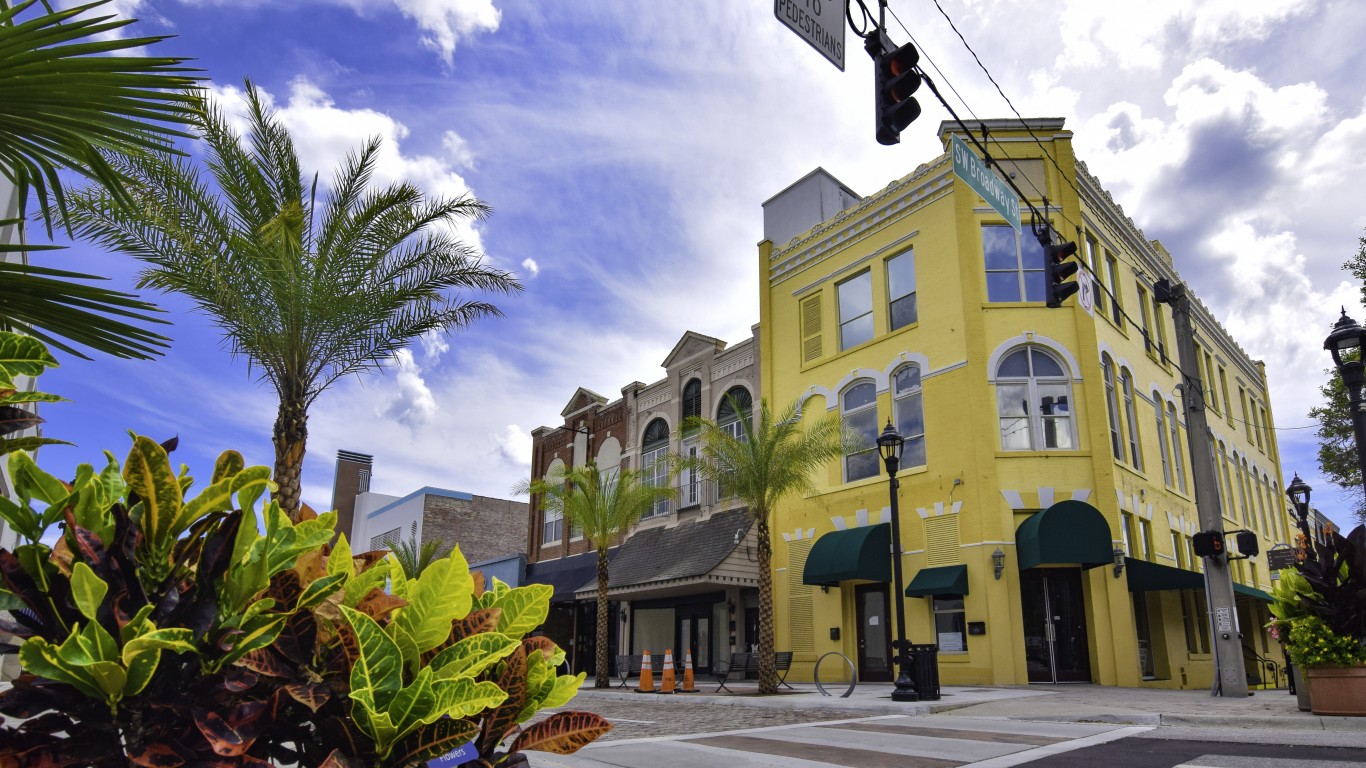
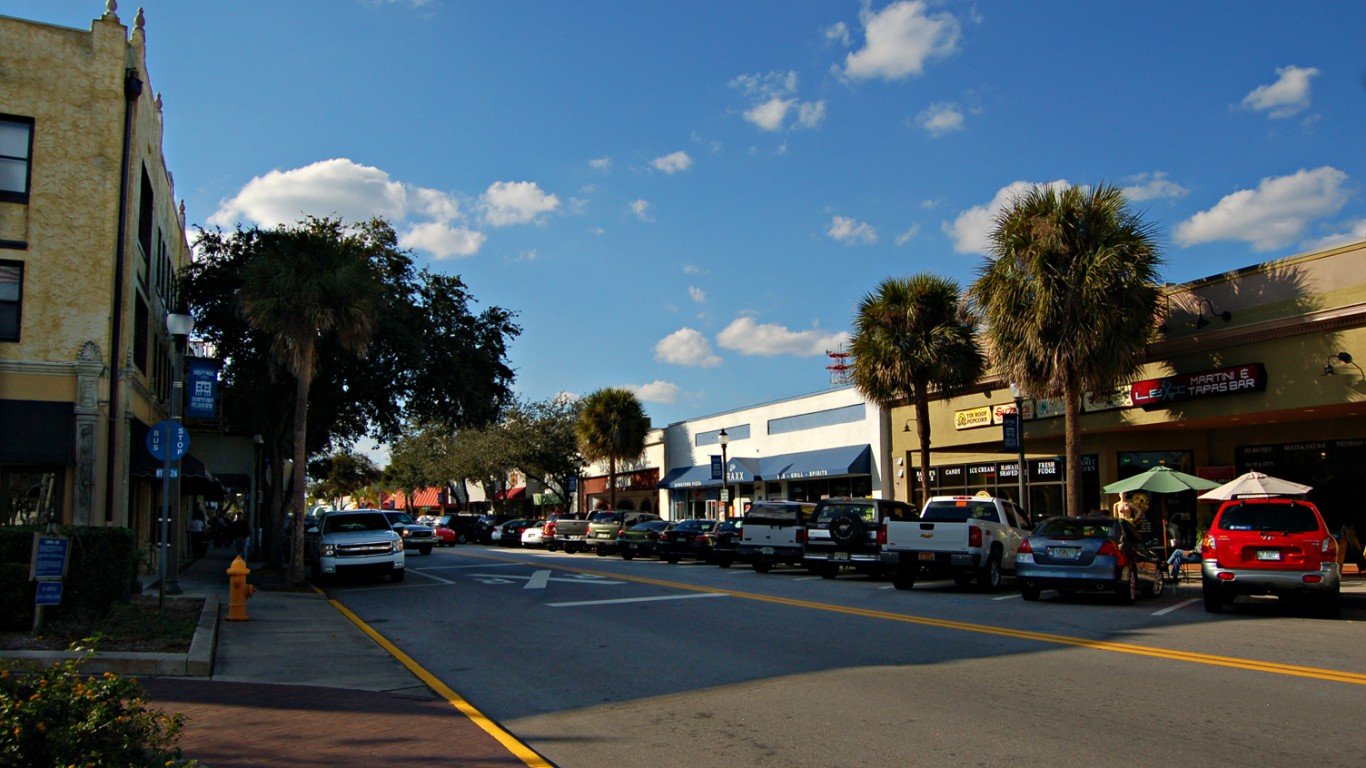
19. Ocala, FL
> Foreclosure rate, Jan-Jun 2023: 1 in every 435 housing units
> Properties w/ FC filings, Jan-Jun 2023: 403 out of 175,486 housing units
> Chg in foreclosures from Jan-Jun 2022: +9.8%
> Chg in foreclosures from Jan-Jun 2021: +126.4%
> Chg in median sales price, Q2 2022-Q3 2023: +2.4% (from $249,000 to $255,000)
> Population: 370,372
[recirclink id=1260535]

18. Baltimore-Columbia-Towson, MD
> Foreclosure rate, Jan-Jun 2023: 1 in every 431 housing units
> Properties w/ FC filings, Jan-Jun 2023: 2,752 out of 1,184,833 housing units
> Chg in foreclosures from Jan-Jun 2022: +92.4%
> Chg in foreclosures from Jan-Jun 2021: +390.6%
> Chg in median sales price, Q2 2022-Q3 2023: -4.2% (from $340,000 to $325,813)
> Population: 2,837,237
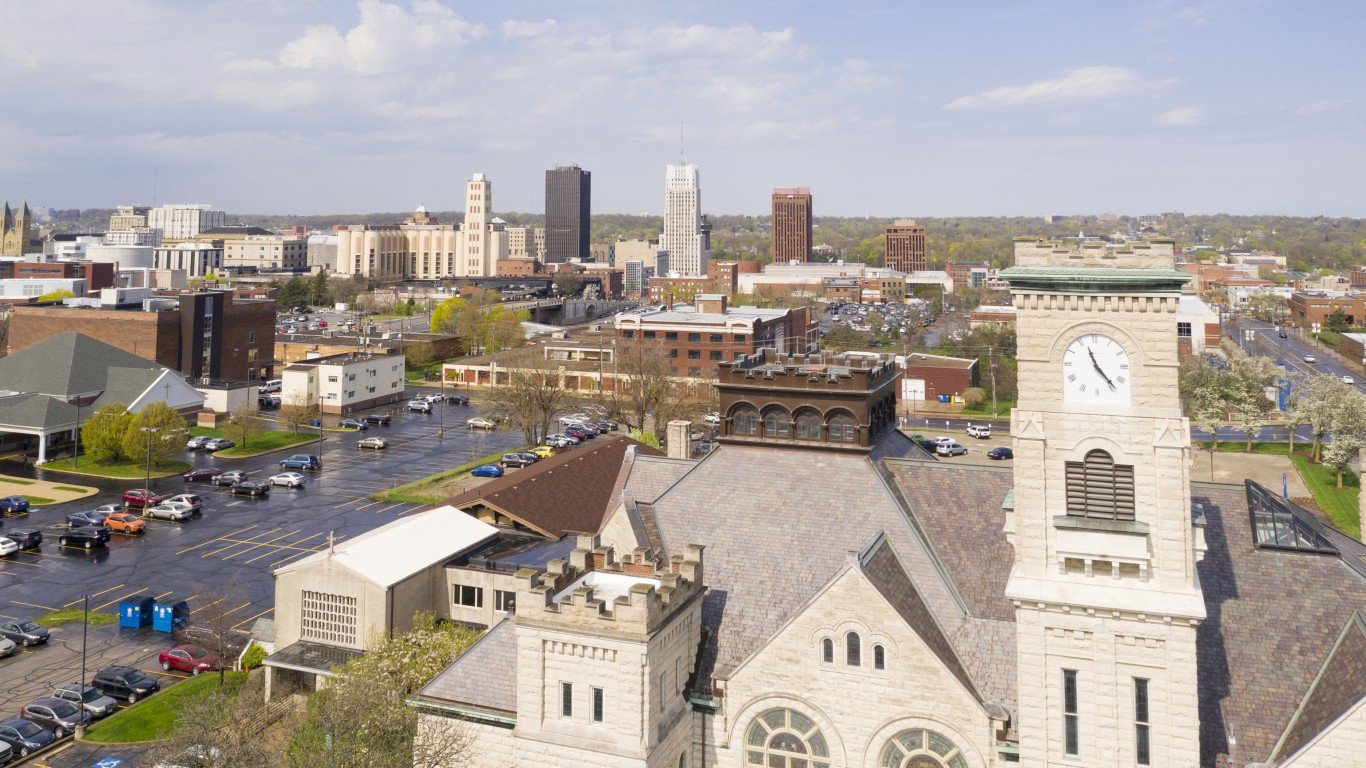
17. Akron, OH
> Foreclosure rate, Jan-Jun 2023: 1 in every 430 housing units
> Properties w/ FC filings, Jan-Jun 2023: 737 out of 316,748 housing units
> Chg in foreclosures from Jan-Jun 2022: -4.7%
> Chg in foreclosures from Jan-Jun 2021: +132.5%
> Chg in median sales price, Q2 2022-Q3 2023: +6.6% (from $176,283 to $188,000)
> Population: 702,464
[in-text-ad-2]

16. Pensacola-Ferry Pass-Brent, FL
> Foreclosure rate, Jan-Jun 2023: 1 in every 428 housing units
> Properties w/ FC filings, Jan-Jun 2023: 513 out of 219,576 housing units
> Chg in foreclosures from Jan-Jun 2022: +34.3%
> Chg in foreclosures from Jan-Jun 2021: +130.0%
> Chg in median sales price, Q2 2022-Q3 2023: 0.0% (from $300,000 to $300,000)
> Population: 503,173

15. Orlando-Kissimmee-Sanford, FL
> Foreclosure rate, Jan-Jun 2023: 1 in every 428 housing units
> Properties w/ FC filings, Jan-Jun 2023: 2,504 out of 1,071,445 housing units
> Chg in foreclosures from Jan-Jun 2022: +15.3%
> Chg in foreclosures from Jan-Jun 2021: +224.8%
> Chg in median sales price, Q2 2022-Q3 2023: +2.7% (from $375,000 to $385,000)
> Population: 2,632,721
[in-text-ad]

14. Las Vegas-Henderson-Paradise, NV
> Foreclosure rate, Jan-Jun 2023: 1 in every 424 housing units
> Properties w/ FC filings, Jan-Jun 2023: 2,148 out of 910,667 housing units
> Chg in foreclosures from Jan-Jun 2022: +12.1%
> Chg in foreclosures from Jan-Jun 2021: +219.2%
> Chg in median sales price, Q2 2022-Q3 2023: -7.7% (from $444,000 to $410,000)
> Population: 2,231,147
[recirclink id=1259887]

13. Macon, GA
> Foreclosure rate, Jan-Jun 2023: 1 in every 419 housing units
> Properties w/ FC filings, Jan-Jun 2023: 247 out of 103,588 housing units
> Chg in foreclosures from Jan-Jun 2022: +4.2%
> Chg in foreclosures from Jan-Jun 2021: +90.0%
> Chg in median sales price, Q2 2022-Q3 2023: N/A
> Population: 233,026

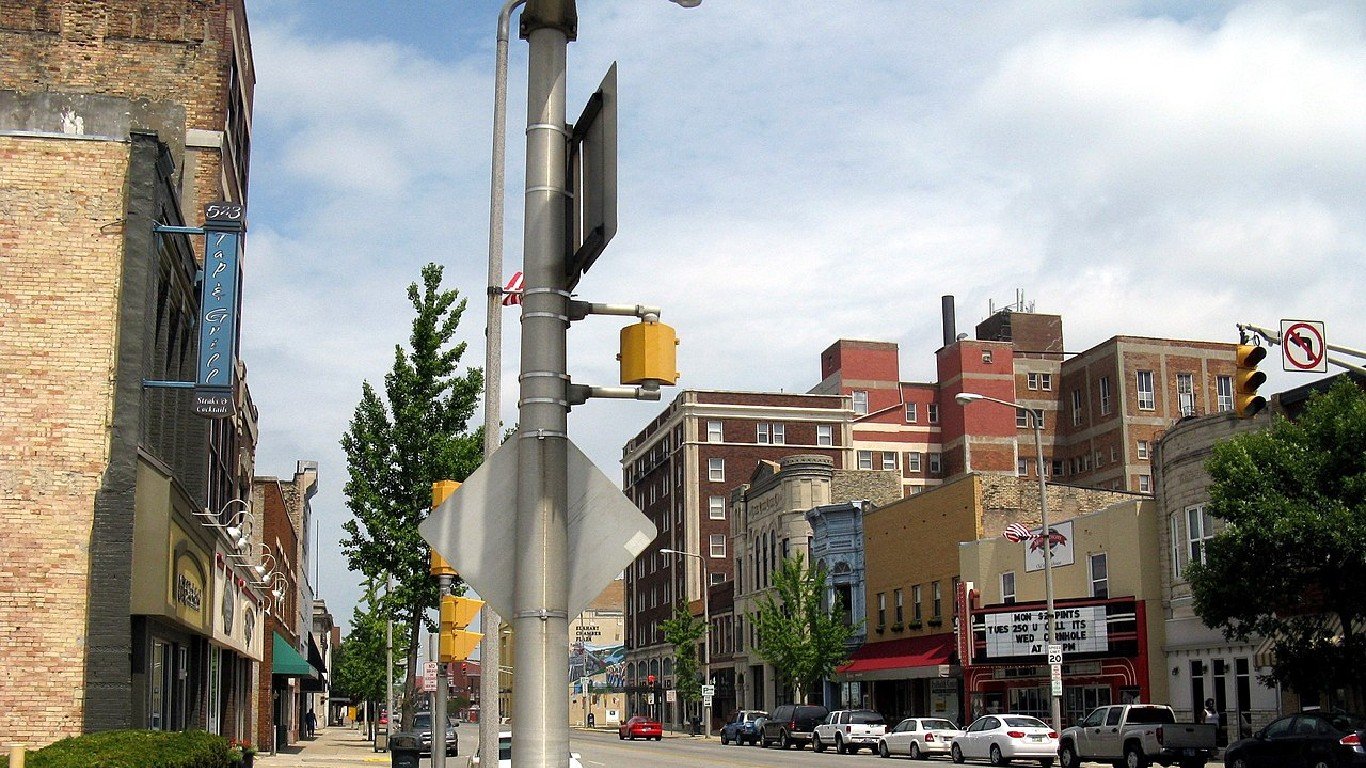
12. Peoria, IL
> Foreclosure rate, Jan-Jun 2023: 1 in every 405 housing units
> Properties w/ FC filings, Jan-Jun 2023: 414 out of 167,620 housing units
> Chg in foreclosures from Jan-Jun 2022: +13.4%
> Chg in foreclosures from Jan-Jun 2021: +102.9%
> Chg in median sales price, Q2 2022-Q3 2023: N/A
> Population: 370,204
[in-text-ad-2]
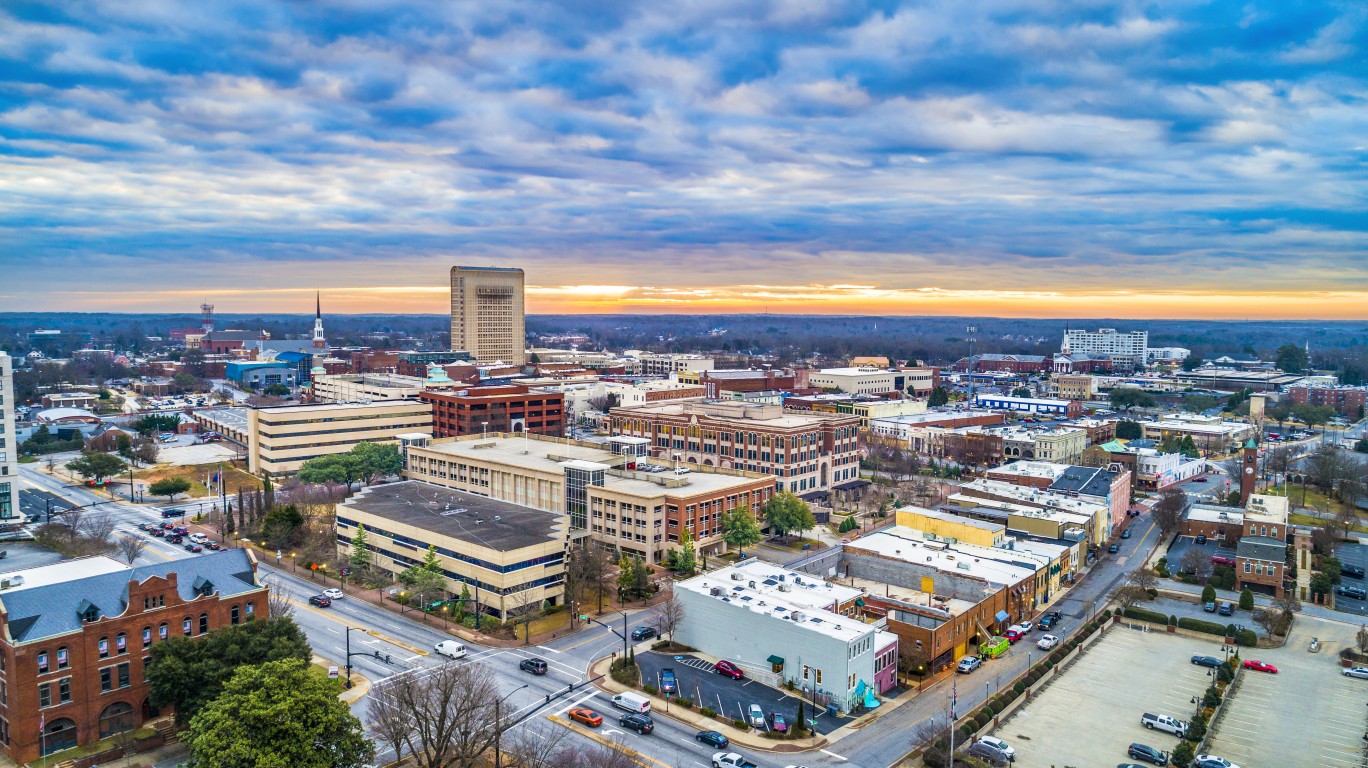
11. Spartanburg, SC
> Foreclosure rate, Jan-Jun 2023: 1 in every 399 housing units
> Properties w/ FC filings, Jan-Jun 2023: 372 out of 148,609 housing units
> Chg in foreclosures from Jan-Jun 2022: +13.4%
> Chg in foreclosures from Jan-Jun 2021: +232.1%
> Chg in median sales price, Q2 2022-Q3 2023: +1.7% (from $235,000 to $239,000)
> Population: 350,170
10. Elkhart-Goshen, IN
> Foreclosure rate, Jan-Jun 2023: 1 in every 395 housing units
> Properties w/ FC filings, Jan-Jun 2023: 201 out of 79,411 housing units
> Chg in foreclosures from Jan-Jun 2022: +24.1%
> Chg in foreclosures from Jan-Jun 2021: +229.5%
> Chg in median sales price, Q2 2022-Q3 2023: N/A
> Population: 206,314
[in-text-ad]

9. Philadelphia-Camden-Wilmington, PA-NJ-DE-MD
> Foreclosure rate, Jan-Jun 2023: 1 in every 394 housing units
> Properties w/ FC filings, Jan-Jun 2023: 6,530 out of 2,571,175 housing units
> Chg in foreclosures from Jan-Jun 2022: +17.1%
> Chg in foreclosures from Jan-Jun 2021: +312.5%
> Chg in median sales price, Q2 2022-Q3 2023: +5.0% (from $300,000 to $315,000)
> Population: 6,215,222
[recirclink id=1259901]

8. Florence, SC
> Foreclosure rate, Jan-Jun 2023: 1 in every 391 housing units
> Properties w/ FC filings, Jan-Jun 2023: 230 out of 89,818 housing units
> Chg in foreclosures from Jan-Jun 2022: +3.1%
> Chg in foreclosures from Jan-Jun 2021: +111.0%
> Chg in median sales price, Q2 2022-Q3 2023: N/A
> Population: 200,709

7. Jacksonville, FL
> Foreclosure rate, Jan-Jun 2023: 1 in every 390 housing units
> Properties w/ FC filings, Jan-Jun 2023: 1,741 out of 679,655 housing units
> Chg in foreclosures from Jan-Jun 2022: +9.9%
> Chg in foreclosures from Jan-Jun 2021: +151.6%
> Chg in median sales price, Q2 2022-Q3 2023: 0.0% (from $335,000 to $335,000)
> Population: 1,581,680
[in-text-ad-2]

6. Chicago-Naperville-Elgin, IL-IN-WI
> Foreclosure rate, Jan-Jun 2023: 1 in every 358 housing units
> Properties w/ FC filings, Jan-Jun 2023: 10,963 out of 3,926,750 housing units
> Chg in foreclosures from Jan-Jun 2022: -6.7%
> Chg in foreclosures from Jan-Jun 2021: +219.5%
> Chg in median sales price, Q2 2022-Q3 2023: +4.8% (from $290,000 to $304,000)
> Population: 9,607,711
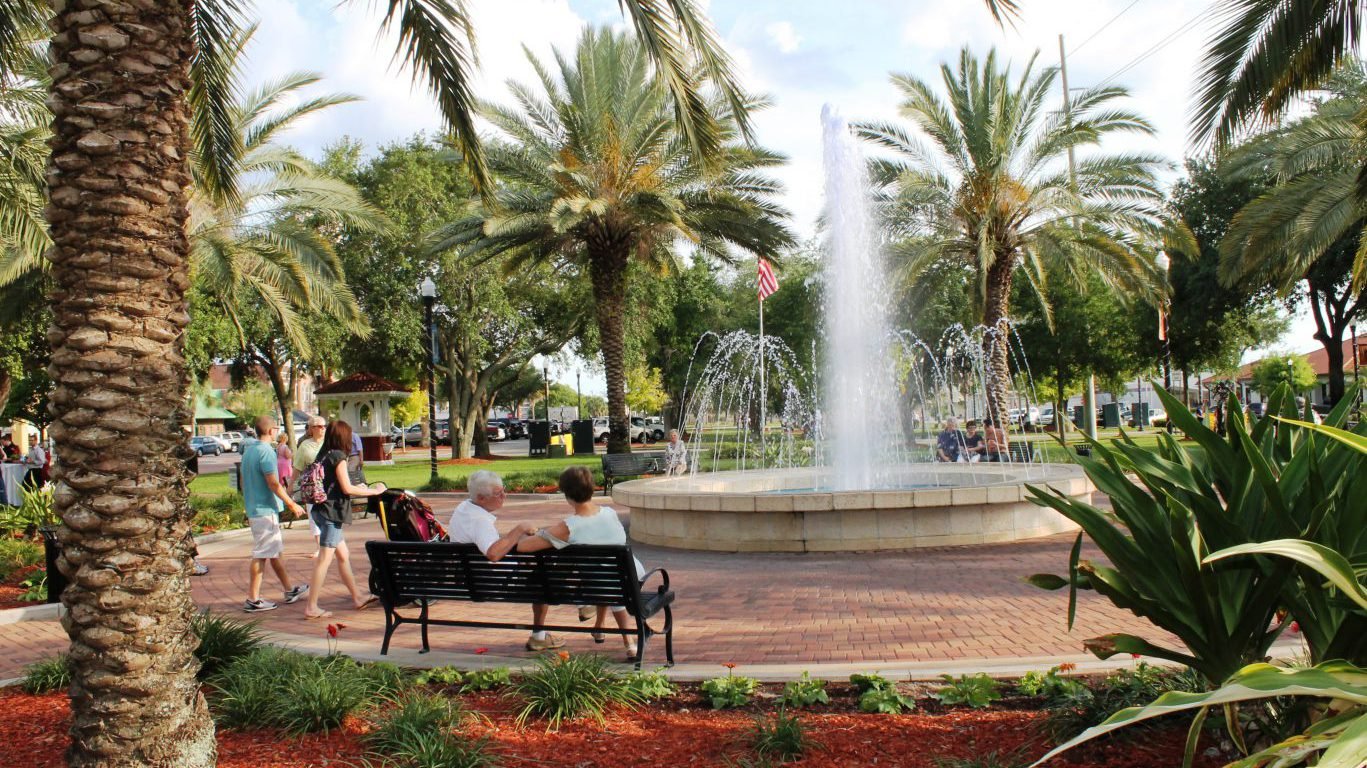
5. Lakeland-Winter Haven, FL
> Foreclosure rate, Jan-Jun 2023: 1 in every 347 housing units
> Properties w/ FC filings, Jan-Jun 2023: 897 out of 311,599 housing units
> Chg in foreclosures from Jan-Jun 2022: +4.2%
> Chg in foreclosures from Jan-Jun 2021: +221.5%
> Chg in median sales price, Q2 2022-Q3 2023: -0.0% (from $315,000 to $314,950)
> Population: 713,148
[in-text-ad]
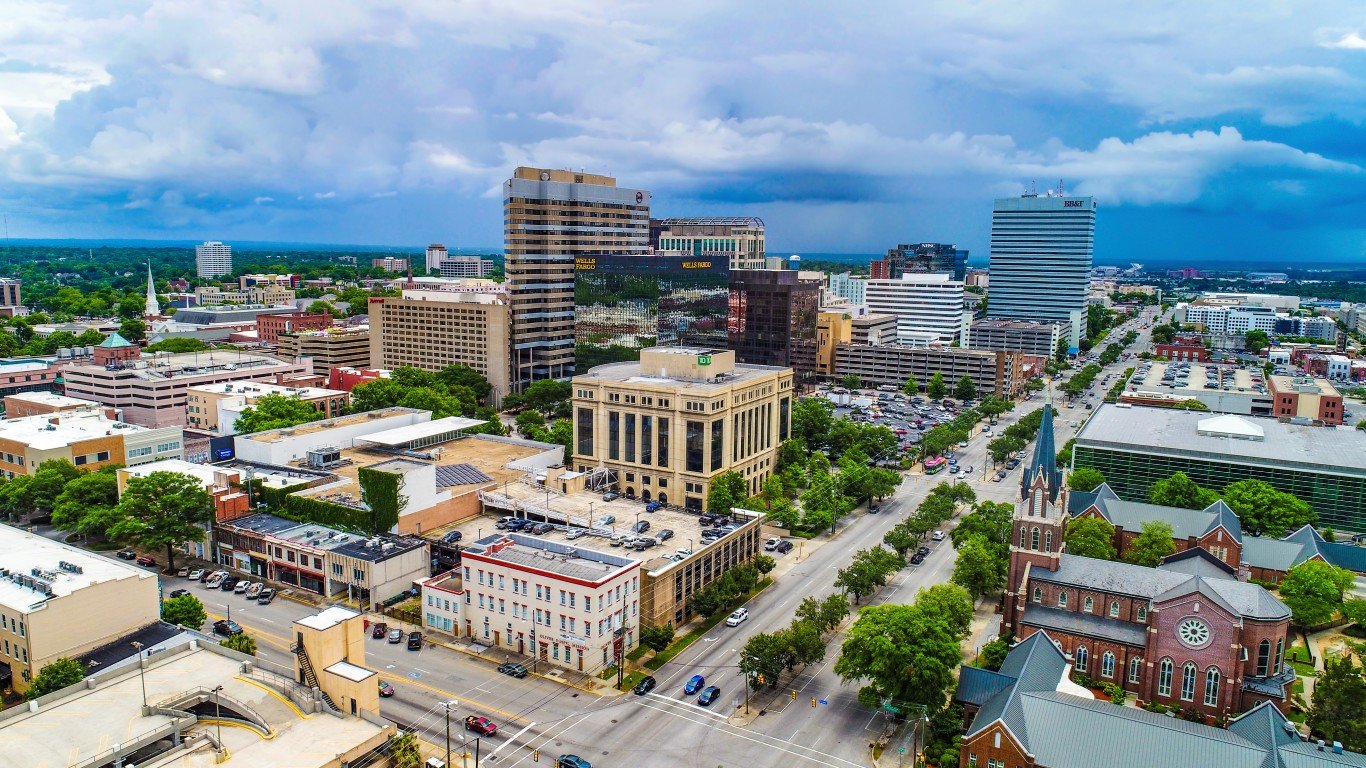
4. Columbia, SC
> Foreclosure rate, Jan-Jun 2023: 1 in every 342 housing units
> Properties w/ FC filings, Jan-Jun 2023: 1,063 out of 363,274 housing units
> Chg in foreclosures from Jan-Jun 2022: -2.4%
> Chg in foreclosures from Jan-Jun 2021: +207.2%
> Chg in median sales price, Q2 2022-Q3 2023: -0.4% (from $230,000 to $229,000)
> Population: 825,823
[recirclink id=1215636]
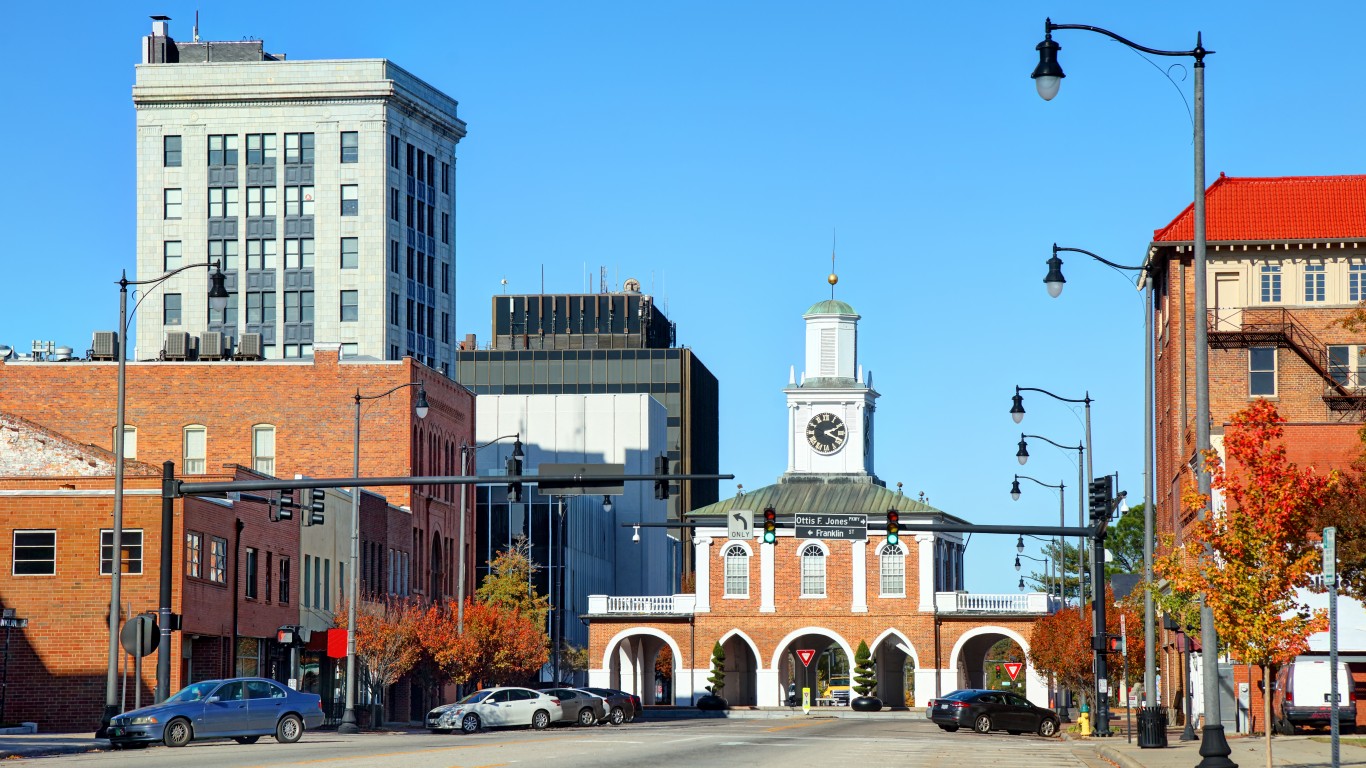
3. Fayetteville, NC
> Foreclosure rate, Jan-Jun 2023: 1 in every 337 housing units
> Properties w/ FC filings, Jan-Jun 2023: 482 out of 162,650 housing units
> Chg in foreclosures from Jan-Jun 2022: +23.9%
> Chg in foreclosures from Jan-Jun 2021: +251.8%
> Chg in median sales price, Q2 2022-Q3 2023: +8.9% (from $202,000 to $220,000)
> Population: 385,751

2. Atlantic City-Hammonton, NJ
> Foreclosure rate, Jan-Jun 2023: 1 in every 307 housing units
> Properties w/ FC filings, Jan-Jun 2023: 429 out of 131,505 housing units
> Chg in foreclosures from Jan-Jun 2022: -1.6%
> Chg in foreclosures from Jan-Jun 2021: +193.8%
> Chg in median sales price, Q2 2022-Q3 2023: +0.8% (from $265,000 to $267,000)
> Population: 273,865
[in-text-ad-2]
1. Cleveland-Elyria, OH
> Foreclosure rate, Jan-Jun 2023: 1 in every 301 housing units
> Properties w/ FC filings, Jan-Jun 2023: 3,209 out of 966,969 housing units
> Chg in foreclosures from Jan-Jun 2022: -17.1%
> Chg in foreclosures from Jan-Jun 2021: +125.2%
> Chg in median sales price, Q2 2022-Q3 2023: +5.3% (from $190,000 to $200,000)
> Population: 2,084,462
Contact [email protected] for any questions or corrections.