With a workplace fatality rate more than four times higher than average, jobs in law enforcement are among the most dangerous in the United States. As first responders, police officers regularly put themselves in harm’s way – and each year, dozens of them are killed in the line of duty, accidentally or otherwise.
Between 2013 and 2022, 973 police officers across the 50 states were killed on the job. About half of these fatalities resulted from an accident – typically involving a motor vehicle crash while on patrol, pursuing a suspect, or responding to an emergency. The other half, meanwhile, were homicide victims. In most felony killings of police in the U.S., victim officers are fatally shot – often while investigating a suspicious person or activity, attempting to restrain a suspect, or conducting a traffic stop. (Here is a look at the 23 most dangerous jobs in America.)
According to FBI data, however, law enforcement officers are statistically at far higher risk in some parts of the country than in others.
Using data from the FBI’s Uniform Crime Reporting Program, 24/7 Wall St. identified the most dangerous states for law enforcement. States are ranked by the number of police officers killed on the job in the last 10 years (2013 to 2022) for every 10,000 officers serving in 2022. Only four states – Rhode Island, South Dakota, Vermont, and Wyoming – reported no law enforcement fatalities in the past decade and are not included in this analysis.
Among the 46 states on this list, law enforcement fatality rates between 2013 and 2022 range from about 3 for every 10,000 police officers, to over 57 per 10,000. Nationwide, the number of police killed while on duty climbed by 55% in the last 10 years – and in half of the states on this list, law enforcement fatalities either hit or matched a 10-year high in one the last three years. (Here is a look at the standard police sidearm in America’s 10 biggest cities.)
The most dangerous states for police are disproportionately concentrated in the South, while the least dangerous are clustered in the Northeast. Police fatality rates also appear to be closely correlated to overall crime rates. In nine of the 10 most dangerous states for law enforcement, the overall murder rate exceeds the national homicide rate of 6.5 murders per 100,000 people. Meanwhile, all but one of the 10 least dangerous states on this list reported homicide rates below the national average in 2020, the most recent year of comprehensive FBI data.
Here are the most dangerous states for law enforcement.
Source: Adonis page / iStock Editorial via Getty Images
46. New Jersey
> Law enforcement officers killed on-duty, 2013-2022: 3.4 per 10,000 police officers (13 total)
> Officers killed feloniously, 2013-2022: 2 (15.4% of fatalities in state)
> Officers killed accidentally, 2013-2022: 11 (84.6% of fatalities in state)
> Deadliest year(s) for law enforcement from 2013-2022: 2014, 2015 (3 fatalities each year year)
> Overall homicide rate, 2020: 3.7 murders per 100,000 people (15th lowest of 50 states)
> Total law enforcement officers in state, 2022: 38,021
Source: Alexandre Tziripouloff / iStock Editorial via Getty Images
45. Massachusetts
> Law enforcement officers killed on-duty, 2013-2022: 5.3 per 10,000 police officers (9 total)
> Officers killed feloniously, 2013-2022: 4 (44.4% of fatalities in state)
> Officers killed accidentally, 2013-2022: 5 (55.6% of fatalities in state)
> Deadliest year(s) for law enforcement from 2013-2022: 2016, 2018 (2 fatalities each year year)
> Overall homicide rate, 2020: 2.3 murders per 100,000 people (5th lowest of 50 states)
> Total law enforcement officers in state, 2022: 16,957

Source: tillsonburg / iStock Unreleased via Getty Images
44. New York
> Law enforcement officers killed on-duty, 2013-2022: 5.4 per 10,000 police officers (33 total)
> Officers killed feloniously, 2013-2022: 15 (45.5% of fatalities in state)
> Officers killed accidentally, 2013-2022: 18 (54.5% of fatalities in state)
> Deadliest year(s) for law enforcement from 2013-2022: 2014 (8 fatalities)
> Overall homicide rate, 2020: 4.2 murders per 100,000 people (18th lowest of 50 states)
> Total law enforcement officers in state, 2022: 61,184

43. Minnesota
> Law enforcement officers killed on-duty, 2013-2022: 6.0 per 10,000 police officers (6 total)
> Officers killed feloniously, 2013-2022: 3 (50.0% of fatalities in state)
> Officers killed accidentally, 2013-2022: 3 (50.0% of fatalities in state)
> Deadliest year(s) for law enforcement from 2013-2022: 2021 (2 fatalities)
> Overall homicide rate, 2020: 3.4 murders per 100,000 people (11th lowest of 50 states)
> Total law enforcement officers in state, 2022: 9,972
Source: Scott Olson / Getty Images News via Getty Images
42. Oregon
> Law enforcement officers killed on-duty, 2013-2022: 6.3 per 10,000 police officers (4 total)
> Officers killed feloniously, 2013-2022: 2 (50.0% of fatalities in state)
> Officers killed accidentally, 2013-2022: 2 (50.0% of fatalities in state)
> Deadliest year(s) for law enforcement from 2013-2022: 2021 (2 fatalities)
> Overall homicide rate, 2020: 2.9 murders per 100,000 people (7th lowest of 50 states)
> Total law enforcement officers in state, 2022: 6,303

Source: CRobertson / iStock Editorial via Getty Images
41. Idaho
> Law enforcement officers killed on-duty, 2013-2022: 6.4 per 10,000 police officers (2 total)
> Officers killed feloniously, 2013-2022: 1 (50.0% of fatalities in state)
> Officers killed accidentally, 2013-2022: 1 (50.0% of fatalities in state)
> Deadliest year(s) for law enforcement from 2013-2022: 2015, 2020 (1 fatalities each year year)
> Overall homicide rate, 2020: 2.2 murders per 100,000 people (3rd lowest of 50 states)
> Total law enforcement officers in state, 2022: 3,120

40. New Hampshire
> Law enforcement officers killed on-duty, 2013-2022: 7.0 per 10,000 police officers (2 total)
> Officers killed feloniously, 2013-2022: 1 (50.0% of fatalities in state)
> Officers killed accidentally, 2013-2022: 1 (50.0% of fatalities in state)
> Deadliest year(s) for law enforcement from 2013-2022: 2014, 2021 (1 fatalities each year year)
> Overall homicide rate, 2020: 0.9 murders per 100,000 people (the lowest of 50 states)
> Total law enforcement officers in state, 2022: 2,854
Source: Bastiaan Slabbers / iStock Unreleased via Getty Images
39. Pennsylvania
> Law enforcement officers killed on-duty, 2013-2022: 8.1 per 10,000 police officers (20 total)
> Officers killed feloniously, 2013-2022: 8 (40.0% of fatalities in state)
> Officers killed accidentally, 2013-2022: 12 (60.0% of fatalities in state)
> Deadliest year(s) for law enforcement from 2013-2022: 2015, 2022 (4 fatalities each year year)
> Overall homicide rate, 2020: 7.9 murders per 100,000 people (12th highest of 50 states)
> Total law enforcement officers in state, 2022: 24,825
Source: carminesalvatore / iStock Editorial via Getty Images
38. Connecticut
> Law enforcement officers killed on-duty, 2013-2022: 8.1 per 10,000 police officers (6 total)
> Officers killed feloniously, 2013-2022: 3 (50.0% of fatalities in state)
> Officers killed accidentally, 2013-2022: 3 (50.0% of fatalities in state)
> Deadliest year(s) for law enforcement from 2013-2022: 2022 (3 fatalities)
> Overall homicide rate, 2020: 3.9 murders per 100,000 people (17th lowest of 50 states)
> Total law enforcement officers in state, 2022: 7,401
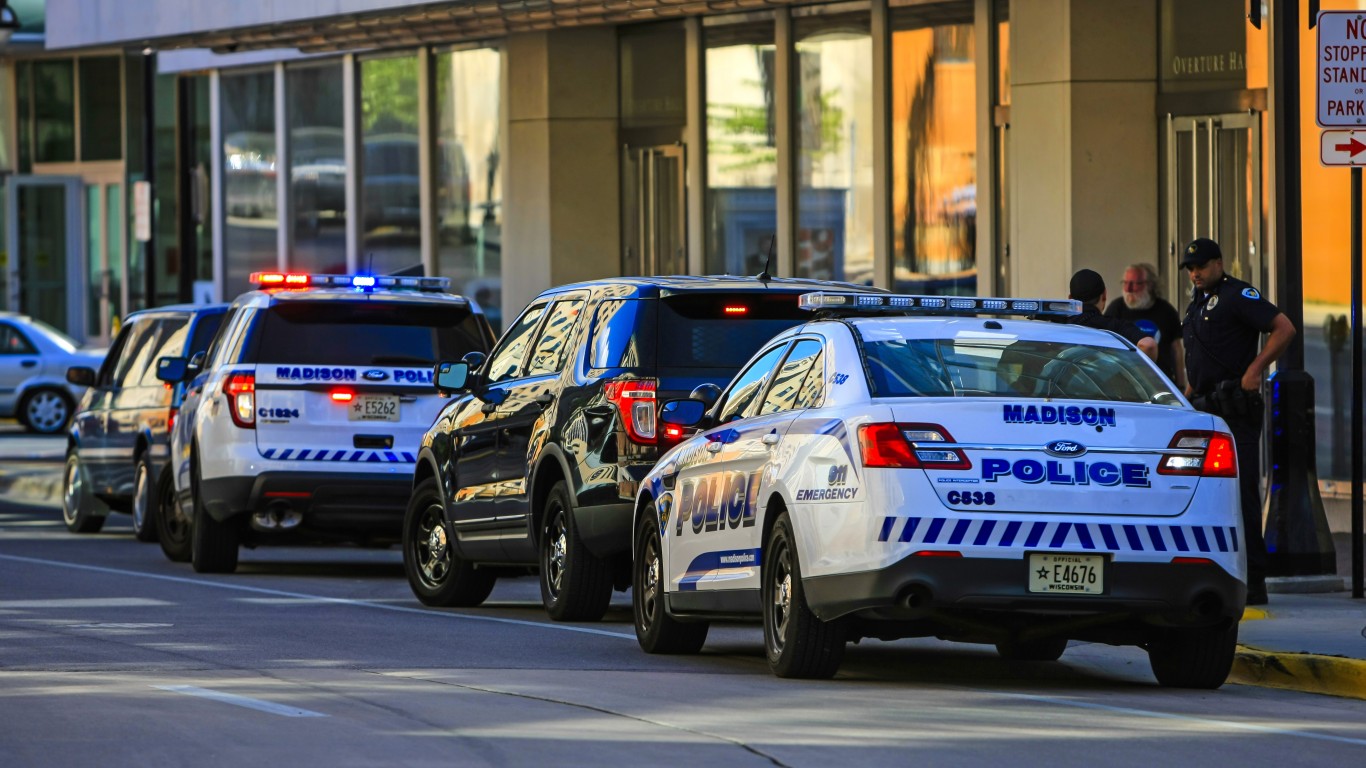
Source: csfotoimages / iStock Editorial via Getty Images
37. Wisconsin
> Law enforcement officers killed on-duty, 2013-2022: 8.6 per 10,000 police officers (11 total)
> Officers killed feloniously, 2013-2022: 7 (63.6% of fatalities in state)
> Officers killed accidentally, 2013-2022: 4 (36.4% of fatalities in state)
> Deadliest year(s) for law enforcement from 2013-2022: 2015, 0 (2 fatalities each year year)
> Overall homicide rate, 2020: 5.3 murders per 100,000 people (23rd lowest of 50 states)
> Total law enforcement officers in state, 2022: 12,849
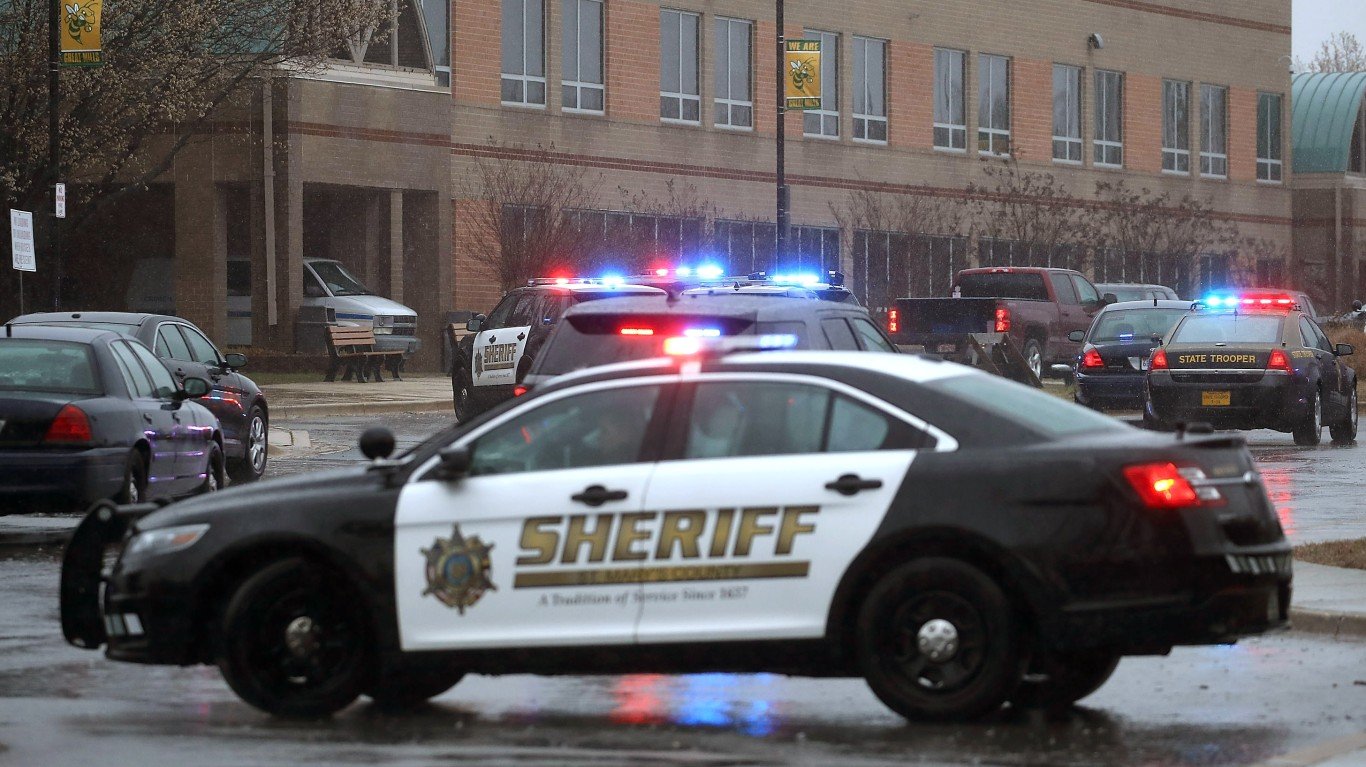
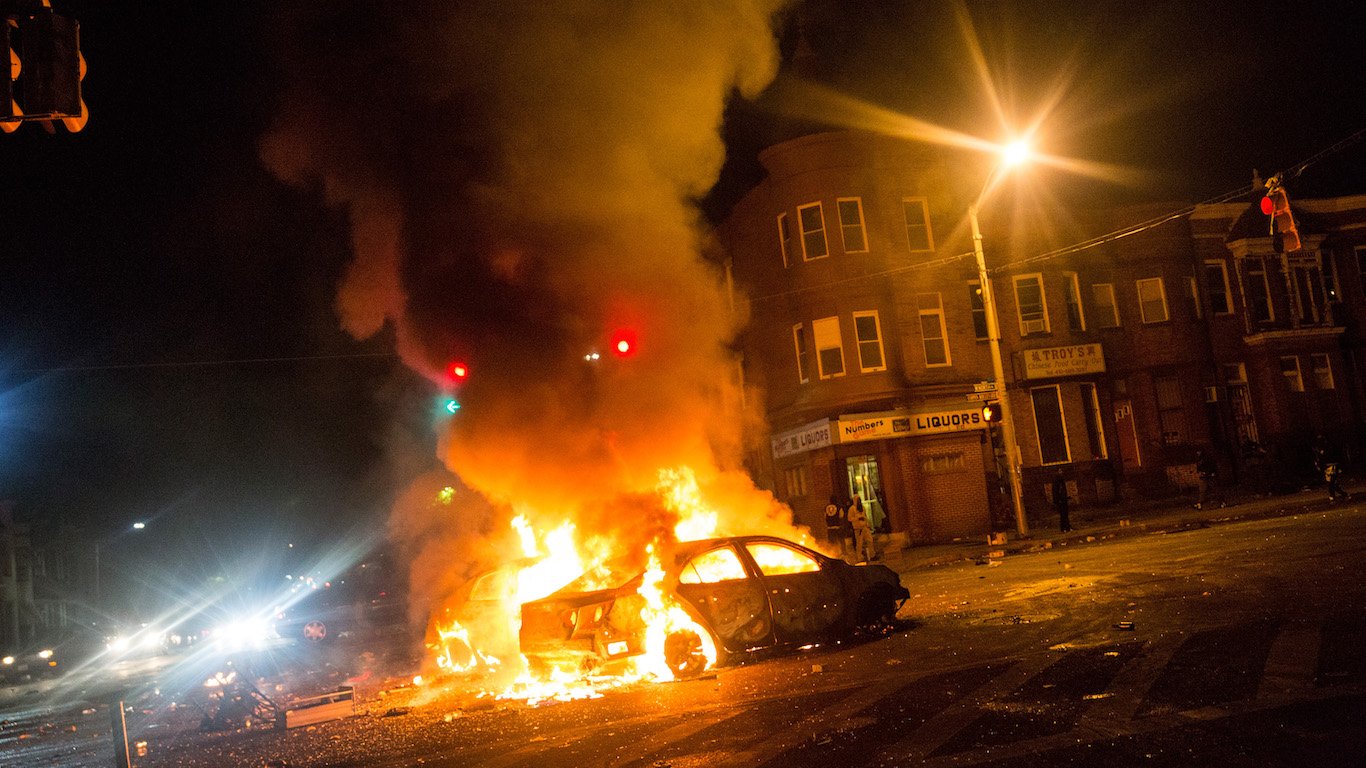
Source: Mark Wilson / Getty Images News via Getty Images
36. Maryland
> Law enforcement officers killed on-duty, 2013-2022: 9.2 per 10,000 police officers (14 total)
> Officers killed feloniously, 2013-2022: 9 (64.3% of fatalities in state)
> Officers killed accidentally, 2013-2022: 5 (35.7% of fatalities in state)
> Deadliest year(s) for law enforcement from 2013-2022: 2015, 2016 (3 fatalities each year year)
> Overall homicide rate, 2020: 9.1 murders per 100,000 people (9th highest of 50 states)
> Total law enforcement officers in state, 2022: 15,189
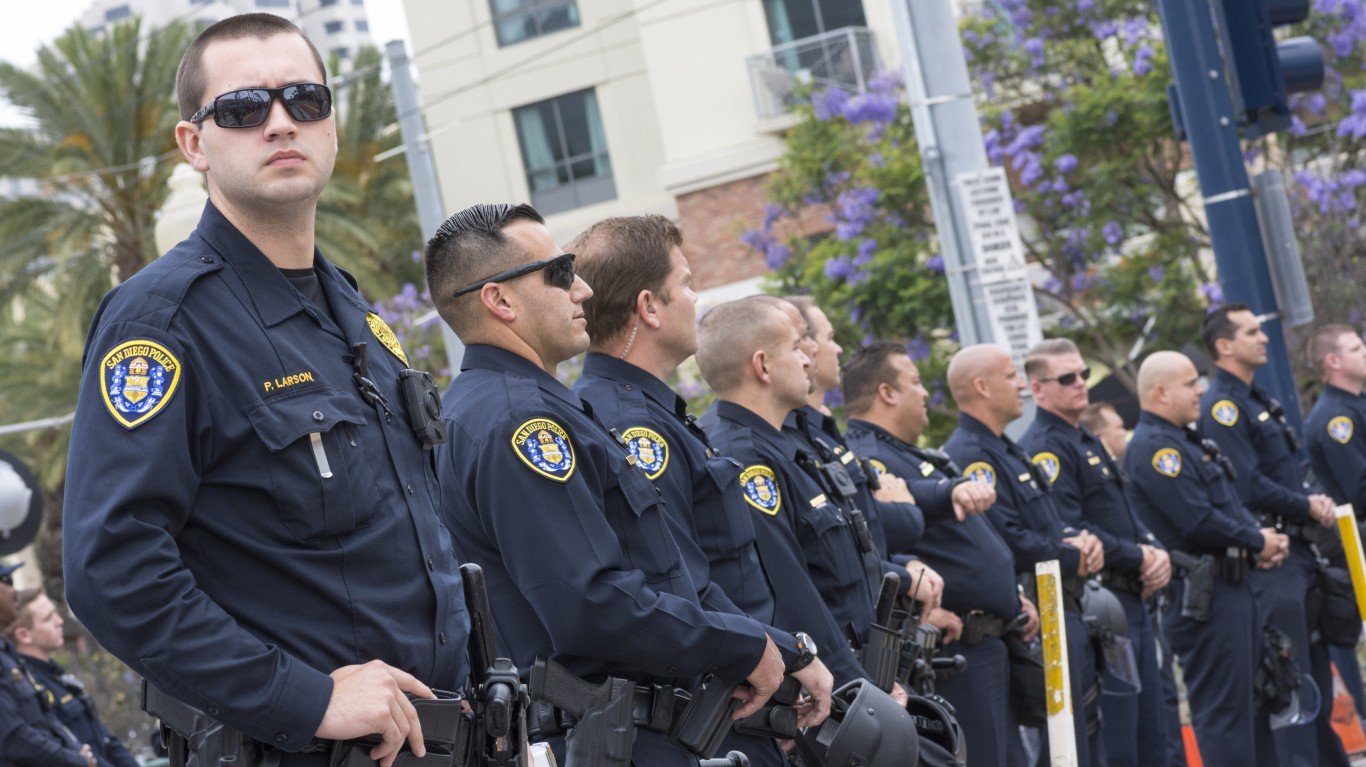
Source: shakzu / iStock Editorial via Getty Images
35. California
> Law enforcement officers killed on-duty, 2013-2022: 10.5 per 10,000 police officers (80 total)
> Officers killed feloniously, 2013-2022: 42 (52.5% of fatalities in state)
> Officers killed accidentally, 2013-2022: 38 (47.5% of fatalities in state)
> Deadliest year(s) for law enforcement from 2013-2022: 2014 (14 fatalities)
> Overall homicide rate, 2020: 5.6 murders per 100,000 people (24th lowest of 50 states)
> Total law enforcement officers in state, 2022: 76,151
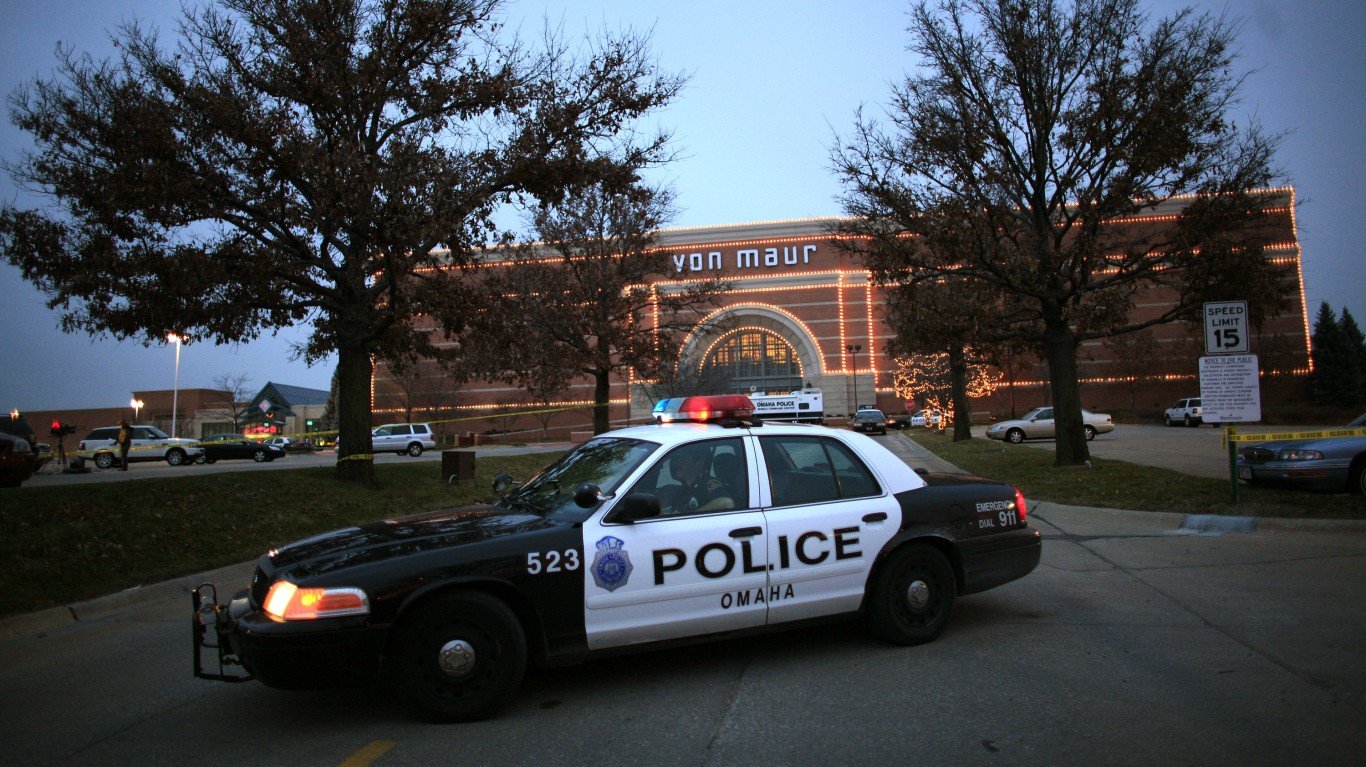
Source: Eric Thayer / Getty Images News via Getty Images
34. Nebraska
> Law enforcement officers killed on-duty, 2013-2022: 10.8 per 10,000 police officers (4 total)
> Officers killed feloniously, 2013-2022: 2 (50.0% of fatalities in state)
> Officers killed accidentally, 2013-2022: 2 (50.0% of fatalities in state)
> Deadliest year(s) for law enforcement from 2013-2022: 2015, 0 (1 fatalities each year year)
> Overall homicide rate, 2020: 3.6 murders per 100,000 people (14th lowest of 50 states)
> Total law enforcement officers in state, 2022: 3,691
Source: Roberto Galan / iStock Editorial via Getty Images
33. Illinois
> Law enforcement officers killed on-duty, 2013-2022: 11.3 per 10,000 police officers (33 total)
> Officers killed feloniously, 2013-2022: 15 (45.5% of fatalities in state)
> Officers killed accidentally, 2013-2022: 18 (54.5% of fatalities in state)
> Deadliest year(s) for law enforcement from 2013-2022: 2021 (8 fatalities)
> Overall homicide rate, 2020: 9.1 murders per 100,000 people (8th highest of 50 states)
> Total law enforcement officers in state, 2022: 29,301

Source: Roberto Galan / iStock Editorial via Getty Images
32. West Virginia
> Law enforcement officers killed on-duty, 2013-2022: 11.8 per 10,000 police officers (4 total)
> Officers killed feloniously, 2013-2022: 3 (75.0% of fatalities in state)
> Officers killed accidentally, 2013-2022: 1 (25.0% of fatalities in state)
> Deadliest year(s) for law enforcement from 2013-2022: 2013, 0 (1 fatalities each year year)
> Overall homicide rate, 2020: 6.6 murders per 100,000 people (23rd highest of 50 states)
> Total law enforcement officers in state, 2022: 3,378

Source: Anna Bryukhanova / iStock Unreleased via Getty Images
31. Florida
> Law enforcement officers killed on-duty, 2013-2022: 12.5 per 10,000 police officers (54 total)
> Officers killed feloniously, 2013-2022: 27 (50.0% of fatalities in state)
> Officers killed accidentally, 2013-2022: 27 (50.0% of fatalities in state)
> Deadliest year(s) for law enforcement from 2013-2022: 2021 (10 fatalities)
> Overall homicide rate, 2020: 5.9 murders per 100,000 people (25th highest of 50 states)
> Total law enforcement officers in state, 2022: 43,224
Source: Imagesbybarbara / iStock Unreleased via Getty Images
30. Virginia
> Law enforcement officers killed on-duty, 2013-2022: 12.8 per 10,000 police officers (24 total)
> Officers killed feloniously, 2013-2022: 13 (54.2% of fatalities in state)
> Officers killed accidentally, 2013-2022: 11 (45.8% of fatalities in state)
> Deadliest year(s) for law enforcement from 2013-2022: 2013, 0 (4 fatalities each year year)
> Overall homicide rate, 2020: 6.1 murders per 100,000 people (24th highest of 50 states)
> Total law enforcement officers in state, 2022: 18,803
Source: Ana Iacob / iStock Editorial via Getty Images
29. Nevada
> Law enforcement officers killed on-duty, 2013-2022: 12.9 per 10,000 police officers (10 total)
> Officers killed feloniously, 2013-2022: 7 (70.0% of fatalities in state)
> Officers killed accidentally, 2013-2022: 3 (30.0% of fatalities in state)
> Deadliest year(s) for law enforcement from 2013-2022: 2014, 0 (2 fatalities each year year)
> Overall homicide rate, 2020: 5.7 murders per 100,000 people (25th lowest of 50 states)
> Total law enforcement officers in state, 2022: 7,753

28. Delaware
> Law enforcement officers killed on-duty, 2013-2022: 13.2 per 10,000 police officers (3 total)
> Officers killed feloniously, 2013-2022: 3 (100.0% of fatalities in state)
> Officers killed accidentally, 2013-2022: 0 (0.0% of fatalities in state)
> Deadliest year(s) for law enforcement from 2013-2022: 2017 (2 fatalities)
> Overall homicide rate, 2020: 7.4 murders per 100,000 people (17th highest of 50 states)
> Total law enforcement officers in state, 2022: 2,280
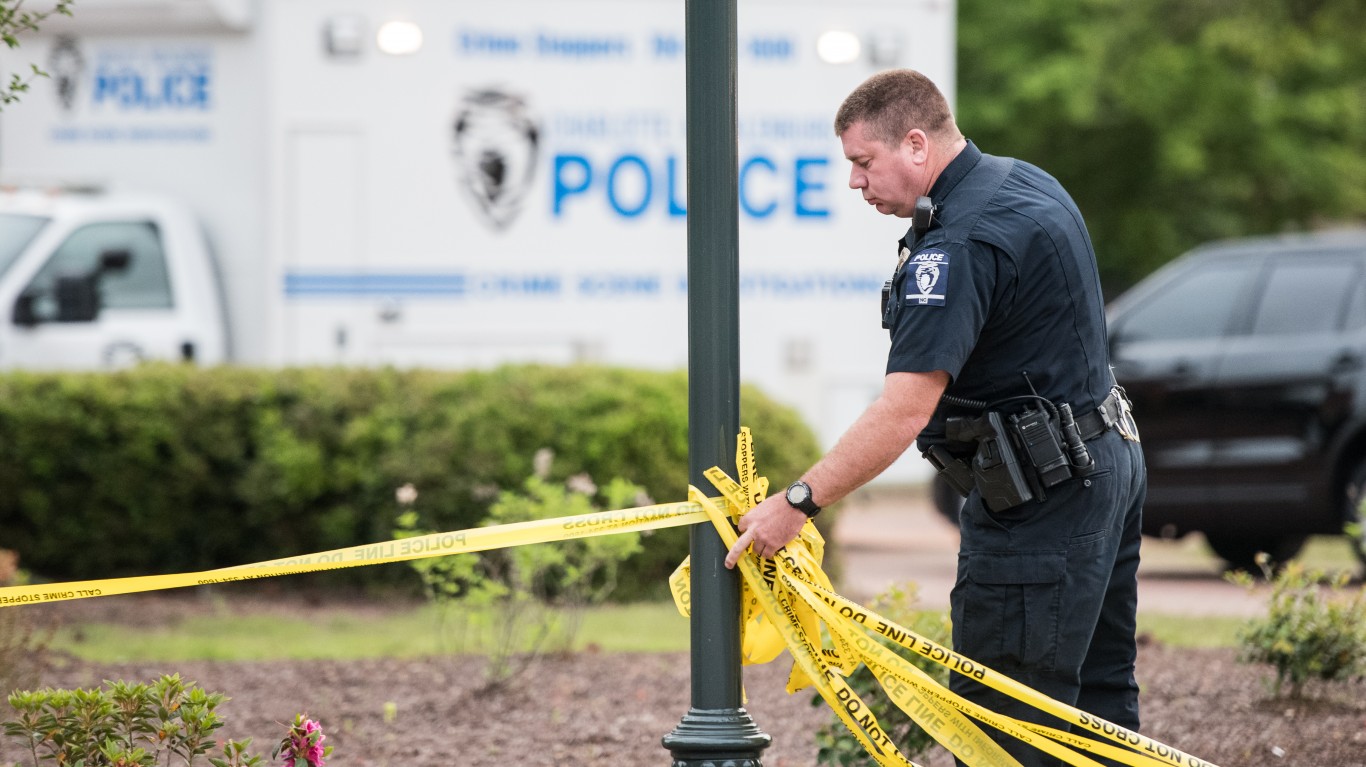
Source: Sean Rayford / Getty Images News via Getty Images
27. North Carolina
> Law enforcement officers killed on-duty, 2013-2022: 13.2 per 10,000 police officers (31 total)
> Officers killed feloniously, 2013-2022: 13 (41.9% of fatalities in state)
> Officers killed accidentally, 2013-2022: 18 (58.1% of fatalities in state)
> Deadliest year(s) for law enforcement from 2013-2022: 2018 (7 fatalities)
> Overall homicide rate, 2020: 8.0 murders per 100,000 people (11th highest of 50 states)
> Total law enforcement officers in state, 2022: 23,425
Source: csfotoimages / iStock Editorial via Getty Images
26. Montana
> Law enforcement officers killed on-duty, 2013-2022: 13.5 per 10,000 police officers (3 total)
> Officers killed feloniously, 2013-2022: 2 (66.7% of fatalities in state)
> Officers killed accidentally, 2013-2022: 1 (33.3% of fatalities in state)
> Deadliest year(s) for law enforcement from 2013-2022: 2014, 0 (1 fatalities each year year)
> Overall homicide rate, 2020: 5.0 murders per 100,000 people (21st lowest of 50 states)
> Total law enforcement officers in state, 2022: 2,230
Source: Onfokus / iStock via Getty Images
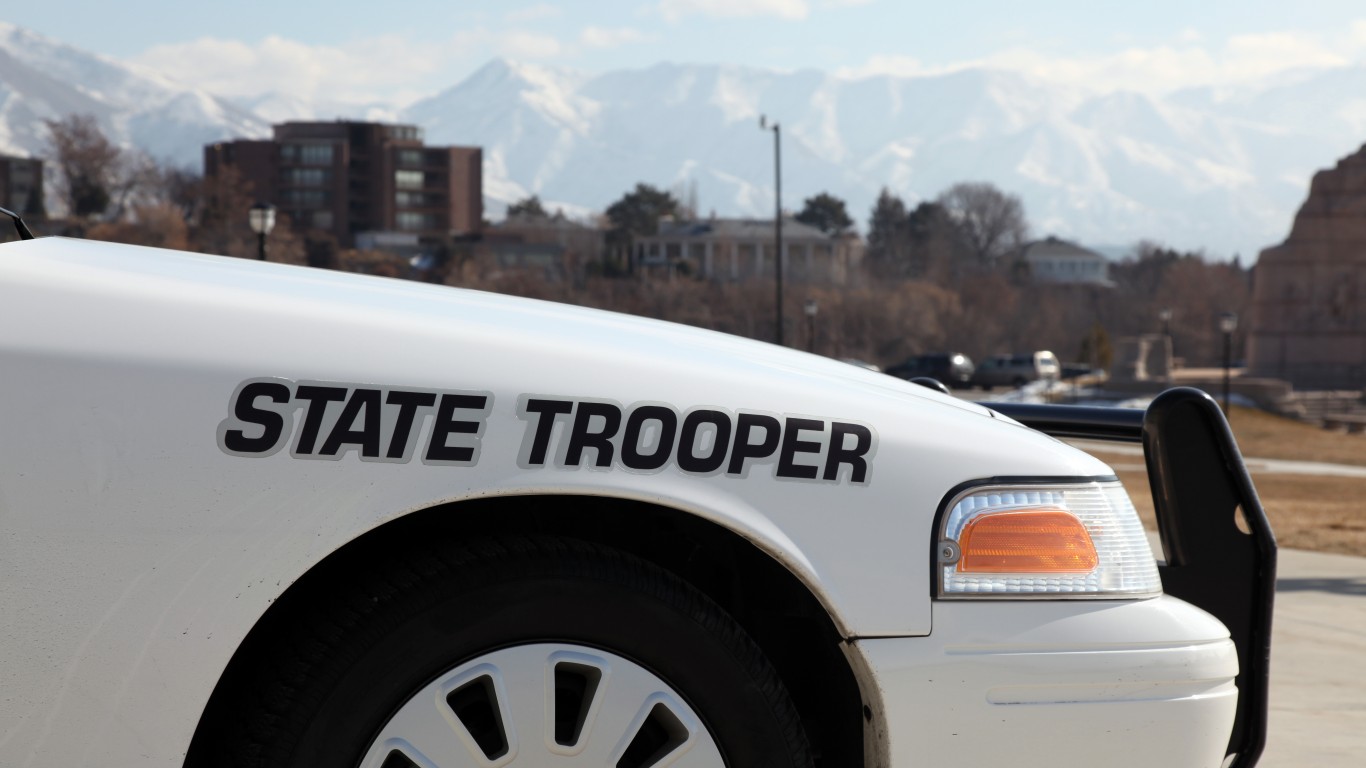
25. Utah
> Law enforcement officers killed on-duty, 2013-2022: 13.6 per 10,000 police officers (8 total)
> Officers killed feloniously, 2013-2022: 7 (87.5% of fatalities in state)
> Officers killed accidentally, 2013-2022: 1 (12.5% of fatalities in state)
> Deadliest year(s) for law enforcement from 2013-2022: 2016 (3 fatalities)
> Overall homicide rate, 2020: 3.1 murders per 100,000 people (10th lowest of 50 states)
> Total law enforcement officers in state, 2022: 5,869

24. Ohio
> Law enforcement officers killed on-duty, 2013-2022: 14.4 per 10,000 police officers (27 total)
> Officers killed feloniously, 2013-2022: 17 (63.0% of fatalities in state)
> Officers killed accidentally, 2013-2022: 10 (37.0% of fatalities in state)
> Deadliest year(s) for law enforcement from 2013-2022: 2016 (5 fatalities)
> Overall homicide rate, 2020: 7.0 murders per 100,000 people (19th highest of 50 states)
> Total law enforcement officers in state, 2022: 18,713

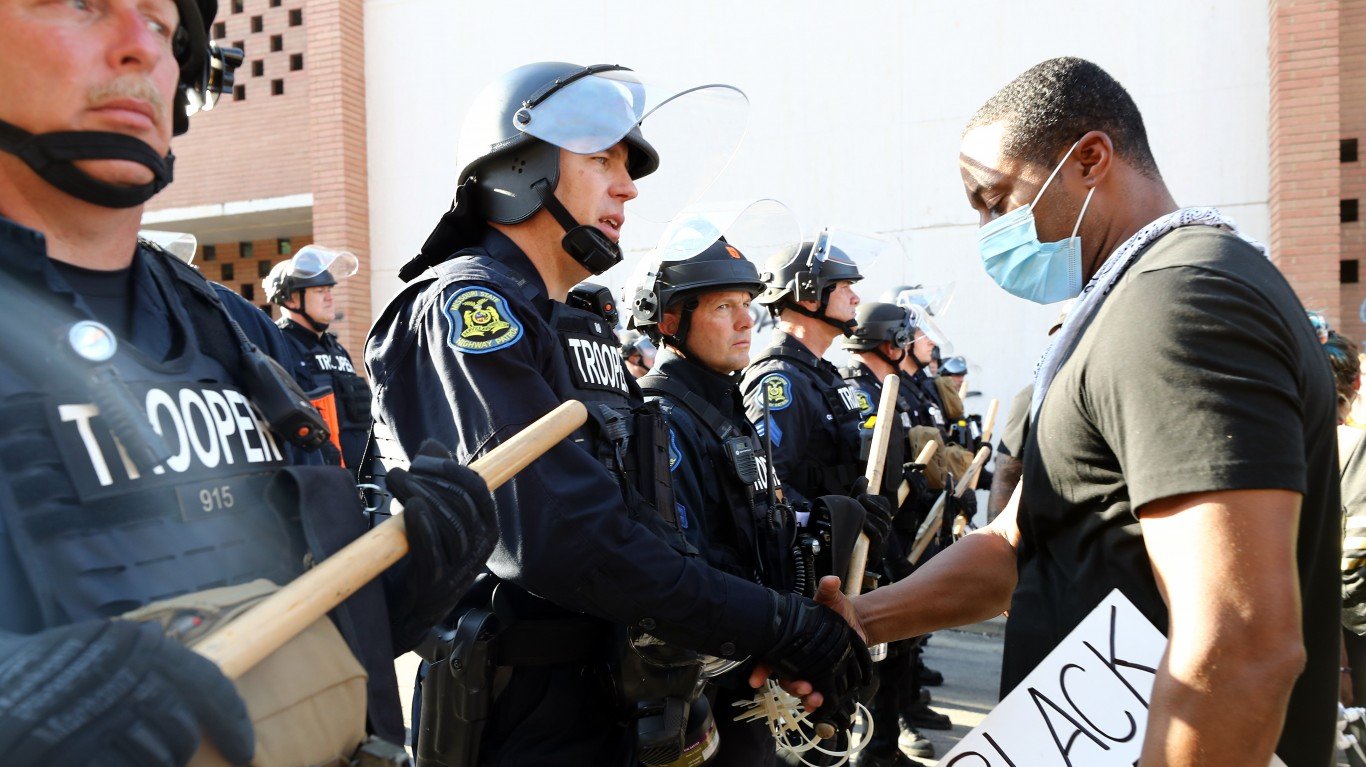
Source: RiverNorthPhotography / iStock Unreleased via Getty Images
23. Michigan
> Law enforcement officers killed on-duty, 2013-2022: 14.5 per 10,000 police officers (25 total)
> Officers killed feloniously, 2013-2022: 12 (48.0% of fatalities in state)
> Officers killed accidentally, 2013-2022: 13 (52.0% of fatalities in state)
> Deadliest year(s) for law enforcement from 2013-2022: 2016, 0 (4 fatalities each year year)
> Overall homicide rate, 2020: 7.6 murders per 100,000 people (14th highest of 50 states)
> Total law enforcement officers in state, 2022: 17,238

22. Hawaii
> Law enforcement officers killed on-duty, 2013-2022: 14.8 per 10,000 police officers (4 total)
> Officers killed feloniously, 2013-2022: 3 (75.0% of fatalities in state)
> Officers killed accidentally, 2013-2022: 1 (25.0% of fatalities in state)
> Deadliest year(s) for law enforcement from 2013-2022: 2020 (3 fatalities)
> Overall homicide rate, 2020: 2.9 murders per 100,000 people (6th lowest of 50 states)
> Total law enforcement officers in state, 2022: 2,699
Source: drial7m1 / iStock Unreleased via Getty Images
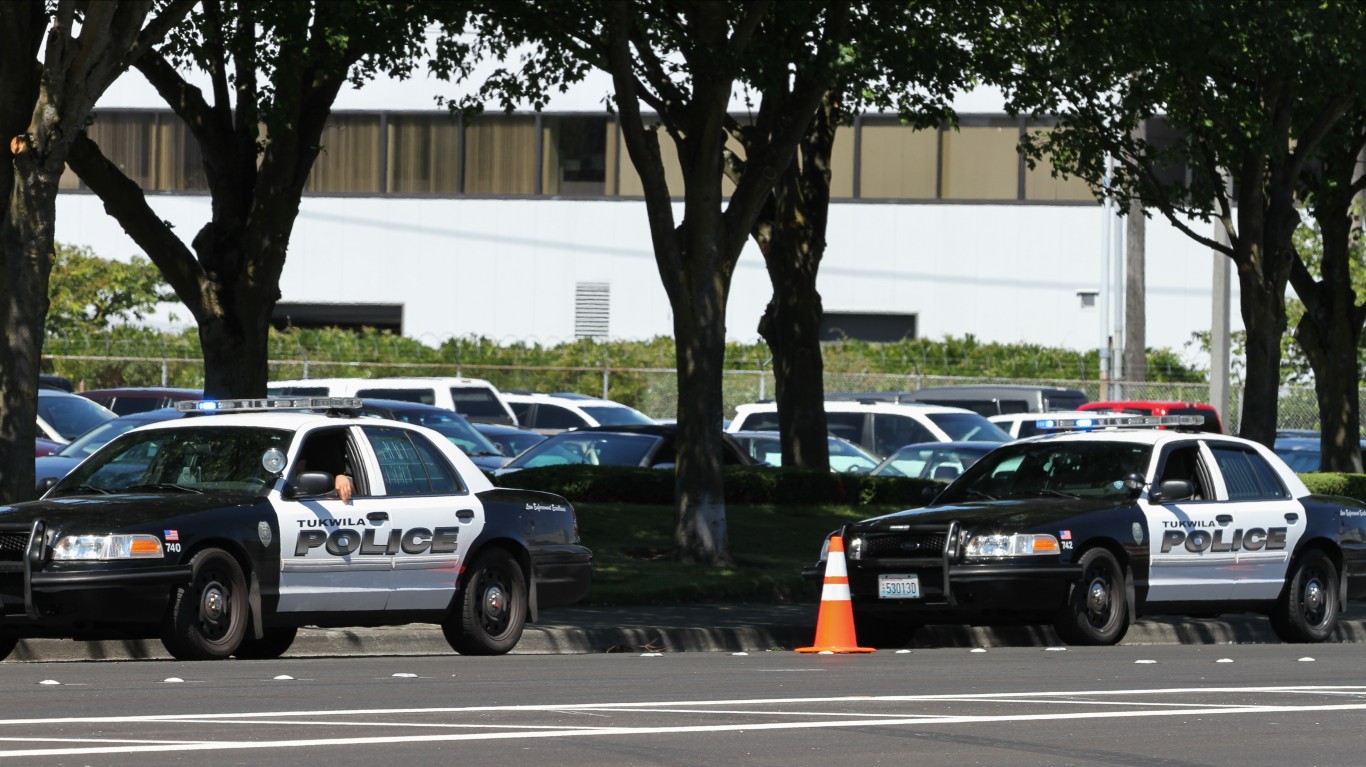
21. Washington
> Law enforcement officers killed on-duty, 2013-2022: 16.4 per 10,000 police officers (17 total)
> Officers killed feloniously, 2013-2022: 8 (47.1% of fatalities in state)
> Officers killed accidentally, 2013-2022: 9 (52.9% of fatalities in state)
> Deadliest year(s) for law enforcement from 2013-2022: 2019, 2022 (4 fatalities each year year)
> Overall homicide rate, 2020: 3.9 murders per 100,000 people (16th lowest of 50 states)
> Total law enforcement officers in state, 2022: 10,393

20. Tennessee
> Law enforcement officers killed on-duty, 2013-2022: 17.1 per 10,000 police officers (30 total)
> Officers killed feloniously, 2013-2022: 7 (23.3% of fatalities in state)
> Officers killed accidentally, 2013-2022: 23 (76.7% of fatalities in state)
> Deadliest year(s) for law enforcement from 2013-2022: 2019 (6 fatalities)
> Overall homicide rate, 2020: 9.6 murders per 100,000 people (6th highest of 50 states)
> Total law enforcement officers in state, 2022: 17,582
Source: Spencer Platt / Getty Images News via Getty Images
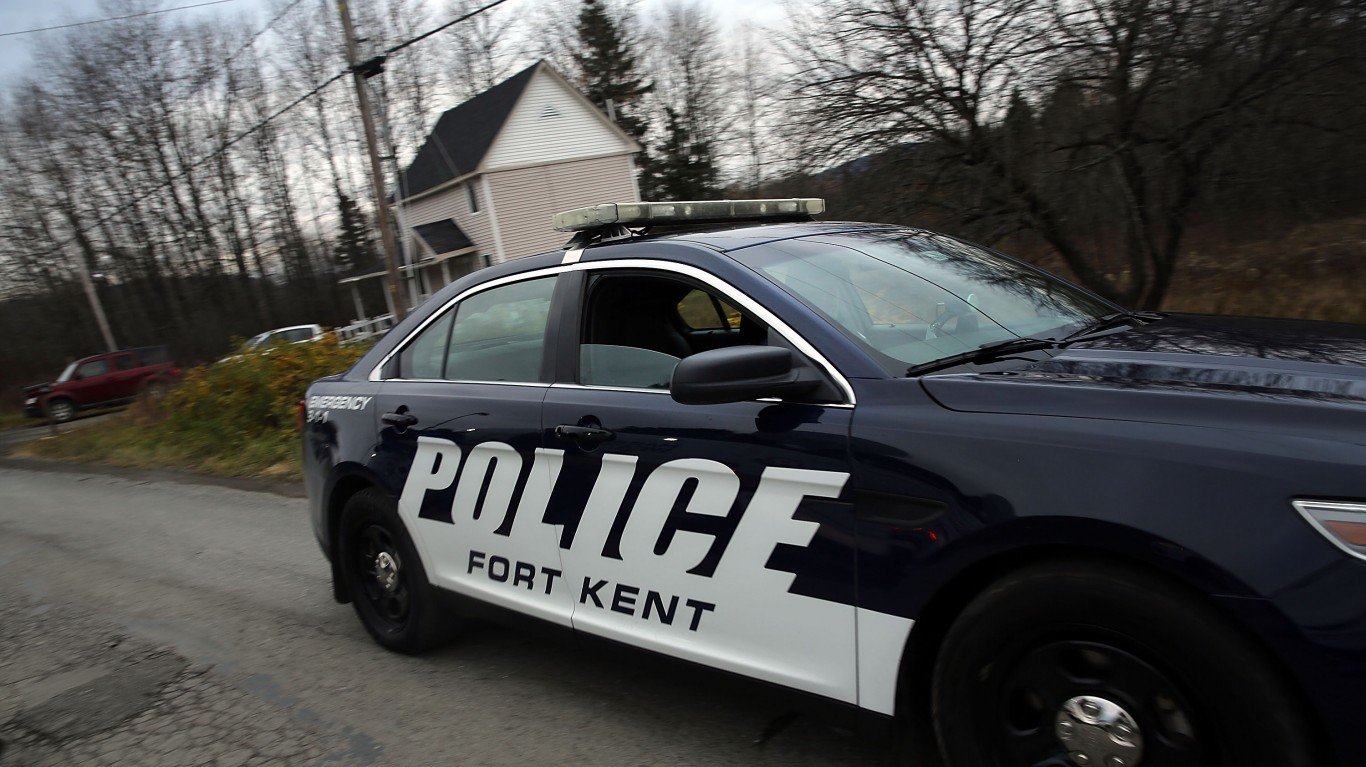
19. Maine
> Law enforcement officers killed on-duty, 2013-2022: 17.2 per 10,000 police officers (4 total)
> Officers killed feloniously, 2013-2022: 1 (25.0% of fatalities in state)
> Officers killed accidentally, 2013-2022: 3 (75.0% of fatalities in state)
> Deadliest year(s) for law enforcement from 2013-2022: 2017, 0 (1 fatalities each year year)
> Overall homicide rate, 2020: 1.6 murders per 100,000 people (2nd lowest of 50 states)
> Total law enforcement officers in state, 2022: 2,322
Source: frankysze / iStock via Getty Images
18. Kansas
> Law enforcement officers killed on-duty, 2013-2022: 17.3 per 10,000 police officers (11 total)
> Officers killed feloniously, 2013-2022: 7 (63.6% of fatalities in state)
> Officers killed accidentally, 2013-2022: 4 (36.4% of fatalities in state)
> Deadliest year(s) for law enforcement from 2013-2022: 2016, 2018 (3 fatalities each year year)
> Overall homicide rate, 2020: 3.4 murders per 100,000 people (12th lowest of 50 states)
> Total law enforcement officers in state, 2022: 6,361
Source: Ericbvd / iStock Editorial via Getty Images
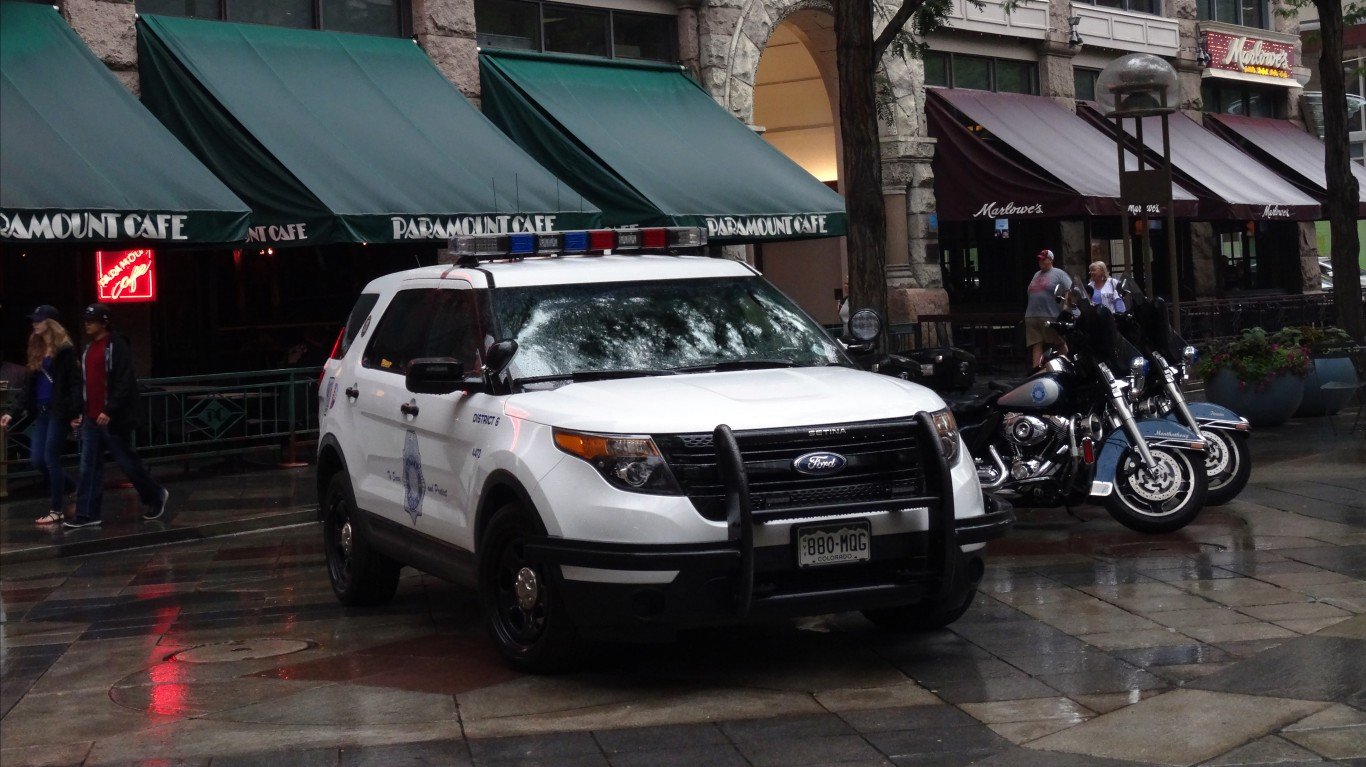
17. Colorado
> Law enforcement officers killed on-duty, 2013-2022: 17.5 per 10,000 police officers (20 total)
> Officers killed feloniously, 2013-2022: 11 (55.0% of fatalities in state)
> Officers killed accidentally, 2013-2022: 9 (45.0% of fatalities in state)
> Deadliest year(s) for law enforcement from 2013-2022: 2015 (4 fatalities)
> Overall homicide rate, 2020: 5.1 murders per 100,000 people (22nd lowest of 50 states)
> Total law enforcement officers in state, 2022: 11,439
Source: Jamie Squire / Getty Images News via Getty Images
16. Missouri
> Law enforcement officers killed on-duty, 2013-2022: 18.6 per 10,000 police officers (22 total)
> Officers killed feloniously, 2013-2022: 13 (59.1% of fatalities in state)
> Officers killed accidentally, 2013-2022: 9 (40.9% of fatalities in state)
> Deadliest year(s) for law enforcement from 2013-2022: 2020, 2022 (4 fatalities each year year)
> Overall homicide rate, 2020: 11.8 murders per 100,000 people (2nd highest of 50 states)
> Total law enforcement officers in state, 2022: 11,854
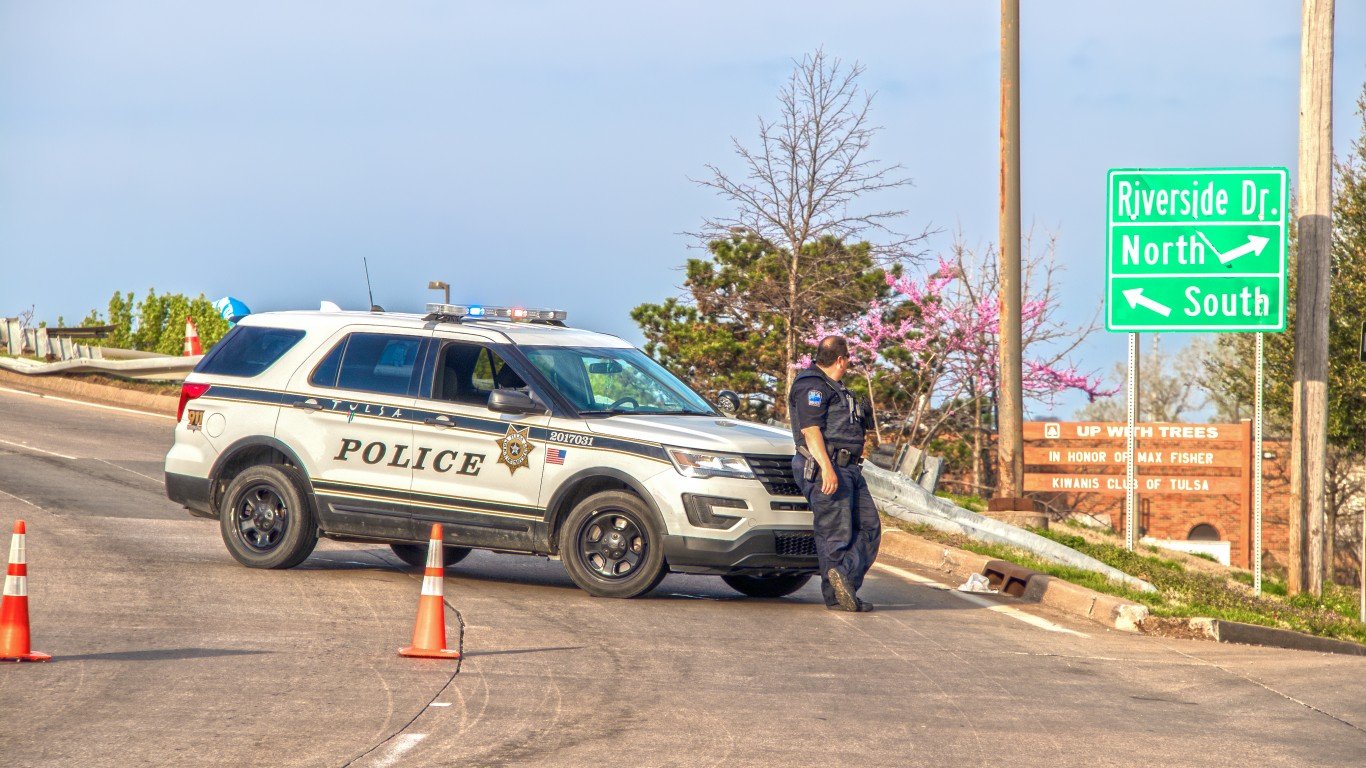
Source: Susan Vineyard / iStock Editorial via Getty Images
15. Oklahoma
> Law enforcement officers killed on-duty, 2013-2022: 19.5 per 10,000 police officers (18 total)
> Officers killed feloniously, 2013-2022: 6 (33.3% of fatalities in state)
> Officers killed accidentally, 2013-2022: 12 (66.7% of fatalities in state)
> Deadliest year(s) for law enforcement from 2013-2022: 2017 (4 fatalities)
> Overall homicide rate, 2020: 7.4 murders per 100,000 people (16th highest of 50 states)
> Total law enforcement officers in state, 2022: 9,246
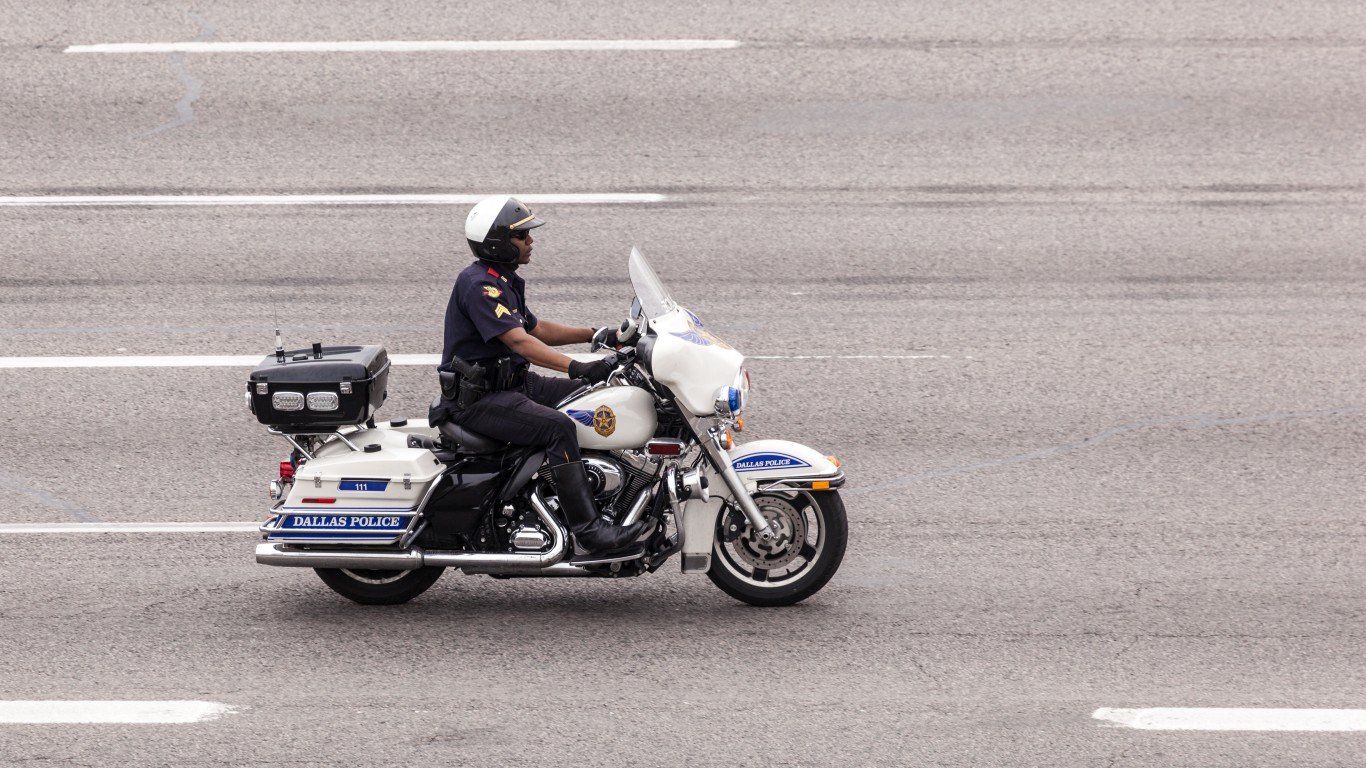
Source: typhoonski / iStock Editorial via Getty Images
14. Texas
> Law enforcement officers killed on-duty, 2013-2022: 19.6 per 10,000 police officers (117 total)
> Officers killed feloniously, 2013-2022: 58 (49.6% of fatalities in state)
> Officers killed accidentally, 2013-2022: 59 (50.4% of fatalities in state)
> Deadliest year(s) for law enforcement from 2013-2022: 2016 (17 fatalities)
> Overall homicide rate, 2020: 6.6 murders per 100,000 people (22nd highest of 50 states)
> Total law enforcement officers in state, 2022: 59,831

13. Iowa
> Law enforcement officers killed on-duty, 2013-2022: 20.4 per 10,000 police officers (11 total)
> Officers killed feloniously, 2013-2022: 5 (45.5% of fatalities in state)
> Officers killed accidentally, 2013-2022: 6 (54.5% of fatalities in state)
> Deadliest year(s) for law enforcement from 2013-2022: 2016 (5 fatalities)
> Overall homicide rate, 2020: 3.5 murders per 100,000 people (13th lowest of 50 states)
> Total law enforcement officers in state, 2022: 5,383

Source: Roberto Galan / iStock Editorial via Getty Images
12. Indiana
> Law enforcement officers killed on-duty, 2013-2022: 20.9 per 10,000 police officers (18 total)
> Officers killed feloniously, 2013-2022: 12 (66.7% of fatalities in state)
> Officers killed accidentally, 2013-2022: 6 (33.3% of fatalities in state)
> Deadliest year(s) for law enforcement from 2013-2022: 2014 (4 fatalities)
> Overall homicide rate, 2020: 7.5 murders per 100,000 people (15th highest of 50 states)
> Total law enforcement officers in state, 2022: 8,595

Source: SeanPavonePhoto / iStock Editorial via Getty Images
11. Georgia
> Law enforcement officers killed on-duty, 2013-2022: 21.3 per 10,000 police officers (53 total)
> Officers killed feloniously, 2013-2022: 28 (52.8% of fatalities in state)
> Officers killed accidentally, 2013-2022: 25 (47.2% of fatalities in state)
> Deadliest year(s) for law enforcement from 2013-2022: 2016 (9 fatalities)
> Overall homicide rate, 2020: 8.8 murders per 100,000 people (10th highest of 50 states)
> Total law enforcement officers in state, 2022: 24,904
Source: csfotoimages / iStock Editorial via Getty Images
10. North Dakota
> Law enforcement officers killed on-duty, 2013-2022: 21.7 per 10,000 police officers (4 total)
> Officers killed feloniously, 2013-2022: 3 (75.0% of fatalities in state)
> Officers killed accidentally, 2013-2022: 1 (25.0% of fatalities in state)
> Deadliest year(s) for law enforcement from 2013-2022: 2016, 0 (1 fatalities each year year)
> Overall homicide rate, 2020: 4.2 murders per 100,000 people (19th lowest of 50 states)
> Total law enforcement officers in state, 2022: 1,844
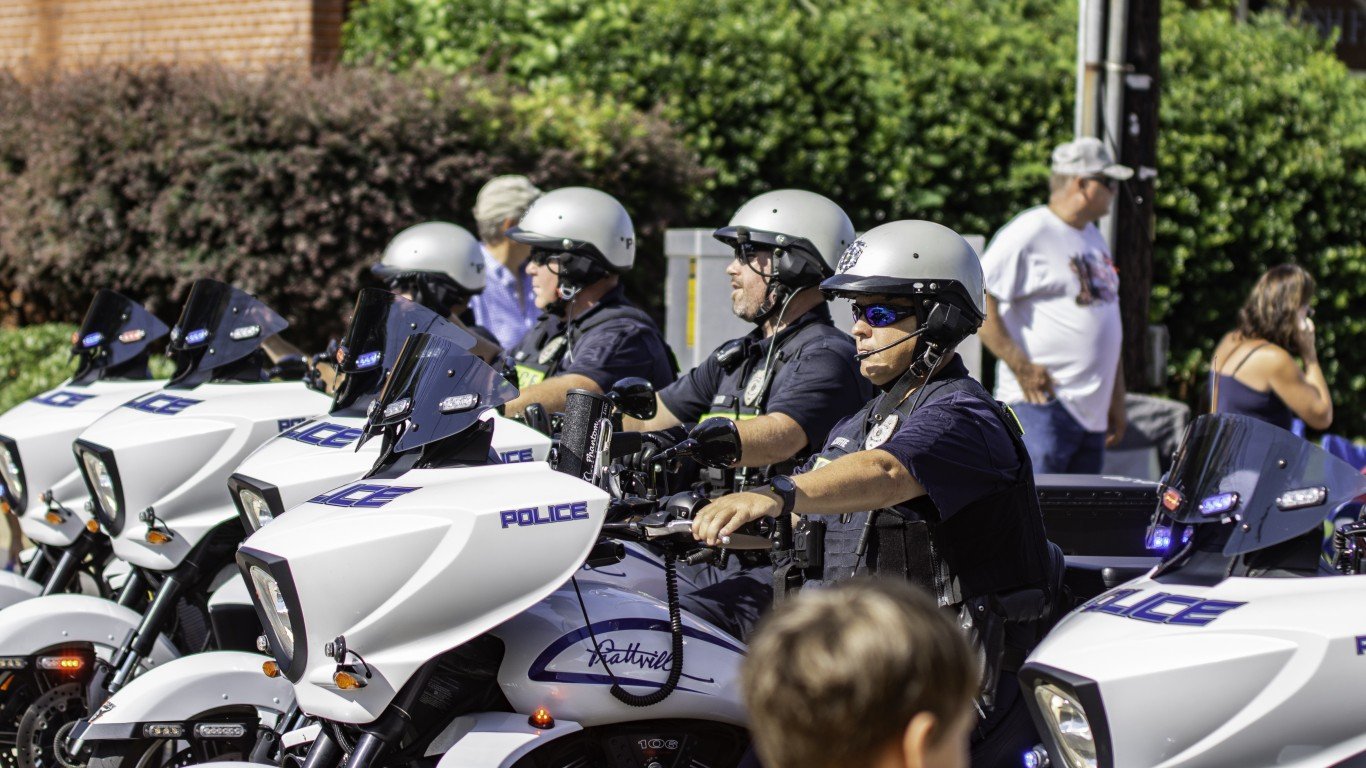
Source: Jacqueline Nix / iStock Editorial via Getty Images
9. Alabama
> Law enforcement officers killed on-duty, 2013-2022: 22.2 per 10,000 police officers (26 total)
> Officers killed feloniously, 2013-2022: 13 (50.0% of fatalities in state)
> Officers killed accidentally, 2013-2022: 13 (50.0% of fatalities in state)
> Deadliest year(s) for law enforcement from 2013-2022: 2019 (7 fatalities)
> Overall homicide rate, 2020: 9.6 murders per 100,000 people (7th highest of 50 states)
> Total law enforcement officers in state, 2022: 11,686
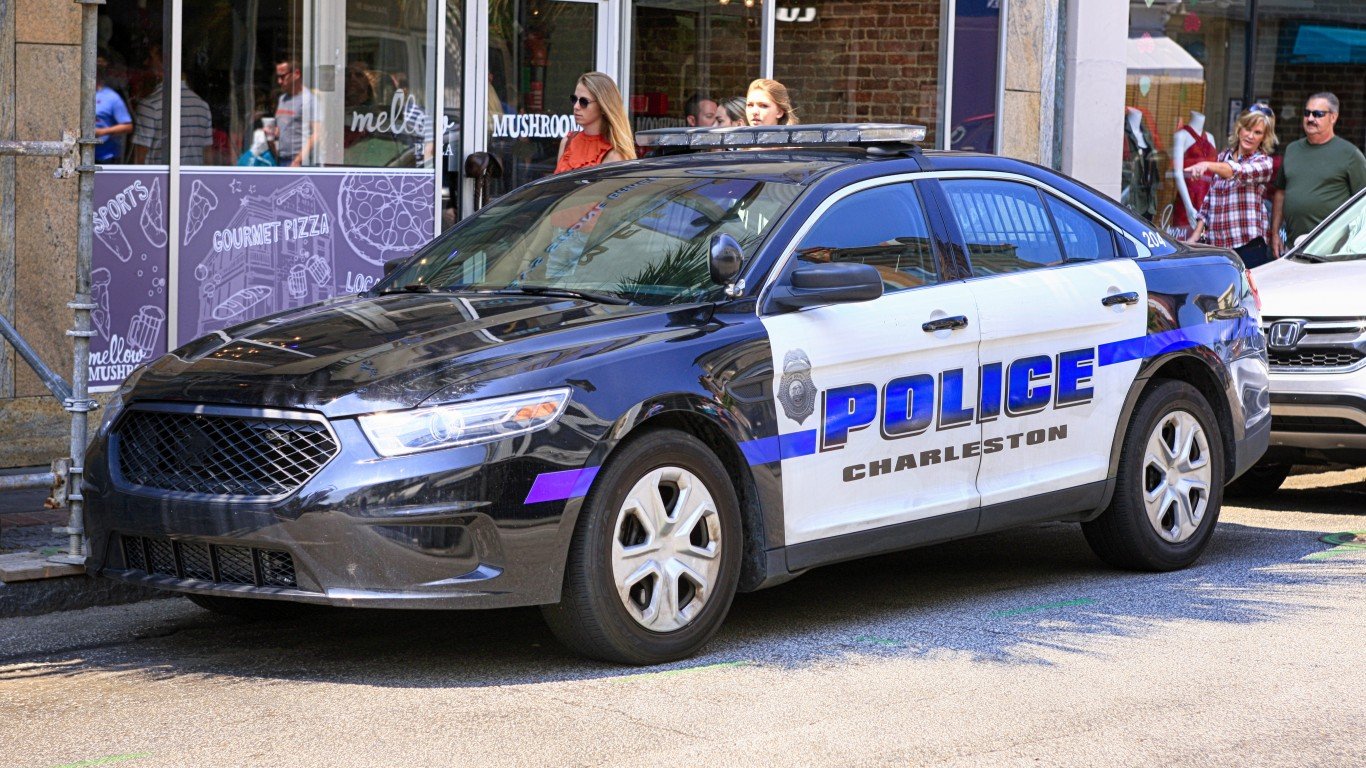
Source: csfotoimages / iStock Editorial via Getty Images
8. South Carolina
> Law enforcement officers killed on-duty, 2013-2022: 22.7 per 10,000 police officers (28 total)
> Officers killed feloniously, 2013-2022: 11 (39.3% of fatalities in state)
> Officers killed accidentally, 2013-2022: 17 (60.7% of fatalities in state)
> Deadliest year(s) for law enforcement from 2013-2022: 2020 (6 fatalities)
> Overall homicide rate, 2020: 10.5 murders per 100,000 people (5th highest of 50 states)
> Total law enforcement officers in state, 2022: 12,351
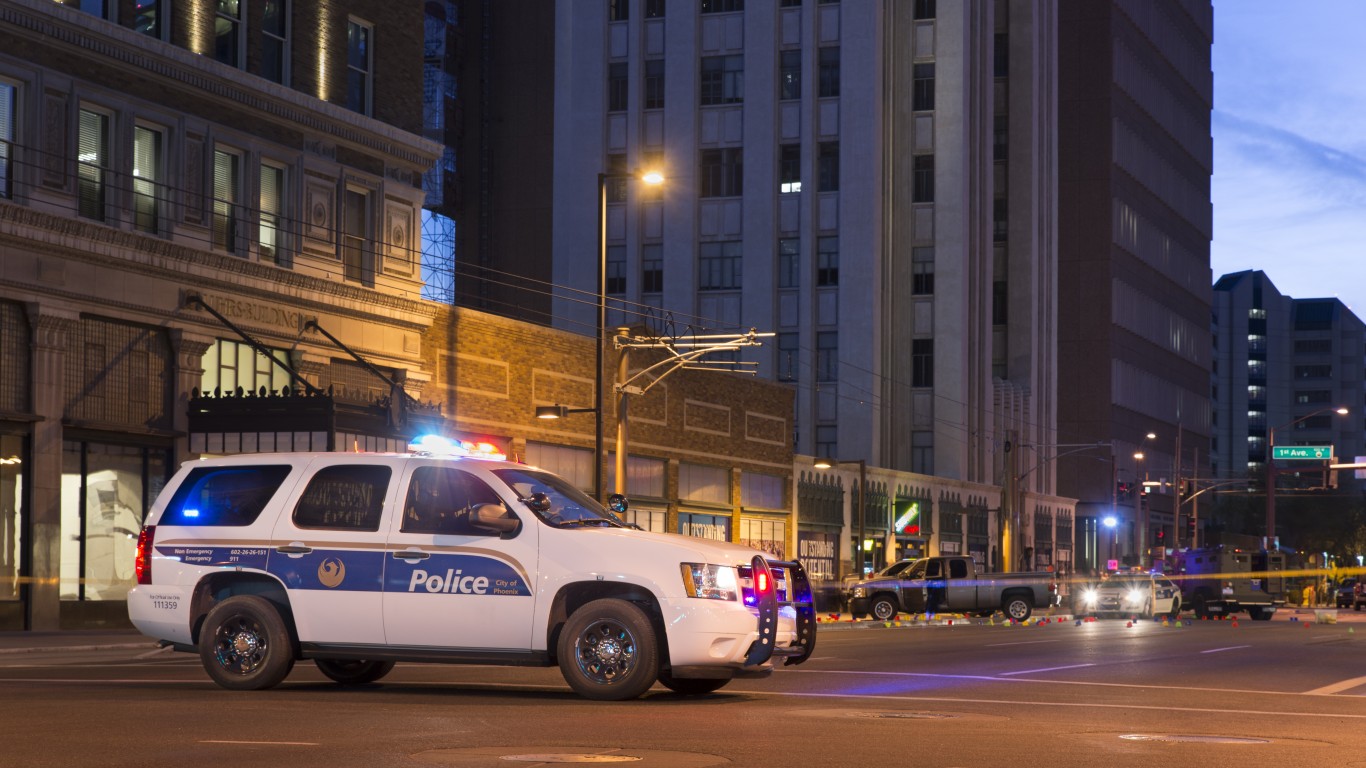
Source: pabst_ell / iStock Unreleased via Getty Images
7. Arizona
> Law enforcement officers killed on-duty, 2013-2022: 23.7 per 10,000 police officers (30 total)
> Officers killed feloniously, 2013-2022: 17 (56.7% of fatalities in state)
> Officers killed accidentally, 2013-2022: 13 (43.3% of fatalities in state)
> Deadliest year(s) for law enforcement from 2013-2022: 2021 (6 fatalities)
> Overall homicide rate, 2020: 6.9 murders per 100,000 people (20th highest of 50 states)
> Total law enforcement officers in state, 2022: 12,656
Source: Roberto Galan / iStock Editorial via Getty Images
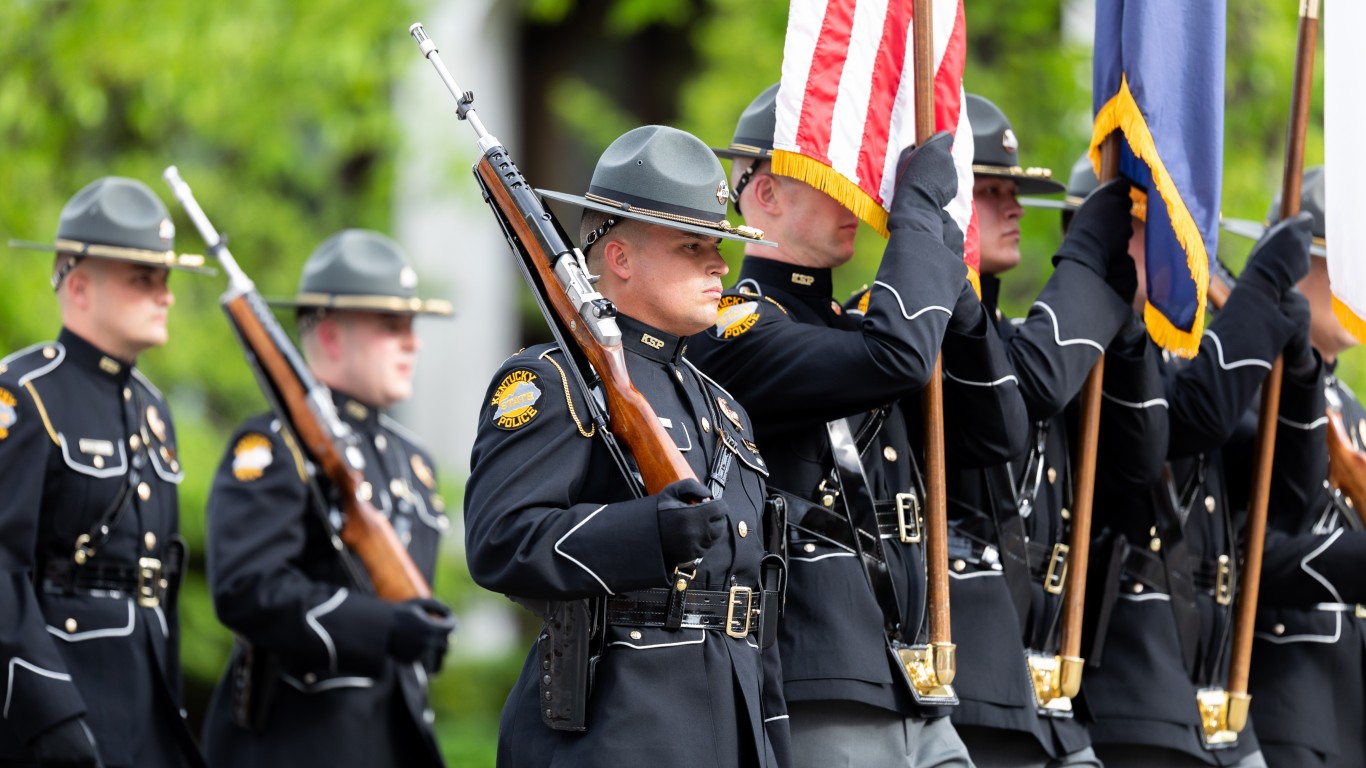
6. Kentucky
> Law enforcement officers killed on-duty, 2013-2022: 25.4 per 10,000 police officers (17 total)
> Officers killed feloniously, 2013-2022: 10 (58.8% of fatalities in state)
> Officers killed accidentally, 2013-2022: 7 (41.2% of fatalities in state)
> Deadliest year(s) for law enforcement from 2013-2022: 2022 (5 fatalities)
> Overall homicide rate, 2020: 7.2 murders per 100,000 people (18th highest of 50 states)
> Total law enforcement officers in state, 2022: 6,704
Source: Benjamin Krain / Getty Images News via Getty Images
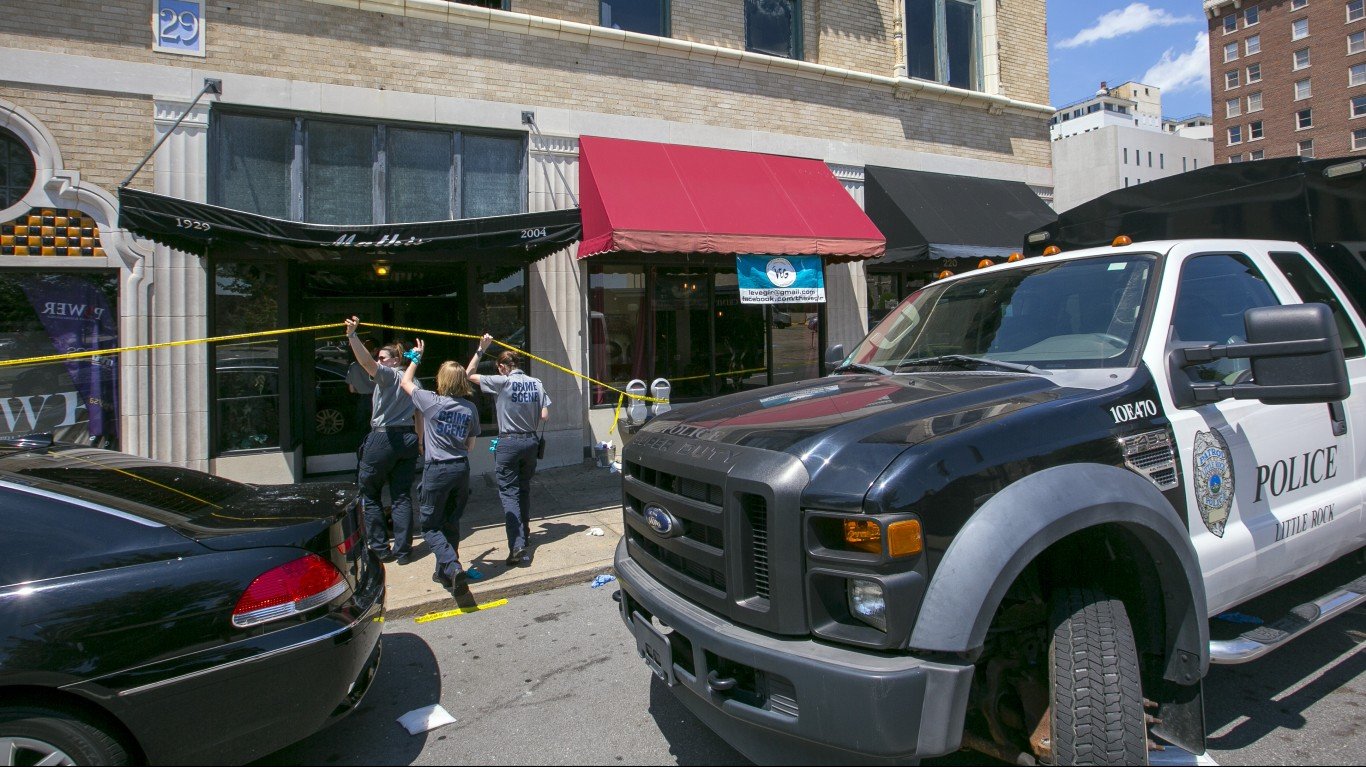
5. Arkansas
> Law enforcement officers killed on-duty, 2013-2022: 29.8 per 10,000 police officers (21 total)
> Officers killed feloniously, 2013-2022: 12 (57.1% of fatalities in state)
> Officers killed accidentally, 2013-2022: 9 (42.9% of fatalities in state)
> Deadliest year(s) for law enforcement from 2013-2022: 2013, 2020 (4 fatalities each year year)
> Overall homicide rate, 2020: 10.6 murders per 100,000 people (4th highest of 50 states)
> Total law enforcement officers in state, 2022: 7,044
Source: Melissa Kopka / iStock Editorial via Getty Images
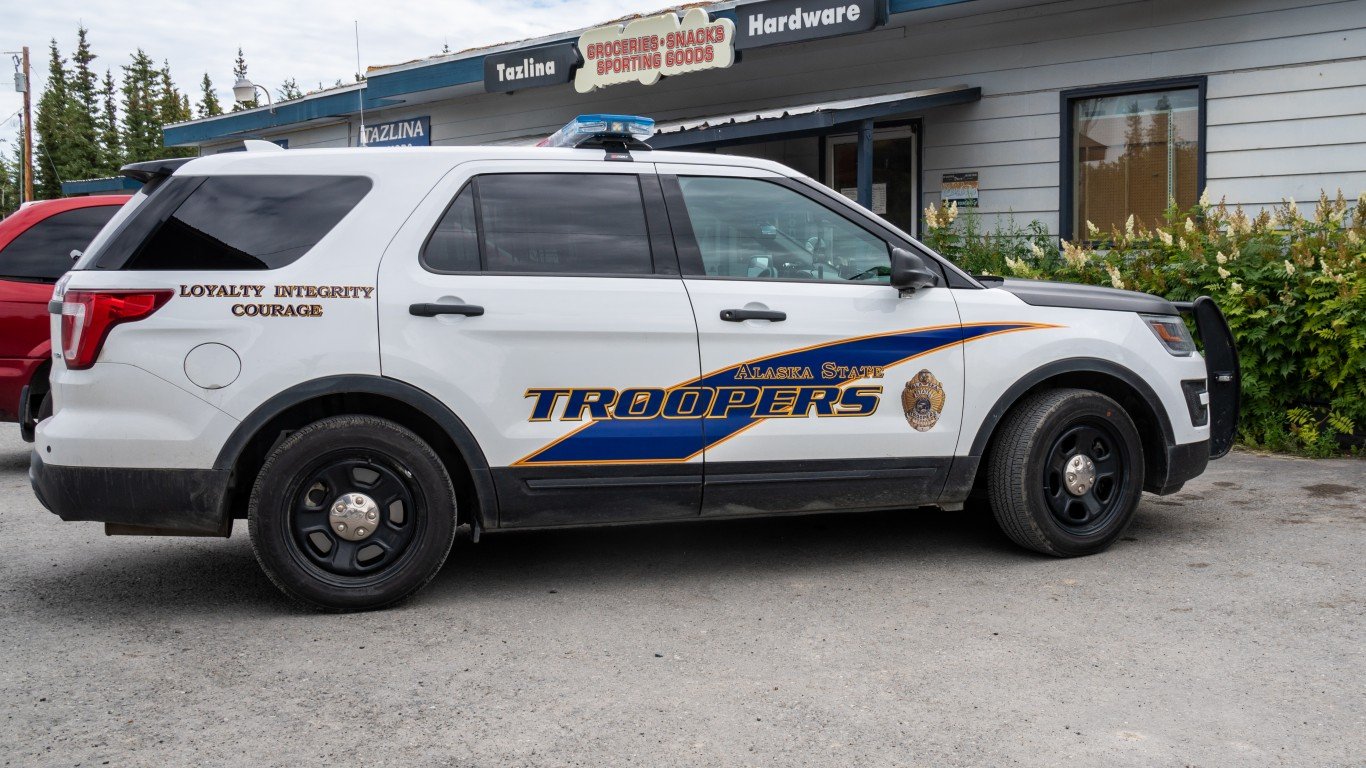
4. Alaska
> Law enforcement officers killed on-duty, 2013-2022: 31.5 per 10,000 police officers (4 total)
> Officers killed feloniously, 2013-2022: 3 (75.0% of fatalities in state)
> Officers killed accidentally, 2013-2022: 1 (25.0% of fatalities in state)
> Deadliest year(s) for law enforcement from 2013-2022: 2014 (2 fatalities)
> Overall homicide rate, 2020: 6.7 murders per 100,000 people (21st highest of 50 states)
> Total law enforcement officers in state, 2022: 1,271
Source: csfotoimages / iStock Editorial via Getty Images
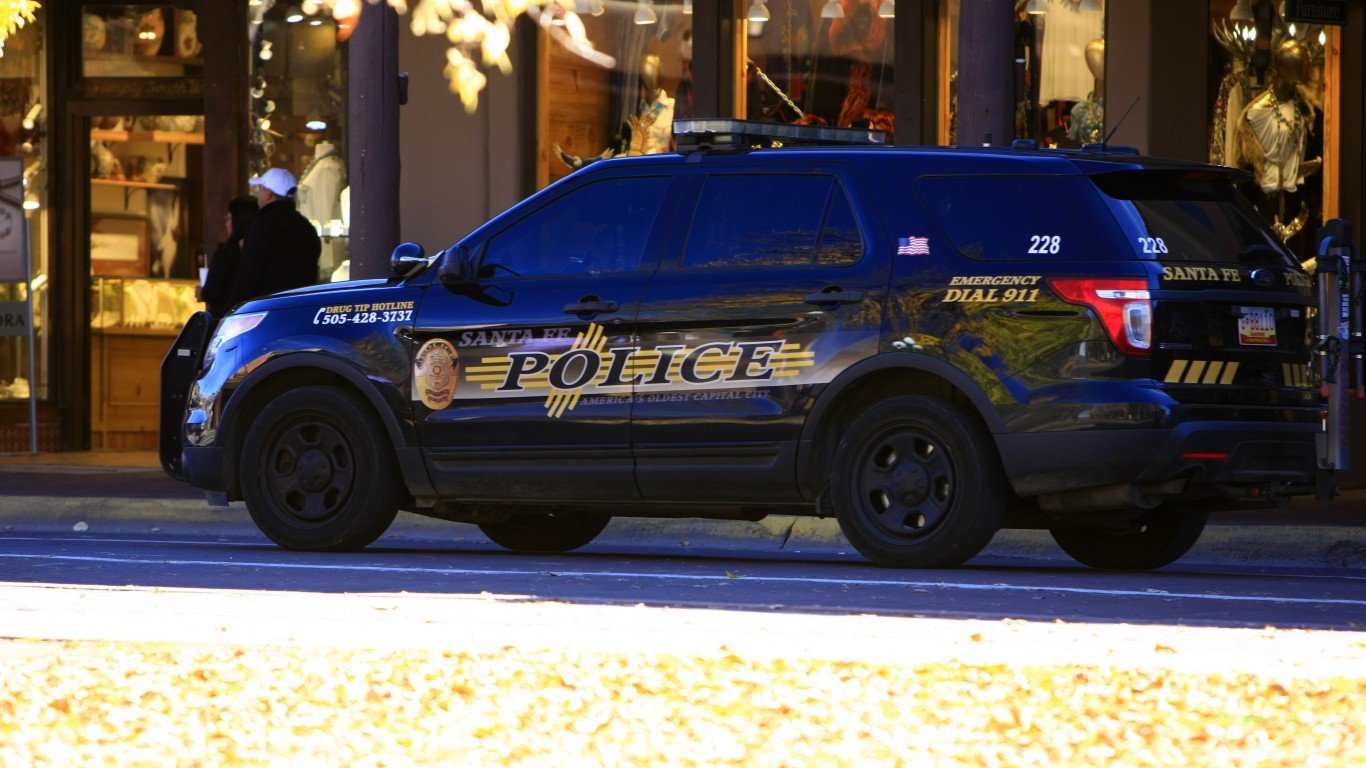
3. New Mexico
> Law enforcement officers killed on-duty, 2013-2022: 32.1 per 10,000 police officers (15 total)
> Officers killed feloniously, 2013-2022: 6 (40.0% of fatalities in state)
> Officers killed accidentally, 2013-2022: 9 (60.0% of fatalities in state)
> Deadliest year(s) for law enforcement from 2013-2022: 2022 (4 fatalities)
> Overall homicide rate, 2020: 7.8 murders per 100,000 people (13th highest of 50 states)
> Total law enforcement officers in state, 2022: 4,672
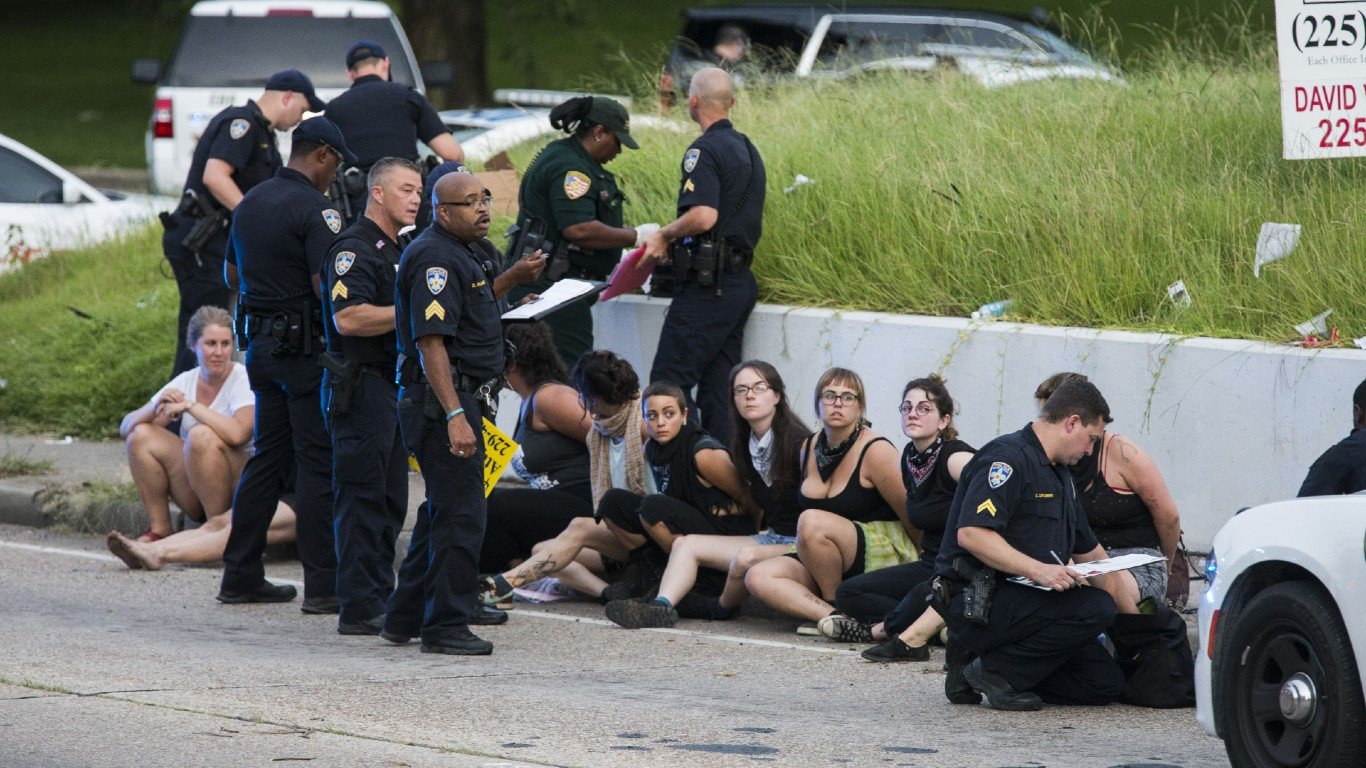
Source: Mark Wallheiser / Stringer / Getty Images
2. Louisiana
> Law enforcement officers killed on-duty, 2013-2022: 37.3 per 10,000 police officers (44 total)
> Officers killed feloniously, 2013-2022: 25 (56.8% of fatalities in state)
> Officers killed accidentally, 2013-2022: 19 (43.2% of fatalities in state)
> Deadliest year(s) for law enforcement from 2013-2022: 2016 (9 fatalities)
> Overall homicide rate, 2020: 15.8 murders per 100,000 people (the highest of 50 states)
> Total law enforcement officers in state, 2022: 11,790
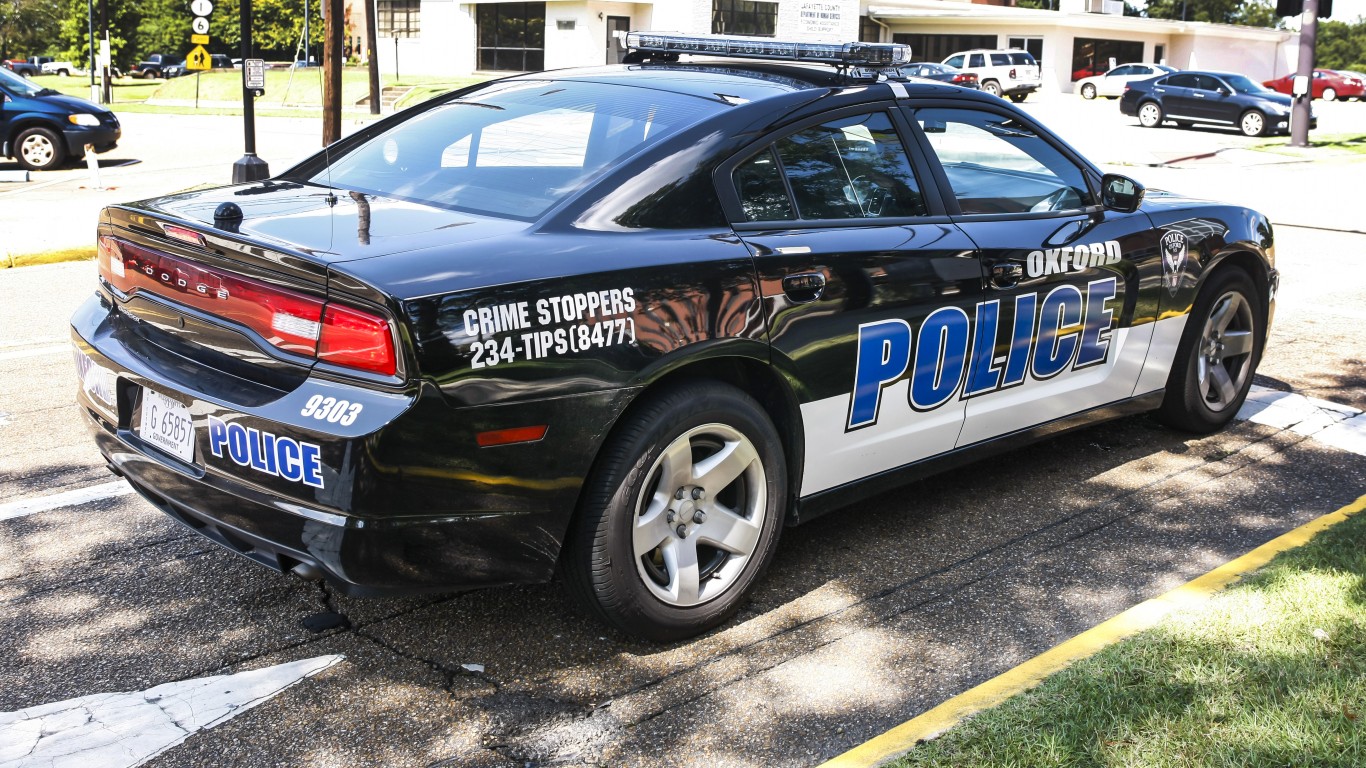
Source: csfotoimages / iStock Editorial via Getty Images
1. Mississippi
> Law enforcement officers killed on-duty, 2013-2022: 57.6 per 10,000 police officers (33 total)
> Officers killed feloniously, 2013-2022: 16 (48.5% of fatalities in state)
> Officers killed accidentally, 2013-2022: 17 (51.5% of fatalities in state)
> Deadliest year(s) for law enforcement from 2013-2022: 2013 (6 fatalities)
> Overall homicide rate, 2020: 10.6 murders per 100,000 people (3rd highest of 50 states)
> Total law enforcement officers in state, 2022: 5,731
Buffett Missed These Two…
Warren Buffett loves dividend stocks, and has stuffed Berkshire with some of his favorites.
But he overlooked two dividend legends that continue to print checks on a new level, they’re nowhere in his portfolio.
Unlock the two dividend legends Buffett missed in this new free report.
Thank you for reading! Have some feedback for us?
Contact the 24/7 Wall St. editorial team.
Editors' Picks