In an era of economic uncertainty, the U.S. job market remains resilient. After falling to 3.7% in November 2023, the national unemployment rate has been below 4% for 22 consecutive months, the longest streak in over 50 years.
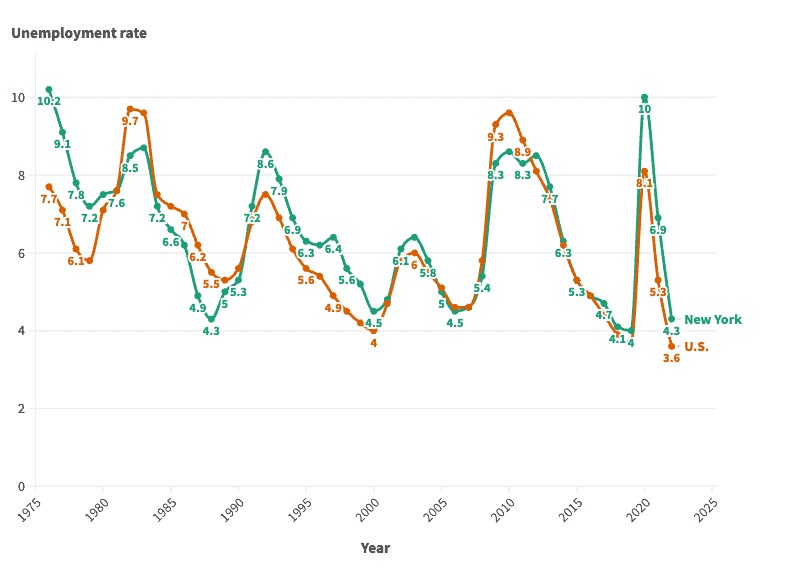
Of course, if history is any guide, much of the economy is subject to boom and bust cycles — and the job market is no exception. Since the mid-1970s, the average annual unemployment rate in the U.S. has fluctuated between 3.6% and nearly 10%, according to the Bureau of Labor Statistics.
These same cyclical patterns are also evident in New York, where the job market is supported largely by the professional and scientific and retail trade industries. The annual unemployment rate in the state was 4.3% in 2022, only slightly higher than the state’s lowest recorded annual jobless rate of 4%. However, conditions for job seekers have not always been so favorable.
According to historical BLS data going back to 1976, the annual jobless rate has been as high as 10.2% in New York. More than once, unemployment in the state has either matched or come close to that peak.
This is how New York’s job market has changed in each of the last 47 years.
1976: 10.2% unemployment
- Avg. unemployment rate: 10.2% (7.7% nationwide)
- Labor force participation rate: 58.0% (61.6% nationwide)
- Unemployed population in New York: 785,190
1977: 9.1% unemployment
- Avg. unemployment rate: 9.1% (7.1% nationwide)
- Labor force participation rate: 58.4% (62.3% nationwide)
- Unemployed population in New York: 708,963
1978: 7.8% unemployment
- Avg. unemployment rate: 7.8% (6.1% nationwide)
- Labor force participation rate: 59.2% (63.2% nationwide)
- Unemployed population in New York: 605,062
1979: 7.2% unemployment
- Avg. unemployment rate: 7.2% (5.8% nationwide)
- Labor force participation rate: 60.2% (63.7% nationwide)
- Unemployed population in New York: 566,880
1980: 7.5% unemployment

- Avg. unemployment rate: 7.5% (7.1% nationwide)
- Labor force participation rate: 59.9% (63.8% nationwide)
- Unemployed population in New York: 592,293
1981: 7.6% unemployment

- Avg. unemployment rate: 7.6% (7.6% nationwide)
- Labor force participation rate: 59.8% (63.9% nationwide)
- Unemployed population in New York: 606,976
1982: 8.5% unemployment
- Avg. unemployment rate: 8.5% (9.7% nationwide)
- Labor force participation rate: 59.4% (64.0% nationwide)
- Unemployed population in New York: 694,495
1983: 8.7% unemployment

- Avg. unemployment rate: 8.7% (9.6% nationwide)
- Labor force participation rate: 59.5% (64.0% nationwide)
- Unemployed population in New York: 715,247
1984: 7.2% unemployment
- Avg. unemployment rate: 7.2% (7.5% nationwide)
- Labor force participation rate: 59.4% (64.4% nationwide)
- Unemployed population in New York: 585,605
1985: 6.6% unemployment
- Avg. unemployment rate: 6.6% (7.2% nationwide)
- Labor force participation rate: 60.7% (64.8% nationwide)
- Unemployed population in New York: 550,074
1986: 6.2% unemployment
- Avg. unemployment rate: 6.2% (7.0% nationwide)
- Labor force participation rate: 61.4% (65.3% nationwide)
- Unemployed population in New York: 522,519
1987: 4.9% unemployment
- Avg. unemployment rate: 4.9% (6.2% nationwide)
- Labor force participation rate: 61.6% (65.6% nationwide)
- Unemployed population in New York: 408,560
1988: 4.3% unemployment
- Avg. unemployment rate: 4.3% (5.5% nationwide)
- Labor force participation rate: 61.9% (65.9% nationwide)
- Unemployed population in New York: 361,395
1989: 5.0% unemployment
- Avg. unemployment rate: 5.0% (5.3% nationwide)
- Labor force participation rate: 62.9% (66.5% nationwide)
- Unemployed population in New York: 421,904
1990: 5.3% unemployment
- Avg. unemployment rate: 5.3% (5.6% nationwide)
- Labor force participation rate: 62.7% (66.5% nationwide)
- Unemployed population in New York: 469,514
1991: 7.2% unemployment
- Avg. unemployment rate: 7.2% (6.8% nationwide)
- Labor force participation rate: 62.0% (66.2% nationwide)
- Unemployed population in New York: 638,519
1992: 8.6% unemployment
- Avg. unemployment rate: 8.6% (7.5% nationwide)
- Labor force participation rate: 62.0% (66.4% nationwide)
- Unemployed population in New York: 760,689
1993: 7.9% unemployment
- Avg. unemployment rate: 7.9% (6.9% nationwide)
- Labor force participation rate: 61.7% (66.3% nationwide)
- Unemployed population in New York: 692,475
1994: 6.9% unemployment
- Avg. unemployment rate: 6.9% (6.1% nationwide)
- Labor force participation rate: 61.3% (66.6% nationwide)
- Unemployed population in New York: 601,815
1995: 6.3% unemployment
- Avg. unemployment rate: 6.3% (5.6% nationwide)
- Labor force participation rate: 61.1% (66.6% nationwide)
- Unemployed population in New York: 549,842
1996: 6.2% unemployment
- Avg. unemployment rate: 6.2% (5.4% nationwide)
- Labor force participation rate: 61.8% (66.8% nationwide)
- Unemployed population in New York: 548,964
1997: 6.4% unemployment
- Avg. unemployment rate: 6.4% (4.9% nationwide)
- Labor force participation rate: 63.1% (67.1% nationwide)
- Unemployed population in New York: 578,175
1998: 5.6% unemployment
- Avg. unemployment rate: 5.6% (4.5% nationwide)
- Labor force participation rate: 63.1% (67.1% nationwide)
- Unemployed population in New York: 508,618
1999: 5.2% unemployment
- Avg. unemployment rate: 5.2% (4.2% nationwide)
- Labor force participation rate: 63.0% (67.1% nationwide)
- Unemployed population in New York: 472,336
2000: 4.5% unemployment
- Avg. unemployment rate: 4.5% (4.0% nationwide)
- Labor force participation rate: 62.8% (67.1% nationwide)
- Unemployed population in New York: 413,004
2001: 4.8% unemployment
- Avg. unemployment rate: 4.8% (4.7% nationwide)
- Labor force participation rate: 62.3% (66.8% nationwide)
- Unemployed population in New York: 445,991
2002: 6.1% unemployment
- Avg. unemployment rate: 6.1% (5.8% nationwide)
- Labor force participation rate: 63.1% (66.6% nationwide)
- Unemployed population in New York: 576,533
2003: 6.4% unemployment
- Avg. unemployment rate: 6.4% (6.0% nationwide)
- Labor force participation rate: 62.6% (66.2% nationwide)
- Unemployed population in New York: 593,856
2004: 5.8% unemployment
- Avg. unemployment rate: 5.8% (5.5% nationwide)
- Labor force participation rate: 62.7% (66.0% nationwide)
- Unemployed population in New York: 543,880
2005: 5.0% unemployment
- Avg. unemployment rate: 5.0% (5.1% nationwide)
- Labor force participation rate: 63.0% (66.0% nationwide)
- Unemployed population in New York: 469,312
2006: 4.5% unemployment
- Avg. unemployment rate: 4.5% (4.6% nationwide)
- Labor force participation rate: 63.0% (66.2% nationwide)
- Unemployed population in New York: 429,417
2007: 4.6% unemployment
- Avg. unemployment rate: 4.6% (4.6% nationwide)
- Labor force participation rate: 62.6% (66.0% nationwide)
- Unemployed population in New York: 422,736
2008: 5.4% unemployment
- Avg. unemployment rate: 5.4% (5.8% nationwide)
- Labor force participation rate: 63.1% (66.0% nationwide)
- Unemployed population in New York: 519,829
2009: 8.3% unemployment
- Avg. unemployment rate: 8.3% (9.3% nationwide)
- Labor force participation rate: 62.9% (65.4% nationwide)
- Unemployed population in New York: 810,105
2010: 8.6% unemployment
- Avg. unemployment rate: 8.6% (9.6% nationwide)
- Labor force participation rate: 62.6% (64.7% nationwide)
- Unemployed population in New York: 839,690
2011: 8.3% unemployment
- Avg. unemployment rate: 8.3% (8.9% nationwide)
- Labor force participation rate: 61.6% (64.1% nationwide)
- Unemployed population in New York: 796,090
2012: 8.5% unemployment
- Avg. unemployment rate: 8.5% (8.1% nationwide)
- Labor force participation rate: 61.7% (63.7% nationwide)
- Unemployed population in New York: 827,516
2013: 7.7% unemployment
- Avg. unemployment rate: 7.7% (7.4% nationwide)
- Labor force participation rate: 61.6% (63.2% nationwide)
- Unemployed population in New York: 752,157
2014: 6.3% unemployment
- Avg. unemployment rate: 6.3% (6.2% nationwide)
- Labor force participation rate: 60.7% (62.9% nationwide)
- Unemployed population in New York: 598,239
2015: 5.3% unemployment
- Avg. unemployment rate: 5.3% (5.3% nationwide)
- Labor force participation rate: 60.7% (62.7% nationwide)
- Unemployed population in New York: 500,530
2016: 4.9% unemployment
- Avg. unemployment rate: 4.9% (4.9% nationwide)
- Labor force participation rate: 60.6% (62.8% nationwide)
- Unemployed population in New York: 464,155
2017: 4.7% unemployment
- Avg. unemployment rate: 4.7% (4.4% nationwide)
- Labor force participation rate: 60.8% (62.9% nationwide)
- Unemployed population in New York: 455,420
2018: 4.1% unemployment
- Avg. unemployment rate: 4.1% (3.9% nationwide)
- Labor force participation rate: 60.6% (62.9% nationwide)
- Unemployed population in New York: 401,914
2019: 4.0% unemployment
- Avg. unemployment rate: 4.0% (3.7% nationwide)
- Labor force participation rate: 60.7% (63.1% nationwide)
- Unemployed population in New York: 379,452
2020: 10.0% unemployment
- Avg. unemployment rate: 10.0% (8.1% nationwide)
- Labor force participation rate: 59.0% (61.7% nationwide)
- Unemployed population in New York: 935,358
2021: 6.9% unemployment
- Avg. unemployment rate: 6.9% (5.3% nationwide)
- Labor force participation rate: 59.4% (61.7% nationwide)
- Unemployed population in New York: 671,757
2022: 4.3% unemployment
- Avg. unemployment rate: 4.3% (3.6% nationwide)
- Labor force participation rate: 60.2% (62.2% nationwide)
- Unemployed population in New York: 411,168
| Year | New York unemployment rate | U.S. unemployment rate | Unemployed population in New York |
|---|---|---|---|
| 1976 | 10.2 | 7.7 | 785,190 |
| 1977 | 9.1 | 7.1 | 708,963 |
| 1978 | 7.8 | 6.1 | 605,062 |
| 1979 | 7.2 | 5.8 | 566,880 |
| 1980 | 7.5 | 7.1 | 592,293 |
| 1981 | 7.6 | 7.6 | 606,976 |
| 1982 | 8.5 | 9.7 | 694,495 |
| 1983 | 8.7 | 9.6 | 715,247 |
| 1984 | 7.2 | 7.5 | 585,605 |
| 1985 | 6.6 | 7.2 | 550,074 |
| 1986 | 6.2 | 7.0 | 522,519 |
| 1987 | 4.9 | 6.2 | 408,560 |
| 1988 | 4.3 | 5.5 | 361,395 |
| 1989 | 5.0 | 5.3 | 421,904 |
| 1990 | 5.3 | 5.6 | 469,514 |
| 1991 | 7.2 | 6.8 | 638,519 |
| 1992 | 8.6 | 7.5 | 760,689 |
| 1993 | 7.9 | 6.9 | 692,475 |
| 1994 | 6.9 | 6.1 | 601,815 |
| 1995 | 6.3 | 5.6 | 549,842 |
| 1996 | 6.2 | 5.4 | 548,964 |
| 1997 | 6.4 | 4.9 | 578,175 |
| 1998 | 5.6 | 4.5 | 508,618 |
| 1999 | 5.2 | 4.2 | 472,336 |
| 2000 | 4.5 | 4.0 | 413,004 |
| 2001 | 4.8 | 4.7 | 445,991 |
| 2002 | 6.1 | 5.8 | 576,533 |
| 2003 | 6.4 | 6.0 | 593,856 |
| 2004 | 5.8 | 5.5 | 543,880 |
| 2005 | 5.0 | 5.1 | 469,312 |
| 2006 | 4.5 | 4.6 | 429,417 |
| 2007 | 4.6 | 4.6 | 422,736 |
| 2008 | 5.4 | 5.8 | 519,829 |
| 2009 | 8.3 | 9.3 | 810,105 |
| 2010 | 8.6 | 9.6 | 839,690 |
| 2011 | 8.3 | 8.9 | 796,090 |
| 2012 | 8.5 | 8.1 | 827,516 |
| 2013 | 7.7 | 7.4 | 752,157 |
| 2014 | 6.3 | 6.2 | 598,239 |
| 2015 | 5.3 | 5.3 | 500,530 |
| 2016 | 4.9 | 4.9 | 464,155 |
| 2017 | 4.7 | 4.4 | 455,420 |
| 2018 | 4.1 | 3.9 | 401,914 |
| 2019 | 4.0 | 3.7 | 379,452 |
| 2020 | 10.0 | 8.1 | 935,358 |
| 2021 | 6.9 | 5.3 | 671,757 |
| 2022 | 4.3 | 3.6 | 411,168 |
Contact [email protected] for any questions or corrections.