
In an era of economic uncertainty, the U.S. job market remains resilient. After falling to 3.7% in November 2023, the national unemployment rate has been below 4% for 22 consecutive months, the longest streak in over 50 years.
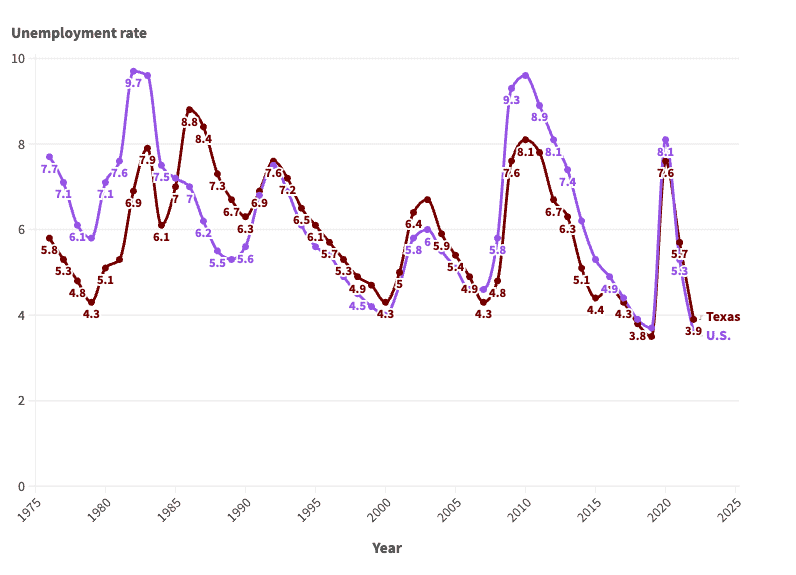
Of course, if history is any guide, much of the economy is subject to boom and bust cycles — and the job market is no exception. Since the mid-1970s, the average annual unemployment rate in the U.S. has fluctuated between 3.6% and nearly 10%, according to the Bureau of Labor Statistics.
These same cyclical patterns are also evident in Texas, where the job market is supported largely by the professional and scientific and retail trade industries. The annual unemployment rate in the state was 3.9% in 2022, only slightly higher than the state’s lowest recorded annual jobless rate of 3.5%. However, conditions for job seekers have not always been so favorable.
According to historical BLS data going back to 1976, the annual jobless rate has been as high as 8.8% in Texas. More than once, unemployment in the state has either matched or come close to that peak.
This is how Texas’s job market has changed in each of the last 47 years.
1976: 5.8% unemployment

- Avg. unemployment rate: 5.8% (7.7% nationwide)
- Labor force participation rate: 63.7% (61.6% nationwide)
- Unemployed population in Texas: 331,318
1977: 5.3% unemployment
- Avg. unemployment rate: 5.3% (7.1% nationwide)
- Labor force participation rate: 64.5% (62.3% nationwide)
- Unemployed population in Texas: 323,365
1978: 4.8% unemployment

- Avg. unemployment rate: 4.8% (6.1% nationwide)
- Labor force participation rate: 65.3% (63.2% nationwide)
- Unemployed population in Texas: 306,028
1979: 4.3% unemployment

- Avg. unemployment rate: 4.3% (5.8% nationwide)
- Labor force participation rate: 65.8% (63.7% nationwide)
- Unemployed population in Texas: 283,660
1980: 5.1% unemployment

- Avg. unemployment rate: 5.1% (7.1% nationwide)
- Labor force participation rate: 66.2% (63.8% nationwide)
- Unemployed population in Texas: 354,853
1981: 5.3% unemployment
- Avg. unemployment rate: 5.3% (7.6% nationwide)
- Labor force participation rate: 67.1% (63.9% nationwide)
- Unemployed population in Texas: 378,374
1982: 6.9% unemployment

- Avg. unemployment rate: 6.9% (9.7% nationwide)
- Labor force participation rate: 67.2% (64.0% nationwide)
- Unemployed population in Texas: 508,941
1983: 7.9% unemployment

- Avg. unemployment rate: 7.9% (9.6% nationwide)
- Labor force participation rate: 67.6% (64.0% nationwide)
- Unemployed population in Texas: 614,810
1984: 6.1% unemployment
- Avg. unemployment rate: 6.1% (7.5% nationwide)
- Labor force participation rate: 68.3% (64.4% nationwide)
- Unemployed population in Texas: 483,665
1985: 7.0% unemployment
- Avg. unemployment rate: 7.0% (7.2% nationwide)
- Labor force participation rate: 68.8% (64.8% nationwide)
- Unemployed population in Texas: 568,465
1986: 8.8% unemployment
- Avg. unemployment rate: 8.8% (7.0% nationwide)
- Labor force participation rate: 68.5% (65.3% nationwide)
- Unemployed population in Texas: 716,591
1987: 8.4% unemployment
- Avg. unemployment rate: 8.4% (6.2% nationwide)
- Labor force participation rate: 68.9% (65.6% nationwide)
- Unemployed population in Texas: 703,883
1988: 7.3% unemployment
- Avg. unemployment rate: 7.3% (5.5% nationwide)
- Labor force participation rate: 69.1% (65.9% nationwide)
- Unemployed population in Texas: 620,106
1989: 6.7% unemployment
- Avg. unemployment rate: 6.7% (5.3% nationwide)
- Labor force participation rate: 69.2% (66.5% nationwide)
- Unemployed population in Texas: 568,045
1990: 6.3% unemployment
- Avg. unemployment rate: 6.3% (5.6% nationwide)
- Labor force participation rate: 68.3% (66.5% nationwide)
- Unemployed population in Texas: 548,958
1991: 6.9% unemployment
- Avg. unemployment rate: 6.9% (6.8% nationwide)
- Labor force participation rate: 68.5% (66.2% nationwide)
- Unemployed population in Texas: 609,518
1992: 7.6% unemployment
- Avg. unemployment rate: 7.6% (7.5% nationwide)
- Labor force participation rate: 69.0% (66.4% nationwide)
- Unemployed population in Texas: 692,269
1993: 7.2% unemployment
- Avg. unemployment rate: 7.2% (6.9% nationwide)
- Labor force participation rate: 69.0% (66.3% nationwide)
- Unemployed population in Texas: 660,880
1994: 6.5% unemployment
- Avg. unemployment rate: 6.5% (6.1% nationwide)
- Labor force participation rate: 69.3% (66.6% nationwide)
- Unemployed population in Texas: 618,008
1995: 6.1% unemployment
- Avg. unemployment rate: 6.1% (5.6% nationwide)
- Labor force participation rate: 69.3% (66.6% nationwide)
- Unemployed population in Texas: 585,939
1996: 5.7% unemployment
- Avg. unemployment rate: 5.7% (5.4% nationwide)
- Labor force participation rate: 69.1% (66.8% nationwide)
- Unemployed population in Texas: 559,834
1997: 5.3% unemployment
- Avg. unemployment rate: 5.3% (4.9% nationwide)
- Labor force participation rate: 69.1% (67.1% nationwide)
- Unemployed population in Texas: 534,964
1998: 4.9% unemployment
- Avg. unemployment rate: 4.9% (4.5% nationwide)
- Labor force participation rate: 69.1% (67.1% nationwide)
- Unemployed population in Texas: 502,276
1999: 4.7% unemployment
- Avg. unemployment rate: 4.7% (4.2% nationwide)
- Labor force participation rate: 68.8% (67.1% nationwide)
- Unemployed population in Texas: 483,948
2000: 4.3% unemployment
- Avg. unemployment rate: 4.3% (4.0% nationwide)
- Labor force participation rate: 68.3% (67.1% nationwide)
- Unemployed population in Texas: 455,364
2001: 5.0% unemployment
- Avg. unemployment rate: 5.0% (4.7% nationwide)
- Labor force participation rate: 68.0% (66.8% nationwide)
- Unemployed population in Texas: 524,310
2002: 6.4% unemployment
- Avg. unemployment rate: 6.4% (5.8% nationwide)
- Labor force participation rate: 68.1% (66.6% nationwide)
- Unemployed population in Texas: 680,965
2003: 6.7% unemployment
- Avg. unemployment rate: 6.7% (6.0% nationwide)
- Labor force participation rate: 68.0% (66.2% nationwide)
- Unemployed population in Texas: 734,082
2004: 5.9% unemployment
- Avg. unemployment rate: 5.9% (5.5% nationwide)
- Labor force participation rate: 67.4% (66.0% nationwide)
- Unemployed population in Texas: 662,144
2005: 5.4% unemployment
- Avg. unemployment rate: 5.4% (5.1% nationwide)
- Labor force participation rate: 67.2% (66.0% nationwide)
- Unemployed population in Texas: 611,321
2006: 4.9% unemployment
- Avg. unemployment rate: 4.9% (4.6% nationwide)
- Labor force participation rate: 66.7% (66.2% nationwide)
- Unemployed population in Texas: 564,326
2007: 4.3% unemployment
- Avg. unemployment rate: 4.3% (4.6% nationwide)
- Labor force participation rate: 65.8% (66.0% nationwide)
- Unemployed population in Texas: 500,878
2008: 4.8% unemployment
- Avg. unemployment rate: 4.8% (5.8% nationwide)
- Labor force participation rate: 65.8% (66.0% nationwide)
- Unemployed population in Texas: 567,244
2009: 7.6% unemployment
- Avg. unemployment rate: 7.6% (9.3% nationwide)
- Labor force participation rate: 66.0% (65.4% nationwide)
- Unemployed population in Texas: 900,971
2010: 8.1% unemployment
- Avg. unemployment rate: 8.1% (9.6% nationwide)
- Labor force participation rate: 66.0% (64.7% nationwide)
- Unemployed population in Texas: 1,004,656
2011: 7.8% unemployment
- Avg. unemployment rate: 7.8% (8.9% nationwide)
- Labor force participation rate: 65.9% (64.1% nationwide)
- Unemployed population in Texas: 1,000,726
2012: 6.7% unemployment
- Avg. unemployment rate: 6.7% (8.1% nationwide)
- Labor force participation rate: 65.4% (63.7% nationwide)
- Unemployed population in Texas: 844,490
2013: 6.3% unemployment
- Avg. unemployment rate: 6.3% (7.4% nationwide)
- Labor force participation rate: 65.2% (63.2% nationwide)
- Unemployed population in Texas: 809,763
2014: 5.1% unemployment
- Avg. unemployment rate: 5.1% (6.2% nationwide)
- Labor force participation rate: 64.8% (62.9% nationwide)
- Unemployed population in Texas: 673,126
2015: 4.4% unemployment
- Avg. unemployment rate: 4.4% (5.3% nationwide)
- Labor force participation rate: 63.8% (62.7% nationwide)
- Unemployed population in Texas: 587,497
2016: 4.6% unemployment
- Avg. unemployment rate: 4.6% (4.9% nationwide)
- Labor force participation rate: 63.8% (62.8% nationwide)
- Unemployed population in Texas: 617,938
2017: 4.3% unemployment
- Avg. unemployment rate: 4.3% (4.4% nationwide)
- Labor force participation rate: 63.8% (62.9% nationwide)
- Unemployed population in Texas: 585,966
2018: 3.8% unemployment
- Avg. unemployment rate: 3.8% (3.9% nationwide)
- Labor force participation rate: 64.0% (62.9% nationwide)
- Unemployed population in Texas: 535,333
2019: 3.5% unemployment
- Avg. unemployment rate: 3.5% (3.7% nationwide)
- Labor force participation rate: 63.9% (63.1% nationwide)
- Unemployed population in Texas: 492,708
2020: 7.6% unemployment
- Avg. unemployment rate: 7.6% (8.1% nationwide)
- Labor force participation rate: 62.9% (61.7% nationwide)
- Unemployed population in Texas: 1,071,529
2021: 5.7% unemployment
- Avg. unemployment rate: 5.7% (5.3% nationwide)
- Labor force participation rate: 63.5% (61.7% nationwide)
- Unemployed population in Texas: 807,358
2022: 3.9% unemployment
- Avg. unemployment rate: 3.9% (3.6% nationwide)
- Labor force participation rate: 63.9% (62.2% nationwide)
- Unemployed population in Texas: 569,725
| Year | Texas unemployment rate | U.S. unemployment rate | Unemployed population in Texas |
|---|---|---|---|
| 1976 | 5.8 | 7.7 | 331,318 |
| 1977 | 5.3 | 7.1 | 323,365 |
| 1978 | 4.8 | 6.1 | 306,028 |
| 1979 | 4.3 | 5.8 | 283,660 |
| 1980 | 5.1 | 7.1 | 354,853 |
| 1981 | 5.3 | 7.6 | 378,374 |
| 1982 | 6.9 | 9.7 | 508,941 |
| 1983 | 7.9 | 9.6 | 614,810 |
| 1984 | 6.1 | 7.5 | 483,665 |
| 1985 | 7.0 | 7.2 | 568,465 |
| 1986 | 8.8 | 7.0 | 716,591 |
| 1987 | 8.4 | 6.2 | 703,883 |
| 1988 | 7.3 | 5.5 | 620,106 |
| 1989 | 6.7 | 5.3 | 568,045 |
| 1990 | 6.3 | 5.6 | 548,958 |
| 1991 | 6.9 | 6.8 | 609,518 |
| 1992 | 7.6 | 7.5 | 692,269 |
| 1993 | 7.2 | 6.9 | 660,880 |
| 1994 | 6.5 | 6.1 | 618,008 |
| 1995 | 6.1 | 5.6 | 585,939 |
| 1996 | 5.7 | 5.4 | 559,834 |
| 1997 | 5.3 | 4.9 | 534,964 |
| 1998 | 4.9 | 4.5 | 502,276 |
| 1999 | 4.7 | 4.2 | 483,948 |
| 2000 | 4.3 | 4.0 | 455,364 |
| 2001 | 5.0 | 4.7 | 524,310 |
| 2002 | 6.4 | 5.8 | 680,965 |
| 2003 | 6.7 | 6.0 | 734,082 |
| 2004 | 5.9 | 5.5 | 662,144 |
| 2005 | 5.4 | 5.1 | 611,321 |
| 2006 | 4.9 | 4.6 | 564,326 |
| 2007 | 4.3 | 4.6 | 500,878 |
| 2008 | 4.8 | 5.8 | 567,244 |
| 2009 | 7.6 | 9.3 | 900,971 |
| 2010 | 8.1 | 9.6 | 1,004,656 |
| 2011 | 7.8 | 8.9 | 1,000,726 |
| 2012 | 6.7 | 8.1 | 844,490 |
| 2013 | 6.3 | 7.4 | 809,763 |
| 2014 | 5.1 | 6.2 | 673,126 |
| 2015 | 4.4 | 5.3 | 587,497 |
| 2016 | 4.6 | 4.9 | 617,938 |
| 2017 | 4.3 | 4.4 | 585,966 |
| 2018 | 3.8 | 3.9 | 535,333 |
| 2019 | 3.5 | 3.7 | 492,708 |
| 2020 | 7.6 | 8.1 | 1,071,529 |
| 2021 | 5.7 | 5.3 | 807,358 |
| 2022 | 3.9 | 3.6 | 569,725 |
Contact [email protected] for any questions or corrections.