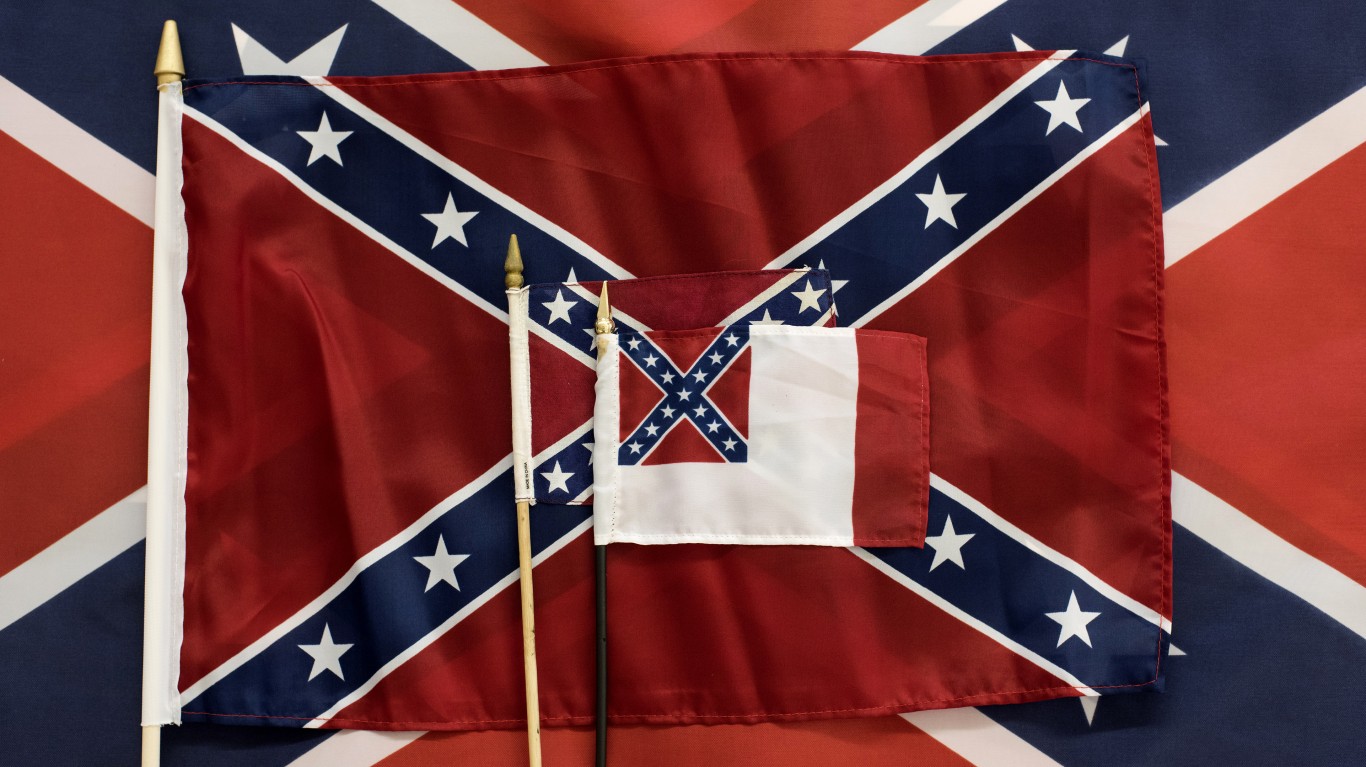
The United States has a long history of hate groups that began in 1865 when a group of Confederate veterans met to form the secret society known as the Ku Klux Klan. The KKK is the oldest and most known hate group in America and although they have historically targeted black Americans, they have since added a multitude of groups to their growing hatred, some of which include LGBTQ, immigrants, and people of the Jewish, and Catholic faith.
As of 2022, there are 1,225 hate groups in the United States, according to the non-profit legal group Southern Poverty Law Center (SLP). These hate groups include those with distinct chapters in cities across the country, such as the Proud Boys, the Oath Keepers, the Ku Klux Klan, and ACT for America. While specific views vary between these and other groups, they are generally all galvanized by curtailing government power or hatred toward individuals of certain races, religions, ethnicities, or sexual orientations. These groups are active in all 50 states, but in some parts of the country, they are far more common than in others.
Domestic terrorism and violent extremism are growing threats in the United States. The FBI had 9,049 open domestic terrorism cases in fiscal 2021, up 357% from the number of open domestic terrorism cases in fiscal 2013. Many of the most violent incidents of domestic terrorism in the U.S. today are carried out by individuals who have been radicalized by racist, homophobic, ethnocentric, or anti-government ideologies – ideologies widely propagated by extremist hate groups.
24/7 Wall St. identified the states with the most hate groups by using data from the SPLC report The Year in Hate & Extremism 2022. States are ranked by the total number of extremist anti-government and hate groups for every million residents. Population figures used for our calculation are from the U.S. Census Bureau’s 2021 American Community Survey.
Across the United States, there are 3.7 hate groups for every 1 million Americans. Depending on the state, the number of hate groups ranges from 1.5 to 15.5 per million people. The number of known hate groups climbed in all but six states in the last year alone. The largest increases were reported in Wyoming, New Mexico, Iowa, and Utah, states that each saw an increase of at least 350% in the number of hate groups. (These are the states where the Proud Boys grew the most since January 6.)
Sparsely populated states in the West and Midwest tend to be places with the highest concentration of active hate groups, yet, three of the 10 states with the highest concentration of hate and anti-government extremist groups are in the Northeast. Delaware, meanwhile, is the only Southern state to rank among the top 10 states by hate group concentration. (These are the states with the most January 6 rioters being charged.)
Here are the U.S. states with the highest concentration of hate groups.
50. Louisiana

Source: DenisTangneyJr / iStock via Getty Images
- Hate groups in 2022: 1.5 per million people (7 total)
- Hate groups in 2021: #10 most, with 3.2 per million people (15 total)
- Population: 4,624,047
- Most common ideologies: Anti-Government Movement (3), Neo-Confederate (1)
- State demographic makeup: 56.9% white; 31.0% Black; 4.3% foreign-born
49. Massachusetts

Source: Sean Pavone / iStock via Getty Images
- Hate groups in 2022: 1.6 per million people (11 total)
- Hate groups in 2021: #34 most, with 2.0 per million people (14 total)
- Population: 6,984,723
- Most common ideologies: Anti-Government Movement (6), Anti-LGBTQ (2), White Nationalist (1)
- State demographic makeup: 67.5% white; 6.3% Black; 17.6% foreign-born
48. Kansas

Source: John Moore / Getty Images News via Getty Images
- Hate groups in 2022: 2 per million people (6 total)
- Hate groups in 2021: #46 most, with 1.4 per million people (4 total)
- Population: 2,934,582
- Most common ideologies: Anti-Government Movement (3), White Nationalist (1)
- State demographic makeup: 73.4% white; 5.1% Black; 6.9% foreign-born
47. Kentucky

Source: Sean Pavone / iStock via Getty Images
- Hate groups in 2022: 2 per million people (9 total)
- Hate groups in 2021: #35 most, with 2.0 per million people (9 total)
- Population: 4,509,394
- Most common ideologies: Anti-Government Movement (3), General Hate (2), Neo-Völkisch (1)
- State demographic makeup: 82.7% white; 7.1% Black; 4.0% foreign-born
46. Georgia
Source: Spencer Platt / Getty Images News via Getty Images
- Hate groups in 2022: 2.2 per million people (24 total)
- Hate groups in 2021: #31 most, with 2.2 per million people (24 total)
- Population: 10,799,566
- Most common ideologies: Anti-Government Movement (13), White Nationalist (3), Anti-LGBTQ (2)
- State demographic makeup: 50.2% white; 30.4% Black; 10.0% foreign-born
45. Texas

Source: Kruck20 / iStock via Getty Images
- Hate groups in 2022: 2.4 per million people (72 total)
- Hate groups in 2021: #41 most, with 1.8 per million people (52 total)
- Population: 29,527,941
- Most common ideologies: Anti-Government Movement (39), General Hate (10), Anti-LGBTQ (5)
- State demographic makeup: 39.4% white; 11.6% Black; 17.2% foreign-born
44. Mississippi
Source: Timothy Ivy / Getty Images News via Getty Images
- Hate groups in 2022: 2.4 per million people (7 total)
- Hate groups in 2021: #21 most, with 2.7 per million people (8 total)
- Population: 2,949,965
- Most common ideologies: Anti-Government Movement (4), White Nationalist (1)
- State demographic makeup: 55.4% white; 36.0% Black; 2.1% foreign-born
43. New Jersey

Source: ChrisBoswell / iStock via Getty Images
- Hate groups in 2022: 2.4 per million people (22 total)
- Hate groups in 2021: #47 most, with 1.3 per million people (12 total)
- Population: 9,267,130
- Most common ideologies: Anti-Government Movement (16), White Nationalist (2), Anti-Immigrant (1)
- State demographic makeup: 52.1% white; 12.3% Black; 23.0% foreign-born
42. New Mexico

Source: Sean Pavone / iStock via Getty Images
- Hate groups in 2022: 2.4 per million people (5 total)
- Hate groups in 2021: #50 most, with 0.5 per million people (1 total)
- Population: 2,115,877
- Most common ideologies: Anti-Government Movement (4), White Nationalist (1)
- State demographic makeup: 34.9% white; 1.7% Black; 9.1% foreign-born
41. California

Source: Ron and Patty Thomas / E+ via Getty Images
- Hate groups in 2022: 2.6 per million people (103 total)
- Hate groups in 2021: #43 most, with 1.7 per million people (65 total)
- Population: 39,237,836
- Most common ideologies: Anti-Government Movement (57), General Hate (15), Anti-Muslim (8)
- State demographic makeup: 34.3% white; 5.3% Black; 26.6% foreign-born
40. Alabama
Source: Ty Wright / Getty Images News via Getty Images
- Hate groups in 2022: 2.6 per million people (13 total)
- Hate groups in 2021: #24 most, with 2.6 per million people (13 total)
- Population: 5,039,877
- Most common ideologies: Anti-Government Movement (8), Neo-Confederate (2)
- State demographic makeup: 64.2% white; 25.8% Black; 3.5% foreign-born
39. New York

Source: TomasSereda / iStock via Getty Images
- Hate groups in 2022: 2.7 per million people (53 total)
- Hate groups in 2021: #40 most, with 1.8 per million people (35 total)
- Population: 19,835,913
- Most common ideologies: Anti-Government Movement (25), General Hate (12), White Nationalist (4)
- State demographic makeup: 53.5% white; 13.4% Black; 22.3% foreign-born
38. Illinois

- Hate groups in 2022: 2.8 per million people (35 total)
- Hate groups in 2021: #37 most, with 1.8 per million people (23 total)
- Population: 12,671,469
- Most common ideologies: Anti-Government Movement (17), Anti-LGBTQ (4)
- State demographic makeup: 58.9% white; 13.4% Black; 14.2% foreign-born
37. Michigan

Source: pawel.gaul / E+ via Getty Images
- Hate groups in 2022: 2.9 per million people (29 total)
- Hate groups in 2021: #38 most, with 1.8 per million people (18 total)
- Population: 10,050,811
- Most common ideologies: Anti-Government Movement (19), White Nationalist (3)
- State demographic makeup: 72.9% white; 13.2% Black; 6.8% foreign-born
36. Connecticut

Source: DenisTangneyJr / E+ via Getty Images
- Hate groups in 2022: 3.1 per million people (11 total)
- Hate groups in 2021: #36 most, with 1.9 per million people (7 total)
- Population: 3,605,597
- Most common ideologies: Anti-Government Movement (7), White Nationalist (1)
- State demographic makeup: 62.7% white; 9.9% Black; 15.2% foreign-born
35. Oklahoma

Source: Sean Pavone / iStock via Getty Images
- Hate groups in 2022: 3.3 per million people (13 total)
- Hate groups in 2021: #30 most, with 2.3 per million people (9 total)
- Population: 3,986,639
- Most common ideologies: Anti-Government Movement (9), Neo-Völkisch (1)
- State demographic makeup: 62.8% white; 6.7% Black; 5.8% foreign-born
34. Minnesota

Source: culbertson / iStock via Getty Images
- Hate groups in 2022: 3.3 per million people (19 total)
- Hate groups in 2021: #44 most, with 1.6 per million people (9 total)
- Population: 5,707,390
- Most common ideologies: Anti-Government Movement (11), Neo-Völkisch (2)
- State demographic makeup: 76.9% white; 6.7% Black; 8.5% foreign-born
33. Wisconsin

Source: marchello74 / iStock via Getty Images
- Hate groups in 2022: 3.6 per million people (21 total)
- Hate groups in 2021: #33 most, with 2.0 per million people (12 total)
- Population: 5,895,908
- Most common ideologies: Anti-Government Movement (13), Neo-Völkisch (2)
- State demographic makeup: 79.0% white; 6.1% Black; 5.1% foreign-born
32. Missouri

- Hate groups in 2022: 3.6 per million people (22 total)
- Hate groups in 2021: #19 most, with 2.8 per million people (17 total)
- Population: 6,168,187
- Most common ideologies: Anti-Government Movement (12), General Hate (4), White Nationalist (2)
- State demographic makeup: 76.6% white; 10.7% Black; 4.1% foreign-born
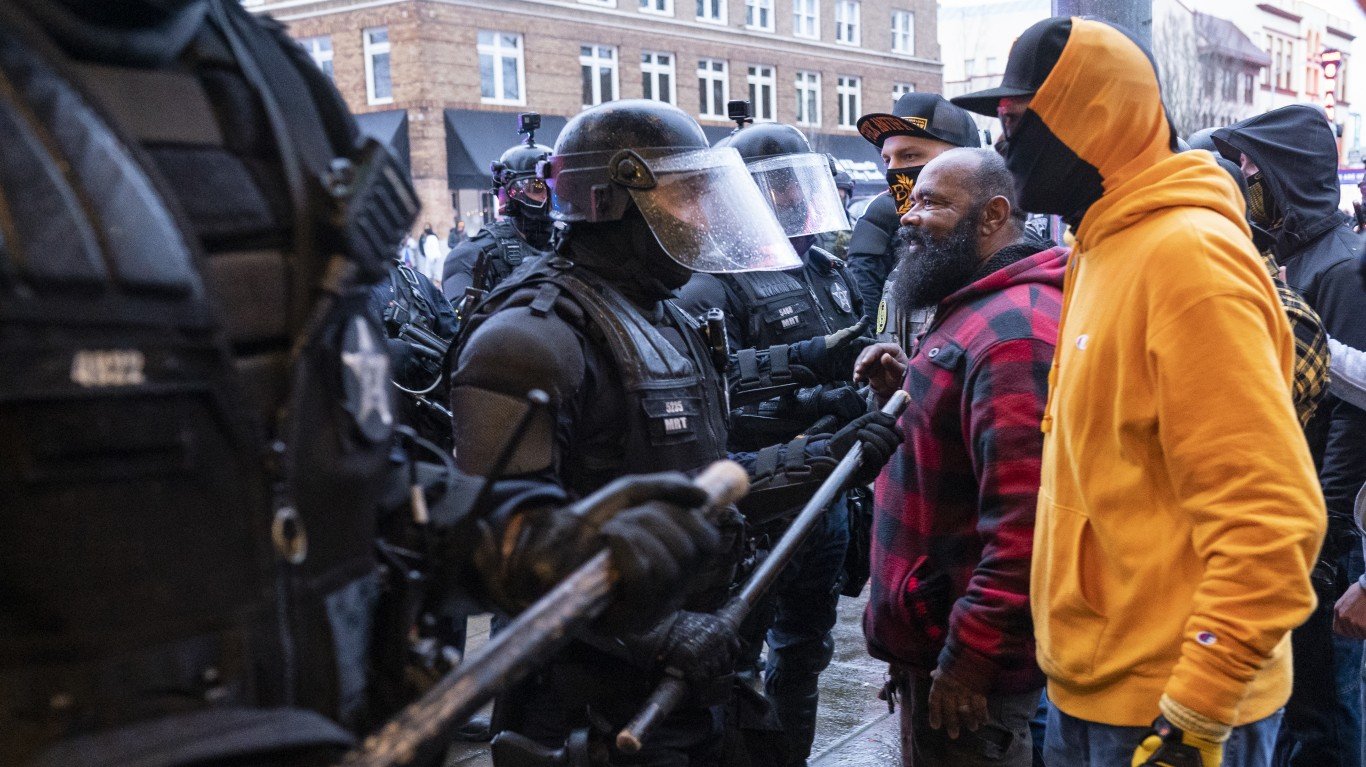
31. Washington

Source: Win McNamee / Getty Images News via Getty Images
- Hate groups in 2022: 3.7 per million people (29 total)
- Hate groups in 2021: #25 most, with 2.5 per million people (19 total)
- Population: 7,738,692
- Most common ideologies: Anti-Government Movement (13), Anti-LGBTQ (3)
- State demographic makeup: 64.3% white; 3.9% Black; 14.8% foreign-born
30. Nevada

Source: Spencer Platt / Getty Images News via Getty Images
- Hate groups in 2022: 3.8 per million people (12 total)
- Hate groups in 2021: #17 most, with 2.9 per million people (9 total)
- Population: 3,143,991
- Most common ideologies: Anti-Government Movement (6), General Hate (2), Neo-Völkisch (1)
- State demographic makeup: 45.2% white; 8.7% Black; 18.4% foreign-born
29. Iowa

- Hate groups in 2022: 3.8 per million people (12 total)
- Hate groups in 2021: #48 most, with 0.6 per million people (2 total)
- Population: 3,193,079
- Most common ideologies: Anti-Government Movement (10), White Nationalist (1)
- State demographic makeup: 83.0% white; 3.5% Black; 5.4% foreign-born
28. Florida

Source: Michael Reaves / Getty Images Sport via Getty Images
- Hate groups in 2022: 4.1 per million people (89 total)
- Hate groups in 2021: #26 most, with 2.4 per million people (53 total)
- Population: 21,781,128
- Most common ideologies: Anti-Government Movement (54), General Hate (11), Anti-LGBTQ (6)
- State demographic makeup: 51.1% white; 14.6% Black; 21.2% foreign-born
27. North Carolina

Source: Sean Rayford / Getty Images News via Getty Images
- Hate groups in 2022: 4.1 per million people (43 total)
- Hate groups in 2021: #22 most, with 2.7 per million people (28 total)
- Population: 10,551,162
- Most common ideologies: Anti-Government Movement (27), General Hate (5), Neo-Confederate (3)
- State demographic makeup: 60.9% white; 19.9% Black; 8.2% foreign-born
26. Maryland

- Hate groups in 2022: 4.1 per million people (25 total)
- Hate groups in 2021: #39 most, with 1.8 per million people (11 total)
- Population: 6,165,129
- Most common ideologies: Anti Government Movement (15), General Hate (4), Neo-Confederate (1)
- State demographic makeup: 47.8% white; 29.0% Black; 15.9% foreign-born
25. Indiana

Source: Nathan Howard / Getty Images News via Getty Images
- Hate groups in 2022: 4.3 per million people (29 total)
- Hate groups in 2021: #32 most, with 2.1 per million people (14 total)
- Population: 6,805,985
- Most common ideologies: Anti-Government Movement (16), White Nationalist (3), Neo-Völkisch (2)
- State demographic makeup: 76.6% white; 8.7% Black; 5.6% foreign-born
24. Vermont

Source: Nathan Howard / Getty Images News via Getty Images
- Hate groups in 2022: 4.6 per million people (3 total)
- Hate groups in 2021: #12 most, with 3.1 per million people (2 total)
- Population: 645,570
- Most common ideologies: Anti-Government Movement (2), White Nationalist (1), Neo-Völkisch(0)
- State demographic makeup: 90.6% white; 1.0% Black; 4.2% foreign-born
23. Ohio

Source: Karen Ducey / Getty Images News via Getty Images
- Hate groups in 2022: 4.7 per million people (55 total)
- Hate groups in 2021: #42 most, with 1.7 per million people (20 total)
- Population: 11,780,017
- Most common ideologies: Anti-Government Movement (35), Anti-LGBTQ (4)
- State demographic makeup: 76.6% white; 11.8% Black; 5.0% foreign-born
22. Tennessee

Source: Spencer Platt / Getty Images News via Getty Images
- Hate groups in 2022: 4.7 per million people (33 total)
- Hate groups in 2021: #4 most, with 4.0 per million people (28 total)
- Population: 6,975,218
- Most common ideologies: Anti-Government Movement (12), White Nationalist (4), Neo-Nazi (3)
- State demographic makeup: 72.1% white; 15.4% Black; 5.3% foreign-born
21. Virginia

Source: Chip Somodevilla / Getty Images News via Getty Images
- Hate groups in 2022: 5 per million people (43 total)
- Hate groups in 2021: #28 most, with 2.3 per million people (20 total)
- Population: 8,642,274
- Most common ideologies: Anti-Government Movement (28), White Nationalist (5), General Hate (3)
- State demographic makeup: 59.2% white; 18.0% Black; 12.4% foreign-born
20. West Virginia

Source: Nathan Howard / Getty Images News via Getty Images
- Hate groups in 2022: 5 per million people (9 total)
- Hate groups in 2021: #8 most, with 3.4 per million people (6 total)
- Population: 1,782,959
- Most common ideologies: Anti-Government Movement (3), Anti-Government Movement (3), Neo-Völkisch (1)
- State demographic makeup: 90.4% white; 2.8% Black; 1.6% foreign-born
19. Colorado

Source: Michael Ciaglo / Getty Images News via Getty Images
- Hate groups in 2022: 5.3 per million people (31 total)
- Hate groups in 2021: #13 most, with 3.1 per million people (18 total)
- Population: 5,812,069
- Most common ideologies: Anti-Government Movement (17), Anti-LGBTQ (4)
- State demographic makeup: 65.2% white; 3.7% Black; 9.8% foreign-born
18. Arkansas

Source: David S. Holloway / Getty Images
- Hate groups in 2022: 5.3 per million people (16 total)
- Hate groups in 2021: #15 most, with 3.0 per million people (9 total)
- Population: 3,025,891
- Most common ideologies: Anti-Government Movement (9), White Nationalist (3), Neo-Völkisch (1)
- State demographic makeup: 68.2% white; 14.7% Black; 4.7% foreign-born
17. Arizona

Source: Nathan Howard / Getty Images News via Getty Images
- Hate groups in 2022: 5.4 per million people (39 total)
- Hate groups in 2021: #14 most, with 3.0 per million people (22 total)
- Population: 7,276,316
- Most common ideologies: Anti-Government Movement (21), Anti-LGBTQ (5), White Nationalist (4)
- State demographic makeup: 52.0% white; 4.3% Black; 12.6% foreign-born
16. Utah
Source: Karen Ducey / Getty Images News via Getty Images
- Hate groups in 2022: 5.4 per million people (18 total)
- Hate groups in 2021: #49 most, with 0.6 per million people (2 total)
- Population: 3,337,975
- Most common ideologies: Anti-Government Movement (16), White Nationalist (1)
- State demographic makeup: 76.0% white; 1.0% Black; 8.3% foreign-born
15. Alaska

Source: Stephanie Keith / Getty Images News via Getty Images
- Hate groups in 2022: 5.5 per million people (4 total)
- Hate groups in 2021: #45 most, with 1.4 per million people (1 total)
- Population: 732,673
- Most common ideologies: Anti-Government Movement (3), Neo-Völkisch (1)
- State demographic makeup: 57.9% white; 2.9% Black; 8.1% foreign-born
14. Hawaii
Source: Nathan Howard / Getty Images News via Getty Images
- Hate groups in 2022: 5.5 per million people (8 total)
- Hate groups in 2021: #18 most, with 2.8 per million people (4 total)
- Population: 1,441,553
- Most common ideologies: Anti-Government Movement (6), Neo-Nazi (1), State demographic makeup: 20.8% white; 1.8% Black; 18.8% foreign-born
13. Pennsylvania

Source: Nathan Howard / Getty Images News via Getty Images
- Hate groups in 2022: 5.6 per million people (72 total)
- Hate groups in 2021: #29 most, with 2.3 per million people (30 total)
- Population: 12,964,056
- Most common ideologies: Anti-Government Movement (51), White Nationalist (7), Neo-Nazi (3)
- State demographic makeup: 73.6% white; 10.2% Black; 7.2% foreign-born
12. Oregon

Source: Nathan Howard / Getty Images News via Getty Images
- Hate groups in 2022: 5.7 per million people (24 total)
- Hate groups in 2021: #27 most, with 2.4 per million people (10 total)
- Population: 4,246,155
- Most common ideologies: Anti-Government Movement (14), General Hate (4), White Nationalist (3)
- State demographic makeup: 72.0% white; 1.8% Black; 9.7% foreign-born
11. South Carolina

Source: John Moore / Getty Images News via Getty Images
- Hate groups in 2022: 5.8 per million people (30 total)
- Hate groups in 2021: #9 most, with 3.3 per million people (17 total)
- Population: 5,190,705
- Most common ideologies: Anti-Government Movement (18), White Nationalist (5), Neo-Völkisch (2)
- State demographic makeup: 62.6% white; 24.9% Black; 5.2% foreign-born
10. Nebraska

Source: Tasos Katopodis / Getty Images News via Getty Images
- Hate groups in 2022: 6.1 per million people (12 total)
- Hate groups in 2021: #1 most, with 4.6 per million people (9 total)
- Population: 1,963,692
- Most common ideologies: Anti-Government Movement (4), Neo-Nazi (3), White Nationalist (1)
- State demographic makeup: 76.4% white; 4.6% Black; 7.4% foreign-born
9. Rhode Island

Source: Stephanie Keith / Getty Images News via Getty Images
- Hate groups in 2022: 6.4 per million people (7 total)
- Hate groups in 2021: #20 most, with 2.7 per million people (3 total)
- Population: 1,095,610
- Most common ideologies: Anti-Government Movement (4), White Nationalist (1)
- State demographic makeup: 68.9% white; 4.5% Black; 14.5% foreign-born
8. Maine

Source: Andrew Lichtenstein / Corbis News via Getty Images
- Hate groups in 2022: 6.6 per million people (9 total)
- Hate groups in 2021: #16 most, with 2.9 per million people (4 total)
- Population: 1,372,247
- Most common ideologies: Anti-Government Movement (4), White Nationalist (2), Neo-Völkisch (1)
- State demographic makeup: 90.0% white; 1.5% Black; 4.1% foreign-born
7. Delaware

Source: Stephanie Keith / Getty Images News via Getty Images
- Hate groups in 2022: 7 per million people (7 total)
- Hate groups in 2021: #5 most, with 4.0 per million people (4 total)
- Population: 1,003,384
- Most common ideologies: Anti-Government Movement (5), White Nationalist (1)
- State demographic makeup: 59.3% white; 20.5% Black; 10.1% foreign-born
6. South Dakota

- Hate groups in 2022: 8.9 per million people (8 total)
- Hate groups in 2021: #2 most, with 4.5 per million people (4 total)
- Population: 895,376
- Most common ideologies: Anti-Government Movement (4), White Nationalist (2), Neo-Nazi (1)
- State demographic makeup: 80.0% white; 1.9% Black; 3.5% foreign-born
5. North Dakota

Source: Public Domain / Wikimedia Commons
- Hate groups in 2022: 10.3 per million people (8 total)
- Hate groups in 2021: #23 most, with 2.6 per million people (2 total)
- Population: 774,948
- Most common ideologies: Anti-Government Movement (3), Neo-Völkisch (2), White Nationalist (1)
- State demographic makeup: 82.3% white; 2.9% Black; 4.4% foreign-born
4. New Hampshire

Source: David Butow / Getty Images
- Hate groups in 2022: 10.8 per million people (15 total)
- Hate groups in 2021: #3 most, with 4.3 per million people (6 total)
- Population: 1,388,992
- Most common ideologies: Anti-Government Movement (8), White Nationalist (2)
- State demographic makeup: 87.3% white; 1.3% Black; 5.9% foreign-born
3. Montana

Source: Anthony Crider / Wikimedia Commons
- Hate groups in 2022: 10.9 per million people (12 total)
- Hate groups in 2021: #6 most, with 3.6 per million people (4 total)
- Population: 1,104,271
- Most common ideologies: Anti-Government Movement (6), White Nationalist (2)
- State demographic makeup: 83.8% white; 0.5% Black; 2.2% foreign-born
2. Idaho

Source: David S. Holloway / Getty Images
- Hate groups in 2022: 11 per million people (21 total)
- Hate groups in 2021: #11 most, with 3.2 per million people (6 total)
- Population: 1,900,923
- Most common ideologies: Anti-Government Movement (12), General Hate (2), Neo-Völkisch (1)
- State demographic makeup: 78.7% white; 0.7% Black; 6.1% foreign-born
1. Wyoming

Source: Chip Somodevilla / Getty Images
- Hate groups in 2022: 15.5 per million people (9 total)
- Hate groups in 2021: #7 most, with 3.5 per million people (2 total)
- Population: 578,803
- Most common ideologies: Anti-Government Movement (6), White Nationalist (1)
- State demographic makeup: 81.5% white; 1.0% Black; 3.4% foreign-born
Take This Retirement Quiz To Get Matched With An Advisor Now (Sponsored)
Are you ready for retirement? Planning for retirement can be overwhelming, that’s why it could be a good idea to speak to a fiduciary financial advisor about your goals today.
Start by taking this retirement quiz right here from SmartAsset that will match you with up to 3 financial advisors that serve your area and beyond in 5 minutes. Smart Asset is now matching over 50,000 people a month.
Click here now to get started.
Thank you for reading! Have some feedback for us?
Contact the 24/7 Wall St. editorial team.
Editors' Picks