
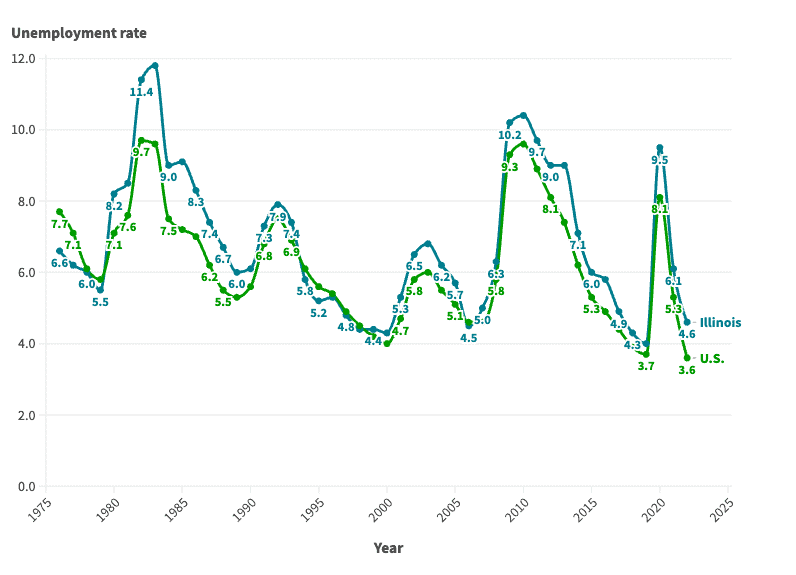
In an era of economic uncertainty, the U.S. job market remains resilient. After falling to 3.7% in November 2023, the national unemployment rate has been below 4% for 22 consecutive months, the longest streak in over 50 years.
Of course, if history is any guide, much of the economy is subject to boom and bust cycles — and the job market is no exception. Since the mid-1970s, the average annual unemployment rate in the U.S. has fluctuated between 3.6% and nearly 10%, according to the Bureau of Labor Statistics.
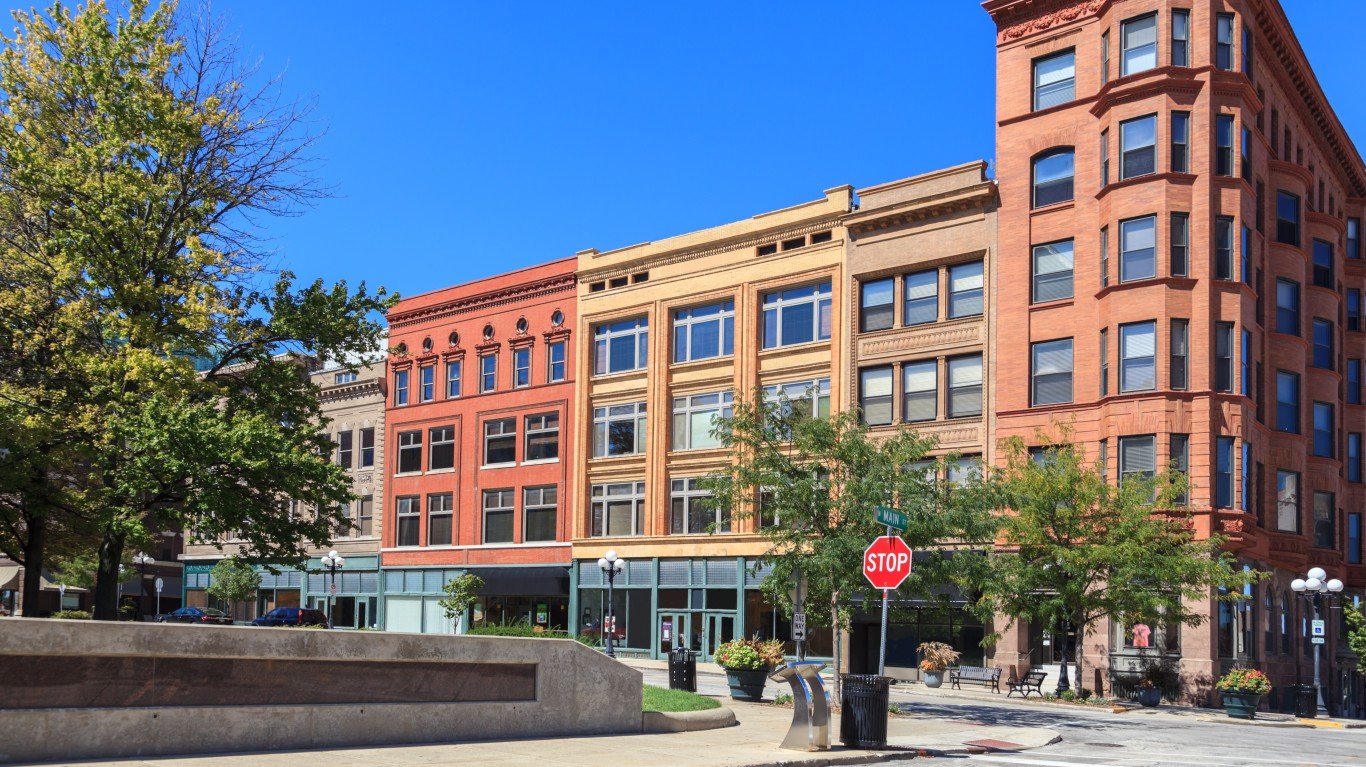
These same cyclical patterns are also evident in Illinois, where the job market is supported largely by the professional and scientific and manufacturing industries. The annual unemployment rate in the state was 4.6% in 2022, only slightly higher than the state’s lowest recorded annual jobless rate of 4%. However, conditions for job seekers have not always been so favorable.
According to historical BLS data going back to 1976, the annual jobless rate has been as high as 11.8% in Illinois. More than once, unemployment in the state has either matched or come close to that peak.
This is how Illinois’s job market has changed in each of the last 47 years.
1976: 6.6% unemployment
- Avg. unemployment rate: 6.6% (7.7% nationwide)
- Labor force participation rate: 62.9% (61.6% nationwide)
- Unemployed population in Illinois: 336,593
1977: 6.2% unemployment

- Avg. unemployment rate: 6.2% (7.1% nationwide)
- Labor force participation rate: 63.8% (62.3% nationwide)
- Unemployed population in Illinois: 326,911
1978: 6.0% unemployment

- Avg. unemployment rate: 6.0% (6.1% nationwide)
- Labor force participation rate: 64.8% (63.2% nationwide)
- Unemployed population in Illinois: 325,540
1979: 5.5% unemployment

- Avg. unemployment rate: 5.5% (5.8% nationwide)
- Labor force participation rate: 64.9% (63.7% nationwide)
- Unemployed population in Illinois: 303,261
1980: 8.2% unemployment

- Avg. unemployment rate: 8.2% (7.1% nationwide)
- Labor force participation rate: 65.4% (63.8% nationwide)
- Unemployed population in Illinois: 453,616
1981: 8.5% unemployment

- Avg. unemployment rate: 8.5% (7.6% nationwide)
- Labor force participation rate: 65.6% (63.9% nationwide)
- Unemployed population in Illinois: 482,384
1982: 11.4% unemployment
- Avg. unemployment rate: 11.4% (9.7% nationwide)
- Labor force participation rate: 65.6% (64.0% nationwide)
- Unemployed population in Illinois: 640,399
1983: 11.8% unemployment

- Avg. unemployment rate: 11.8% (9.6% nationwide)
- Labor force participation rate: 65.3% (64.0% nationwide)
- Unemployed population in Illinois: 654,851
1984: 9.0% unemployment
- Avg. unemployment rate: 9.0% (7.5% nationwide)
- Labor force participation rate: 65.1% (64.4% nationwide)
- Unemployed population in Illinois: 511,851
1985: 9.1% unemployment
- Avg. unemployment rate: 9.1% (7.2% nationwide)
- Labor force participation rate: 65.5% (64.8% nationwide)
- Unemployed population in Illinois: 513,416
1986: 8.3% unemployment
- Avg. unemployment rate: 8.3% (7.0% nationwide)
- Labor force participation rate: 65.6% (65.3% nationwide)
- Unemployed population in Illinois: 472,919
1987: 7.4% unemployment
- Avg. unemployment rate: 7.4% (6.2% nationwide)
- Labor force participation rate: 65.9% (65.6% nationwide)
- Unemployed population in Illinois: 430,220
1988: 6.7% unemployment
- Avg. unemployment rate: 6.7% (5.5% nationwide)
- Labor force participation rate: 66.4% (65.9% nationwide)
- Unemployed population in Illinois: 393,846
1989: 6.0% unemployment
- Avg. unemployment rate: 6.0% (5.3% nationwide)
- Labor force participation rate: 67.9% (66.5% nationwide)
- Unemployed population in Illinois: 363,132
1990: 6.1% unemployment
- Avg. unemployment rate: 6.1% (5.6% nationwide)
- Labor force participation rate: 68.2% (66.5% nationwide)
- Unemployed population in Illinois: 371,930
1991: 7.3% unemployment
- Avg. unemployment rate: 7.3% (6.8% nationwide)
- Labor force participation rate: 67.6% (66.2% nationwide)
- Unemployed population in Illinois: 432,444
1992: 7.9% unemployment
- Avg. unemployment rate: 7.9% (7.5% nationwide)
- Labor force participation rate: 68.2% (66.4% nationwide)
- Unemployed population in Illinois: 473,748
1993: 7.4% unemployment
- Avg. unemployment rate: 7.4% (6.9% nationwide)
- Labor force participation rate: 68.1% (66.3% nationwide)
- Unemployed population in Illinois: 454,785
1994: 5.8% unemployment
- Avg. unemployment rate: 5.8% (6.1% nationwide)
- Labor force participation rate: 68.0% (66.6% nationwide)
- Unemployed population in Illinois: 356,065
1995: 5.2% unemployment
- Avg. unemployment rate: 5.2% (5.6% nationwide)
- Labor force participation rate: 68.3% (66.6% nationwide)
- Unemployed population in Illinois: 321,514
1996: 5.3% unemployment
- Avg. unemployment rate: 5.3% (5.4% nationwide)
- Labor force participation rate: 68.6% (66.8% nationwide)
- Unemployed population in Illinois: 330,937
1997: 4.8% unemployment
- Avg. unemployment rate: 4.8% (4.9% nationwide)
- Labor force participation rate: 68.7% (67.1% nationwide)
- Unemployed population in Illinois: 301,777
1998: 4.4% unemployment
- Avg. unemployment rate: 4.4% (4.5% nationwide)
- Labor force participation rate: 68.7% (67.1% nationwide)
- Unemployed population in Illinois: 283,850
1999: 4.4% unemployment
- Avg. unemployment rate: 4.4% (4.2% nationwide)
- Labor force participation rate: 69.5% (67.1% nationwide)
- Unemployed population in Illinois: 284,597
2000: 4.3% unemployment
- Avg. unemployment rate: 4.3% (4.0% nationwide)
- Labor force participation rate: 69.5% (67.1% nationwide)
- Unemployed population in Illinois: 288,369
2001: 5.3% unemployment
- Avg. unemployment rate: 5.3% (4.7% nationwide)
- Labor force participation rate: 68.6% (66.8% nationwide)
- Unemployed population in Illinois: 351,000
2002: 6.5% unemployment
- Avg. unemployment rate: 6.5% (5.8% nationwide)
- Labor force participation rate: 67.0% (66.6% nationwide)
- Unemployed population in Illinois: 415,901
2003: 6.8% unemployment
- Avg. unemployment rate: 6.8% (6.0% nationwide)
- Labor force participation rate: 66.3% (66.2% nationwide)
- Unemployed population in Illinois: 425,386
2004: 6.2% unemployment
- Avg. unemployment rate: 6.2% (5.5% nationwide)
- Labor force participation rate: 66.4% (66.0% nationwide)
- Unemployed population in Illinois: 392,977
2005: 5.7% unemployment
- Avg. unemployment rate: 5.7% (5.1% nationwide)
- Labor force participation rate: 66.7% (66.0% nationwide)
- Unemployed population in Illinois: 366,082
2006: 4.5% unemployment
- Avg. unemployment rate: 4.5% (4.6% nationwide)
- Labor force participation rate: 67.3% (66.2% nationwide)
- Unemployed population in Illinois: 297,770
2007: 5.0% unemployment
- Avg. unemployment rate: 5.0% (4.6% nationwide)
- Labor force participation rate: 68.1% (66.0% nationwide)
- Unemployed population in Illinois: 337,789
2008: 6.3% unemployment
- Avg. unemployment rate: 6.3% (5.8% nationwide)
- Labor force participation rate: 67.8% (66.0% nationwide)
- Unemployed population in Illinois: 430,763
2009: 10.2% unemployment
- Avg. unemployment rate: 10.2% (9.3% nationwide)
- Labor force participation rate: 66.8% (65.4% nationwide)
- Unemployed population in Illinois: 673,081
2010: 10.4% unemployment
- Avg. unemployment rate: 10.4% (9.6% nationwide)
- Labor force participation rate: 66.8% (64.7% nationwide)
- Unemployed population in Illinois: 694,231
2011: 9.7% unemployment
- Avg. unemployment rate: 9.7% (8.9% nationwide)
- Labor force participation rate: 66.0% (64.1% nationwide)
- Unemployed population in Illinois: 641,744
2012: 9.0% unemployment
- Avg. unemployment rate: 9.0% (8.1% nationwide)
- Labor force participation rate: 65.9% (63.7% nationwide)
- Unemployed population in Illinois: 594,235
2013: 9.0% unemployment
- Avg. unemployment rate: 9.0% (7.4% nationwide)
- Labor force participation rate: 65.4% (63.2% nationwide)
- Unemployed population in Illinois: 595,392
2014: 7.1% unemployment
- Avg. unemployment rate: 7.1% (6.2% nationwide)
- Labor force participation rate: 64.8% (62.9% nationwide)
- Unemployed population in Illinois: 467,313
2015: 6.0% unemployment
- Avg. unemployment rate: 6.0% (5.3% nationwide)
- Labor force participation rate: 64.8% (62.7% nationwide)
- Unemployed population in Illinois: 391,863
2016: 5.8% unemployment
- Avg. unemployment rate: 5.8% (4.9% nationwide)
- Labor force participation rate: 65.3% (62.8% nationwide)
- Unemployed population in Illinois: 386,366
2017: 4.9% unemployment
- Avg. unemployment rate: 4.9% (4.4% nationwide)
- Labor force participation rate: 64.7% (62.9% nationwide)
- Unemployed population in Illinois: 324,358
2018: 4.3% unemployment
- Avg. unemployment rate: 4.3% (3.9% nationwide)
- Labor force participation rate: 64.7% (62.9% nationwide)
- Unemployed population in Illinois: 286,572
2019: 4.0% unemployment
- Avg. unemployment rate: 4.0% (3.7% nationwide)
- Labor force participation rate: 64.7% (63.1% nationwide)
- Unemployed population in Illinois: 260,782
2020: 9.5% unemployment
- Avg. unemployment rate: 9.5% (8.1% nationwide)
- Labor force participation rate: 62.7% (61.7% nationwide)
- Unemployed population in Illinois: 590,812
2021: 6.1% unemployment
- Avg. unemployment rate: 6.1% (5.3% nationwide)
- Labor force participation rate: 63.1% (61.7% nationwide)
- Unemployed population in Illinois: 385,984
2022: 4.6% unemployment
- Avg. unemployment rate: 4.6% (3.6% nationwide)
- Labor force participation rate: 64.5% (62.2% nationwide)
- Unemployed population in Illinois: 295,787
| Year | Illinois unemployment rate | U.S. unemployment rate | Unemployed population in Illinois |
|---|---|---|---|
| 1976 | 6.6 | 7.7 | 336,593 |
| 1977 | 6.2 | 7.1 | 326,911 |
| 1978 | 6.0 | 6.1 | 325,540 |
| 1979 | 5.5 | 5.8 | 303,261 |
| 1980 | 8.2 | 7.1 | 453,616 |
| 1981 | 8.5 | 7.6 | 482,384 |
| 1982 | 11.4 | 9.7 | 640,399 |
| 1983 | 11.8 | 9.6 | 654,851 |
| 1984 | 9.0 | 7.5 | 511,851 |
| 1985 | 9.1 | 7.2 | 513,416 |
| 1986 | 8.3 | 7.0 | 472,919 |
| 1987 | 7.4 | 6.2 | 430,220 |
| 1988 | 6.7 | 5.5 | 393,846 |
| 1989 | 6.0 | 5.3 | 363,132 |
| 1990 | 6.1 | 5.6 | 371,930 |
| 1991 | 7.3 | 6.8 | 432,444 |
| 1992 | 7.9 | 7.5 | 473,748 |
| 1993 | 7.4 | 6.9 | 454,785 |
| 1994 | 5.8 | 6.1 | 356,065 |
| 1995 | 5.2 | 5.6 | 321,514 |
| 1996 | 5.3 | 5.4 | 330,937 |
| 1997 | 4.8 | 4.9 | 301,777 |
| 1998 | 4.4 | 4.5 | 283,850 |
| 1999 | 4.4 | 4.2 | 284,597 |
| 2000 | 4.3 | 4.0 | 288,369 |
| 2001 | 5.3 | 4.7 | 351,000 |
| 2002 | 6.5 | 5.8 | 415,901 |
| 2003 | 6.8 | 6.0 | 425,386 |
| 2004 | 6.2 | 5.5 | 392,977 |
| 2005 | 5.7 | 5.1 | 366,082 |
| 2006 | 4.5 | 4.6 | 297,770 |
| 2007 | 5.0 | 4.6 | 337,789 |
| 2008 | 6.3 | 5.8 | 430,763 |
| 2009 | 10.2 | 9.3 | 673,081 |
| 2010 | 10.4 | 9.6 | 694,231 |
| 2011 | 9.7 | 8.9 | 641,744 |
| 2012 | 9.0 | 8.1 | 594,235 |
| 2013 | 9.0 | 7.4 | 595,392 |
| 2014 | 7.1 | 6.2 | 467,313 |
| 2015 | 6.0 | 5.3 | 391,863 |
| 2016 | 5.8 | 4.9 | 386,366 |
| 2017 | 4.9 | 4.4 | 324,358 |
| 2018 | 4.3 | 3.9 | 286,572 |
| 2019 | 4.0 | 3.7 | 260,782 |
| 2020 | 9.5 | 8.1 | 590,812 |
| 2021 | 6.1 | 5.3 | 385,984 |
| 2022 | 4.6 | 3.6 | 295,787 |
Contact [email protected] for any questions or corrections.