
In an era of economic uncertainty, the U.S. job market remains resilient. After falling to 3.7% in November 2023, the national unemployment rate has been below 4% for 22 consecutive months, the longest streak in over 50 years.
Of course, if history is any guide, much of the economy is subject to boom and bust cycles — and the job market is no exception. Since the mid-1970s, the average annual unemployment rate in the U.S. has fluctuated between 3.6% and nearly 10%, according to the Bureau of Labor Statistics.
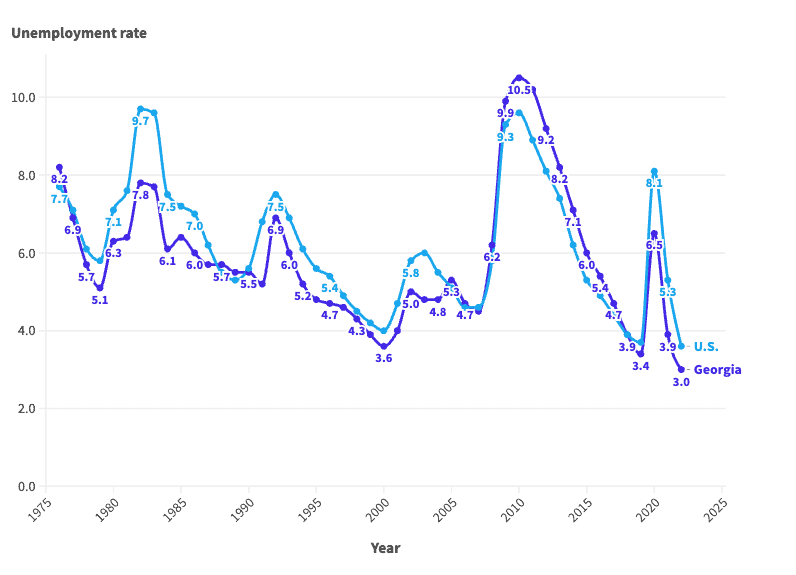
These same cyclical patterns are also evident in Georgia, where the job market is supported largely by the professional and scientific and retail trade industries. The annual unemployment rate in the state was 3.0% in 2022, a multi-decade low. However, conditions for job seekers have not always been so favorable.
According to historical BLS data going back to 1976, the annual jobless rate has been as high as 10.5% in Georgia. More than once, unemployment in the state has either matched or come close to that peak.
This is how Georgia’s job market has changed in each of the last 47 years.
1976: 8.2% unemployment

- Avg. unemployment rate: 8.2% (7.7% nationwide)
- Labor force participation rate: 63.8% (61.6% nationwide)
- Unemployed population in Georgia: 185,539
1977: 6.9% unemployment

- Avg. unemployment rate: 6.9% (7.1% nationwide)
- Labor force participation rate: 63.9% (62.3% nationwide)
- Unemployed population in Georgia: 161,650
1978: 5.7% unemployment

- Avg. unemployment rate: 5.7% (6.1% nationwide)
- Labor force participation rate: 64.5% (63.2% nationwide)
- Unemployed population in Georgia: 137,084
1979: 5.1% unemployment

- Avg. unemployment rate: 5.1% (5.8% nationwide)
- Labor force participation rate: 64.4% (63.7% nationwide)
- Unemployed population in Georgia: 126,263
1980: 6.3% unemployment

- Avg. unemployment rate: 6.3% (7.1% nationwide)
- Labor force participation rate: 64.6% (63.8% nationwide)
- Unemployed population in Georgia: 159,425
1981: 6.4% unemployment

- Avg. unemployment rate: 6.4% (7.6% nationwide)
- Labor force participation rate: 64.7% (63.9% nationwide)
- Unemployed population in Georgia: 167,952
1982: 7.8% unemployment

- Avg. unemployment rate: 7.8% (9.7% nationwide)
- Labor force participation rate: 65.0% (64.0% nationwide)
- Unemployed population in Georgia: 206,792
1983: 7.7% unemployment

- Avg. unemployment rate: 7.7% (9.6% nationwide)
- Labor force participation rate: 65.0% (64.0% nationwide)
- Unemployed population in Georgia: 205,403
1984: 6.1% unemployment
- Avg. unemployment rate: 6.1% (7.5% nationwide)
- Labor force participation rate: 65.4% (64.4% nationwide)
- Unemployed population in Georgia: 168,916
1985: 6.4% unemployment
- Avg. unemployment rate: 6.4% (7.2% nationwide)
- Labor force participation rate: 65.9% (64.8% nationwide)
- Unemployed population in Georgia: 182,460
1986: 6.0% unemployment
- Avg. unemployment rate: 6.0% (7.0% nationwide)
- Labor force participation rate: 66.9% (65.3% nationwide)
- Unemployed population in Georgia: 175,702
1987: 5.7% unemployment
- Avg. unemployment rate: 5.7% (6.2% nationwide)
- Labor force participation rate: 67.2% (65.6% nationwide)
- Unemployed population in Georgia: 170,082
1988: 5.7% unemployment
- Avg. unemployment rate: 5.7% (5.5% nationwide)
- Labor force participation rate: 67.9% (65.9% nationwide)
- Unemployed population in Georgia: 176,634
1989: 5.5% unemployment
- Avg. unemployment rate: 5.5% (5.3% nationwide)
- Labor force participation rate: 68.3% (66.5% nationwide)
- Unemployed population in Georgia: 173,055
1990: 5.5% unemployment
- Avg. unemployment rate: 5.5% (5.6% nationwide)
- Labor force participation rate: 67.5% (66.5% nationwide)
- Unemployed population in Georgia: 176,059
1991: 5.2% unemployment
- Avg. unemployment rate: 5.2% (6.8% nationwide)
- Labor force participation rate: 66.6% (66.2% nationwide)
- Unemployed population in Georgia: 174,988
1992: 6.9% unemployment
- Avg. unemployment rate: 6.9% (7.5% nationwide)
- Labor force participation rate: 67.3% (66.4% nationwide)
- Unemployed population in Georgia: 226,078
1993: 6.0% unemployment
- Avg. unemployment rate: 6.0% (6.9% nationwide)
- Labor force participation rate: 67.3% (66.3% nationwide)
- Unemployed population in Georgia: 200,214
1994: 5.2% unemployment
- Avg. unemployment rate: 5.2% (6.1% nationwide)
- Labor force participation rate: 67.6% (66.6% nationwide)
- Unemployed population in Georgia: 182,710
1995: 4.8% unemployment
- Avg. unemployment rate: 4.8% (5.6% nationwide)
- Labor force participation rate: 67.6% (66.6% nationwide)
- Unemployed population in Georgia: 175,276
1996: 4.7% unemployment
- Avg. unemployment rate: 4.7% (5.4% nationwide)
- Labor force participation rate: 68.1% (66.8% nationwide)
- Unemployed population in Georgia: 175,155
1997: 4.6% unemployment
- Avg. unemployment rate: 4.6% (4.9% nationwide)
- Labor force participation rate: 68.9% (67.1% nationwide)
- Unemployed population in Georgia: 176,040
1998: 4.3% unemployment
- Avg. unemployment rate: 4.3% (4.5% nationwide)
- Labor force participation rate: 69.2% (67.1% nationwide)
- Unemployed population in Georgia: 169,566
1999: 3.9% unemployment
- Avg. unemployment rate: 3.9% (4.2% nationwide)
- Labor force participation rate: 69.1% (67.1% nationwide)
- Unemployed population in Georgia: 157,421
2000: 3.6% unemployment
- Avg. unemployment rate: 3.6% (4.0% nationwide)
- Labor force participation rate: 69.0% (67.1% nationwide)
- Unemployed population in Georgia: 147,329
2001: 4.0% unemployment
- Avg. unemployment rate: 4.0% (4.7% nationwide)
- Labor force participation rate: 68.4% (66.8% nationwide)
- Unemployed population in Georgia: 174,373
2002: 5.0% unemployment
- Avg. unemployment rate: 5.0% (5.8% nationwide)
- Labor force participation rate: 68.4% (66.6% nationwide)
- Unemployed population in Georgia: 229,990
2003: 4.8% unemployment
- Avg. unemployment rate: 4.8% (6.0% nationwide)
- Labor force participation rate: 68.3% (66.2% nationwide)
- Unemployed population in Georgia: 227,279
2004: 4.8% unemployment
- Avg. unemployment rate: 4.8% (5.5% nationwide)
- Labor force participation rate: 67.8% (66.0% nationwide)
- Unemployed population in Georgia: 228,479
2005: 5.3% unemployment
- Avg. unemployment rate: 5.3% (5.1% nationwide)
- Labor force participation rate: 68.1% (66.0% nationwide)
- Unemployed population in Georgia: 261,895
2006: 4.7% unemployment
- Avg. unemployment rate: 4.7% (4.6% nationwide)
- Labor force participation rate: 68.2% (66.2% nationwide)
- Unemployed population in Georgia: 239,043
2007: 4.5% unemployment
- Avg. unemployment rate: 4.5% (4.6% nationwide)
- Labor force participation rate: 68.0% (66.0% nationwide)
- Unemployed population in Georgia: 236,962
2008: 6.2% unemployment
- Avg. unemployment rate: 6.2% (5.8% nationwide)
- Labor force participation rate: 67.6% (66.0% nationwide)
- Unemployed population in Georgia: 328,435
2009: 9.9% unemployment
- Avg. unemployment rate: 9.9% (9.3% nationwide)
- Labor force participation rate: 65.6% (65.4% nationwide)
- Unemployed population in Georgia: 499,320
2010: 10.5% unemployment
- Avg. unemployment rate: 10.5% (9.6% nationwide)
- Labor force participation rate: 64.3% (64.7% nationwide)
- Unemployed population in Georgia: 502,515
2011: 10.2% unemployment
- Avg. unemployment rate: 10.2% (8.9% nationwide)
- Labor force participation rate: 64.2% (64.1% nationwide)
- Unemployed population in Georgia: 480,448
2012: 9.2% unemployment
- Avg. unemployment rate: 9.2% (8.1% nationwide)
- Labor force participation rate: 63.8% (63.7% nationwide)
- Unemployed population in Georgia: 431,249
2013: 8.2% unemployment
- Avg. unemployment rate: 8.2% (7.4% nationwide)
- Labor force participation rate: 62.8% (63.2% nationwide)
- Unemployed population in Georgia: 386,754
2014: 7.1% unemployment
- Avg. unemployment rate: 7.1% (6.2% nationwide)
- Labor force participation rate: 62.0% (62.9% nationwide)
- Unemployed population in Georgia: 338,792
2015: 6.0% unemployment
- Avg. unemployment rate: 6.0% (5.3% nationwide)
- Labor force participation rate: 61.0% (62.7% nationwide)
- Unemployed population in Georgia: 287,573
2016: 5.4% unemployment
- Avg. unemployment rate: 5.4% (4.9% nationwide)
- Labor force participation rate: 62.4% (62.8% nationwide)
- Unemployed population in Georgia: 268,074
2017: 4.7% unemployment
- Avg. unemployment rate: 4.7% (4.4% nationwide)
- Labor force participation rate: 63.9% (62.9% nationwide)
- Unemployed population in Georgia: 243,076
2018: 3.9% unemployment
- Avg. unemployment rate: 3.9% (3.9% nationwide)
- Labor force participation rate: 63.3% (62.9% nationwide)
- Unemployed population in Georgia: 204,434
2019: 3.4% unemployment
- Avg. unemployment rate: 3.4% (3.7% nationwide)
- Labor force participation rate: 62.9% (63.1% nationwide)
- Unemployed population in Georgia: 184,537
2020: 6.5% unemployment
- Avg. unemployment rate: 6.5% (8.1% nationwide)
- Labor force participation rate: 61.3% (61.7% nationwide)
- Unemployed population in Georgia: 328,962
2021: 3.9% unemployment
- Avg. unemployment rate: 3.9% (5.3% nationwide)
- Labor force participation rate: 61.7% (61.7% nationwide)
- Unemployed population in Georgia: 201,559
2022: 3.0% unemployment
- Avg. unemployment rate: 3.0% (3.6% nationwide)
- Labor force participation rate: 61.5% (62.2% nationwide)
- Unemployed population in Georgia: 159,182
 Unemployment in Georgia by year
| Year | Georgia unemployment rate | U.S. unemployment rate | Unemployed population in Georgia |
|---|---|---|---|
| 1976 | 8.2 | 7.7 | 185,539 |
| 1977 | 6.9 | 7.1 | 161,650 |
| 1978 | 5.7 | 6.1 | 137,084 |
| 1979 | 5.1 | 5.8 | 126,263 |
| 1980 | 6.3 | 7.1 | 159,425 |
| 1981 | 6.4 | 7.6 | 167,952 |
| 1982 | 7.8 | 9.7 | 206,792 |
| 1983 | 7.7 | 9.6 | 205,403 |
| 1984 | 6.1 | 7.5 | 168,916 |
| 1985 | 6.4 | 7.2 | 182,460 |
| 1986 | 6.0 | 7.0 | 175,702 |
| 1987 | 5.7 | 6.2 | 170,082 |
| 1988 | 5.7 | 5.5 | 176,634 |
| 1989 | 5.5 | 5.3 | 173,055 |
| 1990 | 5.5 | 5.6 | 176,059 |
| 1991 | 5.2 | 6.8 | 174,988 |
| 1992 | 6.9 | 7.5 | 226,078 |
| 1993 | 6.0 | 6.9 | 200,214 |
| 1994 | 5.2 | 6.1 | 182,710 |
| 1995 | 4.8 | 5.6 | 175,276 |
| 1996 | 4.7 | 5.4 | 175,155 |
| 1997 | 4.6 | 4.9 | 176,040 |
| 1998 | 4.3 | 4.5 | 169,566 |
| 1999 | 3.9 | 4.2 | 157,421 |
| 2000 | 3.6 | 4.0 | 147,329 |
| 2001 | 4.0 | 4.7 | 174,373 |
| 2002 | 5.0 | 5.8 | 229,990 |
| 2003 | 4.8 | 6.0 | 227,279 |
| 2004 | 4.8 | 5.5 | 228,479 |
| 2005 | 5.3 | 5.1 | 261,895 |
| 2006 | 4.7 | 4.6 | 239,043 |
| 2007 | 4.5 | 4.6 | 236,962 |
| 2008 | 6.2 | 5.8 | 328,435 |
| 2009 | 9.9 | 9.3 | 499,320 |
| 2010 | 10.5 | 9.6 | 502,515 |
| 2011 | 10.2 | 8.9 | 480,448 |
| 2012 | 9.2 | 8.1 | 431,249 |
| 2013 | 8.2 | 7.4 | 386,754 |
| 2014 | 7.1 | 6.2 | 338,792 |
| 2015 | 6.0 | 5.3 | 287,573 |
| 2016 | 5.4 | 4.9 | 268,074 |
| 2017 | 4.7 | 4.4 | 243,076 |
| 2018 | 3.9 | 3.9 | 204,434 |
| 2019 | 3.4 | 3.7 | 184,537 |
| 2020 | 6.5 | 8.1 | 328,962 |
| 2021 | 3.9 | 5.3 | 201,559 |
| 2022 | 3.0 | 3.6 | 159,182 |
Contact [email protected] for any questions or corrections.