Between 1960 and 2020, the number of crimes reported to U.S. law enforcement agencies reached a peak of 14.9 million in 1991. The number fell to 7.72 million in 2020, slightly lower than the number of reported crimes in 1964.
Reported crimes rose from a rate of 1,887.2 per 100,000 Americans in 1960 to a peak of 5,950 in 1980. From the most recent peak of 5,898.4 in 1991, the crime rate dropped to 2,250 per 100,000 in 2020. According to the Council on Criminal Justice’s September Footprint of the American justice system, “The overall crime rate rose 215% to peak in 1980, before falling 58% from 1980 to 2019 and 60% from 1980 to 2020.”
Counting crimes
 Police taping off a crime scene.
The Federal Bureau of Investigation gathers and categorizes crime data as “serious” (Part I) or “less serious” (Part II). Serious crime is further divided into violent crimes (homicide, rape, robbery, and aggravated assault) or property crimes (burglary, larceny, motor vehicle theft, arson). Part II crimes include simple assault, fraud, drug offenses, and vandalism, among others.
In 2022, the FBI collected 11 million reports in its Uniform Crime Reporting (UCR) program. Some were submitted by law enforcement agencies under the new National Incident-Based Reporting System (NIBRS), and some under the previous Summary Reporting System (SRS). In its announcement of 2022 crime statistics, the FBI noted that of 18,884 agencies eligible to report crime data to the UCR program, 15,724 did so.
The FBI’s Crime Data Explorer (CDE) provides tools to research the estimated 1,232,428 violent crimes that were committed in 2022. According to the FBI, the violent crime rate in the U.S. dropped from a rate of 377.6 per 100,000 Americans to 369.8 per 100,000.
An estimated 6,513,829 property crimes were committed in 2022. That yields a rate of 1,954.4 property crimes per 100,000 inhabitants, up from the 2021 rate of 1,832.3 per 100,000.
National crime rates
 Ambulance in Brooklyn, New York.
The switch to a new NIBRS reporting system left large holes in FBI 2021 crime data. According to The Marshall Project, a nonpartisan, nonprofit news organization, data from more than 6,000 agencies was missing from 2021 FBI data. To make the 2022 report more reliable, the FBI allowed law enforcement agencies to use the old SRS system to report data.
In its 2022 Crime in the Nation report, the FBI estimated that national violent crime decreased by 1.7% between 2021 and 2022. Ignoring the scanty data from 2021, The Marshall Project calculated that violent crime in 2022 fell by 4% nationally compared to 2020.
Seven of the nation’s largest police departments, including New York City and Los Angeles, did not file crime reports in either 2021 or 2022. Neither did New York’s Suffolk County or Nassau County. The police departments of San Jose, California, and Phoenix, Arizona, and the Hillsborough County (Tampa, Florida) Sheriff’s Office have all failed to file data for either of the past two years. Florida’s Miami-Dade County did not report 2021 data but did file a 2022 report.
Here are the FBI’s 2022 estimates for each of the four violent crimes compared to estimates for 2021:
- Murder and non-negligent manslaughter: down 6.1% year
- Rape: down 5.4%
- Aggravated assault: down 1.1%
- Robbery: up 1.3%
Murder in the big cities

The Brennan Center for Justice, an independent, nonpartisan law and policy organization, also ignores 2021 data when comparing murder rates in 13 of the country’s biggest cities. The number of U.S. murders per 100,000 people in 2022 was 6.3. That’s a decline of 6.7% compared to 2020.
| Murders per 100,000 (2022) | Change in murder rate (2020–22) | |
|---|---|---|
| National | 6.3 | -6.7% |
| New York | 5.3 | -5.7% |
| Los Angeles | 10.2 | 15.8% |
| Chicago | 22.8 | -20.4% |
| Houston | 19 | 11.6% |
| Philadelphia | 33 | 7.3% |
| San Francisco | 7.2 | 32.1% |
| Baltimore | 50.3 | -11.8% |
| Washington, D.C. | 29.3 | 5.6% |
| Atlanta | 33.9 | 7.7% |
| Detroit | 49.1 | -1.2% |
| New Orleans | 71.9 | 40.8% |
| Memphis | 43 | -3.0% |
| Seattle | 7.4 | 9.8% |
Three cities saw double-digit increases in murder rates between 2020 and 2022: New Orleans (up 40.8%), San Francisco (up 32.1%), Los Angeles (up 15.8%), and Houston (up 11.6%).
Crime rates by region
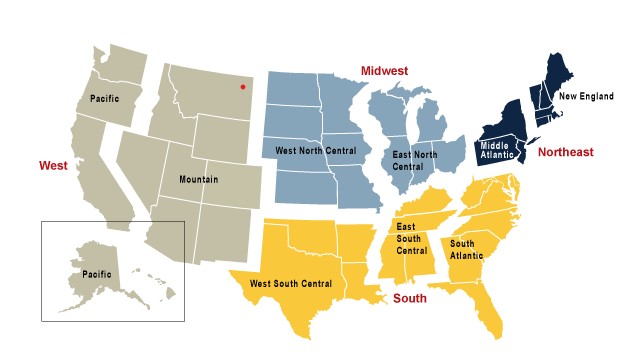
The FBI divides the country into four regions: the Northeast, the South, the Midwest, and the West. The following map shows the four FBI regions and how those are further divided for statistical purposes.
The numbers and rates in the following chart compare 2020 and 2022 data, as reported by the Brennan Center.
| Murders per 100,000 (2022) | Change in murder rate (2020–2022) | Violent crimes per 100,000 (2022) | Change in violent crime rate (2020–2022) | Property crimes per 100,000 (2022) | Change in property crime rate (2020–2022) | |
|---|---|---|---|---|---|---|
| National | 6.3 | −6.7% | 369.8 | −4.0% | 1954.4 | −0.5% |
| Northeast | 4.5 | −4.4% | 305 | −1.1% | 1484.8 | 8.30% |
| Midwest | 7 | −12.0% | 340.3 | −12.3% | 1728.9 | −3.2% |
| South | 8 | −3.2% | 390.5 | −9.5% | 1974.9 | −6.3% |
| West | 5.2 | 8.50% | 454.9 | 8.60% | 2458 | 7.50% |
There are more murders per 100,000 in the South than in any other region, but more violent crimes in the West than anywhere else. Crime rates are down in every region except the West, where murders increased by 8.5%, violent crime increased by 8.6%, and property crimes increased by 7.5%.
Violent crime by region

Unlike the Brennan and Marshall Centers that ignore 2021 data, the FBI uses it when possible. The following table excludes data from the Northeast region because “estimates are missing due to nonparticipation by principal agencies.” Also, the “revised rape” data is based on a 2013 change that broadened the definition of the crime.
Violent crime is up 0.9% in the West, down 9.6% in the Midwest, and down 0.8% in the South. Of the three reporting regions, the South has more than double the number of murders (10,100) of either the Midwest or the West.
| Region | Offense | Estimate | 2022 vs 2021 Change |
|---|---|---|---|
| East | No data available | ||
| Midwest | Violent Crime | 241,800 | -9.6% |
| Murder and Non-negligent Manslaughter | 4,400 | -7.7% | |
| Revised Rape | 33,900 | -6.2% | |
| Rape | 26,400 | -5.3% | |
| Sodomy | 5,900 | -9.8% | |
| Sexual Assault with an Object | 1,500 | -6.0% | |
| Aggravated Assault | 166,400 | -11.0% | |
| Robbery | 37,000 | -6.8% | |
| South | Violent Crime | 538,400 | -0.8% |
| Murder and Non-negligent Manslaughter | 10,100 | -4.3% | |
| Revised Rape | 53,300 | -8.6% | |
| Rape | 37,800 | -8.8% | |
| Sodomy | 10,500 | -8.3% | |
| Sexual Assault with an Object | 5,000 | -8.2% | |
| Aggravated Assault | 397,100 | -1.0% | |
| Robbery | 77,800 | 7.4% | |
| West | Violent Crime | 373,000 | 0.9% |
| Murder and Non-negligent Manslaughter | 4,500 | -7.7% | |
| Revised Rape | 36,300 | -13.8% | |
| Rape | 26,100 | -15.5% | |
| Sodomy | 6,400 | -9.3% | |
| Sexual Assault with an Object | 3,900 | -9.5% | |
| Aggravated Assault | 259,900 | -0.25% | |
| Robbery | ** | ** | |
|
** Data was suppressed based on NIBRS Estimation suppression rules.
|
|||
Contact [email protected] for any questions or corrections.