
In an era of economic uncertainty, the U.S. job market remains resilient. After falling to 3.7% in November 2023, the national unemployment rate has been below 4% for 22 consecutive months, the longest streak in over 50 years.
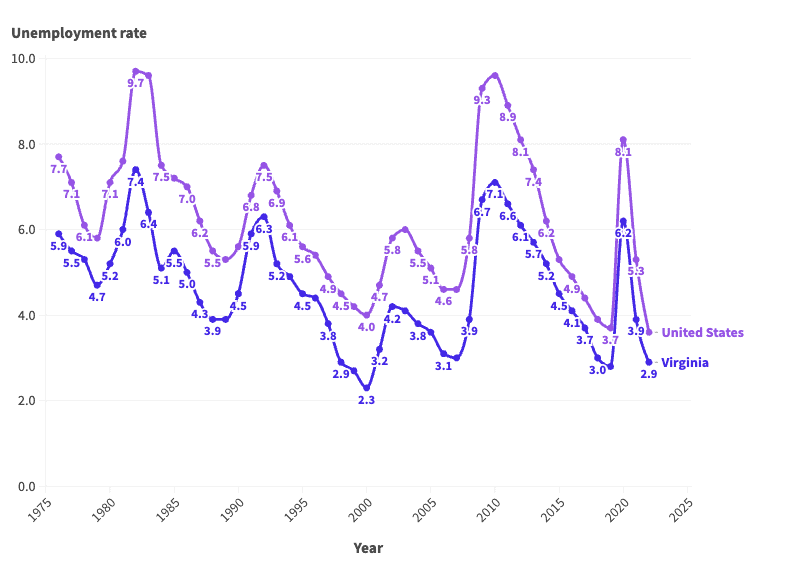
Of course, if history is any guide, much of the economy is subject to boom and bust cycles — and the job market is no exception. Since the mid-1970s, the average annual unemployment rate in the U.S. has fluctuated between 3.6% and nearly 10%, according to the Bureau of Labor Statistics.
These same cyclical patterns are also evident in Virginia, where the job market is supported largely by the professional and scientific and retail trade industries. The annual unemployment rate in the state was 2.9% in 2022, only slightly higher than the state’s lowest on record annual jobless rate of 2.3%. However, conditions for job seekers have not always been so favorable.
According to historical BLS data going back to 1976, the annual jobless rate has been as high as 7.4% in Virginia. More than once, unemployment in the state has either matched or come close to that peak.
This is how Virginia’s job market has changed in each of the last 47 years.
1976: 5.9% unemployment

- Avg. unemployment rate: 5.9% (7.7% nationwide)
- Labor force participation rate: 65.4% (61.6% nationwide)
- Unemployed population in Virginia: 138,261
1977: 5.5% unemployment

- Avg. unemployment rate: 5.5% (7.1% nationwide)
- Labor force participation rate: 65.5% (62.3% nationwide)
- Unemployed population in Virginia: 130,967
1978: 5.3% unemployment

- Avg. unemployment rate: 5.3% (6.1% nationwide)
- Labor force participation rate: 66.2% (63.2% nationwide)
- Unemployed population in Virginia: 131,093
1979: 4.7% unemployment

- Avg. unemployment rate: 4.7% (5.8% nationwide)
- Labor force participation rate: 66.2% (63.7% nationwide)
- Unemployed population in Virginia: 119,908
1980: 5.2% unemployment

- Avg. unemployment rate: 5.2% (7.1% nationwide)
- Labor force participation rate: 65.9% (63.8% nationwide)
- Unemployed population in Virginia: 130,561
1981: 6.0% unemployment

- Avg. unemployment rate: 6.0% (7.6% nationwide)
- Labor force participation rate: 66.0% (63.9% nationwide)
- Unemployed population in Virginia: 155,509
1982: 7.4% unemployment

- Avg. unemployment rate: 7.4% (9.7% nationwide)
- Labor force participation rate: 66.4% (64.0% nationwide)
- Unemployed population in Virginia: 198,076
1983: 6.4% unemployment

- Avg. unemployment rate: 6.4% (9.6% nationwide)
- Labor force participation rate: 66.8% (64.0% nationwide)
- Unemployed population in Virginia: 172,599
1984: 5.1% unemployment
- Avg. unemployment rate: 5.1% (7.5% nationwide)
- Labor force participation rate: 67.7% (64.4% nationwide)
- Unemployed population in Virginia: 142,557
1985: 5.5% unemployment
- Avg. unemployment rate: 5.5% (7.2% nationwide)
- Labor force participation rate: 68.0% (64.8% nationwide)
- Unemployed population in Virginia: 155,189
1986: 5.0% unemployment
- Avg. unemployment rate: 5.0% (7.0% nationwide)
- Labor force participation rate: 67.9% (65.3% nationwide)
- Unemployed population in Virginia: 144,482
1987: 4.3% unemployment
- Avg. unemployment rate: 4.3% (6.2% nationwide)
- Labor force participation rate: 68.3% (65.6% nationwide)
- Unemployed population in Virginia: 125,312
1988: 3.9% unemployment
- Avg. unemployment rate: 3.9% (5.5% nationwide)
- Labor force participation rate: 68.8% (65.9% nationwide)
- Unemployed population in Virginia: 120,274
1989: 3.9% unemployment
- Avg. unemployment rate: 3.9% (5.3% nationwide)
- Labor force participation rate: 69.2% (66.5% nationwide)
- Unemployed population in Virginia: 122,211
1990: 4.5% unemployment
- Avg. unemployment rate: 4.5% (5.6% nationwide)
- Labor force participation rate: 69.5% (66.5% nationwide)
- Unemployed population in Virginia: 142,633
1991: 5.9% unemployment
- Avg. unemployment rate: 5.9% (6.8% nationwide)
- Labor force participation rate: 70.4% (66.2% nationwide)
- Unemployed population in Virginia: 192,112
1992: 6.3% unemployment
- Avg. unemployment rate: 6.3% (7.5% nationwide)
- Labor force participation rate: 70.6% (66.4% nationwide)
- Unemployed population in Virginia: 208,791
1993: 5.2% unemployment
- Avg. unemployment rate: 5.2% (6.9% nationwide)
- Labor force participation rate: 69.4% (66.3% nationwide)
- Unemployed population in Virginia: 174,372
1994: 4.9% unemployment
- Avg. unemployment rate: 4.9% (6.1% nationwide)
- Labor force participation rate: 69.4% (66.6% nationwide)
- Unemployed population in Virginia: 164,850
1995: 4.5% unemployment
- Avg. unemployment rate: 4.5% (5.6% nationwide)
- Labor force participation rate: 69.2% (66.6% nationwide)
- Unemployed population in Virginia: 153,290
1996: 4.4% unemployment
- Avg. unemployment rate: 4.4% (5.4% nationwide)
- Labor force participation rate: 68.1% (66.8% nationwide)
- Unemployed population in Virginia: 149,190
1997: 3.8% unemployment
- Avg. unemployment rate: 3.8% (4.9% nationwide)
- Labor force participation rate: 67.7% (67.1% nationwide)
- Unemployed population in Virginia: 128,363
1998: 2.9% unemployment
- Avg. unemployment rate: 2.9% (4.5% nationwide)
- Labor force participation rate: 67.7% (67.1% nationwide)
- Unemployed population in Virginia: 97,456
1999: 2.7% unemployment
- Avg. unemployment rate: 2.7% (4.2% nationwide)
- Labor force participation rate: 67.8% (67.1% nationwide)
- Unemployed population in Virginia: 95,927
2000: 2.3% unemployment
- Avg. unemployment rate: 2.3% (4.0% nationwide)
- Labor force participation rate: 68.0% (67.1% nationwide)
- Unemployed population in Virginia: 81,909
2001: 3.2% unemployment
- Avg. unemployment rate: 3.2% (4.7% nationwide)
- Labor force participation rate: 68.4% (66.8% nationwide)
- Unemployed population in Virginia: 121,438
2002: 4.2% unemployment
- Avg. unemployment rate: 4.2% (5.8% nationwide)
- Labor force participation rate: 68.6% (66.6% nationwide)
- Unemployed population in Virginia: 162,969
2003: 4.1% unemployment
- Avg. unemployment rate: 4.1% (6.0% nationwide)
- Labor force participation rate: 68.4% (66.2% nationwide)
- Unemployed population in Virginia: 163,214
2004: 3.8% unemployment
- Avg. unemployment rate: 3.8% (5.5% nationwide)
- Labor force participation rate: 67.9% (66.0% nationwide)
- Unemployed population in Virginia: 156,108
2005: 3.6% unemployment
- Avg. unemployment rate: 3.6% (5.1% nationwide)
- Labor force participation rate: 68.5% (66.0% nationwide)
- Unemployed population in Virginia: 149,962
2006: 3.1% unemployment
- Avg. unemployment rate: 3.1% (4.6% nationwide)
- Labor force participation rate: 68.7% (66.2% nationwide)
- Unemployed population in Virginia: 132,218
2007: 3.0% unemployment
- Avg. unemployment rate: 3.0% (4.6% nationwide)
- Labor force participation rate: 69.0% (66.0% nationwide)
- Unemployed population in Virginia: 132,788
2008: 3.9% unemployment
- Avg. unemployment rate: 3.9% (5.8% nationwide)
- Labor force participation rate: 69.7% (66.0% nationwide)
- Unemployed population in Virginia: 175,866
2009: 6.7% unemployment
- Avg. unemployment rate: 6.7% (9.3% nationwide)
- Labor force participation rate: 68.9% (65.4% nationwide)
- Unemployed population in Virginia: 282,835
2010: 7.1% unemployment
- Avg. unemployment rate: 7.1% (9.6% nationwide)
- Labor force participation rate: 67.8% (64.7% nationwide)
- Unemployed population in Virginia: 304,827
2011: 6.6% unemployment
- Avg. unemployment rate: 6.6% (8.9% nationwide)
- Labor force participation rate: 67.4% (64.1% nationwide)
- Unemployed population in Virginia: 276,176
2012: 6.1% unemployment
- Avg. unemployment rate: 6.1% (8.1% nationwide)
- Labor force participation rate: 66.7% (63.7% nationwide)
- Unemployed population in Virginia: 250,378
2013: 5.7% unemployment
- Avg. unemployment rate: 5.7% (7.4% nationwide)
- Labor force participation rate: 66.4% (63.2% nationwide)
- Unemployed population in Virginia: 236,320
2014: 5.2% unemployment
- Avg. unemployment rate: 5.2% (6.2% nationwide)
- Labor force participation rate: 66.1% (62.9% nationwide)
- Unemployed population in Virginia: 217,948
2015: 4.5% unemployment
- Avg. unemployment rate: 4.5% (5.3% nationwide)
- Labor force participation rate: 65.2% (62.7% nationwide)
- Unemployed population in Virginia: 185,900
2016: 4.1% unemployment
- Avg. unemployment rate: 4.1% (4.9% nationwide)
- Labor force participation rate: 65.0% (62.8% nationwide)
- Unemployed population in Virginia: 169,526
2017: 3.7% unemployment
- Avg. unemployment rate: 3.7% (4.4% nationwide)
- Labor force participation rate: 65.7% (62.9% nationwide)
- Unemployed population in Virginia: 159,687
2018: 3.0% unemployment
- Avg. unemployment rate: 3.0% (3.9% nationwide)
- Labor force participation rate: 65.3% (62.9% nationwide)
- Unemployed population in Virginia: 130,779
2019: 2.8% unemployment
- Avg. unemployment rate: 2.8% (3.7% nationwide)
- Labor force participation rate: 65.7% (63.1% nationwide)
- Unemployed population in Virginia: 122,471
2020: 6.2% unemployment
- Avg. unemployment rate: 6.2% (8.1% nationwide)
- Labor force participation rate: 64.2% (61.7% nationwide)
- Unemployed population in Virginia: 280,533
2021: 3.9% unemployment
- Avg. unemployment rate: 3.9% (5.3% nationwide)
- Labor force participation rate: 63.7% (61.7% nationwide)
- Unemployed population in Virginia: 168,742
2022: 2.9% unemployment
- Avg. unemployment rate: 2.9% (3.6% nationwide)
- Labor force participation rate: 64.9% (62.2% nationwide)
- Unemployed population in Virginia: 127,053
| Year | Virginia unemployment rate | U.S. unemployment rate | Unemployed population in Virginia |
|---|---|---|---|
| 1976 | 5.9 | 7.7 | 138,261 |
| 1977 | 5.5 | 7.1 | 130,967 |
| 1978 | 5.3 | 6.1 | 131,093 |
| 1979 | 4.7 | 5.8 | 119,908 |
| 1980 | 5.2 | 7.1 | 130,561 |
| 1981 | 6.0 | 7.6 | 155,509 |
| 1982 | 7.4 | 9.7 | 198,076 |
| 1983 | 6.4 | 9.6 | 172,599 |
| 1984 | 5.1 | 7.5 | 142,557 |
| 1985 | 5.5 | 7.2 | 155,189 |
| 1986 | 5.0 | 7.0 | 144,482 |
| 1987 | 4.3 | 6.2 | 125,312 |
| 1988 | 3.9 | 5.5 | 120,274 |
| 1989 | 3.9 | 5.3 | 122,211 |
| 1990 | 4.5 | 5.6 | 142,633 |
| 1991 | 5.9 | 6.8 | 192,112 |
| 1992 | 6.3 | 7.5 | 208,791 |
| 1993 | 5.2 | 6.9 | 174,372 |
| 1994 | 4.9 | 6.1 | 164,850 |
| 1995 | 4.5 | 5.6 | 153,290 |
| 1996 | 4.4 | 5.4 | 149,190 |
| 1997 | 3.8 | 4.9 | 128,363 |
| 1998 | 2.9 | 4.5 | 97,456 |
| 1999 | 2.7 | 4.2 | 95,927 |
| 2000 | 2.3 | 4.0 | 81,909 |
| 2001 | 3.2 | 4.7 | 121,438 |
| 2002 | 4.2 | 5.8 | 162,969 |
| 2003 | 4.1 | 6.0 | 163,214 |
| 2004 | 3.8 | 5.5 | 156,108 |
| 2005 | 3.6 | 5.1 | 149,962 |
| 2006 | 3.1 | 4.6 | 132,218 |
| 2007 | 3.0 | 4.6 | 132,788 |
| 2008 | 3.9 | 5.8 | 175,866 |
| 2009 | 6.7 | 9.3 | 282,835 |
| 2010 | 7.1 | 9.6 | 304,827 |
| 2011 | 6.6 | 8.9 | 276,176 |
| 2012 | 6.1 | 8.1 | 250,378 |
| 2013 | 5.7 | 7.4 | 236,320 |
| 2014 | 5.2 | 6.2 | 217,948 |
| 2015 | 4.5 | 5.3 | 185,900 |
| 2016 | 4.1 | 4.9 | 169,526 |
| 2017 | 3.7 | 4.4 | 159,687 |
| 2018 | 3.0 | 3.9 | 130,779 |
| 2019 | 2.8 | 3.7 | 122,471 |
| 2020 | 6.2 | 8.1 | 280,533 |
| 2021 | 3.9 | 5.3 | 168,742 |
| 2022 | 2.9 | 3.6 | 127,053 |
Contact [email protected] for any questions or corrections.