The United States is, in many ways, the center of gravity of the global economy. The U.S. dollar has been the world’s leading reserve currency since the end of World War II, and American gross domestic product accounts for over a quarter of economic activity worldwide. Despite these advantages, serious financial hardship is widespread among much of the U.S. population.
The U.S. Department of Health and Human Services sets the poverty line at an annual income of $14,580 for individuals and $30,000 for a family of four, with slightly higher thresholds in Alaska and Hawaii. Based on the latest estimates from the U.S. Census Bureau’s American Community Survey, more than 40.5 million Americans are living on such low incomes — or about 12.5% of the population.
Many of the root causes of poverty are related to broad social and economic conditions, and partially as a result, poverty in the U.S. is often geographically concentrated. (Here is a look at the fastest shrinking local economy in every state.)
Using five-year estimates from the Census’ 2022 ACS, 24/7 Wall St. identified the town with the highest poverty rate in every state. We considered all cities, towns, villages, and unincorporated communities with populations between 1,000 and 25,000 in our analysis.
Among the 50 towns on this list, poverty rates range from 23.3% to over 90% — and are anywhere between 13 to 82 percentage points higher than the poverty rate across the state.
The high poverty rates in many of these places are linked to weak job markets. In half of the towns on this list, the five-year average unemployment rate is over 10%. For those who are able to find work, many of the available jobs are not especially well paying. In most of these towns, the typical household earns less than $40,000 a year. (This is what you need to actually earn to be middle class in your state.)
Federal aid initiatives, such as the Supplemental Nutrition Assistance Program, or SNAP, are designed to reduce poverty and alleviate some of the hardships associated with it. Not surprisingly, the share of households receiving SNAP benefits exceeds the statewide recipiency rate in nearly every town on this list.
Here is the town with the highest poverty rate in every state.
Alabama: Uniontown
- Poverty rate: 53.9% (Alabama: 15.7%)
- Median household income: $24,355 (Alabama: $59,609)
- Households receiving SNAP benefits: 60.1% (Alabama: 13.3%)
- Avg. 5-yr. unemployment rate: 21.0% (Alabama: 5.1%)
- No. of towns in Alabama considered: 288
Alaska: Alakanuk

- Poverty rate: 39.3% (Alaska: 10.5%)
- Median household income: $41,875 (Alaska: $86,370)
- Households receiving SNAP benefits: 46.7% (Alaska: 10.5%)
- Avg. 5-yr. unemployment rate: 27.5% (Alaska: 6.0%)
- No. of towns in Alaska considered: 70
Arizona: Cibecue
- Poverty rate: 76.1% (Arizona: 13.1%)
- Median household income: $18,250 (Arizona: $72,581)
- Households receiving SNAP benefits: 54.1% (Arizona: 10.1%)
- Avg. 5-yr. unemployment rate: 16.3% (Arizona: 5.3%)
- No. of towns in Arizona considered: 169
Arkansas: McAlmont

- Poverty rate: 65.3% (Arkansas: 16.2%)
- Median household income: $30,517 (Arkansas: $56,335)
- Households receiving SNAP benefits: 22.9% (Arkansas: 11.0%)
- Avg. 5-yr. unemployment rate: 46.9% (Arkansas: 5.1%)
- No. of towns in Arkansas considered: 189
California: Bodfish
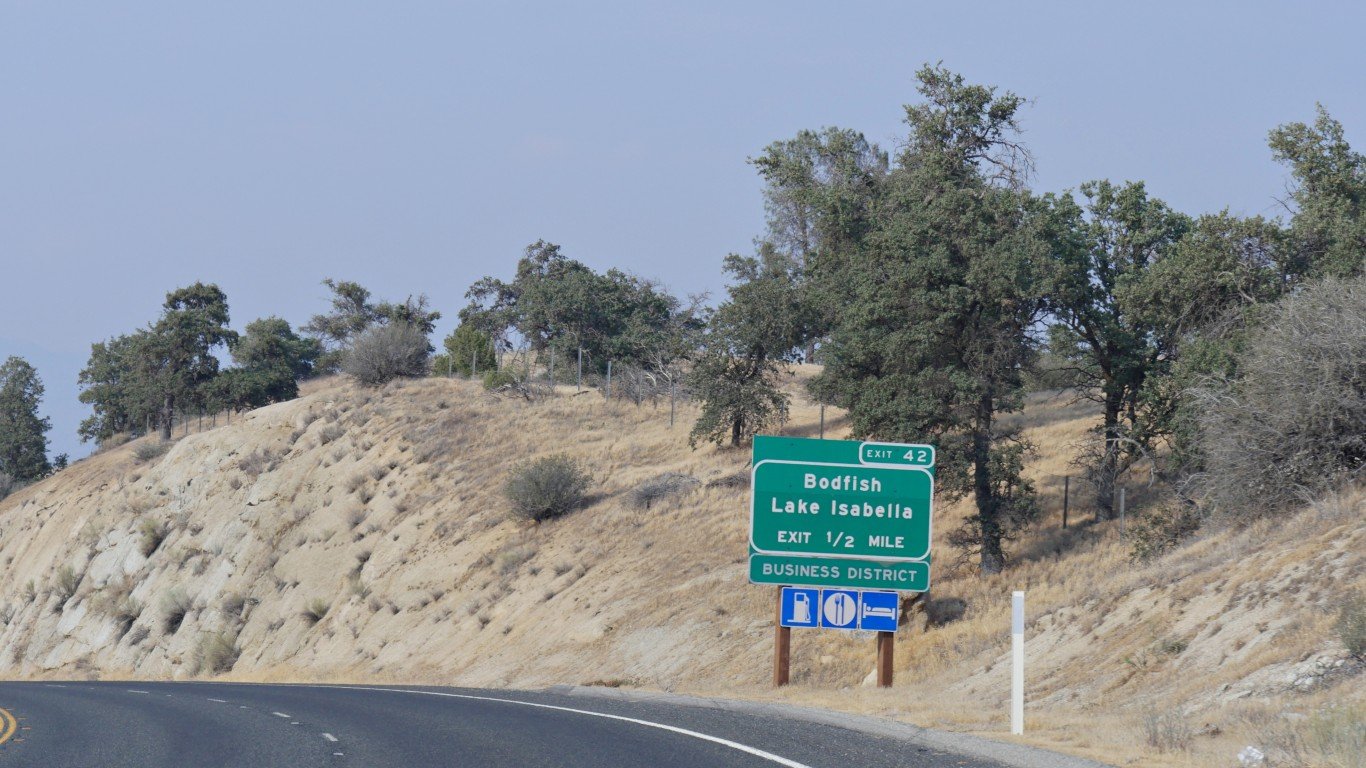
- Poverty rate: 51.2% (California: 12.1%)
- Median household income: $27,215 (California: $91,905)
- Households receiving SNAP benefits: 35.1% (California: 10.3%)
- Avg. 5-yr. unemployment rate: 21.2% (California: 6.4%)
- No. of towns in California considered: 748
Colorado: Rocky Ford

- Poverty rate: 46.1% (Colorado: 9.6%)
- Median household income: $31,418 (Colorado: $87,598)
- Households receiving SNAP benefits: 38.0% (Colorado: 7.6%)
- Avg. 5-yr. unemployment rate: 10.9% (Colorado: 4.5%)
- No. of towns in Colorado considered: 186
Connecticut: Canaan

- Poverty rate: 40.5% (Connecticut: 10.1%)
- Median household income: $31,130 (Connecticut: $90,213)
- Households receiving SNAP benefits: 26.1% (Connecticut: 11.4%)
- Avg. 5-yr. unemployment rate: 12.6% (Connecticut: 5.9%)
- No. of towns in Connecticut considered: 131
Delaware: Laurel

- Poverty rate: 39.6% (Delaware: 11.1%)
- Median household income: $42,710 (Delaware: $79,325)
- Households receiving SNAP benefits: 40.5% (Delaware: 10.7%)
- Avg. 5-yr. unemployment rate: 13.9% (Delaware: 5.4%)
- No. of towns in Delaware considered: 52
Florida: Homestead Base

- Poverty rate: 83.0% (Florida: 12.9%)
- Median household income: $N/A (Florida: $67,917)
- Households receiving SNAP benefits: 89.5% (Florida: 13.0%)
- Avg. 5-yr. unemployment rate: 48.5% (Florida: 5.0%)
- No. of towns in Florida considered: 603
Georgia: Remerton

- Poverty rate: 53.7% (Georgia: 13.5%)
- Median household income: $25,052 (Georgia: $71,355)
- Households receiving SNAP benefits: 24.2% (Georgia: 12.1%)
- Avg. 5-yr. unemployment rate: 7.3% (Georgia: 5.2%)
- No. of towns in Georgia considered: 320
Hawaii: Leilani Estates

- Poverty rate: 36.8% (Hawaii: 9.6%)
- Median household income: $23,750 (Hawaii: $94,814)
- Households receiving SNAP benefits: 25.7% (Hawaii: 10.9%)
- Avg. 5-yr. unemployment rate: 19.2% (Hawaii: 4.7%)
- No. of towns in Hawaii considered: 112
Idaho: Glenns Ferry

- Poverty rate: 37.7% (Idaho: 11.0%)
- Median household income: $36,413 (Idaho: $70,214)
- Households receiving SNAP benefits: 24.8% (Idaho: 8.3%)
- Avg. 5-yr. unemployment rate: 2.4% (Idaho: 3.7%)
- No. of towns in Idaho considered: 89
Illinois: Washington Park
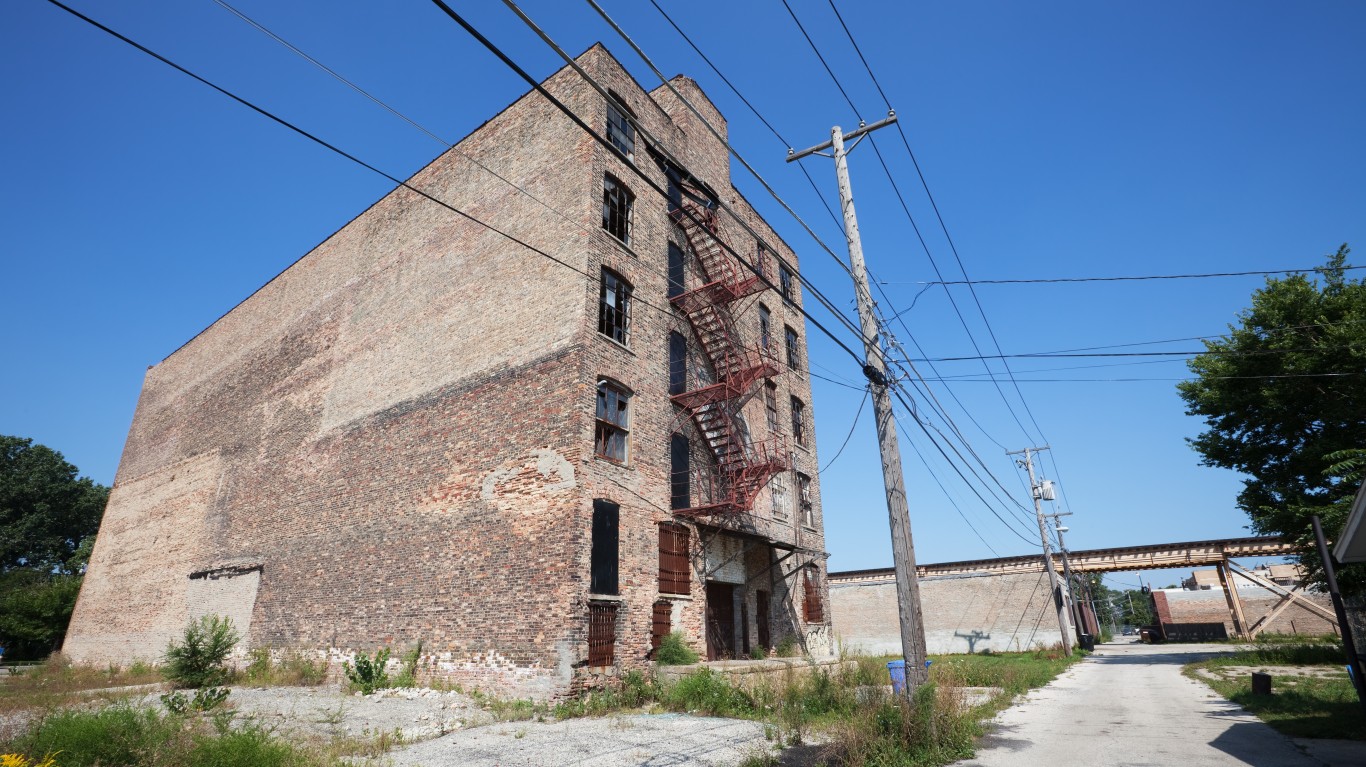
- Poverty rate: 42.2% (Illinois: 11.8%)
- Median household income: $33,036 (Illinois: $78,433)
- Households receiving SNAP benefits: 40.3% (Illinois: 13.0%)
- Avg. 5-yr. unemployment rate: 15.9% (Illinois: 5.9%)
- No. of towns in Illinois considered: 607
Indiana: English

- Poverty rate: 51.3% (Indiana: 12.3%)
- Median household income: $26,599 (Indiana: $67,173)
- Households receiving SNAP benefits: 23.8% (Indiana: 9.0%)
- Avg. 5-yr. unemployment rate: 3.0% (Indiana: 4.5%)
- No. of towns in Indiana considered: 306
Iowa: Postville

- Poverty rate: 25.7% (Iowa: 11.1%)
- Median household income: $46,522 (Iowa: $70,571)
- Households receiving SNAP benefits: 10.5% (Iowa: 9.4%)
- Avg. 5-yr. unemployment rate: 6.9% (Iowa: 3.8%)
- No. of towns in Iowa considered: 259
Kansas: Pittsburg

- Poverty rate: 29.4% (Kansas: 11.6%)
- Median household income: $42,371 (Kansas: $69,747)
- Households receiving SNAP benefits: 14.1% (Kansas: 7.0%)
- Avg. 5-yr. unemployment rate: 4.0% (Kansas: 4.0%)
- No. of towns in Kansas considered: 183
Kentucky: Cumberland
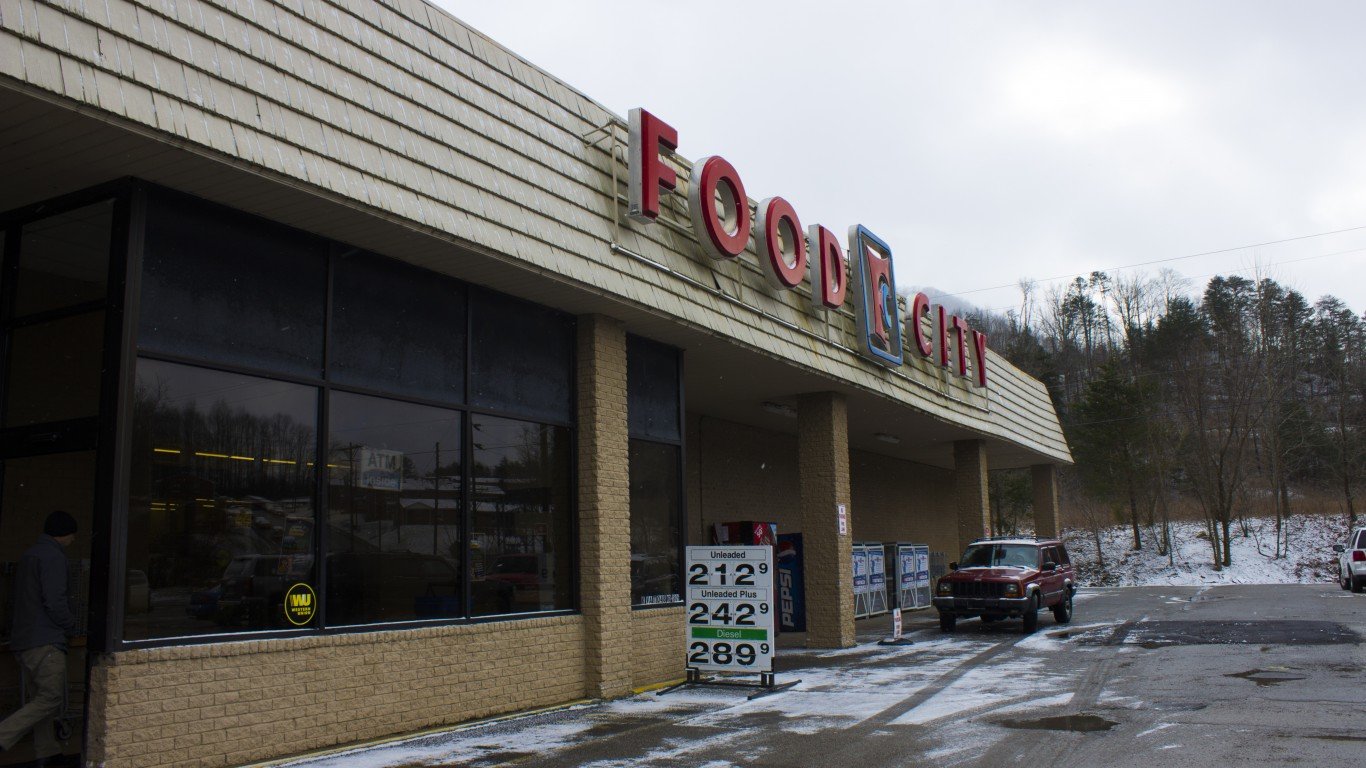
- Poverty rate: 59.8% (Kentucky: 16.1%)
- Median household income: $32,716 (Kentucky: $60,183)
- Households receiving SNAP benefits: 42.7% (Kentucky: 12.6%)
- Avg. 5-yr. unemployment rate: 42.5% (Kentucky: 5.1%)
- No. of towns in Kentucky considered: 224
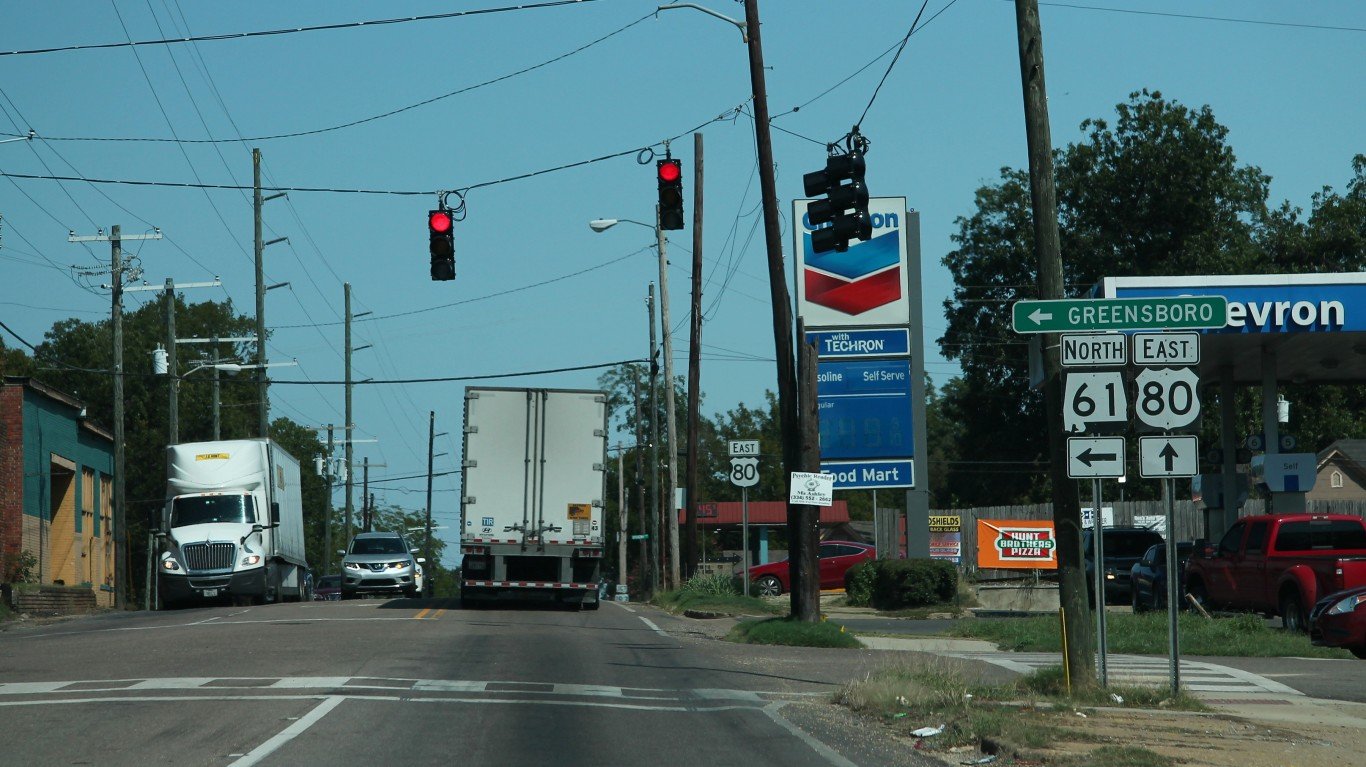
Louisiana: Ferriday
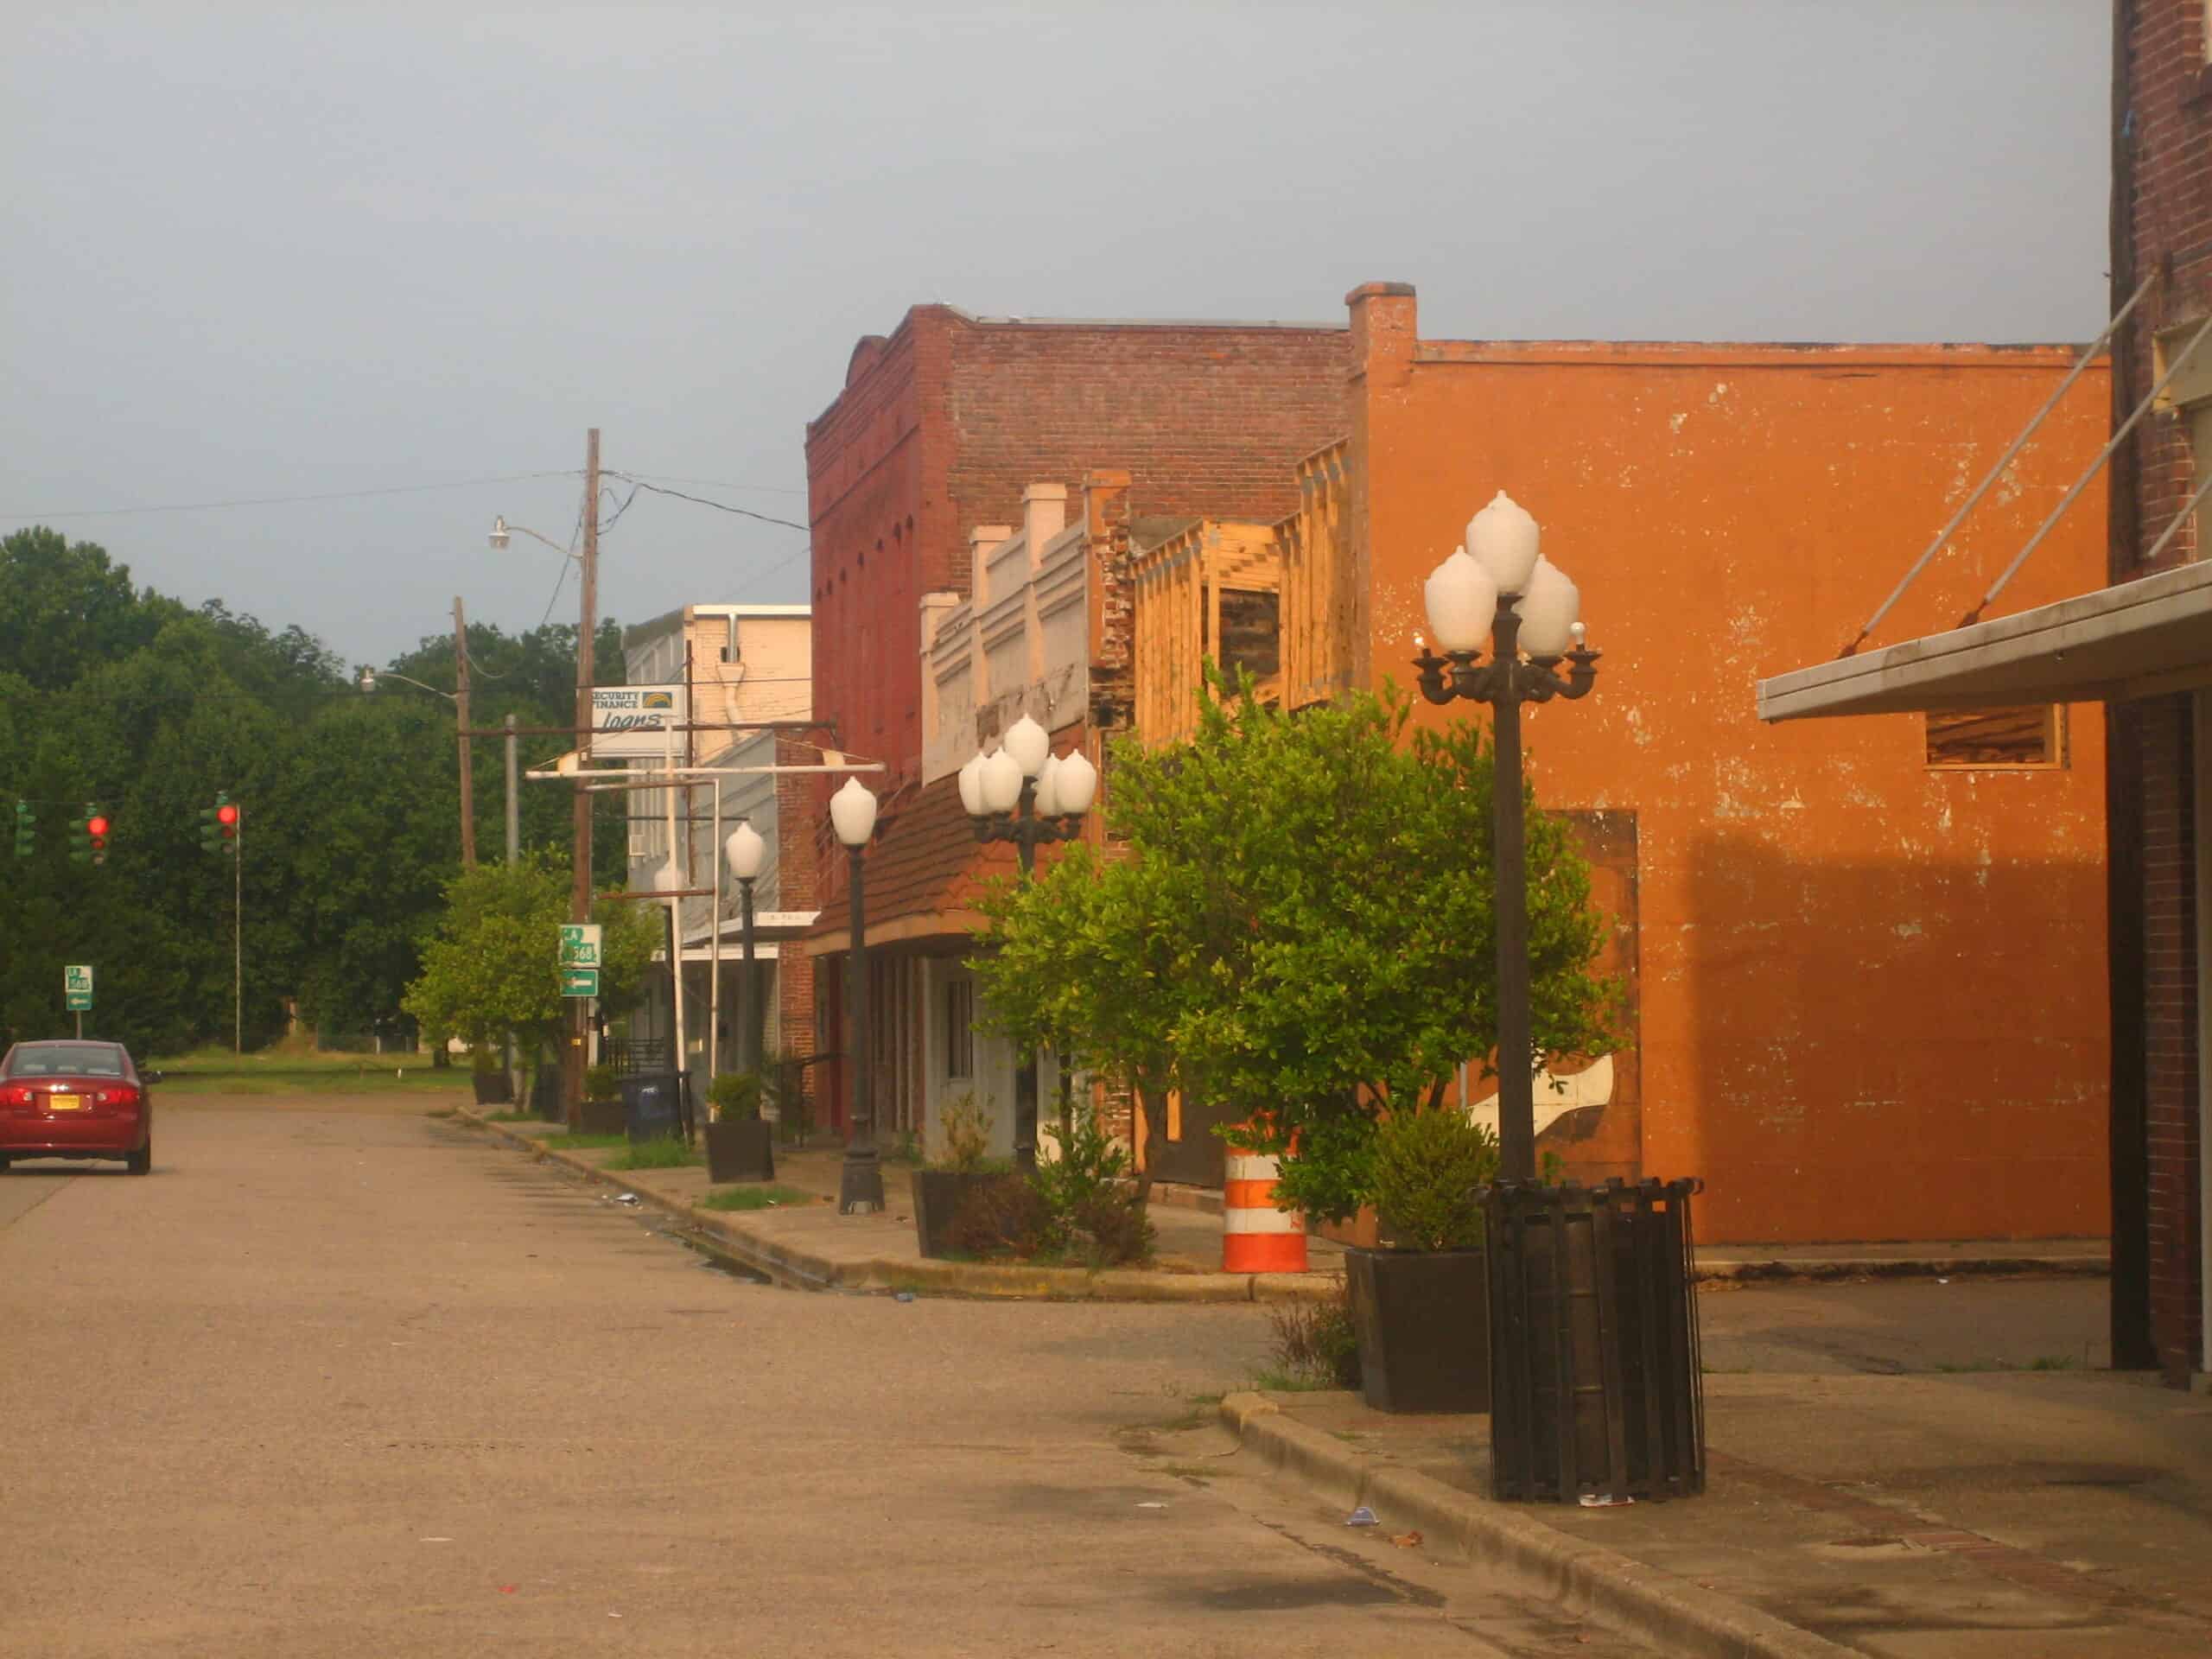
- Poverty rate: 64.0% (Louisiana: 18.7%)
- Median household income: $26,513 (Louisiana: $57,852)
- Households receiving SNAP benefits: 39.8% (Louisiana: 16.1%)
- Avg. 5-yr. unemployment rate: 23.2% (Louisiana: 6.5%)
- No. of towns in Louisiana considered: 251
Maine: Machias
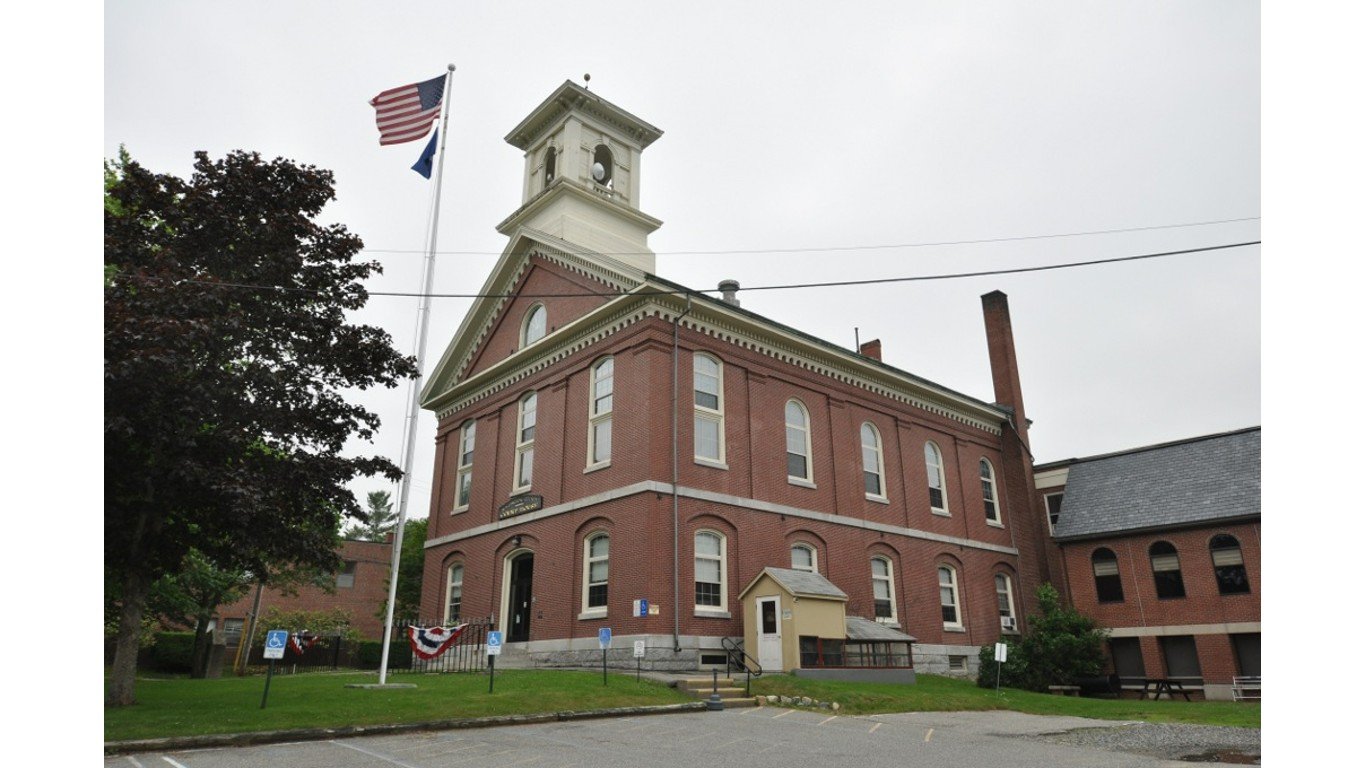
- Poverty rate: 36.3% (Maine: 10.9%)
- Median household income: $25,278 (Maine: $68,251)
- Households receiving SNAP benefits: 29.6% (Maine: 11.7%)
- Avg. 5-yr. unemployment rate: 8.6% (Maine: 4.0%)
- No. of towns in Maine considered: 98
Maryland: Eden

- Poverty rate: 33.6% (Maryland: 9.3%)
- Median household income: $28,808 (Maryland: $98,461)
- Households receiving SNAP benefits: 51.7% (Maryland: 10.8%)
- Avg. 5-yr. unemployment rate: 10.3% (Maryland: 5.1%)
- No. of towns in Maryland considered: 274
Massachusetts: Monson Center
- Poverty rate: 28.2% (Massachusetts: 9.9%)
- Median household income: $51,902 (Massachusetts: $96,505)
- Households receiving SNAP benefits: 22.9% (Massachusetts: 12.9%)
- Avg. 5-yr. unemployment rate: 16.6% (Massachusetts: 5.3%)
- No. of towns in Massachusetts considered: 156
Michigan: Benton Harbor

- Poverty rate: 44.2% (Michigan: 13.1%)
- Median household income: $26,592 (Michigan: $68,505)
- Households receiving SNAP benefits: 51.5% (Michigan: 12.7%)
- Avg. 5-yr. unemployment rate: 20.2% (Michigan: 6.0%)
- No. of towns in Michigan considered: 371
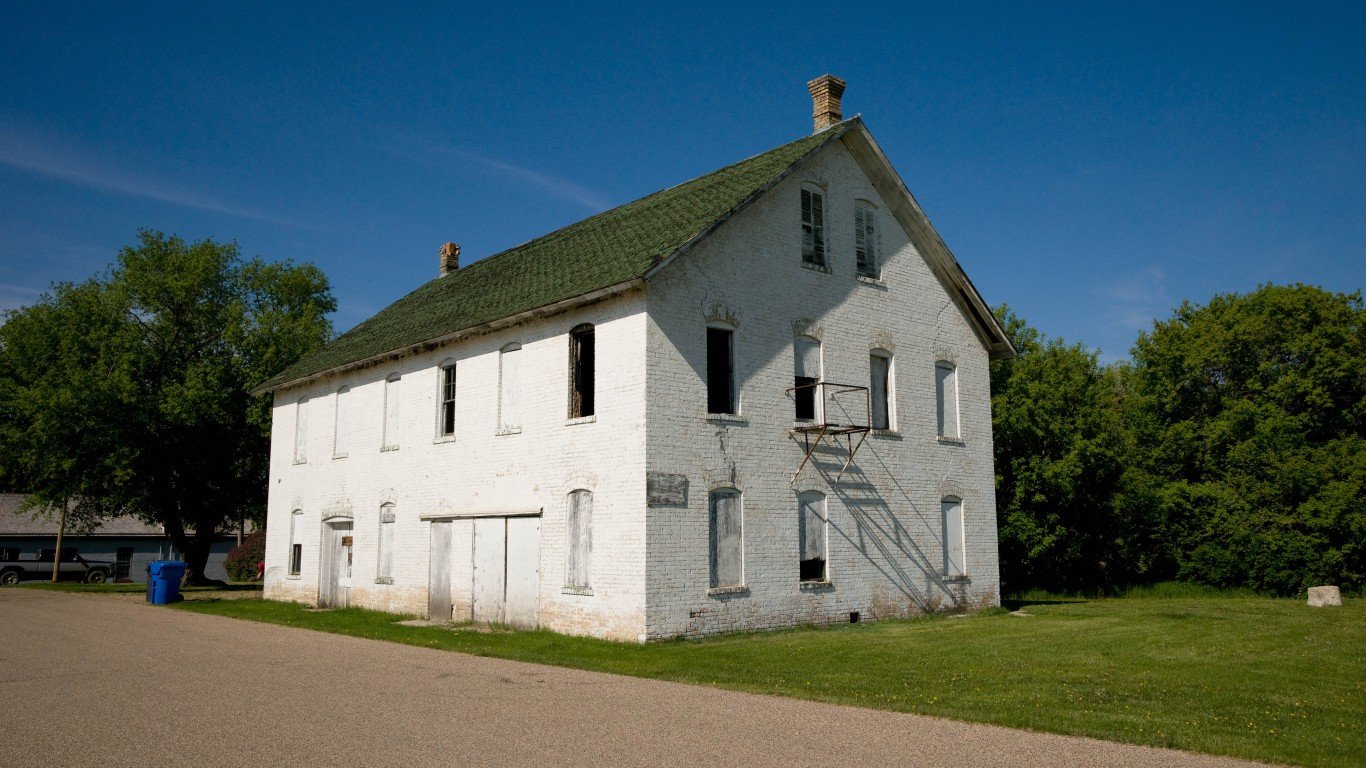
Minnesota: Moose Lake

- Poverty rate: 49.5% (Minnesota: 9.3%)
- Median household income: $49,722 (Minnesota: $84,313)
- Households receiving SNAP benefits: 13.9% (Minnesota: 7.4%)
- Avg. 5-yr. unemployment rate: 0.9% (Minnesota: 4.0%)
- No. of towns in Minnesota considered: 312
Mississippi: Renova
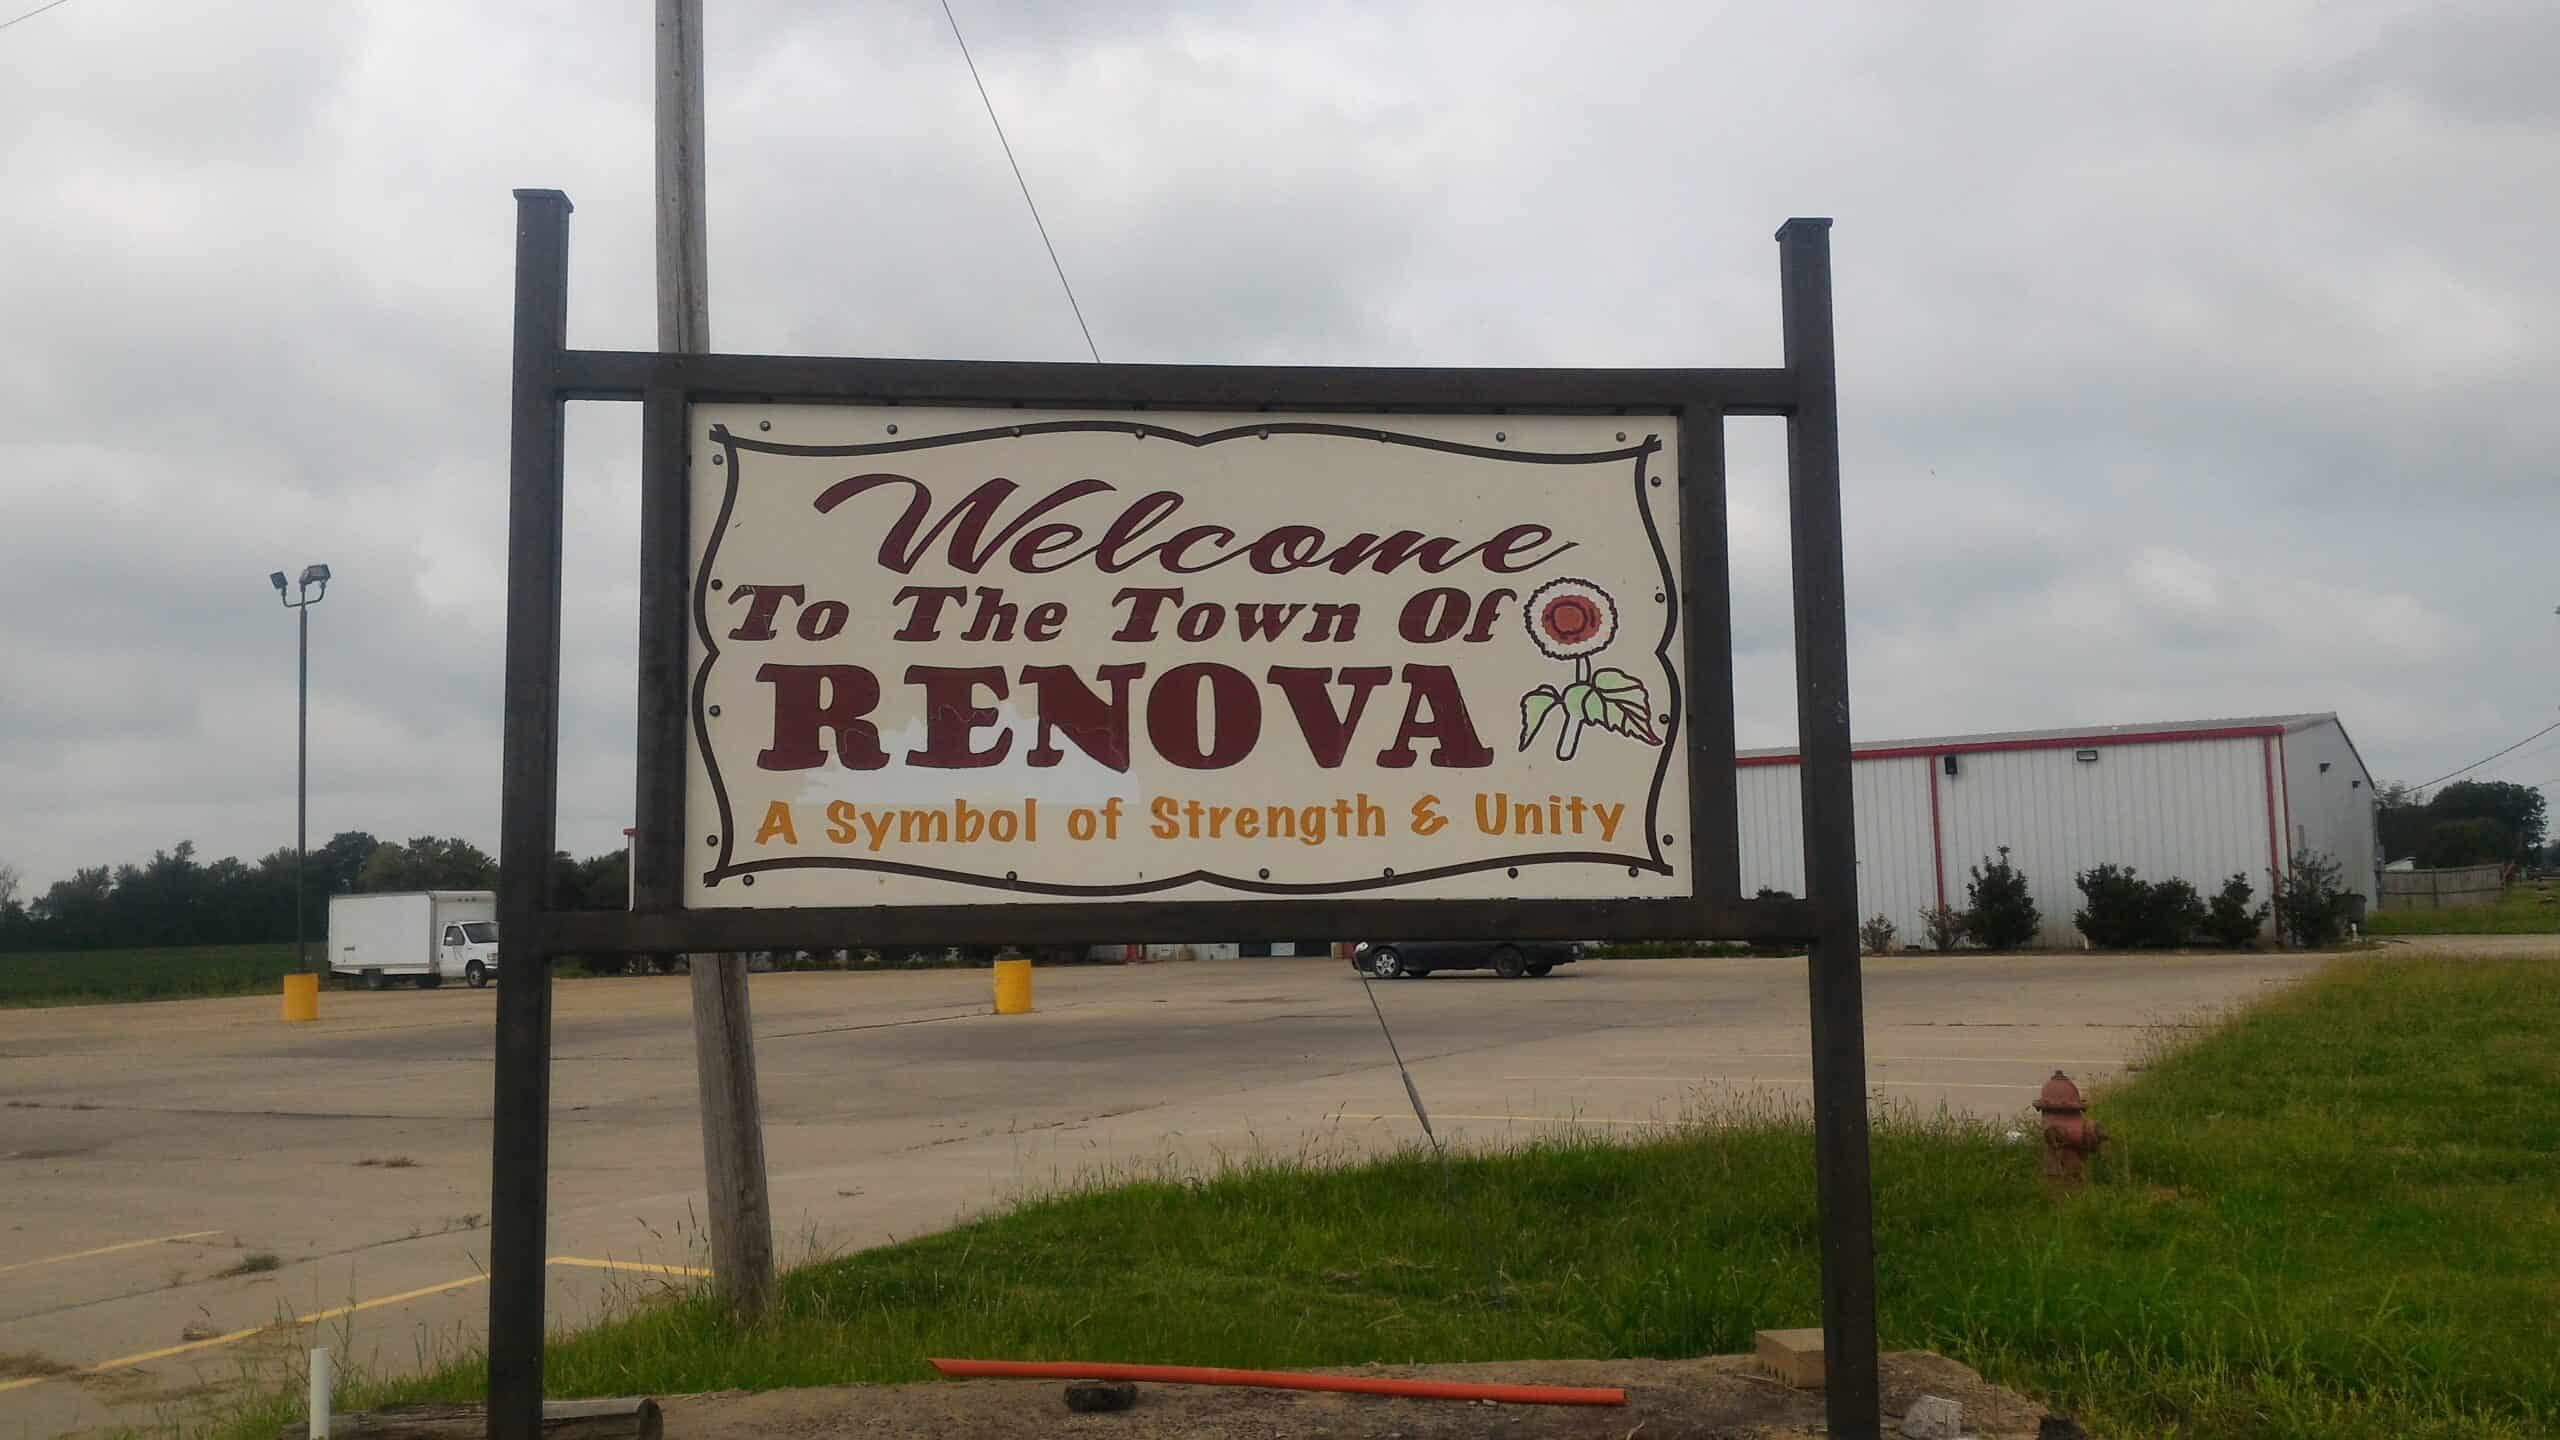
- Poverty rate: 54.9% (Mississippi: 19.2%)
- Median household income: $25,974 (Mississippi: $52,985)
- Households receiving SNAP benefits: 39.8% (Mississippi: 13.8%)
- Avg. 5-yr. unemployment rate: 8.0% (Mississippi: 6.4%)
- No. of towns in Mississippi considered: 168
Missouri: Flordell Hills

- Poverty rate: 50.2% (Missouri: 12.8%)
- Median household income: $32,906 (Missouri: $65,920)
- Households receiving SNAP benefits: 41.6% (Missouri: 10.0%)
- Avg. 5-yr. unemployment rate: 31.7% (Missouri: 4.3%)
- No. of towns in Missouri considered: 336
Montana: Lame Deer
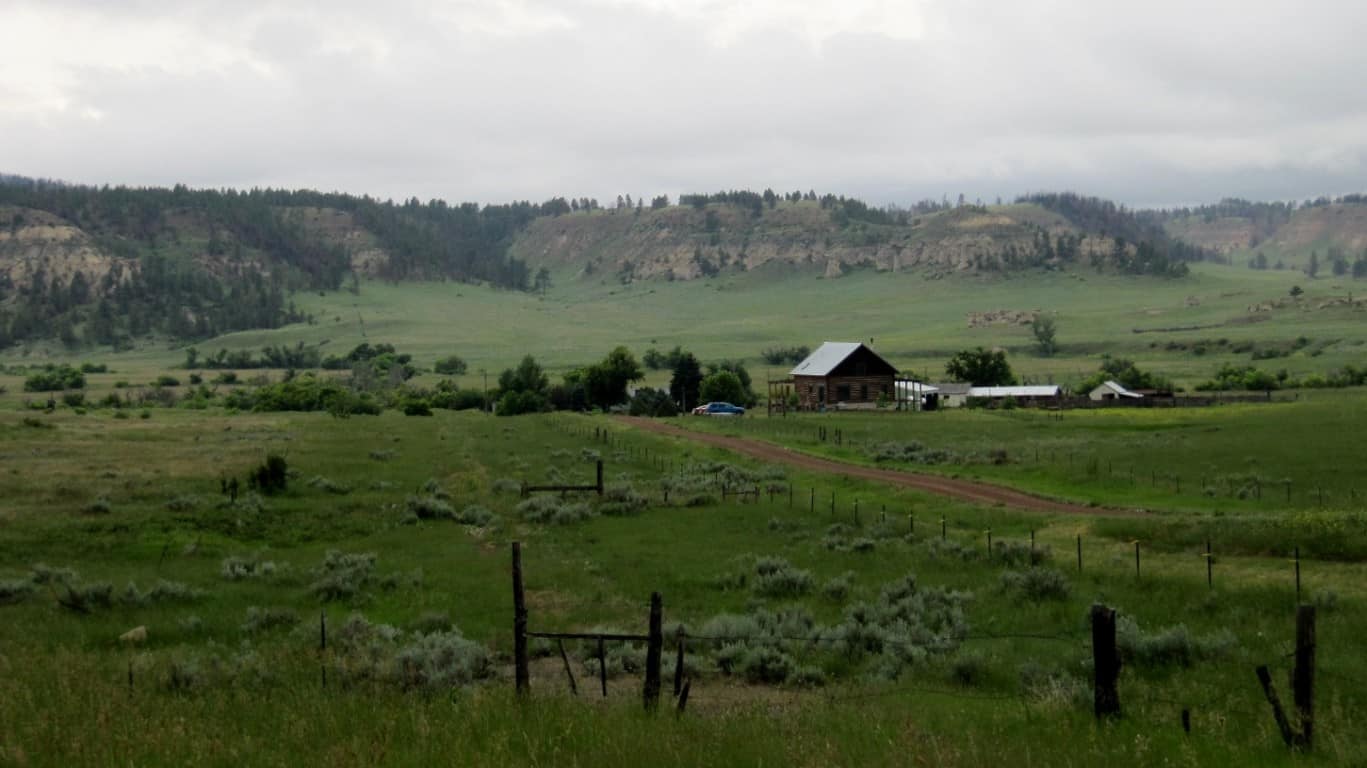
- Poverty rate: 47.5% (Montana: 12.4%)
- Median household income: $31,250 (Montana: $66,341)
- Households receiving SNAP benefits: 21.1% (Montana: 8.6%)
- Avg. 5-yr. unemployment rate: 25.8% (Montana: 3.9%)
- No. of towns in Montana considered: 88
Nebraska: Fullerton
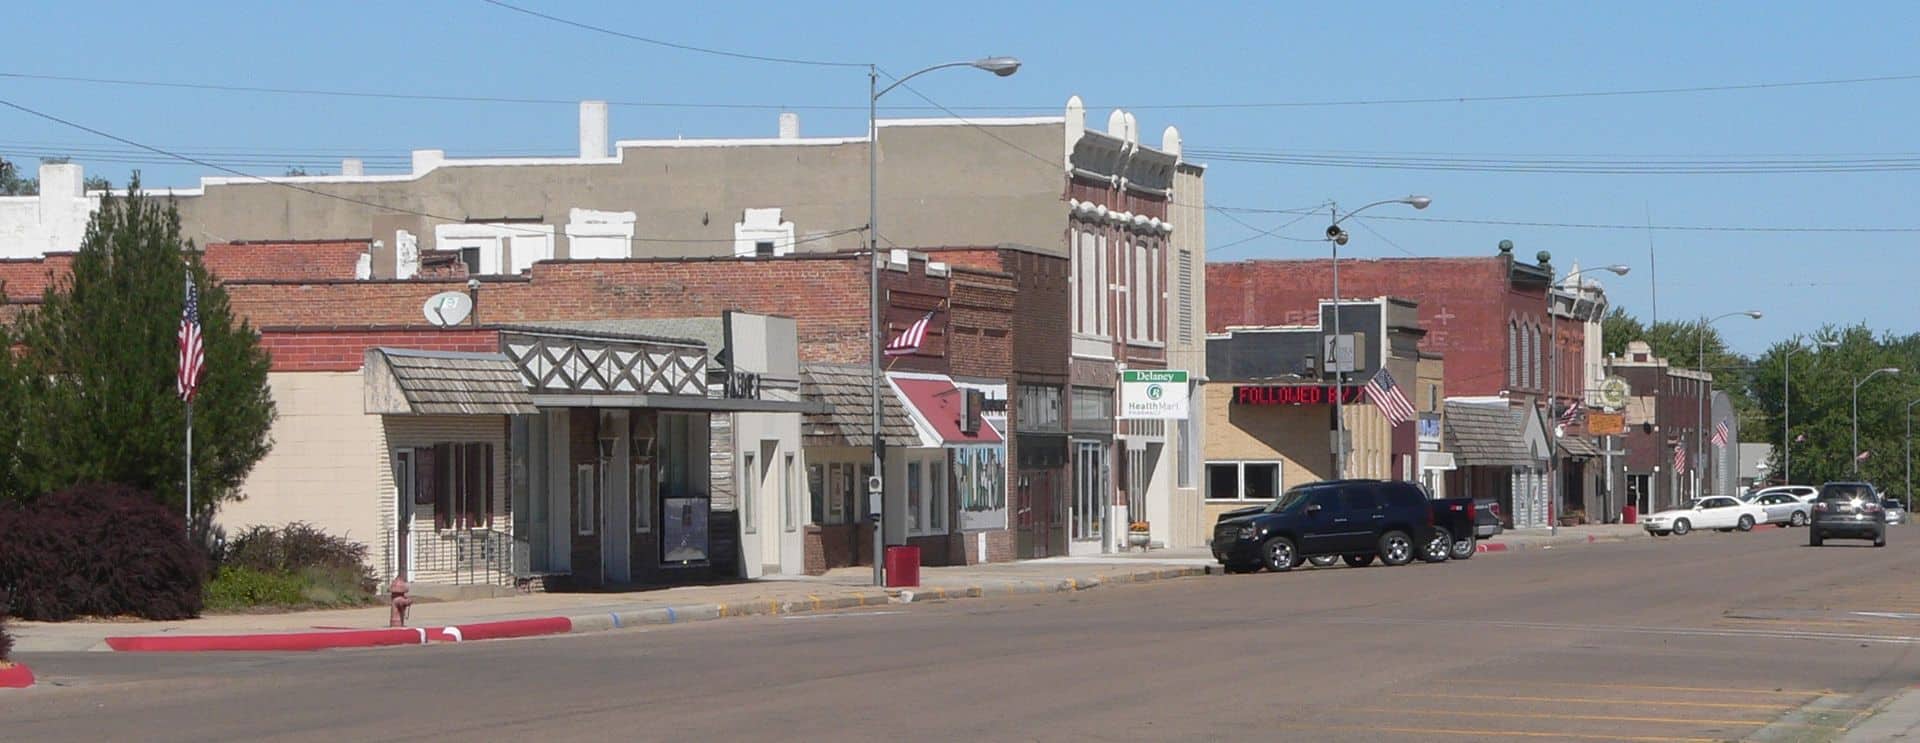
- Poverty rate: 23.3% (Nebraska: 10.4%)
- Median household income: $51,466 (Nebraska: $71,722)
- Households receiving SNAP benefits: 10.2% (Nebraska: 8.0%)
- Avg. 5-yr. unemployment rate: 6.0% (Nebraska: 3.1%)
- No. of towns in Nebraska considered: 104
Nevada: Wells
- Poverty rate: 43.3% (Nevada: 12.7%)
- Median household income: $55,917 (Nevada: $71,646)
- Households receiving SNAP benefits: 2.3% (Nevada: 11.9%)
- Avg. 5-yr. unemployment rate: 0.4% (Nevada: 7.0%)
- No. of towns in Nevada considered: 50
New Hampshire: Winchester

- Poverty rate: 33.1% (New Hampshire: 7.3%)
- Median household income: $45,298 (New Hampshire: $90,845)
- Households receiving SNAP benefits: 13.7% (New Hampshire: 6.0%)
- Avg. 5-yr. unemployment rate: 6.0% (New Hampshire: 3.6%)
- No. of towns in New Hampshire considered: 53
New Jersey: Penns Grove

- Poverty rate: 40.5% (New Jersey: 9.7%)
- Median household income: $29,821 (New Jersey: $97,126)
- Households receiving SNAP benefits: 41.6% (New Jersey: 8.5%)
- Avg. 5-yr. unemployment rate: 15.5% (New Jersey: 6.2%)
- No. of towns in New Jersey considered: 501
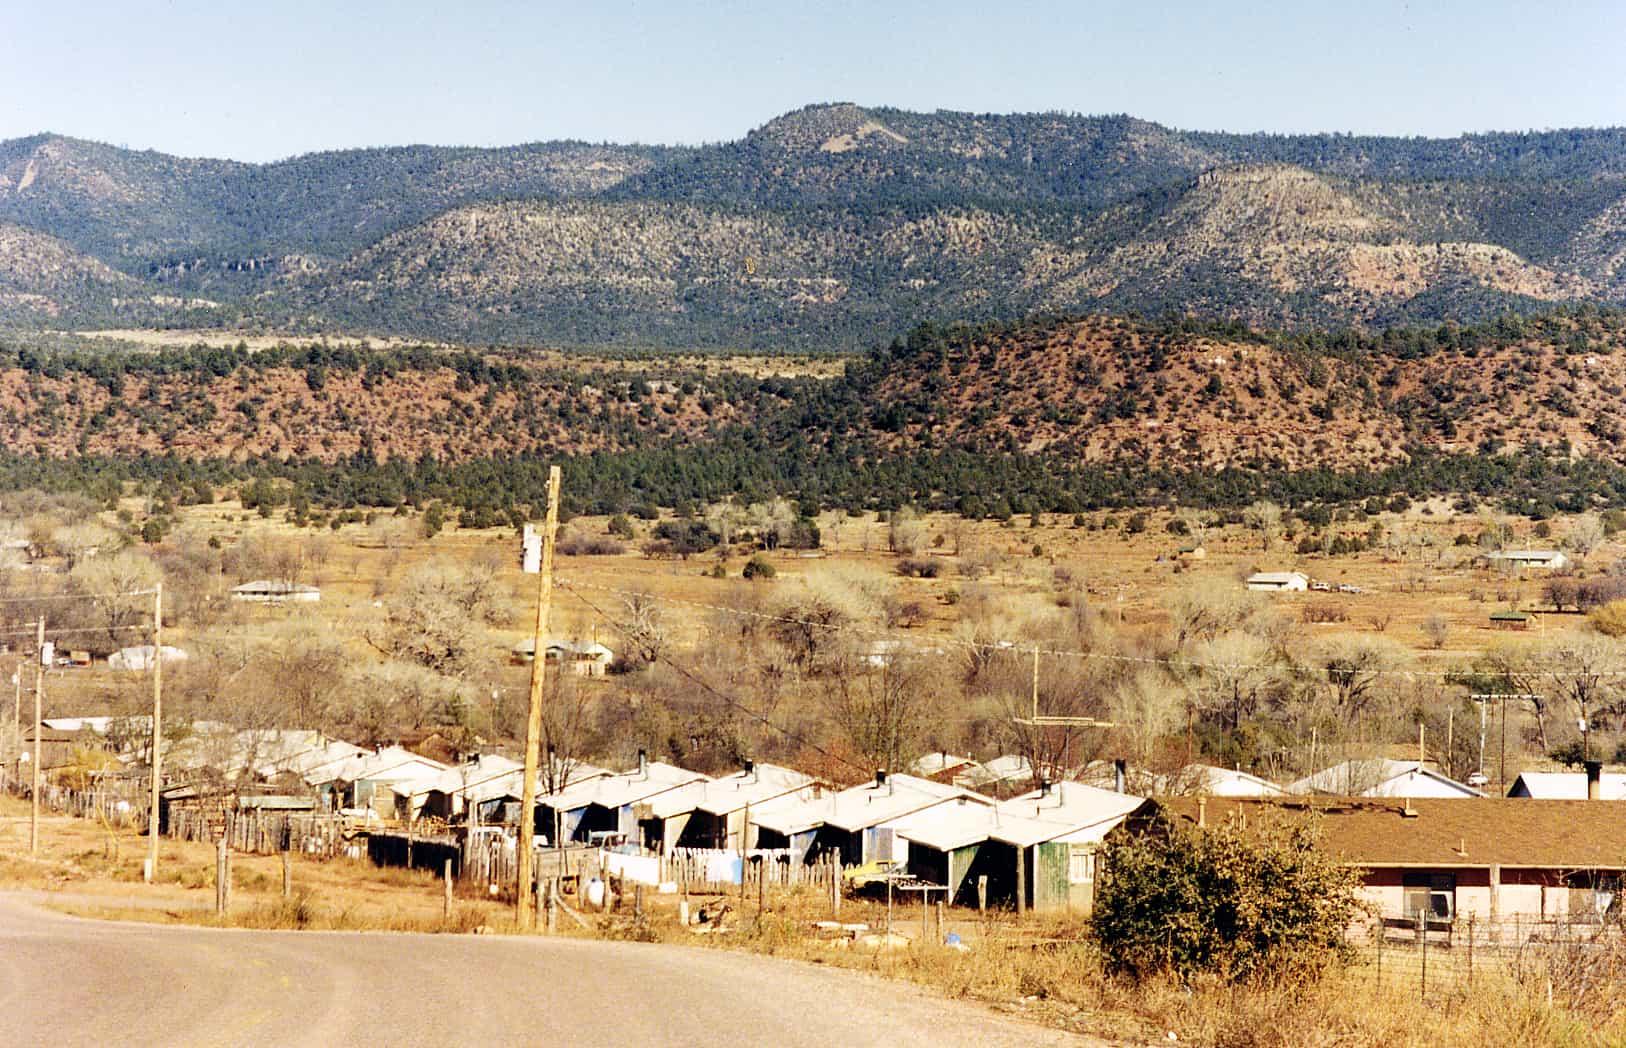
New Mexico: Alamo
- Poverty rate: 69.8% (New Mexico: 18.3%)
- Median household income: $24,118 (New Mexico: $58,722)
- Households receiving SNAP benefits: 37.7% (New Mexico: 18.1%)
- Avg. 5-yr. unemployment rate: 22.5% (New Mexico: 6.1%)
- No. of towns in New Mexico considered: 144
New York: New Square
- Poverty rate: 64.2% (New York: 13.6%)
- Median household income: $27,488 (New York: $81,386)
- Households receiving SNAP benefits: 64.4% (New York: 14.6%)
- Avg. 5-yr. unemployment rate: 8.1% (New York: 6.2%)
- No. of towns in New York considered: 750
North Carolina: Bonnetsville
- Poverty rate: 53.0% (North Carolina: 13.3%)
- Median household income: $41,135 (North Carolina: $66,186)
- Households receiving SNAP benefits: 30.1% (North Carolina: 12.3%)
- Avg. 5-yr. unemployment rate: 4.5% (North Carolina: 5.0%)
- No. of towns in North Carolina considered: 393
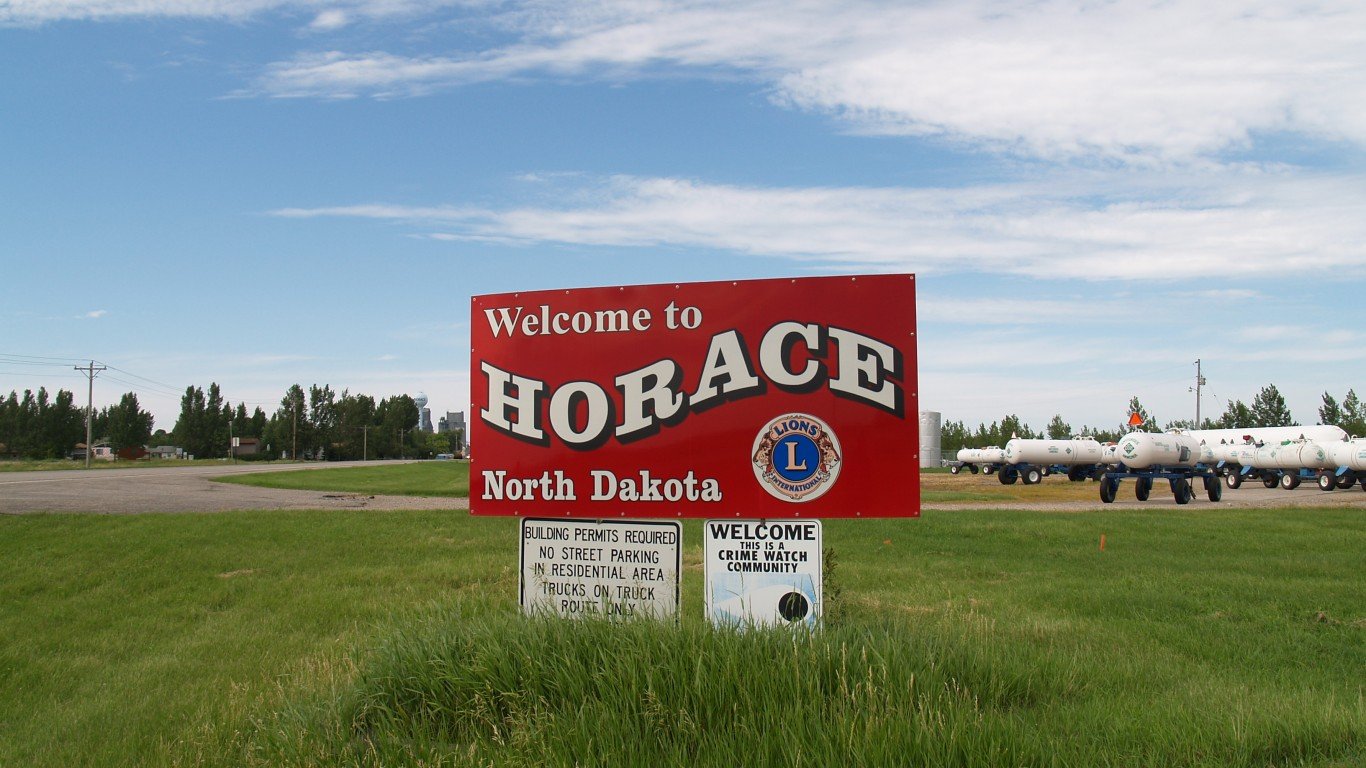
North Dakota: Fort Totten
- Poverty rate: 41.7% (North Dakota: 10.8%)
- Median household income: $30,234 (North Dakota: $73,959)
- Households receiving SNAP benefits: 52.4% (North Dakota: 6.3%)
- Avg. 5-yr. unemployment rate: 6.2% (North Dakota: 2.9%)
- No. of towns in North Dakota considered: 45
Ohio: Lincoln Heights
- Poverty rate: 62.9% (Ohio: 13.3%)
- Median household income: $14,676 (Ohio: $66,990)
- Households receiving SNAP benefits: 65.4% (Ohio: 12.2%)
- Avg. 5-yr. unemployment rate: 26.5% (Ohio: 5.0%)
- No. of towns in Ohio considered: 611
Oklahoma: Tyrone

- Poverty rate: 48.9% (Oklahoma: 15.2%)
- Median household income: $N/A (Oklahoma: $61,364)
- Households receiving SNAP benefits: 4.7% (Oklahoma: 13.0%)
- Avg. 5-yr. unemployment rate: N/A% (Oklahoma: 4.8%)
- No. of towns in Oklahoma considered: 217
Oregon: Grand Ronde
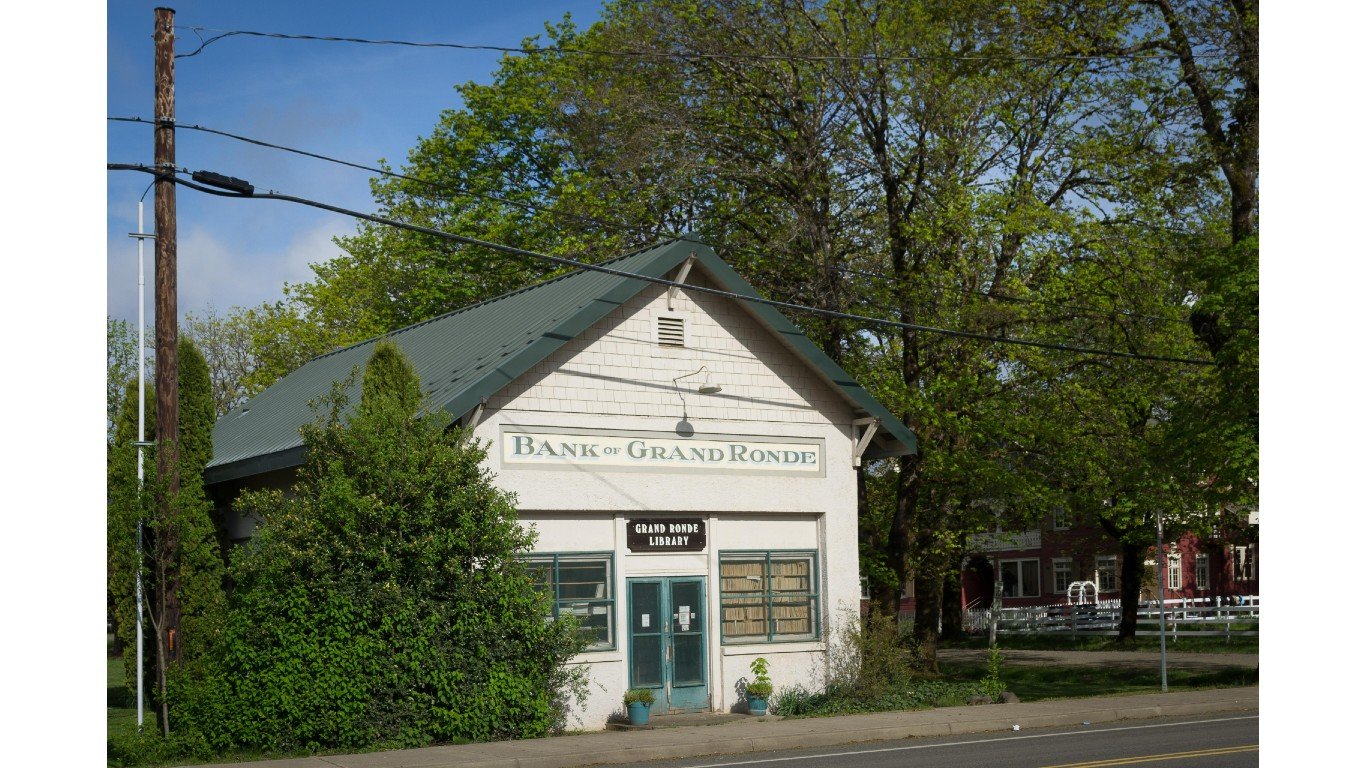
- Poverty rate: 37.5% (Oregon: 11.9%)
- Median household income: $29,674 (Oregon: $76,632)
- Households receiving SNAP benefits: 52.7% (Oregon: 14.9%)
- Avg. 5-yr. unemployment rate: 7.5% (Oregon: 5.5%)
- No. of towns in Oregon considered: 202
Pennsylvania: Ashley
- Poverty rate: 39.7% (Pennsylvania: 11.8%)
- Median household income: $39,234 (Pennsylvania: $73,170)
- Households receiving SNAP benefits: 30.3% (Pennsylvania: 13.6%)
- Avg. 5-yr. unemployment rate: 7.6% (Pennsylvania: 5.4%)
- No. of towns in Pennsylvania considered: 922
Rhode Island: Central Falls

- Poverty rate: 24.4% (Rhode Island: 11.2%)
- Median household income: $43,092 (Rhode Island: $81,370)
- Households receiving SNAP benefits: 32.7% (Rhode Island: 14.5%)
- Avg. 5-yr. unemployment rate: 8.3% (Rhode Island: 5.8%)
- No. of towns in Rhode Island considered: 19
South Carolina: Saxon

- Poverty rate: 48.7% (South Carolina: 14.4%)
- Median household income: $25,231 (South Carolina: $63,623)
- Households receiving SNAP benefits: 32.4% (South Carolina: 10.5%)
- Avg. 5-yr. unemployment rate: 11.6% (South Carolina: 5.1%)
- No. of towns in South Carolina considered: 234
South Dakota: Rosebud
- Poverty rate: 57.2% (South Dakota: 12.3%)
- Median household income: $47,813 (South Dakota: $69,457)
- Households receiving SNAP benefits: 42.1% (South Dakota: 8.1%)
- Avg. 5-yr. unemployment rate: 19.8% (South Dakota: 3.1%)
- No. of towns in South Dakota considered: 70
Tennessee: Red Boiling Springs

- Poverty rate: 43.8% (Tennessee: 14.0%)
- Median household income: $30,046 (Tennessee: $64,035)
- Households receiving SNAP benefits: 50.9% (Tennessee: 11.7%)
- Avg. 5-yr. unemployment rate: 10.0% (Tennessee: 5.0%)
- No. of towns in Tennessee considered: 268
Texas: Carrizo Hill

- Poverty rate: 96.0% (Texas: 13.9%)
- Median household income: $N/A (Texas: $73,035)
- Households receiving SNAP benefits: 25.1% (Texas: 11.5%)
- Avg. 5-yr. unemployment rate: N/A% (Texas: 5.2%)
- No. of towns in Texas considered: 894
Utah: Hideout
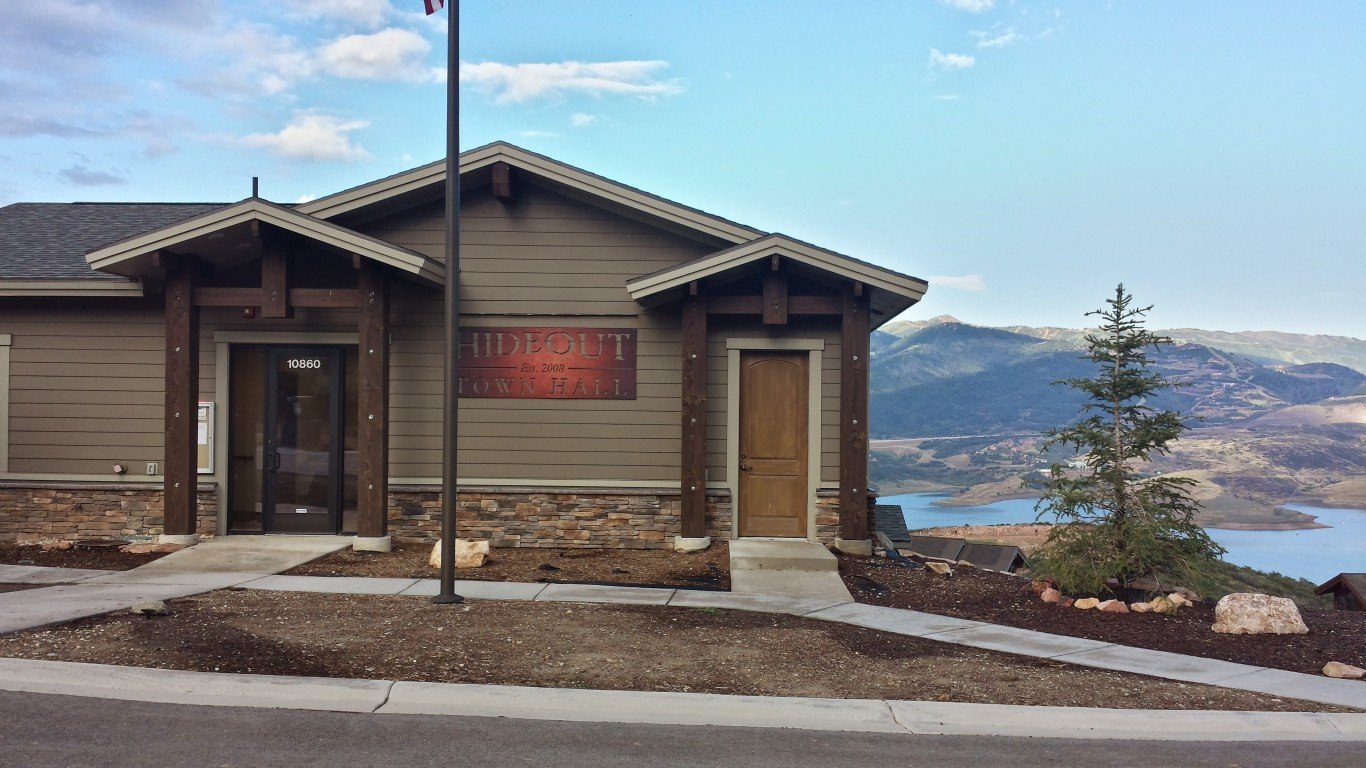
- Poverty rate: 36.4% (Utah: 8.5%)
- Median household income: $73,472 (Utah: $86,833)
- Households receiving SNAP benefits: 8.8% (Utah: 5.5%)
- Avg. 5-yr. unemployment rate: N/A% (Utah: 3.3%)
- No. of towns in Utah considered: 133
Vermont: Brattleboro
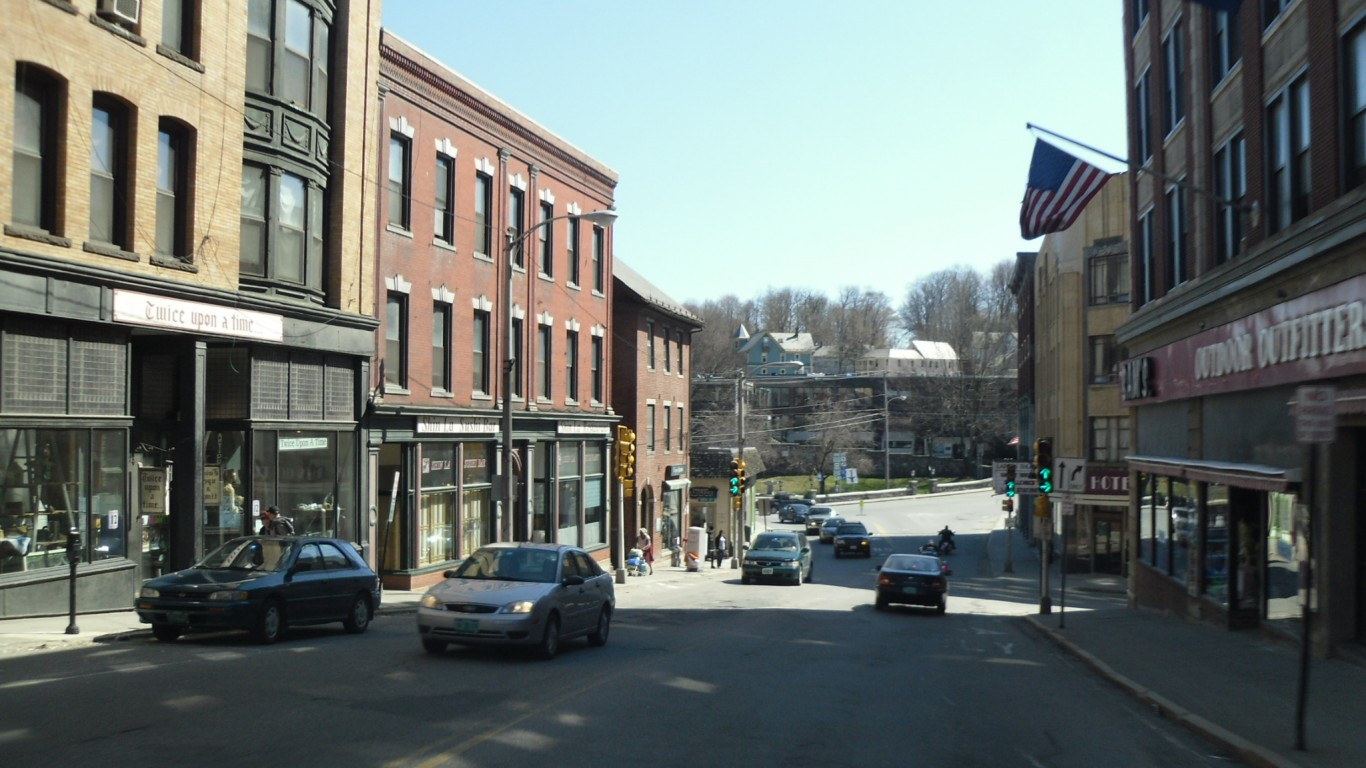
- Poverty rate: 26.1% (Vermont: 10.4%)
- Median household income: $42,776 (Vermont: $74,014)
- Households receiving SNAP benefits: 21.9% (Vermont: 10.3%)
- Avg. 5-yr. unemployment rate: 9.2% (Vermont: 3.8%)
- No. of towns in Vermont considered: 41
Virginia: Elliston

- Poverty rate: 59.8% (Virginia: 10.0%)
- Median household income: $33,870 (Virginia: $87,249)
- Households receiving SNAP benefits: 9.0% (Virginia: 8.3%)
- Avg. 5-yr. unemployment rate: N/A% (Virginia: 4.3%)
- No. of towns in Virginia considered: 329
Washington: Moses Lake North

- Poverty rate: 37.2% (Washington: 9.9%)
- Median household income: $52,977 (Washington: $90,325)
- Households receiving SNAP benefits: 38.7% (Washington: 11.1%)
- Avg. 5-yr. unemployment rate: 4.7% (Washington: 4.9%)
- No. of towns in Washington considered: 342
West Virginia: Rupert
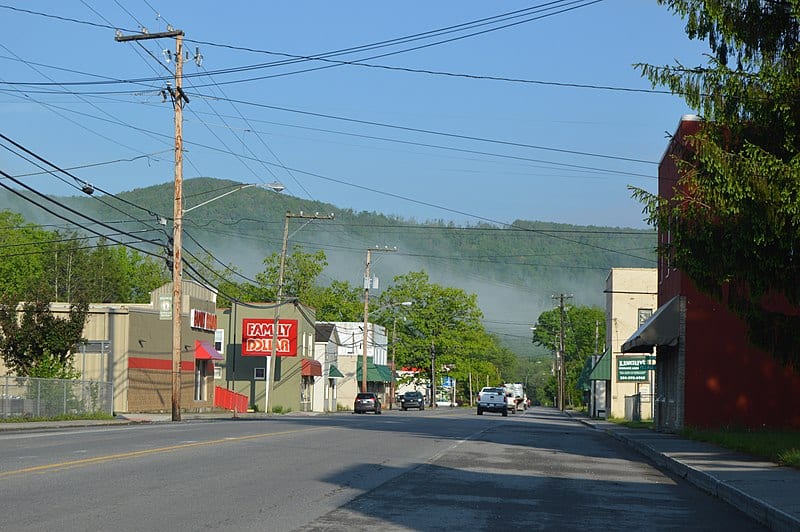
- Poverty rate: 43.5% (West Virginia: 16.8%)
- Median household income: $27,244 (West Virginia: $55,217)
- Households receiving SNAP benefits: 32.4% (West Virginia: 16.6%)
- Avg. 5-yr. unemployment rate: 2.4% (West Virginia: 6.0%)
- No. of towns in West Virginia considered: 138
Wisconsin: Keshena
- Poverty rate: 38.7% (Wisconsin: 10.7%)
- Median household income: $43,000 (Wisconsin: $72,458)
- Households receiving SNAP benefits: 49.4% (Wisconsin: 10.4%)
- Avg. 5-yr. unemployment rate: 8.4% (Wisconsin: 3.4%)
- No. of towns in Wisconsin considered: 348
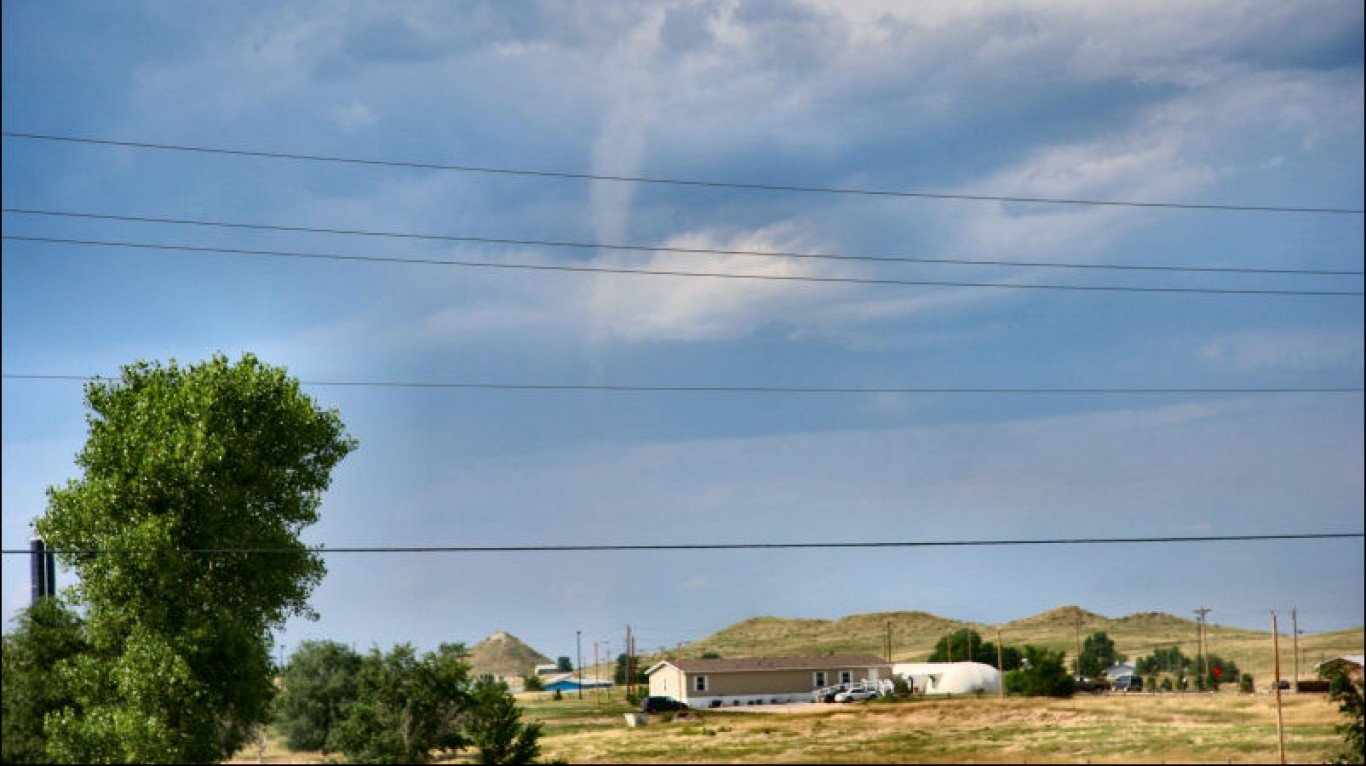
Wyoming: Fort Washakie

- Poverty rate: 27.1% (Wyoming: 10.7%)
- Median household income: $40,000 (Wyoming: $72,495)
- Households receiving SNAP benefits: 18.8% (Wyoming: 4.8%)
- Avg. 5-yr. unemployment rate: 18.5% (Wyoming: 3.8%)
- No. of towns in Wyoming considered: 52
Methodology
To determine the town with the highest poverty rate in every state, 24/7 Wall St. reviewed five-year estimates of the percentage of people living below the poverty line in towns nationwide from the U.S. Census Bureau’s 2022 American Community Survey.
We considered all cities, towns, villages, and unincorporated communities with available data and populations between 1,000 and 25,000. The presence of a major college or university can distort economic realities of a given area, and as a result, places where 25% or more of the population are enrolled in college or graduate school were excluded. We also excluded places where the population for whom the poverty status was determined totaled less than 1,000.
Additional data on median household income, educational attainment, SNAP recipiency, and unemployment are also five-year estimates from the 2022 ACS.
Contact [email protected] for any questions or corrections.