Firearm sales have hit historic highs in the U.S. in recent years, and the ongoing proliferation of firearms may be fueling a rise in gun crime.
When firearms are recovered at a crime scene or taken from a suspect, they are often reported to the Bureau of Alcohol, Tobacco, Firearms, and Explosives for tracing. In these cases, the ATF assists in criminal investigations by using serial numbers and other markings to determine when and where a firearm was originally purchased — and over the last 12 years, firearm-related offenses have been taking up a growing share of federal resources.
Between 2010 and 2022, the number of guns traced by the ATF surged by 174%, from 145,600 to 399,400, climbing by anywhere from 3% to 18% in a single year. Most homicides in the U.S. are committed with a firearm, and over the same period, the national homicide rate climbed by over 50%.
While not all guns traced by the ATF were used in a crime — and not all firearms used for illicit purposes are traced — federal tracing data offers valuable insight into trends and geographic patterns related to gun violence in the United States.
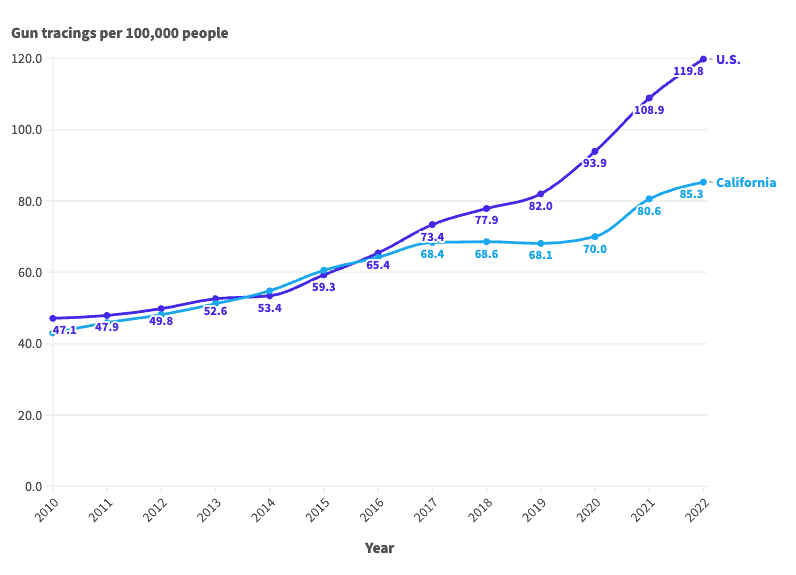
Mirroring the national trend, gun tracings are up sharply in California. The ATF traced 33,304 seized firearms in the state in 2022, compared to 16,045 in 2010. Still, adjusting for population, gun crime appears less common in California than it is across the U.S. as a whole. In 10 of the last 12 years, the number of firearm tracings for every 100,000 people in the state was below the comparable national rate.
As of 2022, the most recent year of available data, the ATF traced 85 seized firearms for every 100,000 people in the state, the 15th lowest gun-tracing rate among states.
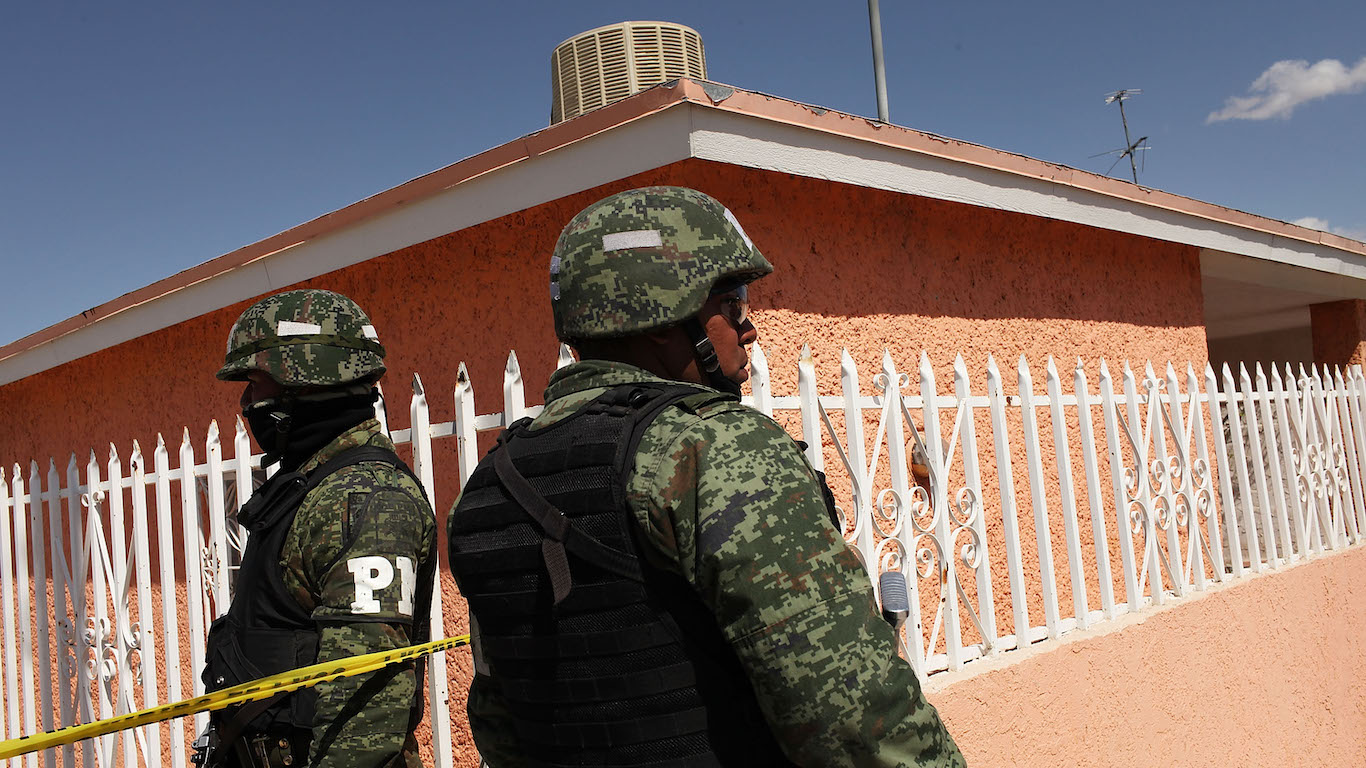
2010: 16,045 firearms traced by the ATF

Source: DianeBentleyRaymond / iStock via Getty Images
- Firearms traced by the ATF in California, 2010: 43.0 per 100,000 people (22nd highest)
- Firearms traced by the ATF nationwide, 2010: 47.1 per 100,000 people
- California homicide rate, 2010: 4.8 per 100,000 people (20th highest)
- U.S. homicide rate, 2010: 4.8 per 100,000 people
2011: 17,285 firearms traced by the ATF

Source: bluejayphoto / iStock via Getty Images
- Firearms traced by the ATF in California, 2011: 45.9 per 100,000 people (20th highest)
- Firearms traced by the ATF nationwide, 2011: 47.9 per 100,000 people
- California homicide rate, 2011: 4.8 per 100,000 people (20th highest)
- U.S. homicide rate, 2011: 4.7 per 100,000 people
2012: 18,280 firearms traced by the ATF

Source: f11photo / iStock via Getty Images
- Firearms traced by the ATF in California, 2012: 48.1 per 100,000 people (24th highest)
- Firearms traced by the ATF nationwide, 2012: 49.8 per 100,000 people
- California homicide rate, 2012: 5.0 per 100,000 people (18th highest)
- U.S. homicide rate, 2012: 4.7 per 100,000 people
2013: 19,625 firearms traced by the ATF

Source: f1monaco31 / Getty Images
- Firearms traced by the ATF in California, 2013: 51.2 per 100,000 people (22nd highest)
- Firearms traced by the ATF nationwide, 2013: 52.6 per 100,000 people
- California homicide rate, 2013: 4.5 per 100,000 people (21st highest)
- U.S. homicide rate, 2013: 4.5 per 100,000 people
2014: 21,265 firearms traced by the ATF
Source: MattGush / iStock via Getty Images
- Firearms traced by the ATF in California, 2014: 54.8 per 100,000 people (21st highest)
- Firearms traced by the ATF nationwide, 2014: 53.4 per 100,000 people
- California homicide rate, 2014: 4.4 per 100,000 people (24th highest)
- U.S. homicide rate, 2014: 4.4 per 100,000 people
2015: 23,716 firearms traced by the ATF
Source: Davel5957 / iStock via Getty Images
- Firearms traced by the ATF in California, 2015: 60.6 per 100,000 people (21st highest)
- Firearms traced by the ATF nationwide, 2015: 59.3 per 100,000 people
- California homicide rate, 2015: 4.8 per 100,000 people (23rd highest)
- U.S. homicide rate, 2015: 4.9 per 100,000 people
2016: 25,188 firearms traced by the ATF
Source: ivanastar / iStock Unreleased via Getty Images
- Firearms traced by the ATF in California, 2016: 64.2 per 100,000 people (25th highest)
- Firearms traced by the ATF nationwide, 2016: 65.4 per 100,000 people
- California homicide rate, 2016: 4.9 per 100,000 people (25th lowest)
- U.S. homicide rate, 2016: 5.4 per 100,000 people
2017: 27,051 firearms traced by the ATF
Source: Ken Levine / Getty Images
- Firearms traced by the ATF in California, 2017: 68.4 per 100,000 people (25th highest)
- Firearms traced by the ATF nationwide, 2017: 73.4 per 100,000 people
- California homicide rate, 2017: 4.6 per 100,000 people (24th lowest)
- U.S. homicide rate, 2017: 5.3 per 100,000 people
2018: 27,154 firearms traced by the ATF
Source: DianeBentleyRaymond / iStock via Getty Images
- Firearms traced by the ATF in California, 2018: 68.6 per 100,000 people (23rd lowest)
- Firearms traced by the ATF nationwide, 2018: 77.9 per 100,000 people
- California homicide rate, 2018: 4.4 per 100,000 people (25th lowest)
- U.S. homicide rate, 2018: 5.0 per 100,000 people
2019: 26,922 firearms traced by the ATF
Source: bluejayphoto / iStock via Getty Images
- Firearms traced by the ATF in California, 2019: 68.1 per 100,000 people (20th lowest)
- Firearms traced by the ATF nationwide, 2019: 82.0 per 100,000 people
- California homicide rate, 2019: 4.3 per 100,000 people (24th lowest)
- U.S. homicide rate, 2019: 5.1 per 100,000 people
2020: 27,536 firearms traced by the ATF
Source: f11photo / iStock via Getty Images
- Firearms traced by the ATF in California, 2020: 70.0 per 100,000 people (16th lowest)
- Firearms traced by the ATF nationwide, 2020: 93.9 per 100,000 people
- California homicide rate, 2020: 5.6 per 100,000 people (24th lowest)
- U.S. homicide rate, 2020: 6.5 per 100,000 people
2021: 31,609 firearms traced by the ATF
Source: f1monaco31 / Getty Images
- Firearms traced by the ATF in California, 2021: 80.6 per 100,000 people (20th lowest)
- Firearms traced by the ATF nationwide, 2021: 108.9 per 100,000 people
- California homicide rate, 2021: 4.4 per 100,000 people
- U.S. homicide rate, 2021: 7.7 per 100,000 people
2022: 33,304 firearms traced by the ATF
Source: MattGush / iStock via Getty Images
- Firearms traced by the ATF in California, 2022: 85.3 per 100,000 people (15th lowest)
- Firearms traced by the ATF nationwide, 2022: 119.8 per 100,000 people
- California homicide rate, 2022: 3.7 per 100,000 people (10th lowest)
- U.S. homicide rate, 2022: 7.3 per 100,000 people
Source: Courtesy of 2/47 Wall St.
| Year | Firearm tracings per 100,000 people in California | Firearm tracings per 100,000 people in the US | Total firearms traced by the ATF in California | Total firearms traced by the ATF in the US |
|---|---|---|---|---|
| 2022 | 85.3 | 119.8 | 33,304 | 399,397 |
| 2021 | 80.6 | 108.9 | 31,609 | 361,587 |
| 2020 | 70.0 | 93.9 | 27,536 | 306,686 |
| 2019 | 68.1 | 82.0 | 26,922 | 269,250 |
| 2018 | 68.6 | 77.9 | 27,154 | 254,700 |
| 2017 | 68.4 | 73.4 | 27,051 | 239,175 |
| 2016 | 64.2 | 65.4 | 25,188 | 211,384 |
| 2015 | 60.6 | 59.3 | 23,716 | 190,538 |
| 2014 | 54.8 | 53.4 | 21,265 | 170,344 |
| 2013 | 51.2 | 52.6 | 19,625 | 166,426 |
| 2012 | 48.1 | 49.8 | 18,280 | 156,346 |
| 2011 | 45.9 | 47.9 | 17,285 | 149,276 |
| 2010 | 43.0 | 47.1 | 16,045 | 145,604 |
Want to Retire Early? Start Here (Sponsor)
Want retirement to come a few years earlier than you’d planned? Or are you ready to retire now, but want an extra set of eyes on your finances?
Now you can speak with up to 3 financial experts in your area for FREE. By simply clicking here you can begin to match with financial professionals who can help you build your plan to retire early. And the best part? The first conversation with them is free.
Click here to match with up to 3 financial pros who would be excited to help you make financial decisions.
Thank you for reading! Have some feedback for us?
Contact the 24/7 Wall St. editorial team.
Editors' Picks