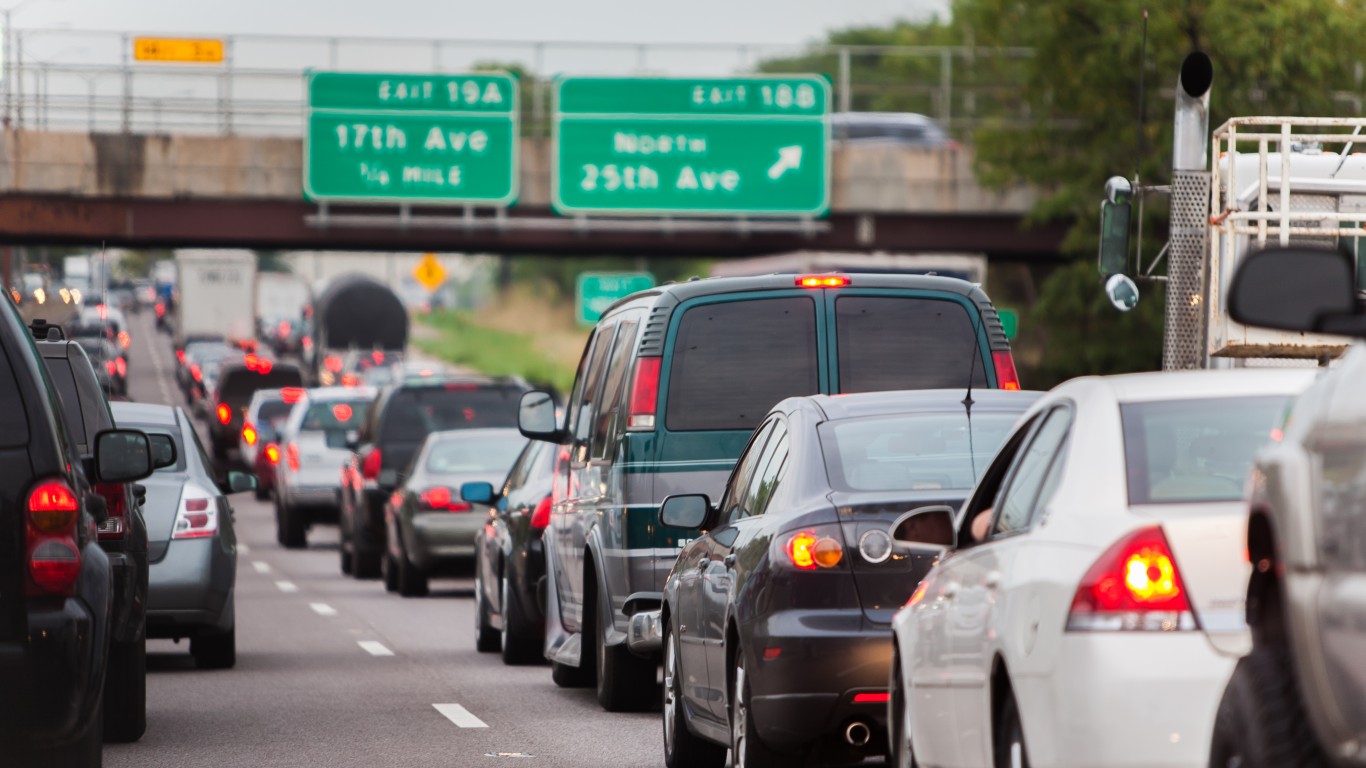
For better or worse, most Americans rely on passenger vehicles for daily travel. The latest government data shows that over 90% of the 136 million commuters in the U.S. either drive or carpool to get to work. Cumulatively, Americans drove nearly 3.2 trillion miles in 2022, or about 16,630 miles for every licensed driver, according to the Bureau of Transportation Statistics.
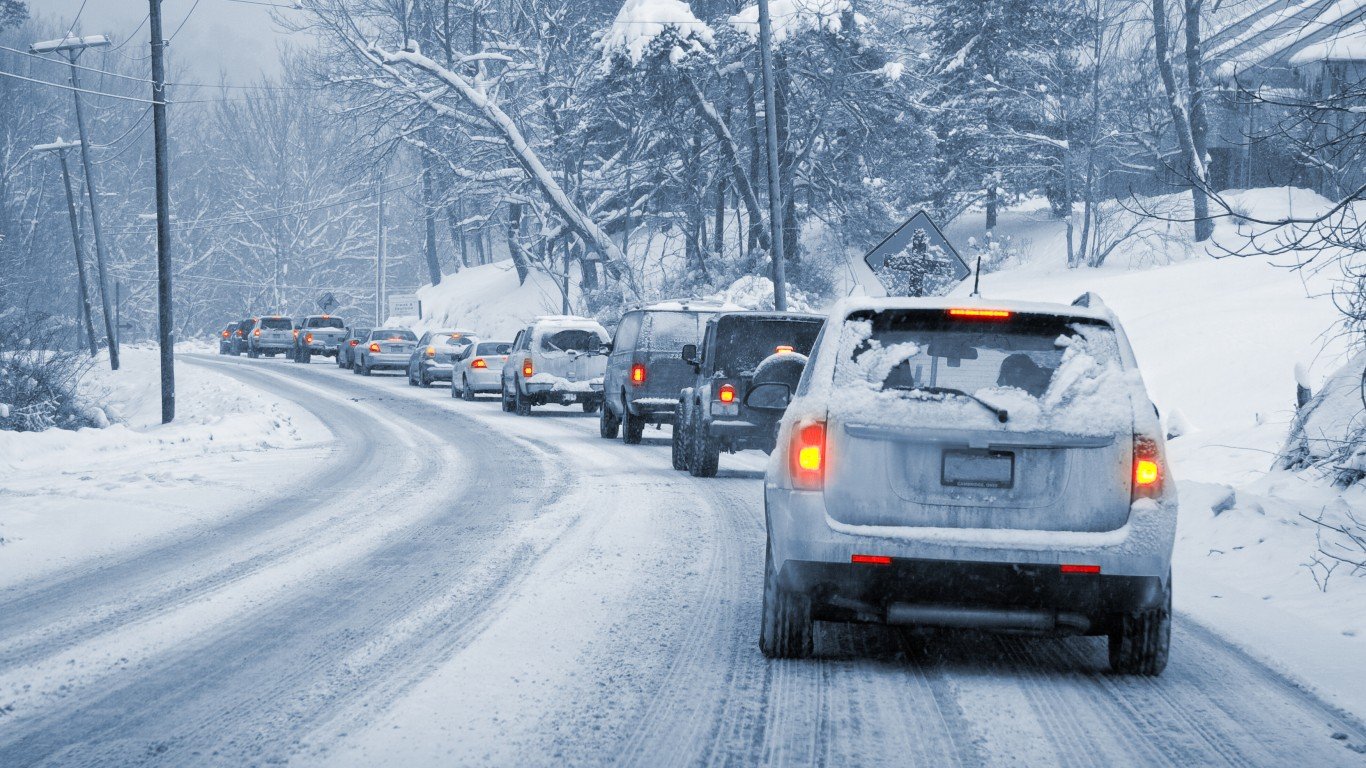
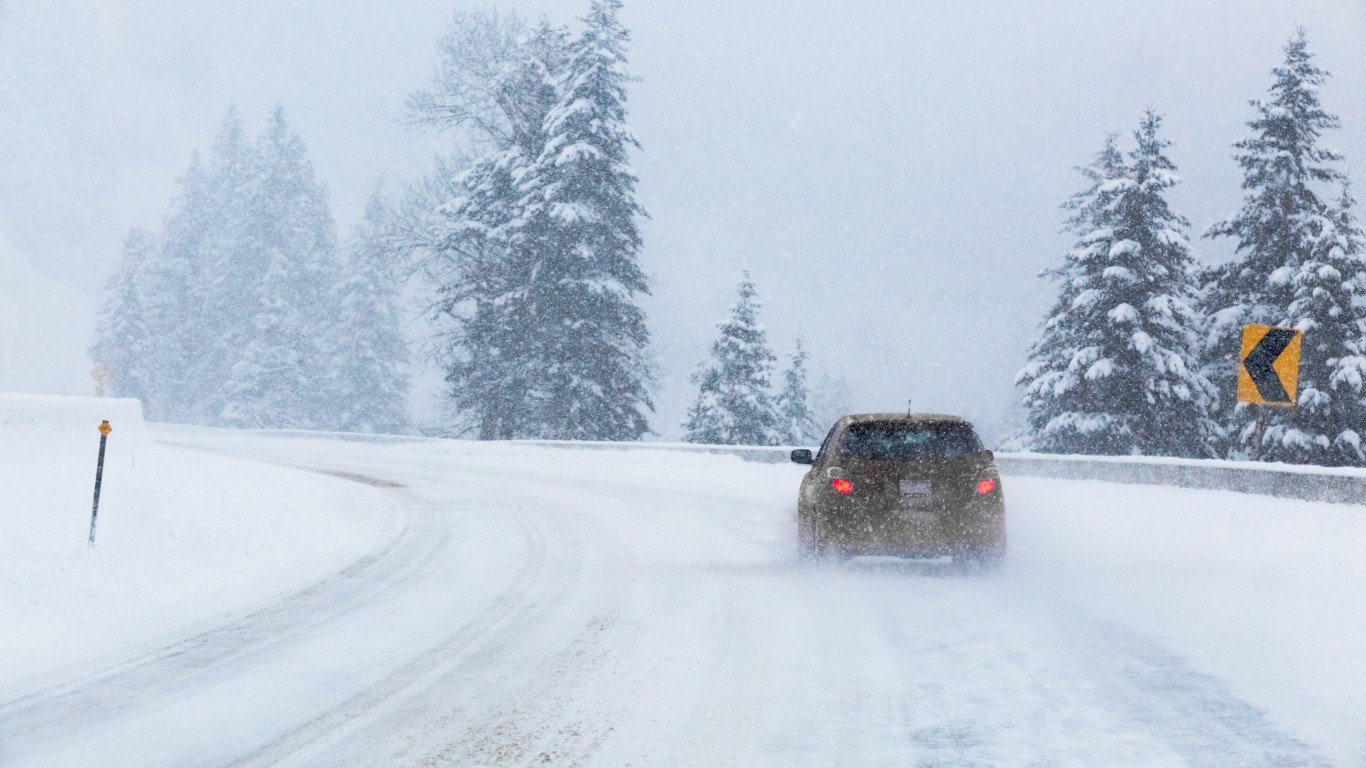
Personal vehicles have several advantages over the alternatives. Motorists are not beholden to the time-tables or predetermined routes of public transportation, and, unlike cyclists or pedestrians, can travel in comfort regardless of weather conditions,. But the freedom and convenience motor vehicles offer also come with some significant downsides.
With so many vehicles on the road, the typical American driver lost 51 hours to traffic congestion delays in 2022, according to transportation analytics company Inrix. Additionally, with the average price of a new vehicle topping $48,700 in December 2023, cars are major investments which, when left unattended, make obvious targets for thieves. Data from the National Insurance Crime Bureau shows that a vehicle was stolen nearly every 30 seconds in the U.S. in 2022. (Here is a look at the cities with the most car theft.)
Most importantly, getting behind the wheel is inherently dangerous. The National Highway Traffic Safety Administration reported nearly 336,000 fatal crashes in the U.S. over the 10 years ending in 2021. (These are the most dangerous cars on the road today.)
The drawbacks and risks associated with driving are especially pronounced in certain U.S. cities. Using metro area level data from a range of sources, 24/7 Wall St. identified the worst city for drivers in every state.
Within each state, metro areas were ranked on an index of three measures: deadly car accidents per 100,000 people in 2021, calculated using data from the NHTSA and the U.S. Census Bureau’s American Community Survey; reported car thefts per 100,000 people in 2022, as reported by the NICB; and average commute time in 2022 from the ACS.
It is important to note that four states – Delaware, New Hampshire, Rhode Island, and Vermont – have only one metropolitan area. As a result, the metro area listed in these states ranks as the worst by default only.
This is the worst city to drive in every state.
Alabama: Birmingham-Hoover

Source: SeanPavonePhoto / iStock via Getty Images
- Fatal crash rate in 2021: 16.5 per 100,000 people (17.4 per 100,000 in state)
- Total fatal crashes in 2021: 184 (885 in state)
- Vehicle theft rate in 2022: 308 per 100,000 people (209 per 100,000 in state)
- Total vehicle thefts reported in 2022: 3,444 (10,616 in state)
- Avg. commute time in 2022: 26.7 minutes (25.4 minutes in state)
- Metro areas considered in state: 12
Alaska: Anchorage

Source: Jacob Boomsma / iStock via Getty Images
- Fatal crash rate in 2021: 8.0 per 100,000 people (8.0 per 100,000 in state)
- Total fatal crashes in 2021: 32 (59 in state)
- Vehicle theft rate in 2022: 342 per 100,000 people (246 per 100,000 in state)
- Total vehicle thefts reported in 2022: 1,368 (1,802 in state)
- Avg. commute time in 2022: 23.2 minutes (19.4 minutes in state)
- Metro areas considered in state: 2
Arizona: Lake Havasu City-Kingman

Source: ginton / iStock via Getty Images
- Fatal crash rate in 2021: 24.5 per 100,000 people (14.4 per 100,000 in state)
- Total fatal crashes in 2021: 54 (1,063 in state)
- Vehicle theft rate in 2022: 278 per 100,000 people (295 per 100,000 in state)
- Total vehicle thefts reported in 2022: 614 (21,694 in state)
- Avg. commute time in 2022: 20.6 minutes (24.9 minutes in state)
- Metro areas considered in state: 6
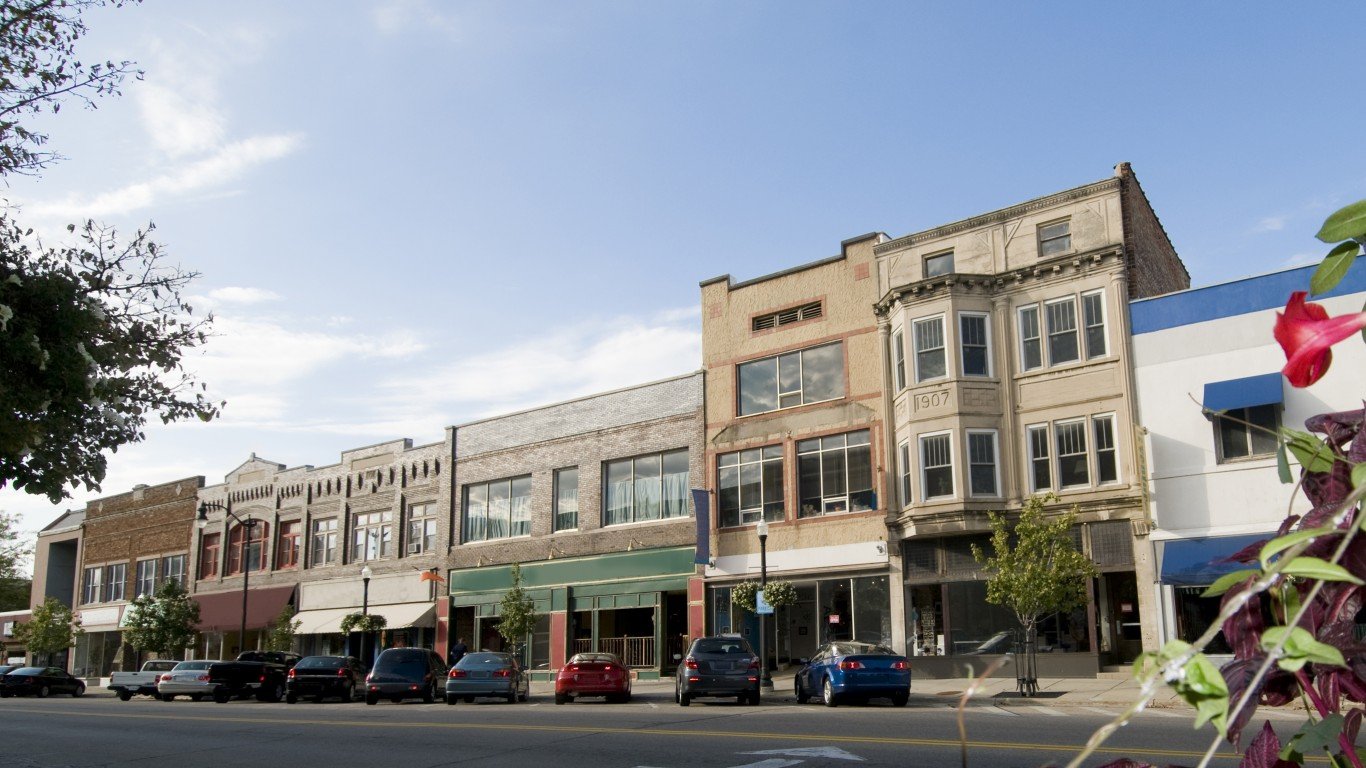
Arkansas: Pine Bluff
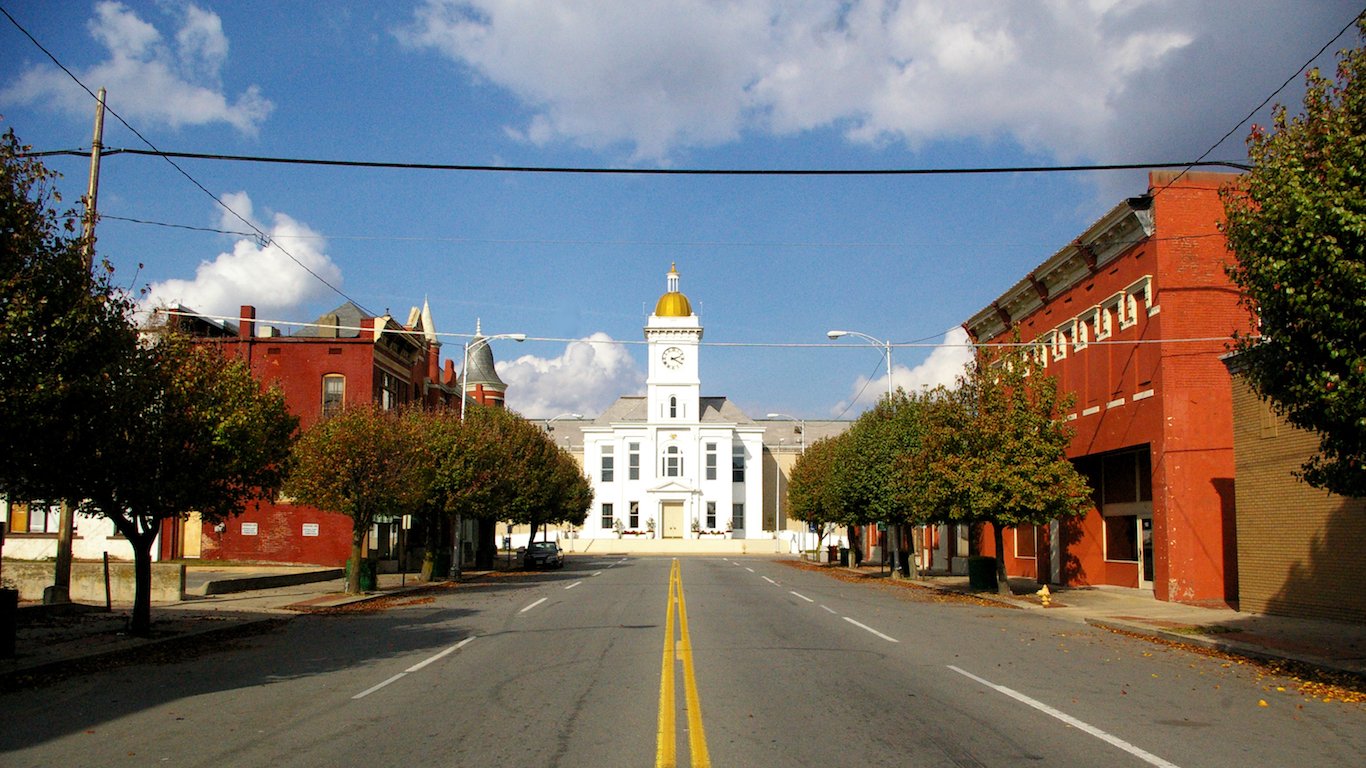
Source: Roland Klose / Wikimedia Commons
- Fatal crash rate in 2021: 22.5 per 100,000 people (20.7 per 100,000 in state)
- Total fatal crashes in 2021: 19 (631 in state)
- Vehicle theft rate in 2022: 470 per 100,000 people (270 per 100,000 in state)
- Total vehicle thefts reported in 2022: 398 (8,216 in state)
- Avg. commute time in 2022: 20.5 minutes (22.4 minutes in state)
- Metro areas considered in state: 6
California: Bakersfield
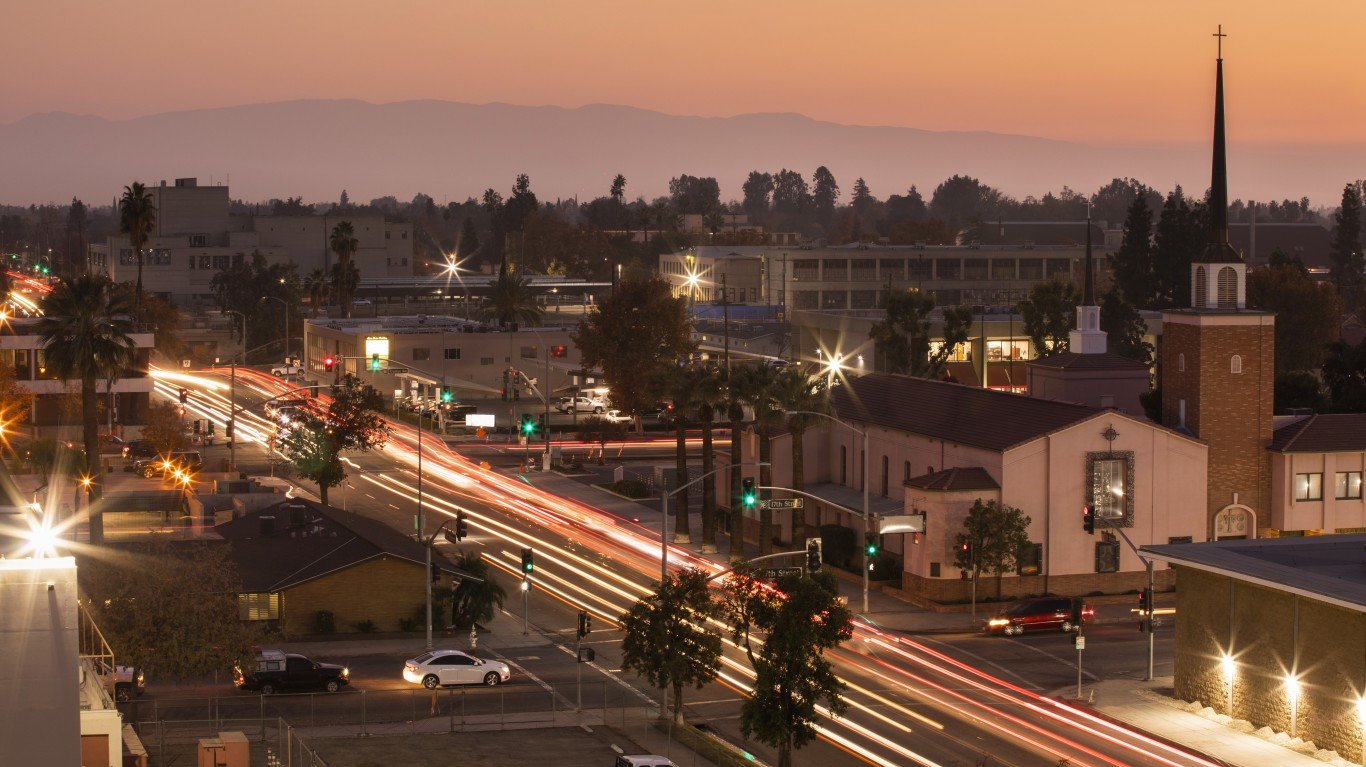
Source: MattGush / iStock via Getty Images
- Fatal crash rate in 2021: 21.2 per 100,000 people (10.2 per 100,000 in state)
- Total fatal crashes in 2021: 194 (3,983 in state)
- Vehicle theft rate in 2022: 1,072 per 100,000 people (520 per 100,000 in state)
- Total vehicle thefts reported in 2022: 9,824 (203,018 in state)
- Avg. commute time in 2022: 24.5 minutes (28.3 minutes in state)
- Metro areas considered in state: 26
Colorado: Pueblo
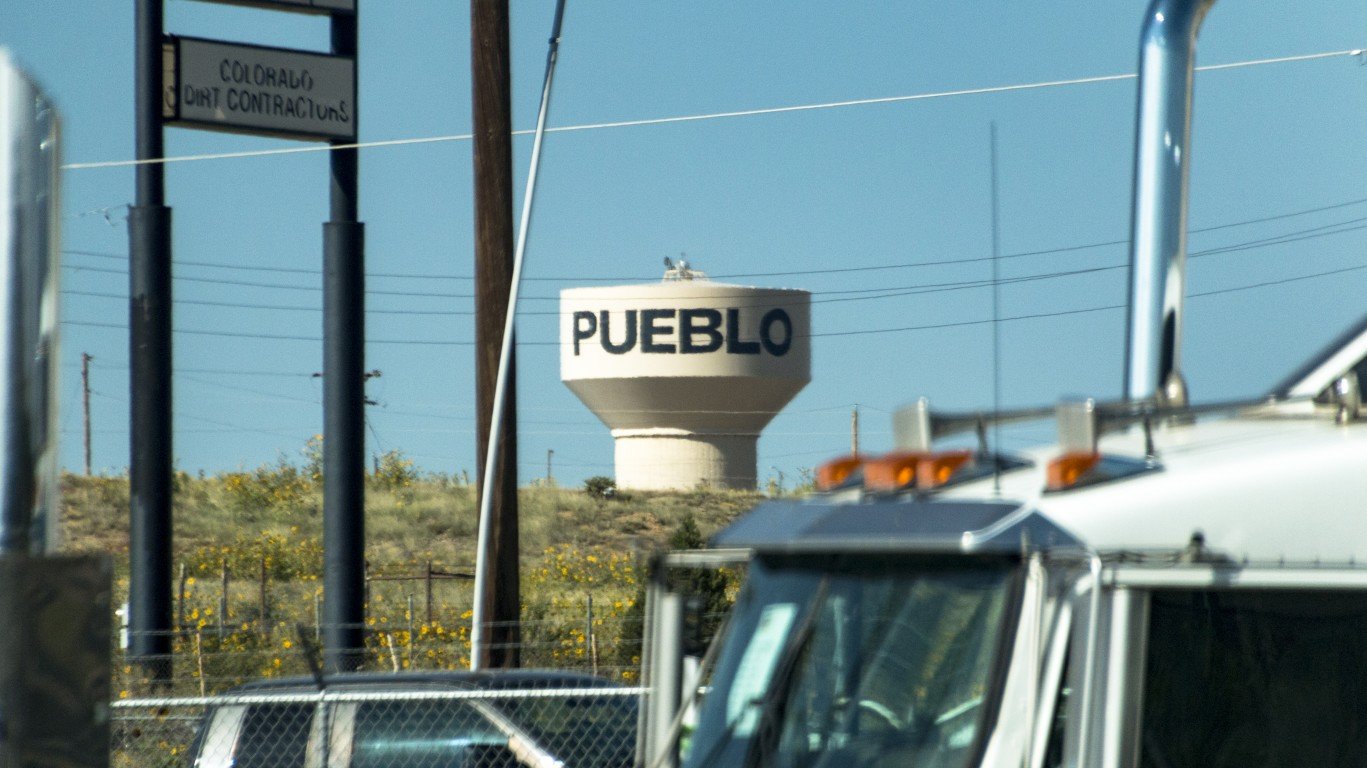
Source: sequential5 / Getty Images
- Fatal crash rate in 2021: 18.9 per 100,000 people (10.9 per 100,000 in state)
- Total fatal crashes in 2021: 32 (638 in state)
- Vehicle theft rate in 2022: 1,086 per 100,000 people (731 per 100,000 in state)
- Total vehicle thefts reported in 2022: 1,842 (42,706 in state)
- Avg. commute time in 2022: 24.7 minutes (25.0 minutes in state)
- Metro areas considered in state: 7
Connecticut: New Haven-Milford
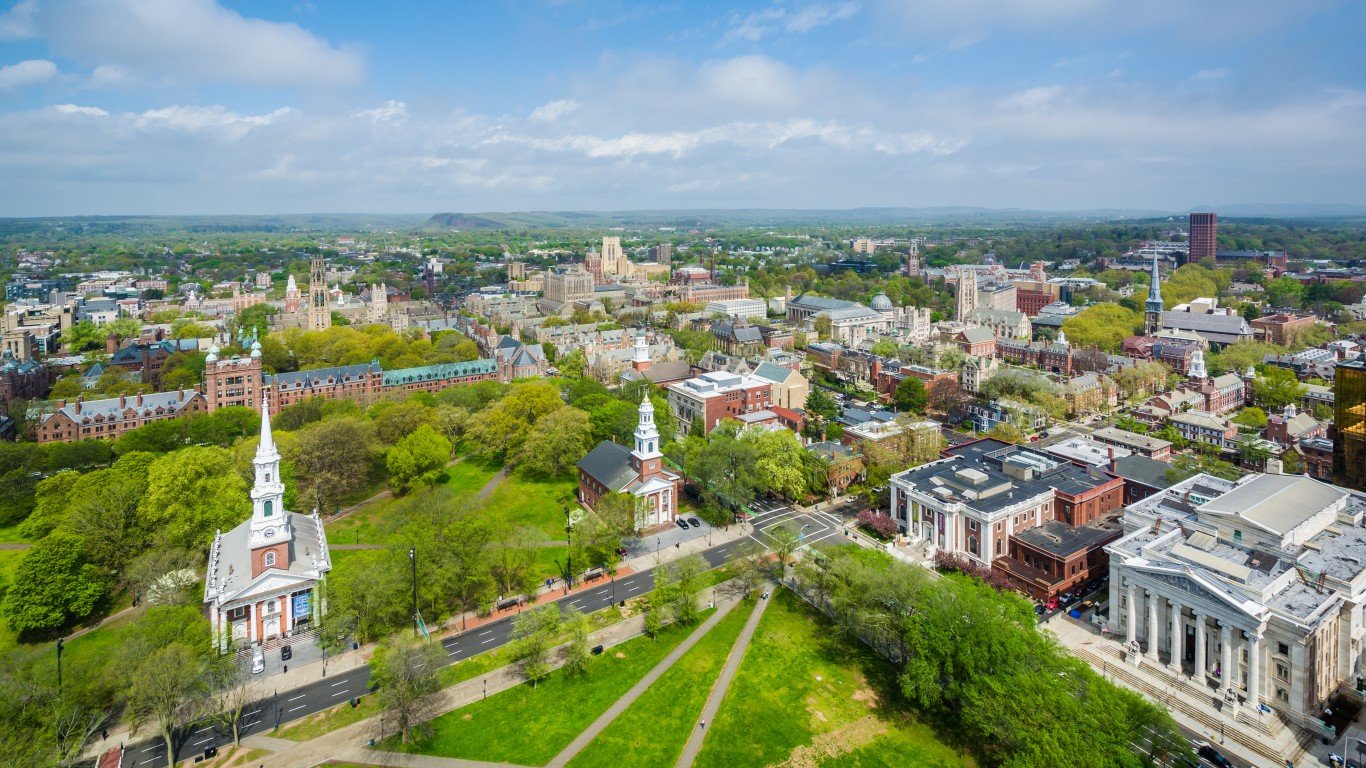
Source: Jon Bilous / iStock via Getty Images
- Fatal crash rate in 2021: 9.5 per 100,000 people (7.8 per 100,000 in state)
- Total fatal crashes in 2021: 83 (283 in state)
- Vehicle theft rate in 2022: 315 per 100,000 people (196 per 100,000 in state)
- Total vehicle thefts reported in 2022: 2,740 (7,091 in state)
- Avg. commute time in 2022: 25.9 minutes (26.8 minutes in state)
- Metro areas considered in state: 4
Delaware: Dover
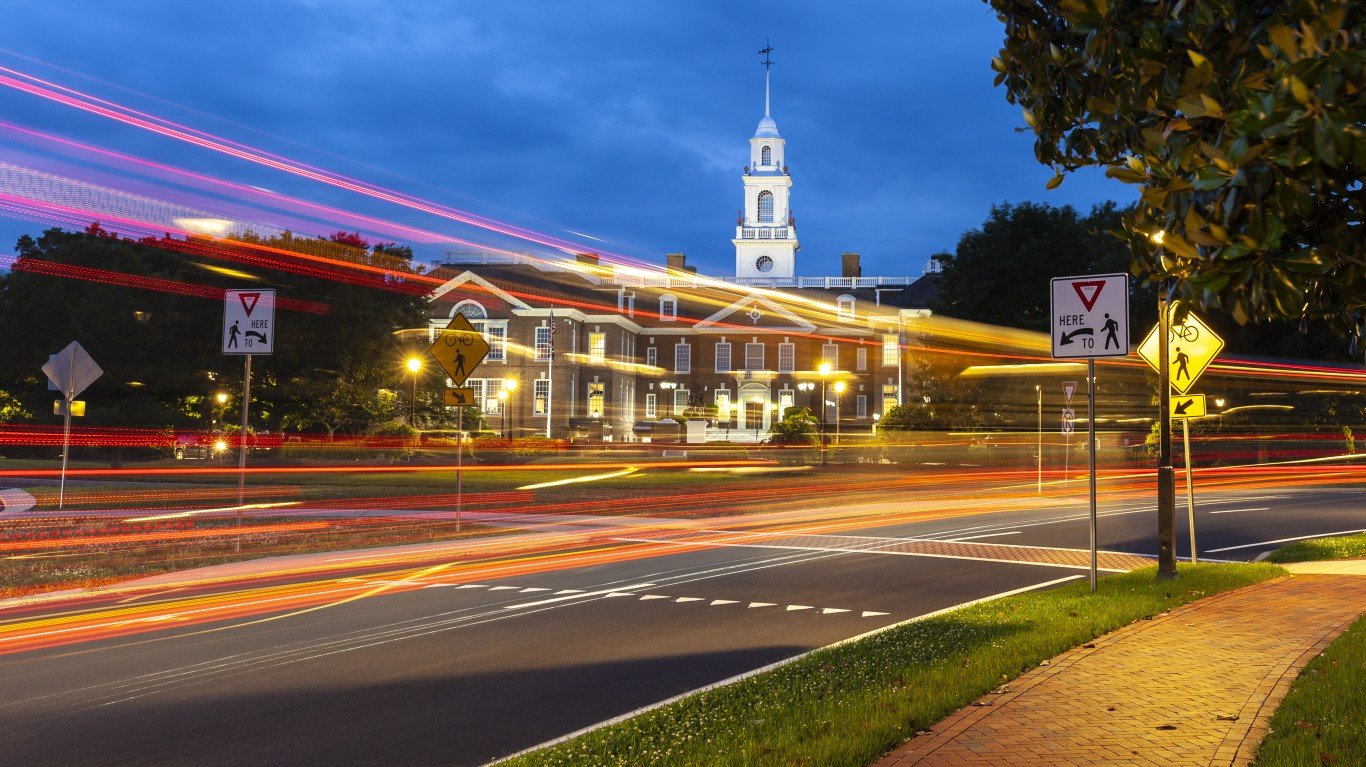
Source: traveler1116 / E+ via Getty Images
- Fatal crash rate in 2021: 19.3 per 100,000 people (13.0 per 100,000 in state)
- Total fatal crashes in 2021: 36 (132 in state)
- Vehicle theft rate in 2022: 215 per 100,000 people (185 per 100,000 in state)
- Total vehicle thefts reported in 2022: 401 (1,879 in state)
- Avg. commute time in 2022: 27.2 minutes (26.1 minutes in state)
- Metro areas considered in state: 1
Florida: Sebring-Avon Park
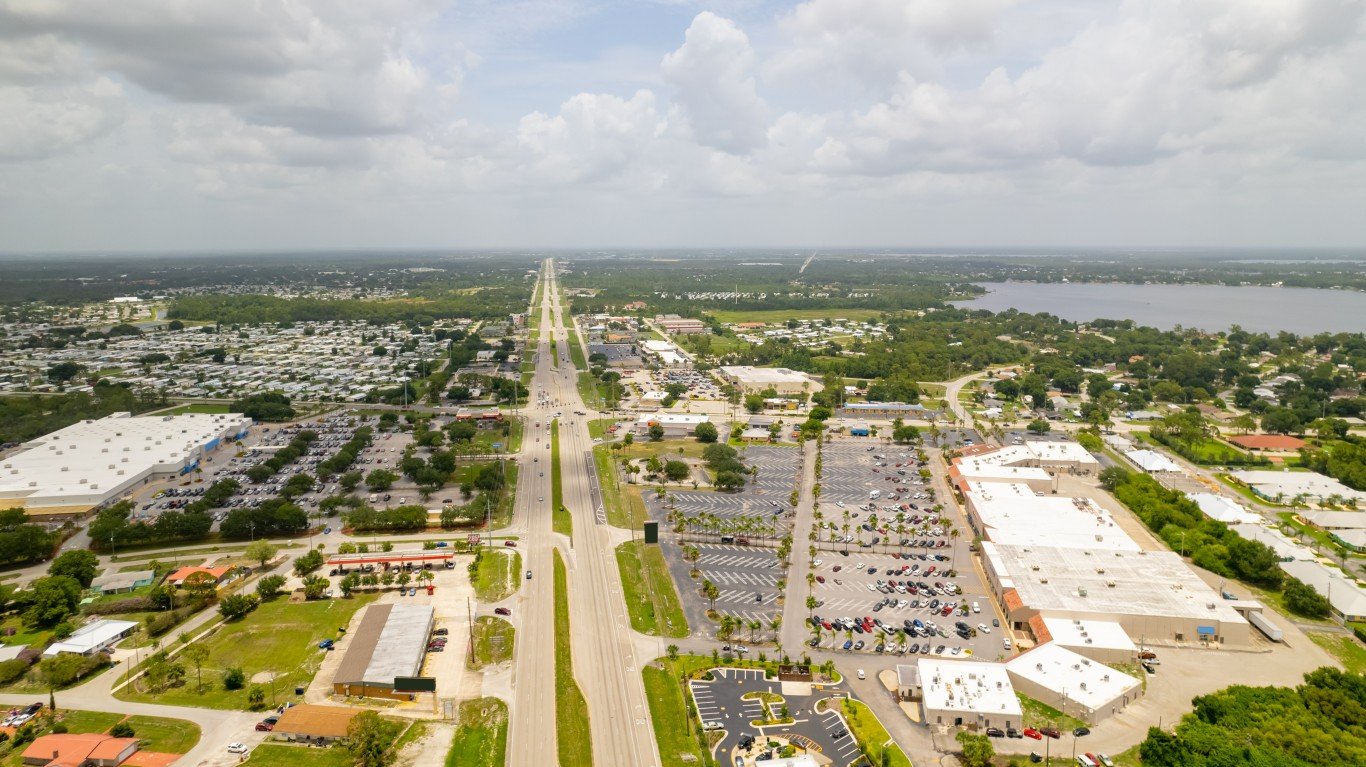
Source: felixmizioznikov / iStock via Getty Images
- Fatal crash rate in 2021: 30.3 per 100,000 people (15.5 per 100,000 in state)
- Total fatal crashes in 2021: 32 (3,451 in state)
- Vehicle theft rate in 2022: 189 per 100,000 people (207 per 100,000 in state)
- Total vehicle thefts reported in 2022: 200 (46,020 in state)
- Avg. commute time in 2022: 26.0 minutes (28.0 minutes in state)
- Metro areas considered in state: 22
Georgia: Macon-Bibb County
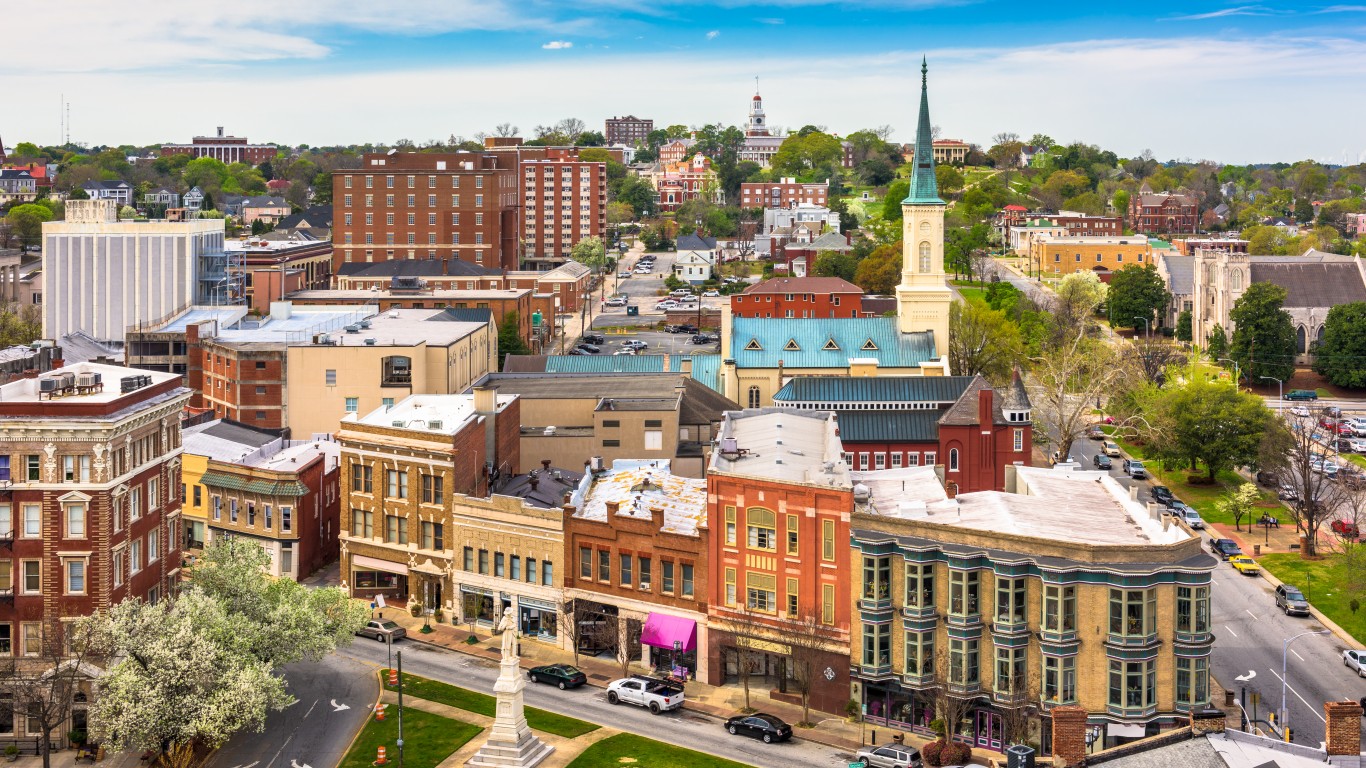
Source: Sean Pavone / iStock via Getty Images
- Fatal crash rate in 2021: 28.0 per 100,000 people (15.3 per 100,000 in state)
- Total fatal crashes in 2021: 66 (1,670 in state)
- Vehicle theft rate in 2022: 456 per 100,000 people (244 per 100,000 in state)
- Total vehicle thefts reported in 2022: 1,066 (26,612 in state)
- Avg. commute time in 2022: 25.0 minutes (28.2 minutes in state)
- Metro areas considered in state: 14
Hawaii: Honolulu

Source: tankbmb / iStock via Getty Images
- Fatal crash rate in 2021: 5.0 per 100,000 people (6.5 per 100,000 in state)
- Total fatal crashes in 2021: 50 (94 in state)
- Vehicle theft rate in 2022: 265 per 100,000 people (183 per 100,000 in state)
- Total vehicle thefts reported in 2022: 2,638 (2,639 in state)
- Avg. commute time in 2022: 26.7 minutes (26.1 minutes in state)
- Metro areas considered in state: 2
Idaho: Idaho Falls

Source: Richard Schafer / iStock via Getty Images
- Fatal crash rate in 2021: 14.5 per 100,000 people (12.6 per 100,000 in state)
- Total fatal crashes in 2021: 24 (244 in state)
- Vehicle theft rate in 2022: 120 per 100,000 people (91 per 100,000 in state)
- Total vehicle thefts reported in 2022: 198 (1,766 in state)
- Avg. commute time in 2022: 22.5 minutes (22.1 minutes in state)
- Metro areas considered in state: 6
Illinois: Chicago-Naperville-Elgin
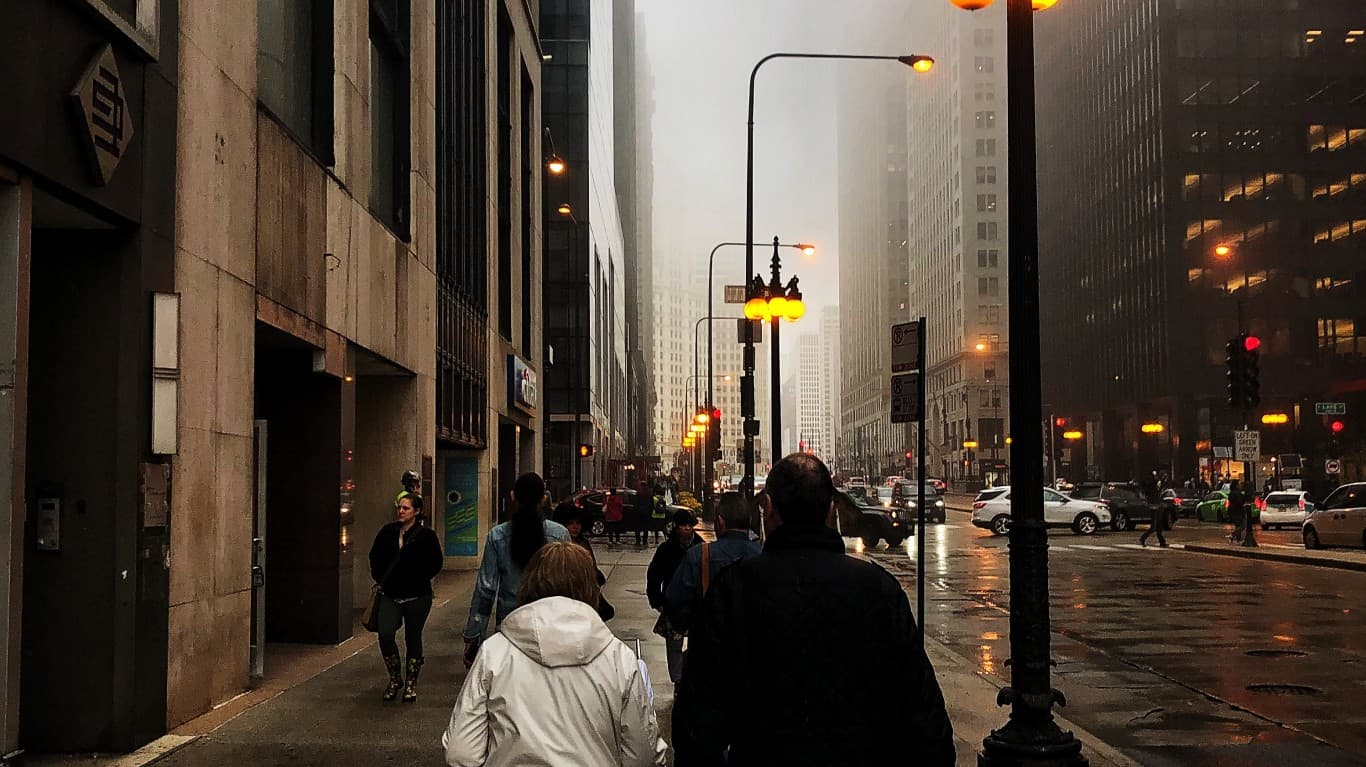
Source: nsolop / Flickr
- Fatal crash rate in 2021: 8.1 per 100,000 people (9.6 per 100,000 in state)
- Total fatal crashes in 2021: 761 (1,210 in state)
- Vehicle theft rate in 2022: 351 per 100,000 people (308 per 100,000 in state)
- Total vehicle thefts reported in 2022: 33,089 (38,699 in state)
- Avg. commute time in 2022: 30.2 minutes (27.9 minutes in state)
- Metro areas considered in state: 10
Indiana: Indianapolis-Carmel-Anderson
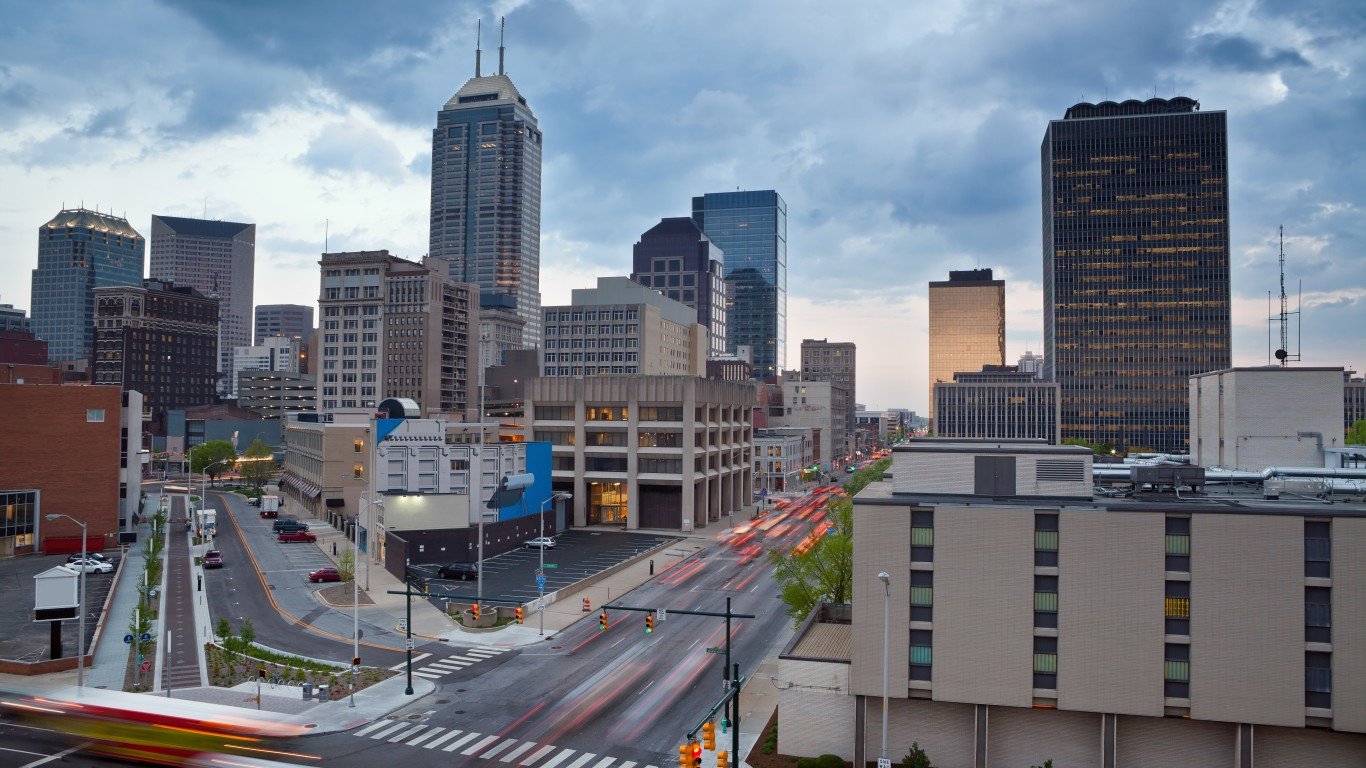
Source: RudyBalasko / Getty Images
- Fatal crash rate in 2021: 11.5 per 100,000 people (12.6 per 100,000 in state)
- Total fatal crashes in 2021: 247 (863 in state)
- Vehicle theft rate in 2022: 340 per 100,000 people (226 per 100,000 in state)
- Total vehicle thefts reported in 2022: 7,273 (15,440 in state)
- Avg. commute time in 2022: 25.6 minutes (24.1 minutes in state)
- Metro areas considered in state: 12
Iowa: Davenport-Moline-Rock Island

Source: DenisTangneyJr / E+ via Getty Images
- Fatal crash rate in 2021: 7.9 per 100,000 people (10.3 per 100,000 in state)
- Total fatal crashes in 2021: 30 (329 in state)
- Vehicle theft rate in 2022: 352 per 100,000 people (168 per 100,000 in state)
- Total vehicle thefts reported in 2022: 1,335 (5,379 in state)
- Avg. commute time in 2022: 20.1 minutes (19.7 minutes in state)
- Metro areas considered in state: 8
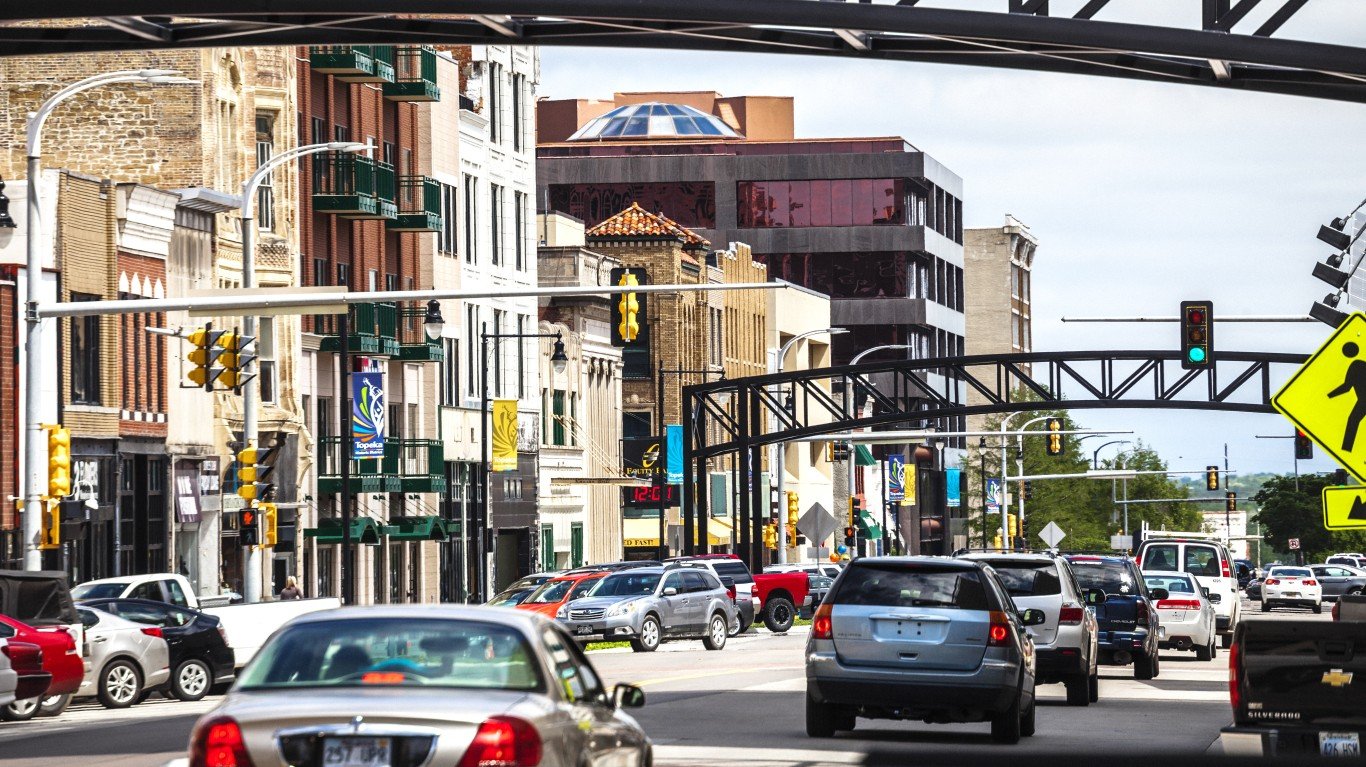
Kansas: Topeka
Source: peeterv / iStock via Getty Images
- Fatal crash rate in 2021: 16.0 per 100,000 people (13.0 per 100,000 in state)
- Total fatal crashes in 2021: 37 (381 in state)
- Vehicle theft rate in 2022: 383 per 100,000 people (292 per 100,000 in state)
- Total vehicle thefts reported in 2022: 887 (8,588 in state)
- Avg. commute time in 2022: 21.0 minutes (19.6 minutes in state)
- Metro areas considered in state: 4
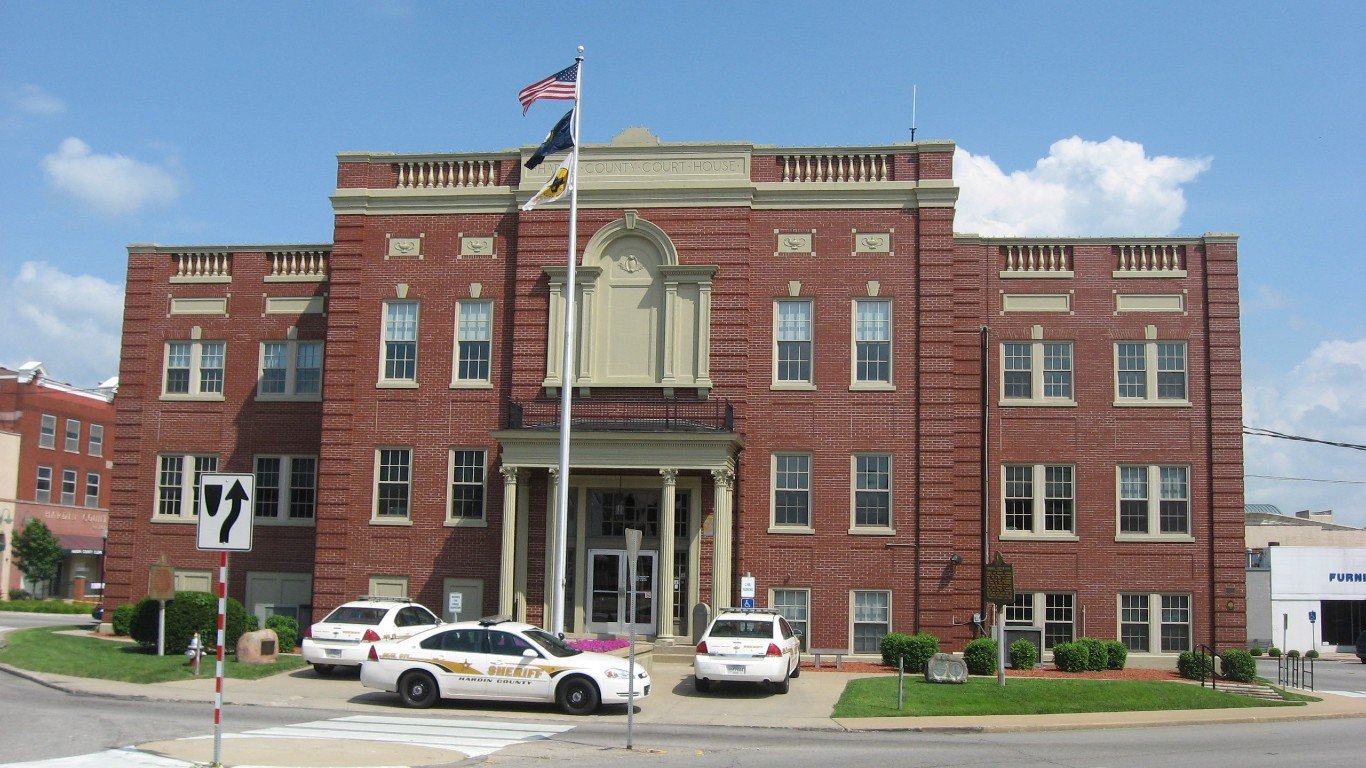
Kentucky: Elizabethtown-Fort Knox
Source: By Nyttend - Own work, Public Domain, https://commons.wikimedia.org/w/index.php?curid=15978914
- Fatal crash rate in 2021: 22.2 per 100,000 people (16.3 per 100,000 in state)
- Total fatal crashes in 2021: 35 (734 in state)
- Vehicle theft rate in 2022: 143 per 100,000 people (226 per 100,000 in state)
- Total vehicle thefts reported in 2022: 224 (10,217 in state)
- Avg. commute time in 2022: 24.7 minutes (24.1 minutes in state)
- Metro areas considered in state: 5
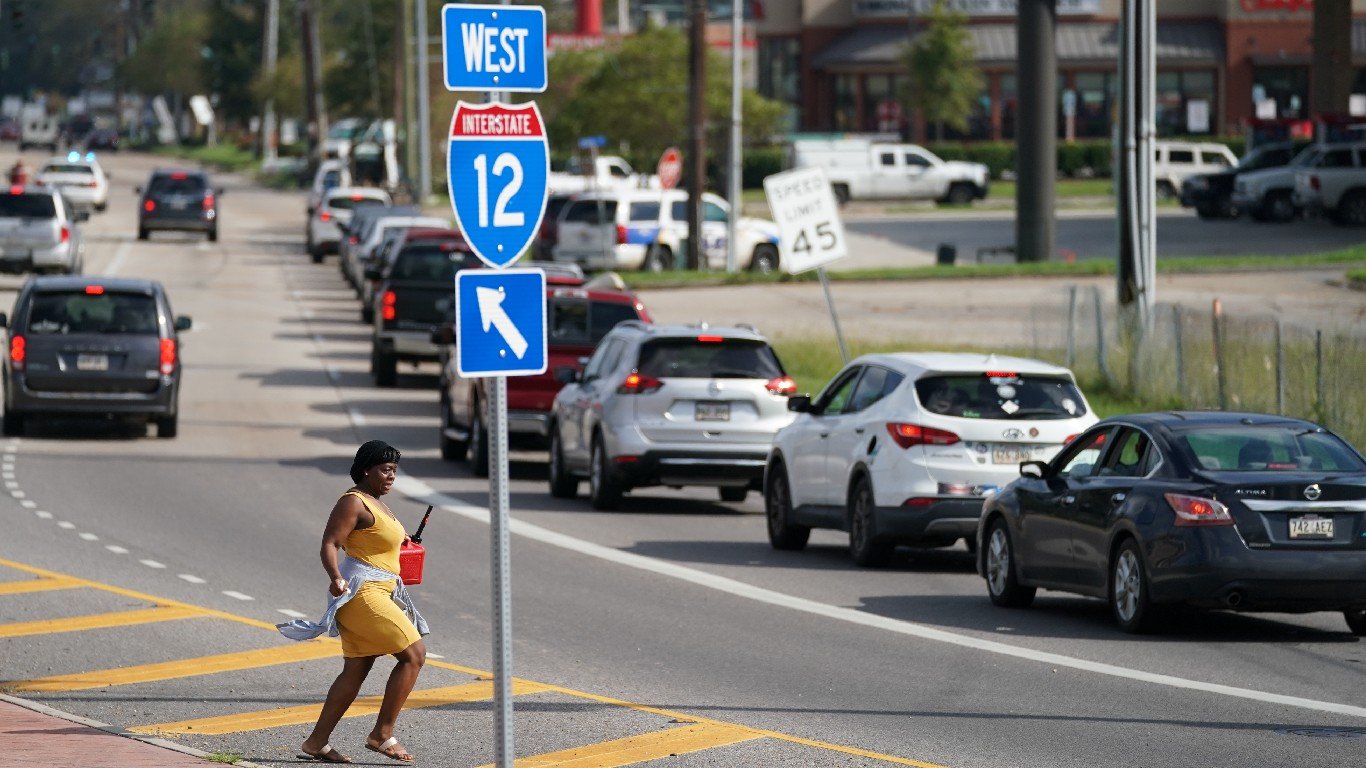
Louisiana: Hammond
Source: Sean Rayford / Stringer / Getty Images North America
- Fatal crash rate in 2021: 19.0 per 100,000 people (19.3 per 100,000 in state)
- Total fatal crashes in 2021: 26 (887 in state)
- Vehicle theft rate in 2022: 231 per 100,000 people (297 per 100,000 in state)
- Total vehicle thefts reported in 2022: 317 (13,638 in state)
- Avg. commute time in 2022: 30.7 minutes (25.6 minutes in state)
- Metro areas considered in state: 9
Maine: Portland-South Portland
Source: zhudifeng / iStock via Getty Images
- Fatal crash rate in 2021: 6.8 per 100,000 people (9.7 per 100,000 in state)
- Total fatal crashes in 2021: 38 (135 in state)
- Vehicle theft rate in 2022: 60 per 100,000 people (68 per 100,000 in state)
- Total vehicle thefts reported in 2022: 334 (944 in state)
- Avg. commute time in 2022: 25.6 minutes (24.7 minutes in state)
- Metro areas considered in state: 3
Maryland: California-Lexington Park
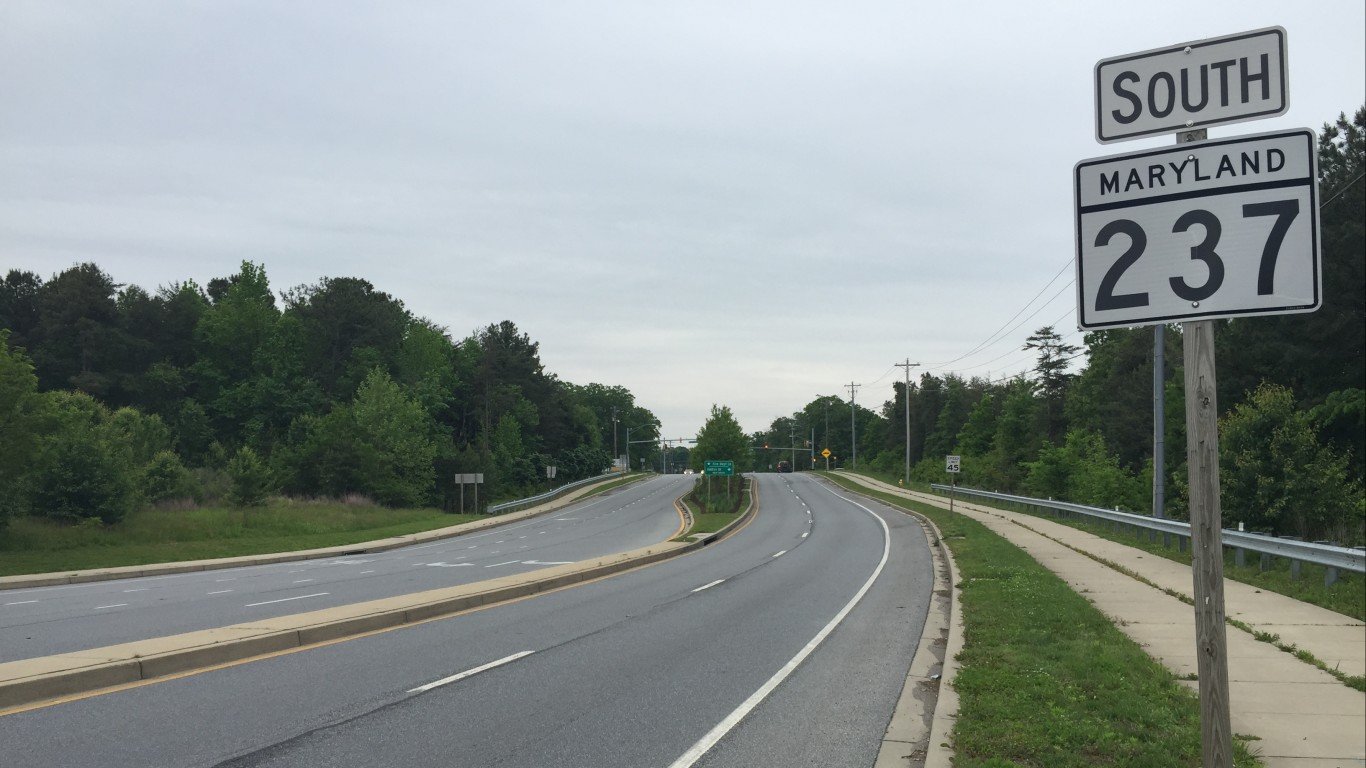
Source: Famartin / Wikimedia Commons
- Fatal crash rate in 2021: 14.8 per 100,000 people (8.5 per 100,000 in state)
- Total fatal crashes in 2021: 17 (522 in state)
- Vehicle theft rate in 2022: 75 per 100,000 people (261 per 100,000 in state)
- Total vehicle thefts reported in 2022: 86 (16,086 in state)
- Avg. commute time in 2022: 28.7 minutes (30.8 minutes in state)
- Metro areas considered in state: 5
Massachusetts: Boston-Cambridge-Newton
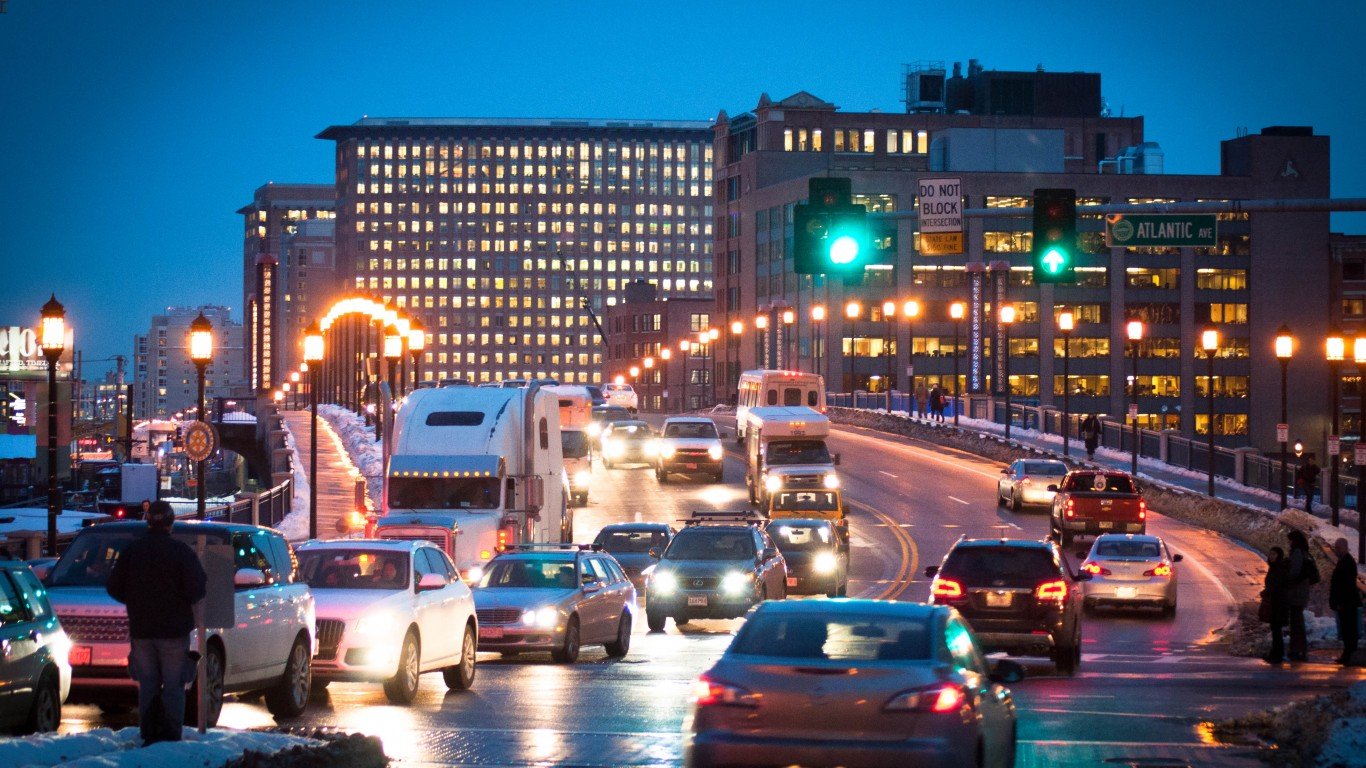
Source: pocheco / Flickr
- Fatal crash rate in 2021: 4.8 per 100,000 people (5.7 per 100,000 in state)
- Total fatal crashes in 2021: 237 (397 in state)
- Vehicle theft rate in 2022: 94 per 100,000 people (102 per 100,000 in state)
- Total vehicle thefts reported in 2022: 4,619 (7,084 in state)
- Avg. commute time in 2022: 30.1 minutes (28.6 minutes in state)
- Metro areas considered in state: 5
Michigan: Kalamazoo-Portage

Source: Sean Pavone / iStock via Getty Images
- Fatal crash rate in 2021: 20.7 per 100,000 people (10.7 per 100,000 in state)
- Total fatal crashes in 2021: 54 (1,072 in state)
- Vehicle theft rate in 2022: 365 per 100,000 people (257 per 100,000 in state)
- Total vehicle thefts reported in 2022: 952 (25,753 in state)
- Avg. commute time in 2022: 20.9 minutes (24.2 minutes in state)
- Metro areas considered in state: 14
Minnesota: Minneapolis-St. Paul-Bloomington
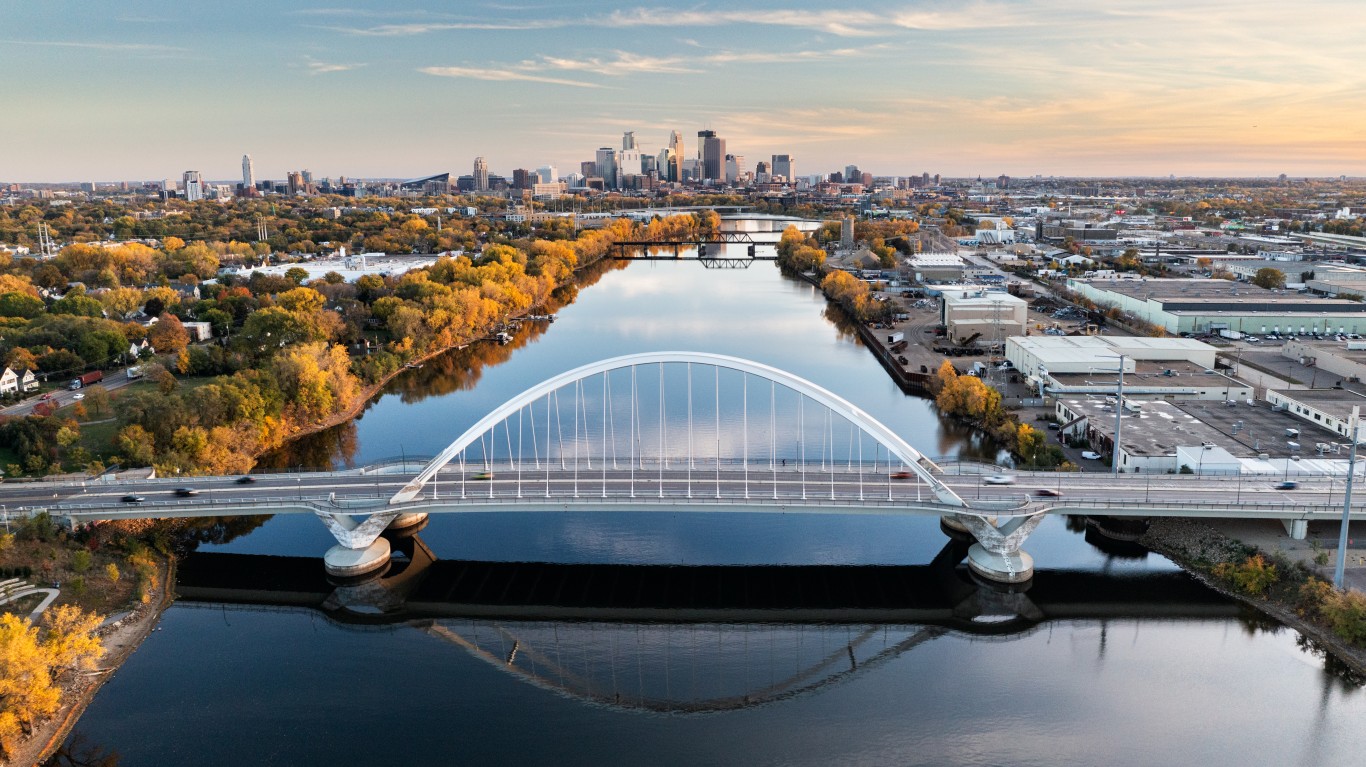
Source: jimkruger / E+ via Getty Images
- Fatal crash rate in 2021: 6.3 per 100,000 people (7.9 per 100,000 in state)
- Total fatal crashes in 2021: 233 (451 in state)
- Vehicle theft rate in 2022: 418 per 100,000 people (312 per 100,000 in state)
- Total vehicle thefts reported in 2022: 15,429 (17,832 in state)
- Avg. commute time in 2022: 24.0 minutes (22.8 minutes in state)
- Metro areas considered in state: 5
Mississippi: Hattiesburg

Source: DenisTangneyJr / iStock via Getty Images
- Fatal crash rate in 2021: 19.7 per 100,000 people (23.7 per 100,000 in state)
- Total fatal crashes in 2021: 34 (697 in state)
- Vehicle theft rate in 2022: 260 per 100,000 people (209 per 100,000 in state)
- Total vehicle thefts reported in 2022: 450 (6,150 in state)
- Avg. commute time in 2022: 25.6 minutes (25.5 minutes in state)
- Metro areas considered in state: 3
Missouri: St. Louis

Source: f11photo / iStock via Getty Images
- Fatal crash rate in 2021: 12.6 per 100,000 people (15.1 per 100,000 in state)
- Total fatal crashes in 2021: 354 (931 in state)
- Vehicle theft rate in 2022: 538 per 100,000 people (483 per 100,000 in state)
- Total vehicle thefts reported in 2022: 15,063 (29,815 in state)
- Avg. commute time in 2022: 24.8 minutes (23.7 minutes in state)
- Metro areas considered in state: 8
Montana: Billings
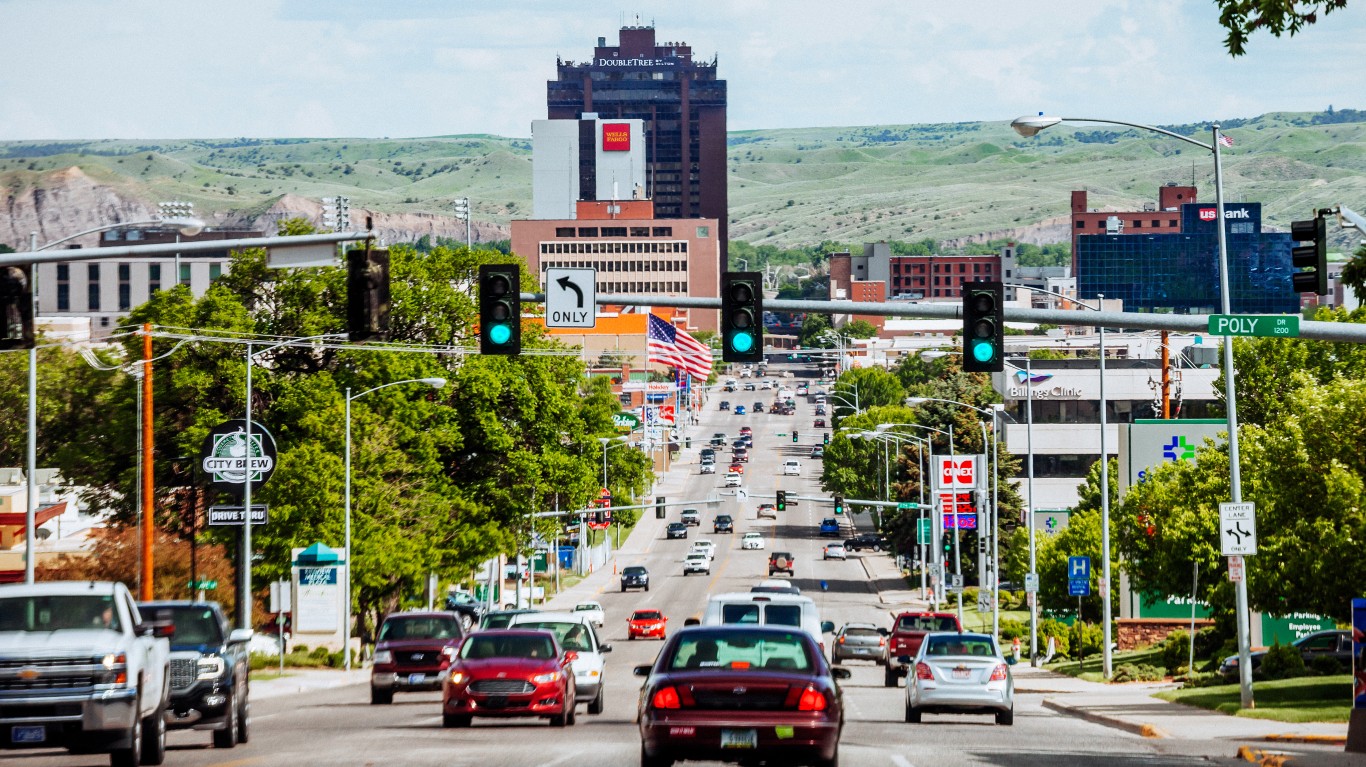
Source: peeterv / iStock via Getty Images
- Fatal crash rate in 2021: 15.2 per 100,000 people (19.8 per 100,000 in state)
- Total fatal crashes in 2021: 29 (222 in state)
- Vehicle theft rate in 2022: 448 per 100,000 people (224 per 100,000 in state)
- Total vehicle thefts reported in 2022: 852 (2,512 in state)
- Avg. commute time in 2022: 20.2 minutes (19.0 minutes in state)
- Metro areas considered in state: 3
Nebraska: Omaha-Council Bluffs

Source: Davel5957 / iStock via Getty Images
- Fatal crash rate in 2021: 7.3 per 100,000 people (9.8 per 100,000 in state)
- Total fatal crashes in 2021: 71 (192 in state)
- Vehicle theft rate in 2022: 389 per 100,000 people (257 per 100,000 in state)
- Total vehicle thefts reported in 2022: 3,795 (5,058 in state)
- Avg. commute time in 2022: 20.4 minutes (18.8 minutes in state)
- Metro areas considered in state: 3
Nevada: Las Vegas-Henderson-Paradise

Source: franckreporter / iStock via Getty Images
- Fatal crash rate in 2021: 9.7 per 100,000 people (11.3 per 100,000 in state)
- Total fatal crashes in 2021: 225 (360 in state)
- Vehicle theft rate in 2022: 562 per 100,000 people (481 per 100,000 in state)
- Total vehicle thefts reported in 2022: 13,051 (15,279 in state)
- Avg. commute time in 2022: 24.6 minutes (24.5 minutes in state)
- Metro areas considered in state: 3
New Hampshire: Manchester-Nashua

Source: Sean Pavone / iStock via Getty Images
- Fatal crash rate in 2021: 6.8 per 100,000 people (7.6 per 100,000 in state)
- Total fatal crashes in 2021: 29 (106 in state)
- Vehicle theft rate in 2022: 73 per 100,000 people (54 per 100,000 in state)
- Total vehicle thefts reported in 2022: 310 (750 in state)
- Avg. commute time in 2022: 26.9 minutes (26.7 minutes in state)
- Metro areas considered in state: 1
New Jersey: Atlantic City-Hammonton
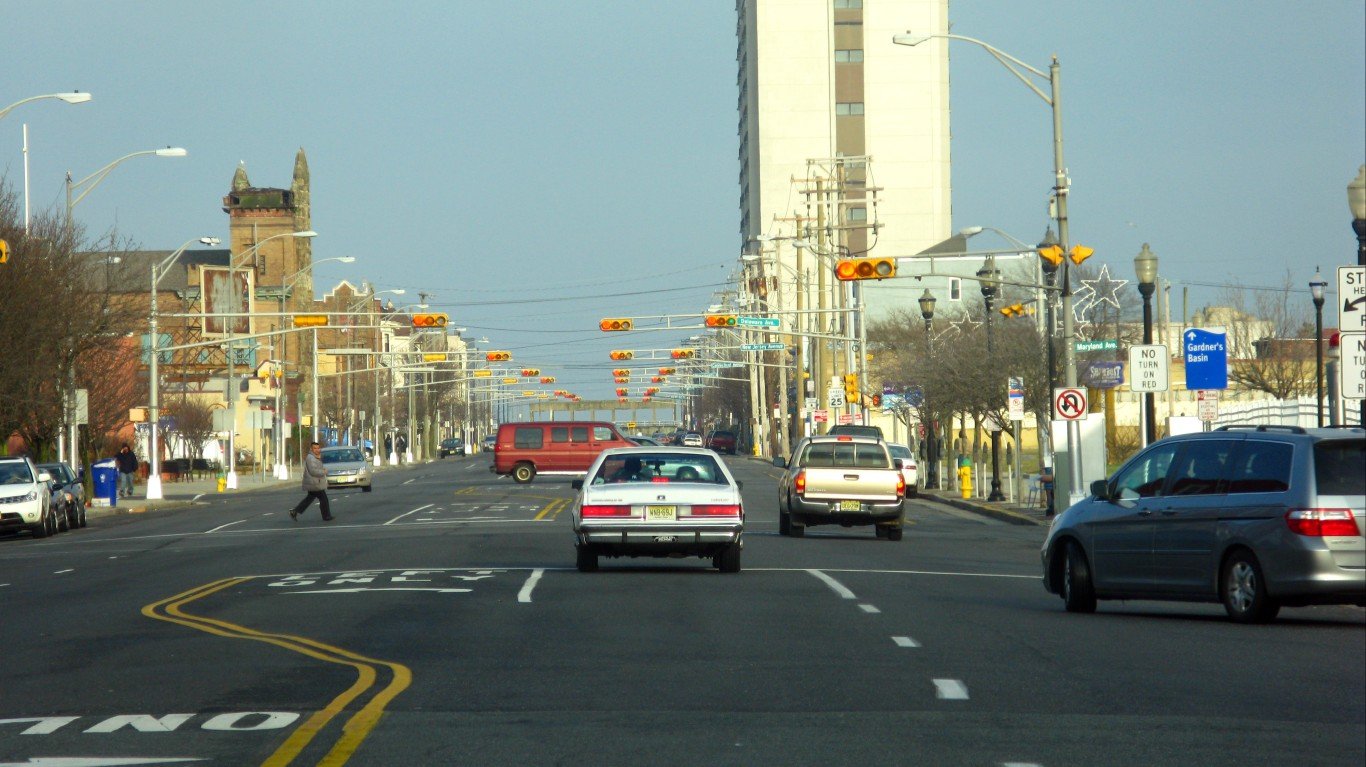
Source: thisisbossi / Flickr
- Fatal crash rate in 2021: 16.7 per 100,000 people (7.2 per 100,000 in state)
- Total fatal crashes in 2021: 46 (669 in state)
- Vehicle theft rate in 2022: 201 per 100,000 people (175 per 100,000 in state)
- Total vehicle thefts reported in 2022: 554 (16,165 in state)
- Avg. commute time in 2022: 24.8 minutes (30.3 minutes in state)
- Metro areas considered in state: 4
New Mexico: Albuquerque
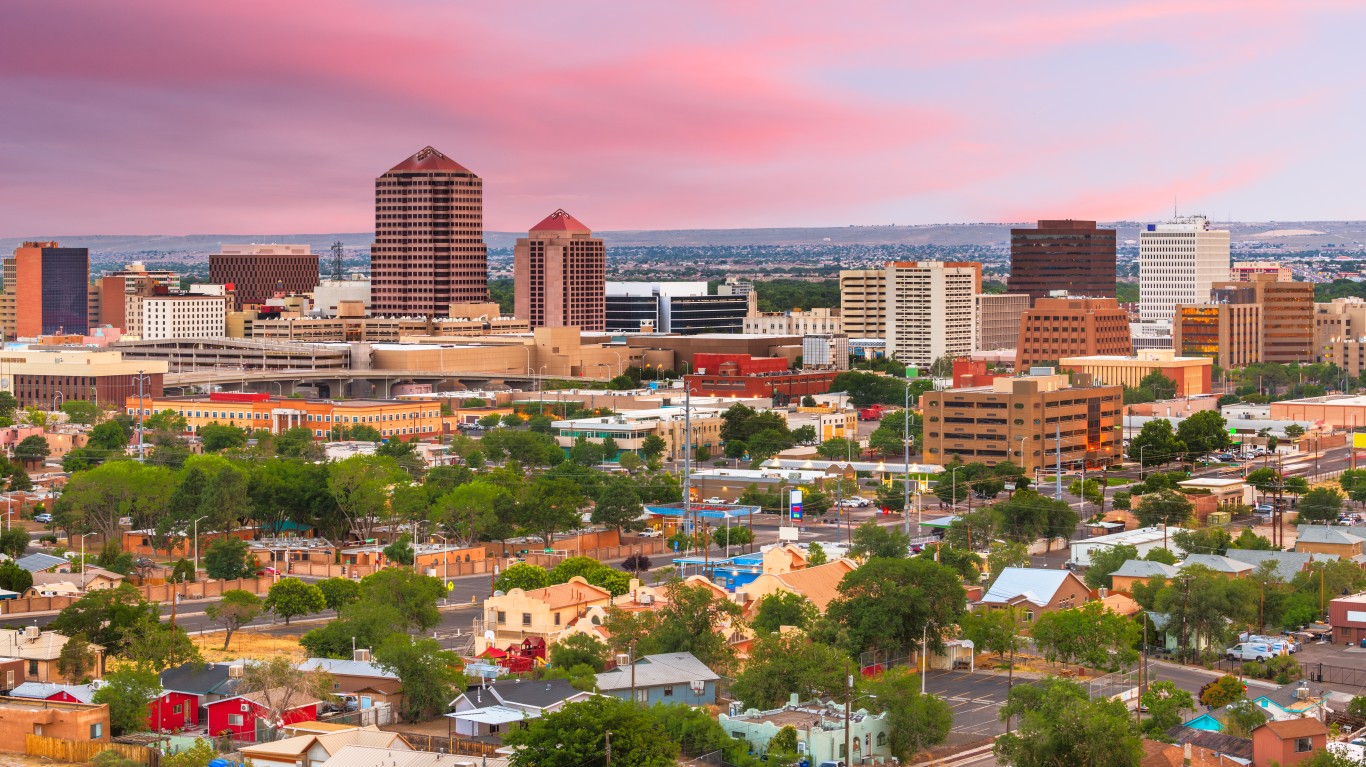
Source: Sean Pavone / iStock via Getty Images
- Fatal crash rate in 2021: 18.4 per 100,000 people (20.2 per 100,000 in state)
- Total fatal crashes in 2021: 170 (427 in state)
- Vehicle theft rate in 2022: 795 per 100,000 people (541 per 100,000 in state)
- Total vehicle thefts reported in 2022: 7,312 (11,424 in state)
- Avg. commute time in 2022: 25.4 minutes (23.7 minutes in state)
- Metro areas considered in state: 4
New York: New York-Newark-Jersey City
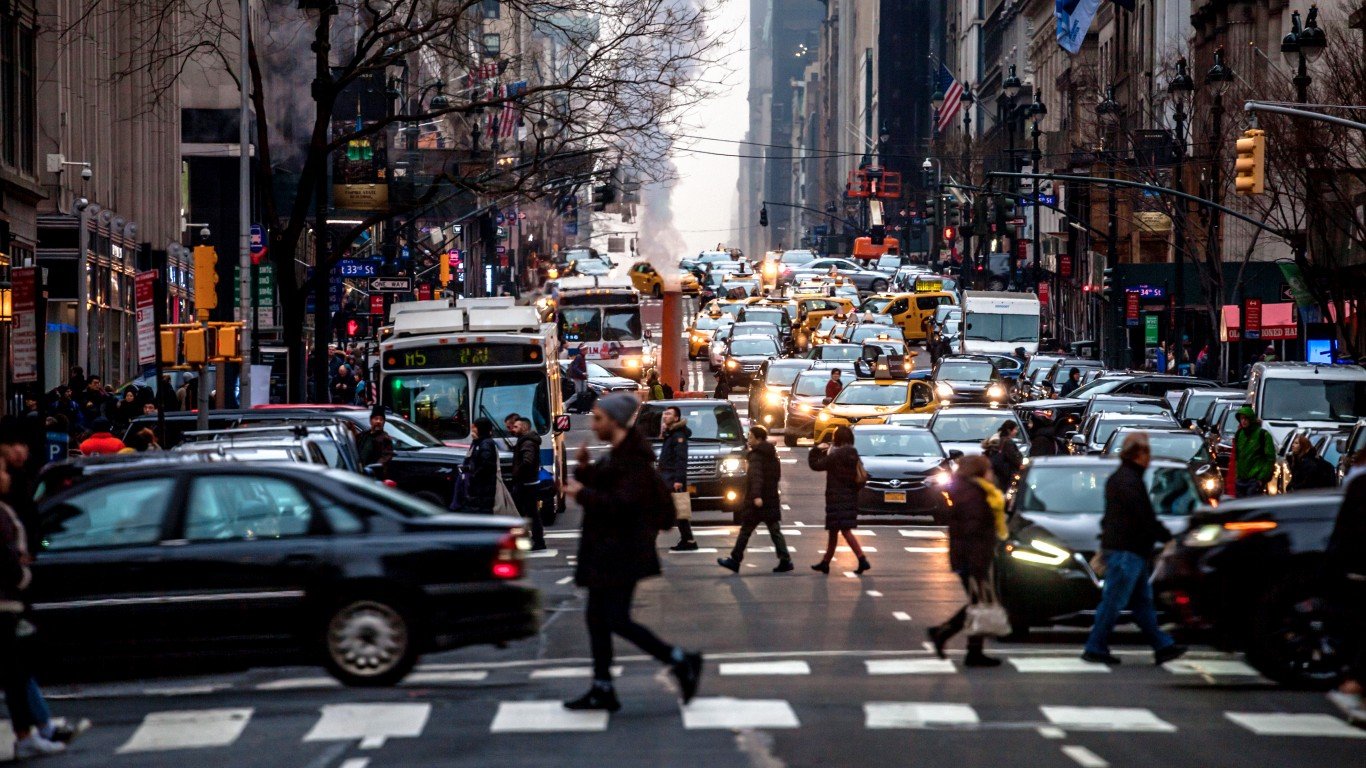
Source: peeterv / iStock via Getty Images
- Fatal crash rate in 2021: 4.6 per 100,000 people (5.6 per 100,000 in state)
- Total fatal crashes in 2021: 893 (1,099 in state)
- Vehicle theft rate in 2022: 161 per 100,000 people (144 per 100,000 in state)
- Total vehicle thefts reported in 2022: 31,479 (28,323 in state)
- Avg. commute time in 2022: 35.8 minutes (33.0 minutes in state)
- Metro areas considered in state: 12
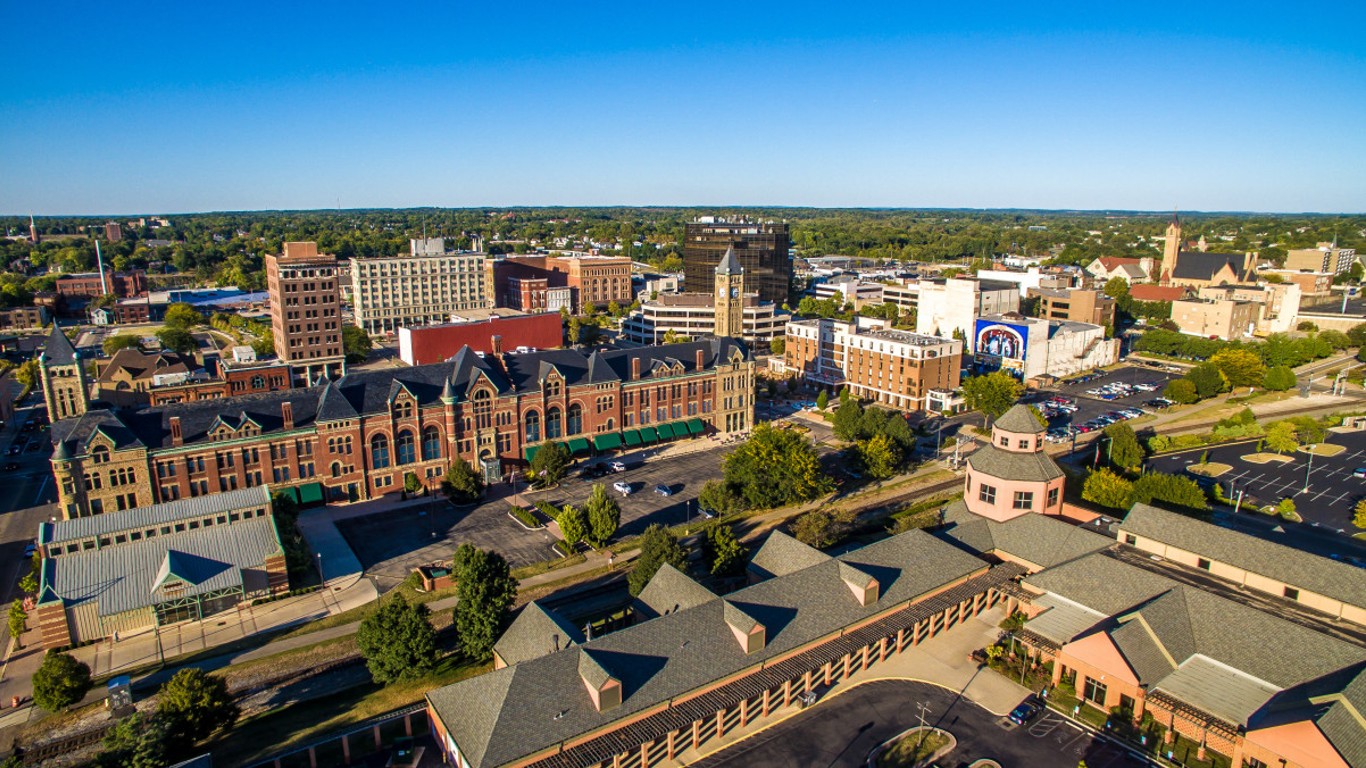
North Carolina: Rocky Mount

Source: kkkkoly7 / Wikimedia Commons
- Fatal crash rate in 2021: 23.6 per 100,000 people (14.3 per 100,000 in state)
- Total fatal crashes in 2021: 34 (1,535 in state)
- Vehicle theft rate in 2022: 148 per 100,000 people (220 per 100,000 in state)
- Total vehicle thefts reported in 2022: 213 (23,576 in state)
- Avg. commute time in 2022: 24.7 minutes (25.1 minutes in state)
- Metro areas considered in state: 15
North Dakota: Bismarck

Source: Allen Allnoch / iStock via Getty Images
- Fatal crash rate in 2021: 11.2 per 100,000 people (10.9 per 100,000 in state)
- Total fatal crashes in 2021: 15 (85 in state)
- Vehicle theft rate in 2022: 207 per 100,000 people (225 per 100,000 in state)
- Total vehicle thefts reported in 2022: 279 (1,750 in state)
- Avg. commute time in 2022: 18.4 minutes (18.3 minutes in state)
- Metro areas considered in state: 3
Ohio: Springfield
Source: Rob Hat / Wikimedia Commons
- Fatal crash rate in 2021: 16.3 per 100,000 people (10.6 per 100,000 in state)
- Total fatal crashes in 2021: 22 (1,242 in state)
- Vehicle theft rate in 2022: 275 per 100,000 people (258 per 100,000 in state)
- Total vehicle thefts reported in 2022: 371 (30,361 in state)
- Avg. commute time in 2022: 21.5 minutes (23.5 minutes in state)
- Metro areas considered in state: 11
Oklahoma: Tulsa

Source: Davel5957 / E+ via Getty Images
- Fatal crash rate in 2021: 13.7 per 100,000 people (16.9 per 100,000 in state)
- Total fatal crashes in 2021: 142 (681 in state)
- Vehicle theft rate in 2022: 417 per 100,000 people (299 per 100,000 in state)
- Total vehicle thefts reported in 2022: 4,314 (12,007 in state)
- Avg. commute time in 2022: 21.9 minutes (22.7 minutes in state)
- Metro areas considered in state: 4
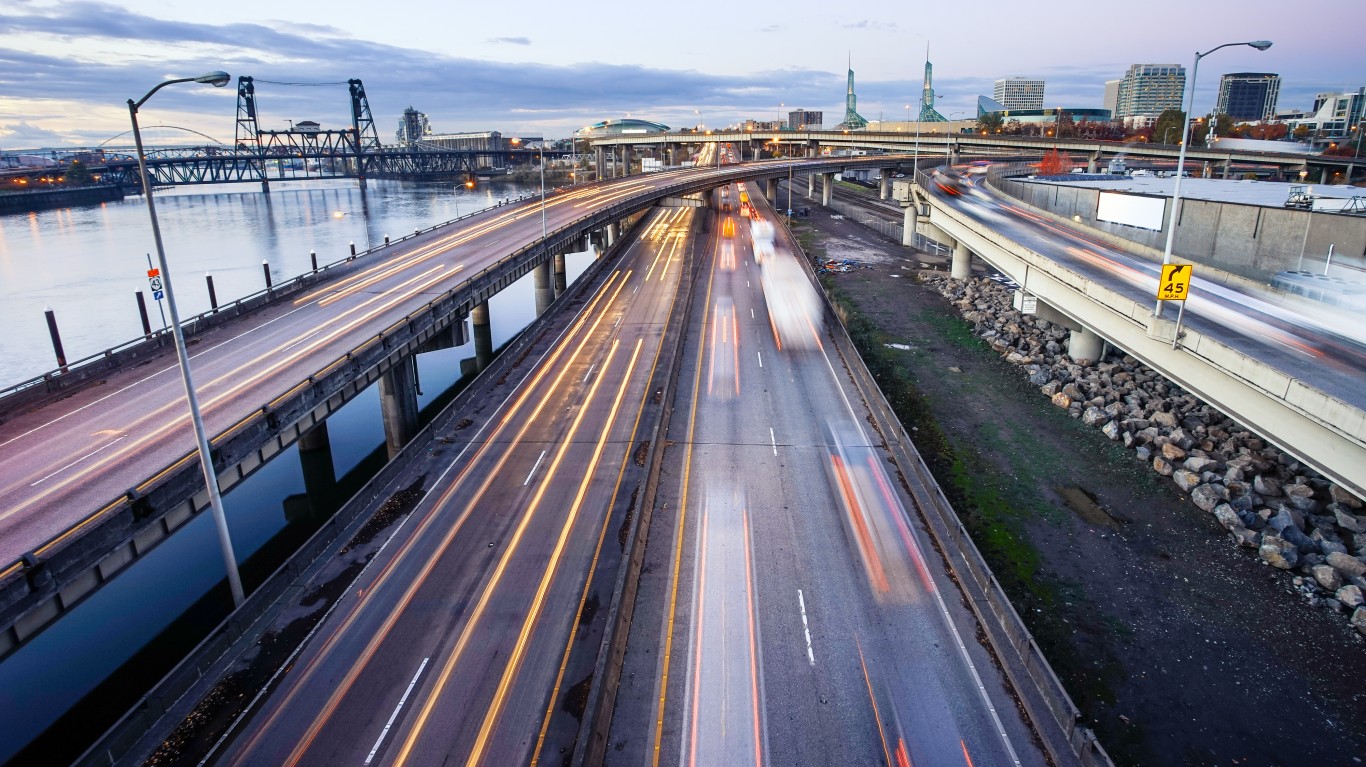
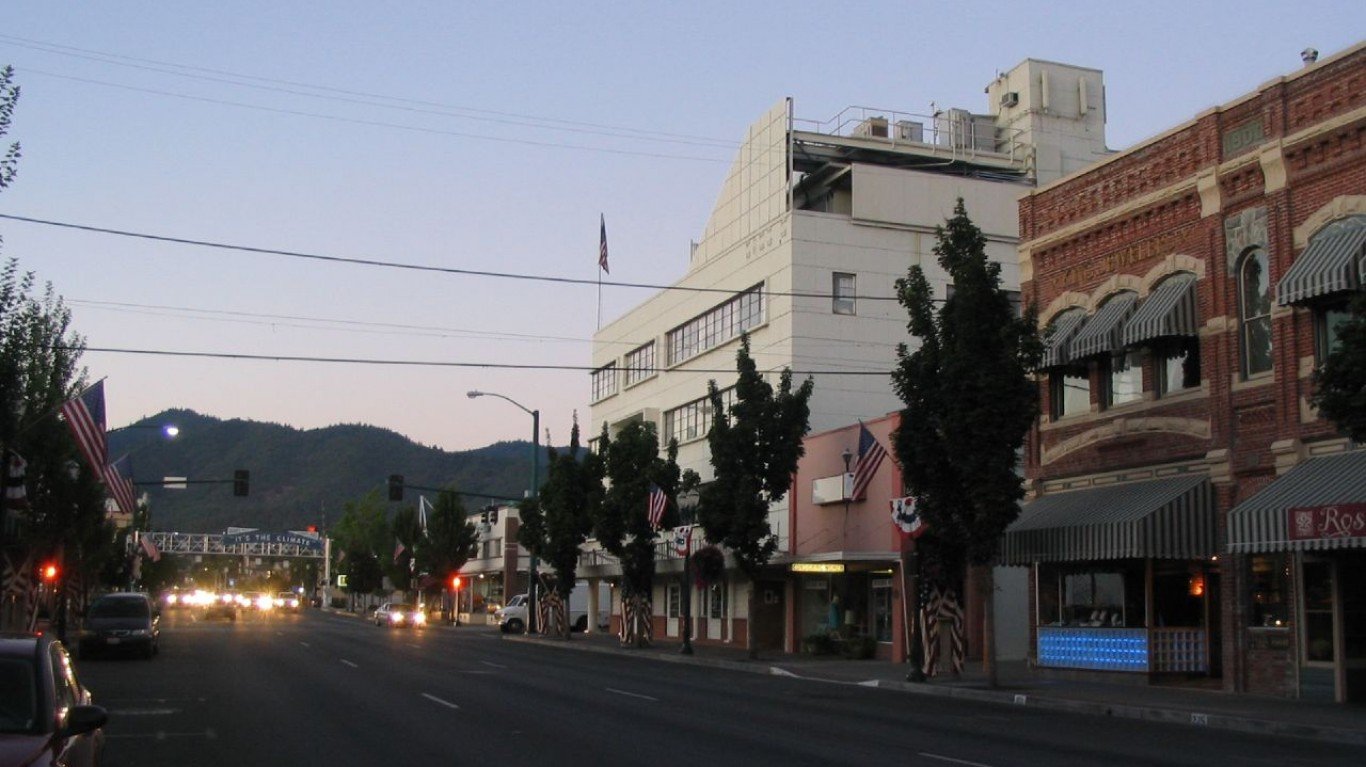
Oregon: Grants Pass
Source: kenlund / Flickr
- Fatal crash rate in 2021: 23.9 per 100,000 people (13.0 per 100,000 in state)
- Total fatal crashes in 2021: 21 (552 in state)
- Vehicle theft rate in 2022: 397 per 100,000 people (541 per 100,000 in state)
- Total vehicle thefts reported in 2022: 348 (22,934 in state)
- Avg. commute time in 2022: 22.5 minutes (22.8 minutes in state)
- Metro areas considered in state: 8
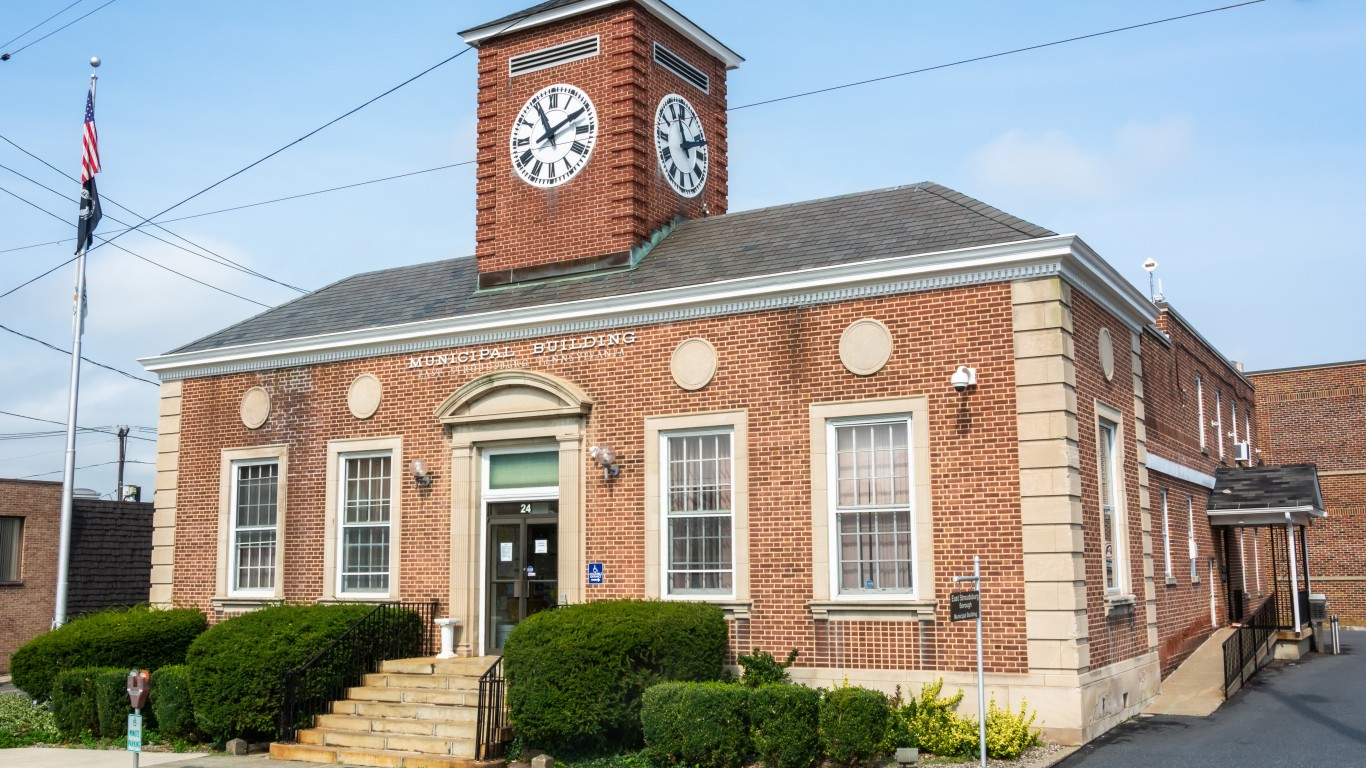
Pennsylvania: East Stroudsburg
Source: AlizadaStudios / iStock Editorial via Getty Images
- Fatal crash rate in 2021: 15.0 per 100,000 people (8.9 per 100,000 in state)
- Total fatal crashes in 2021: 25 (1,153 in state)
- Vehicle theft rate in 2022: 66 per 100,000 people (173 per 100,000 in state)
- Total vehicle thefts reported in 2022: 110 (22,407 in state)
- Avg. commute time in 2022: 36.2 minutes (26.4 minutes in state)
- Metro areas considered in state: 18
Rhode Island: Providence-Warwick

Source: jjbers / Flickr
- Fatal crash rate in 2021: 6.3 per 100,000 people (5.6 per 100,000 in state)
- Total fatal crashes in 2021: 106 (61 in state)
- Vehicle theft rate in 2022: 150 per 100,000 people (164 per 100,000 in state)
- Total vehicle thefts reported in 2022: 2,508 (1,796 in state)
- Avg. commute time in 2022: 26.4 minutes (25.4 minutes in state)
- Metro areas considered in state: 1
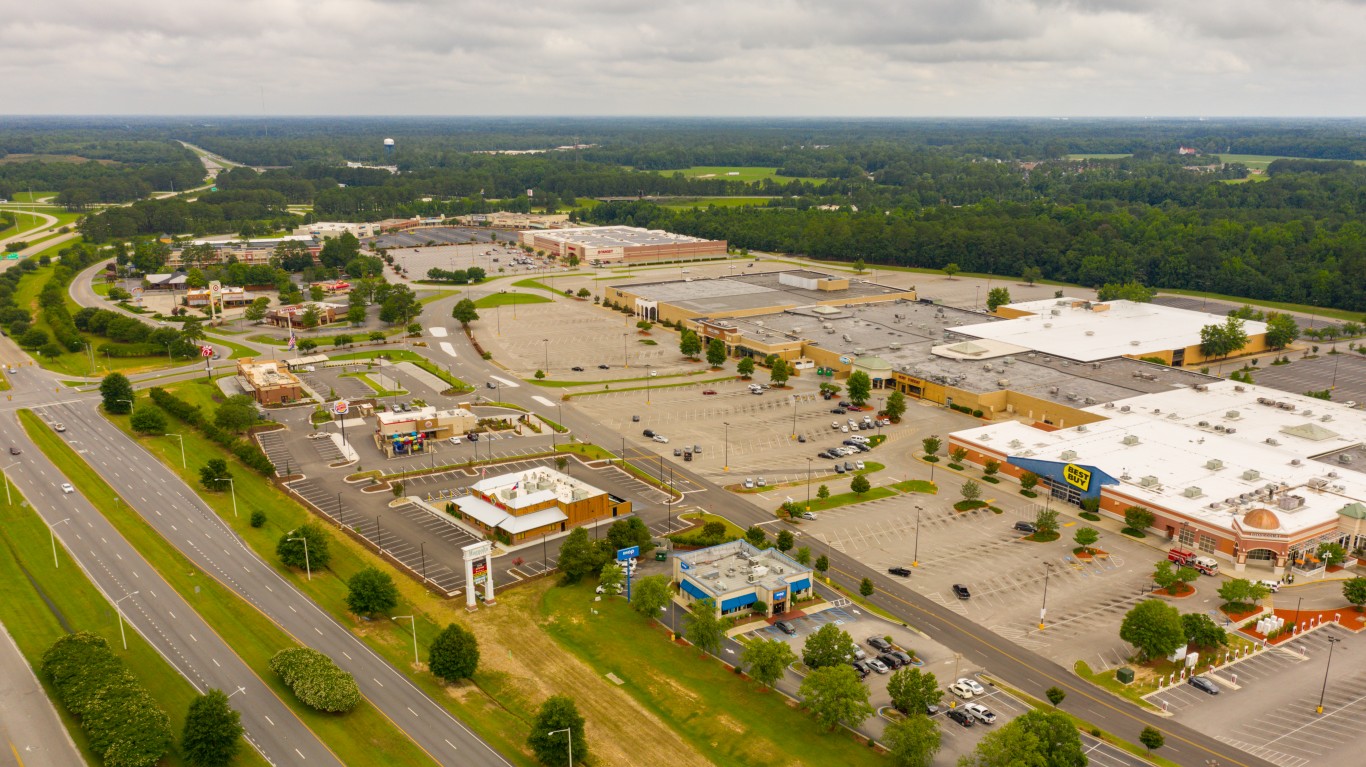
South Carolina: Florence
Source: felixmizioznikov / Getty Images
- Fatal crash rate in 2021: 31.6 per 100,000 people (21.1 per 100,000 in state)
- Total fatal crashes in 2021: 63 (1,112 in state)
- Vehicle theft rate in 2022: 359 per 100,000 people (291 per 100,000 in state)
- Total vehicle thefts reported in 2022: 714 (15,345 in state)
- Avg. commute time in 2022: 20.7 minutes (25.6 minutes in state)
- Metro areas considered in state: 8
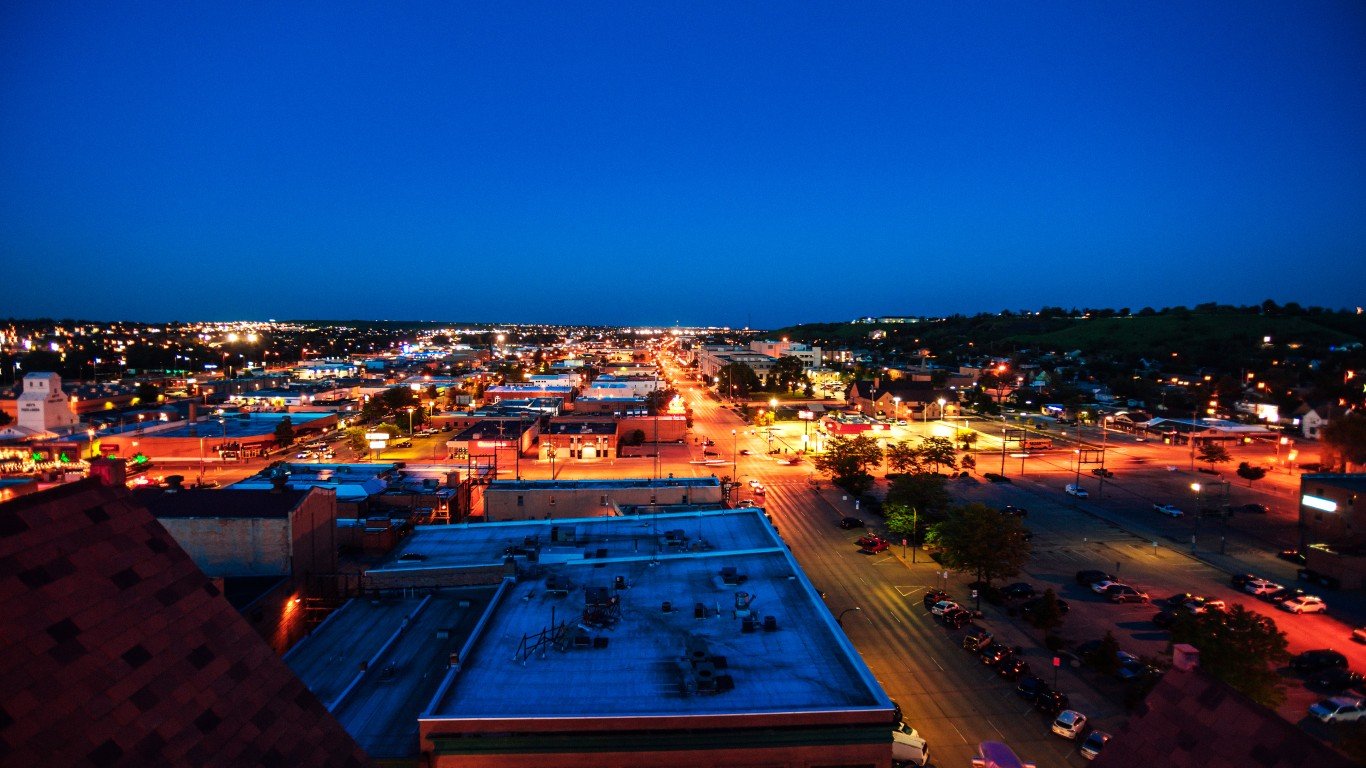
South Dakota: Rapid City
Source: peeterv / iStock via Getty Images
- Fatal crash rate in 2021: 21.4 per 100,000 people (14.4 per 100,000 in state)
- Total fatal crashes in 2021: 31 (131 in state)
- Vehicle theft rate in 2022: 398 per 100,000 people (248 per 100,000 in state)
- Total vehicle thefts reported in 2022: 577 (2,259 in state)
- Avg. commute time in 2022: 19.3 minutes (18.2 minutes in state)
- Metro areas considered in state: 2
Tennessee: Memphis
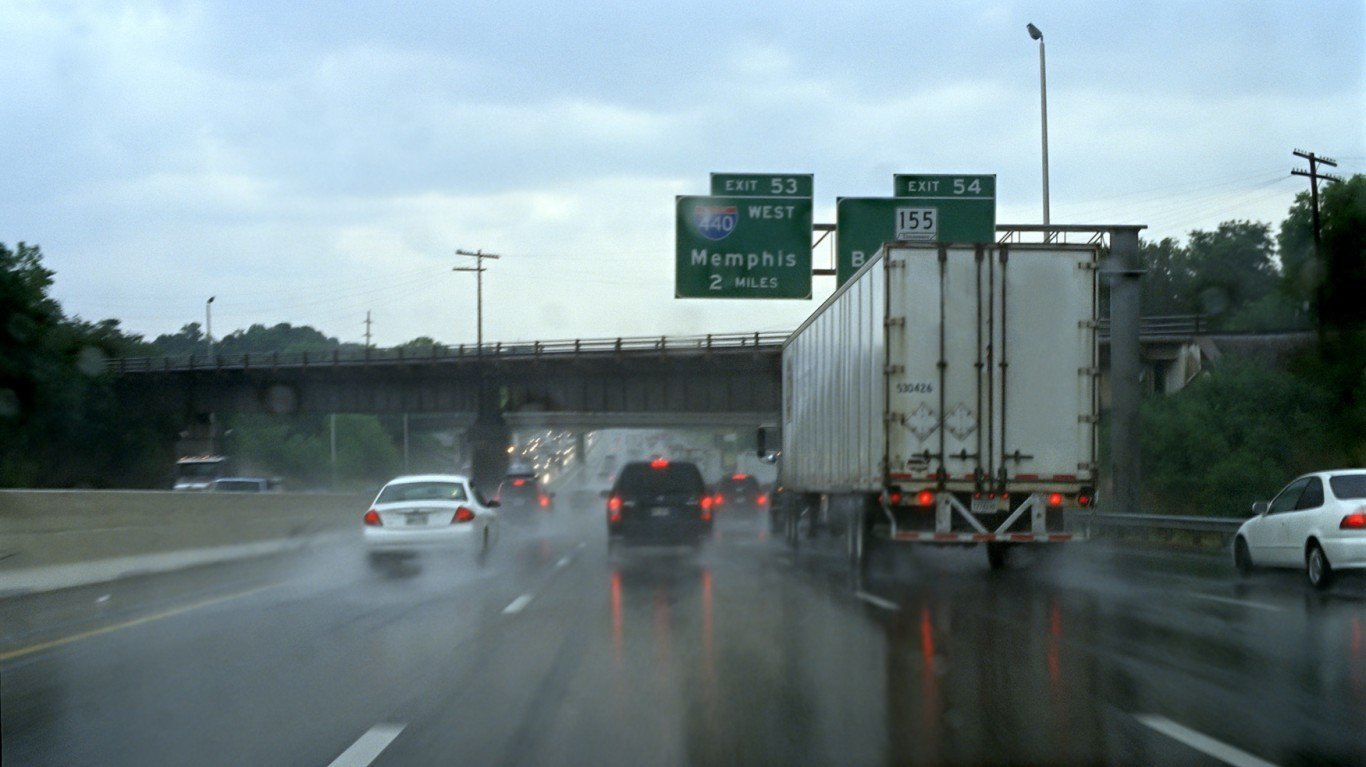
Source: LawrenceSawyer / Getty Images
- Fatal crash rate in 2021: 23.4 per 100,000 people (17.4 per 100,000 in state)
- Total fatal crashes in 2021: 312 (1,229 in state)
- Vehicle theft rate in 2022: 846 per 100,000 people (338 per 100,000 in state)
- Total vehicle thefts reported in 2022: 11,267 (23,830 in state)
- Avg. commute time in 2022: 23.9 minutes (25.5 minutes in state)
- Metro areas considered in state: 10
Texas: Odessa
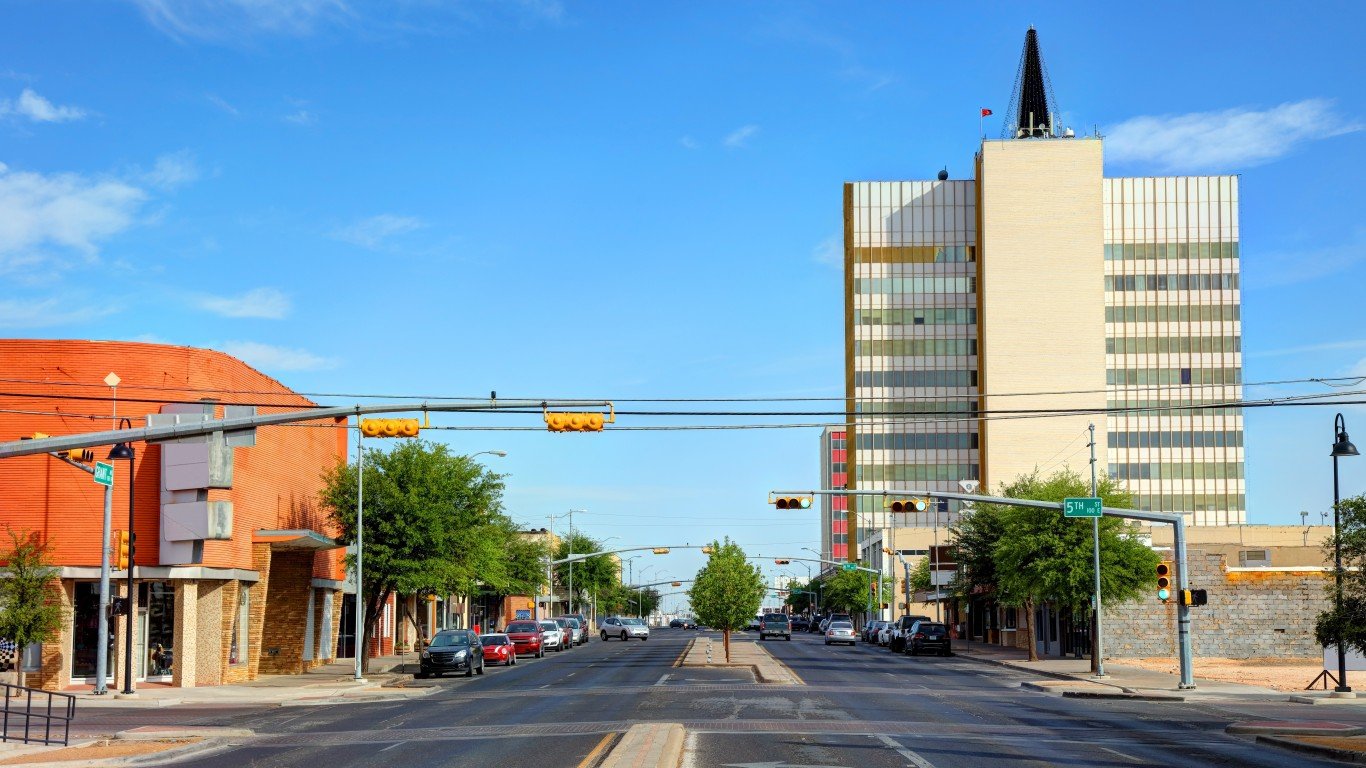
Source: DenisTangneyJr / iStock via Getty Images
- Fatal crash rate in 2021: 22.4 per 100,000 people (13.5 per 100,000 in state)
- Total fatal crashes in 2021: 36 (4,068 in state)
- Vehicle theft rate in 2022: 430 per 100,000 people (350 per 100,000 in state)
- Total vehicle thefts reported in 2022: 692 (105,133 in state)
- Avg. commute time in 2022: 23.9 minutes (26.7 minutes in state)
- Metro areas considered in state: 25
Utah: Salt Lake City

Source: RichLegg / iStock via Getty Images
- Fatal crash rate in 2021: 7.4 per 100,000 people (8.7 per 100,000 in state)
- Total fatal crashes in 2021: 94 (293 in state)
- Vehicle theft rate in 2022: 379 per 100,000 people (210 per 100,000 in state)
- Total vehicle thefts reported in 2022: 4,799 (7,082 in state)
- Avg. commute time in 2022: 22.8 minutes (21.6 minutes in state)
- Metro areas considered in state: 5
Vermont: Burlington-South Burlington
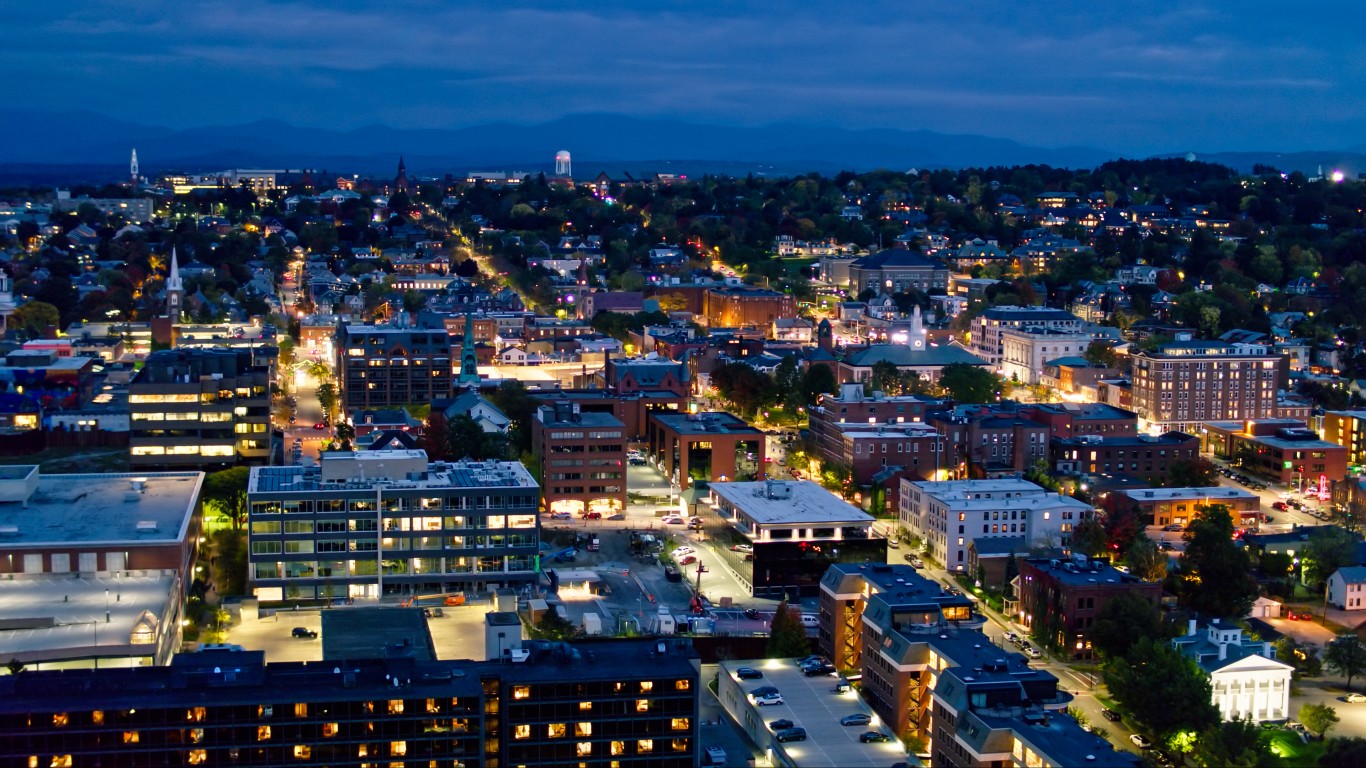
Source: halbergman / iStock via Getty Images
- Fatal crash rate in 2021: 7.4 per 100,000 people (10.7 per 100,000 in state)
- Total fatal crashes in 2021: 17 (69 in state)
- Vehicle theft rate in 2022: 269 per 100,000 people (161 per 100,000 in state)
- Total vehicle thefts reported in 2022: 611 (1,039 in state)
- Avg. commute time in 2022: 22.1 minutes (23.2 minutes in state)
- Metro areas considered in state: 1
Virginia: Charlottesville

Source: DenisTangneyJr / iStock via Getty Images
- Fatal crash rate in 2021: 16.6 per 100,000 people (10.4 per 100,000 in state)
- Total fatal crashes in 2021: 37 (906 in state)
- Vehicle theft rate in 2022: 132 per 100,000 people (164 per 100,000 in state)
- Total vehicle thefts reported in 2022: 296 (14,256 in state)
- Avg. commute time in 2022: 24.5 minutes (27.1 minutes in state)
- Metro areas considered in state: 9
Washington: Seattle-Tacoma-Bellevue
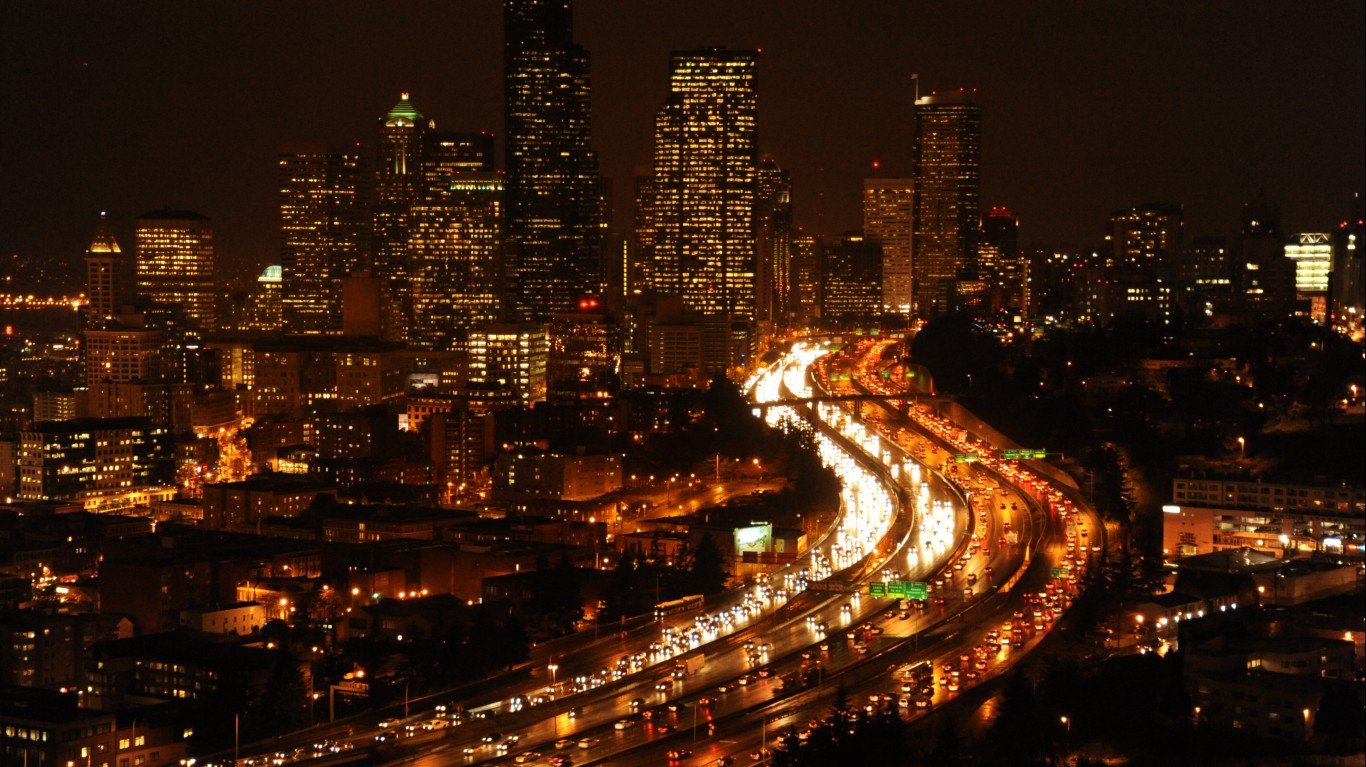
Source: wonderlane / Flickr
- Fatal crash rate in 2021: 6.2 per 100,000 people (7.7 per 100,000 in state)
- Total fatal crashes in 2021: 250 (603 in state)
- Vehicle theft rate in 2022: 759 per 100,000 people (604 per 100,000 in state)
- Total vehicle thefts reported in 2022: 30,607 (46,990 in state)
- Avg. commute time in 2022: 28.5 minutes (26.3 minutes in state)
- Metro areas considered in state: 11
West Virginia: Charleston

Source: Sean Pavone / iStock via Getty Images
- Fatal crash rate in 2021: 14.8 per 100,000 people (14.5 per 100,000 in state)
- Total fatal crashes in 2021: 37 (257 in state)
- Vehicle theft rate in 2022: 209 per 100,000 people (115 per 100,000 in state)
- Total vehicle thefts reported in 2022: 526 (2,046 in state)
- Avg. commute time in 2022: 26.4 minutes (26.9 minutes in state)
- Metro areas considered in state: 7
Wisconsin: Janesville-Beloit
Source: LawrenceSawyer / E+ via Getty Images
- Fatal crash rate in 2021: 17.7 per 100,000 people (9.7 per 100,000 in state)
- Total fatal crashes in 2021: 29 (572 in state)
- Vehicle theft rate in 2022: 141 per 100,000 people (199 per 100,000 in state)
- Total vehicle thefts reported in 2022: 231 (11,709 in state)
- Avg. commute time in 2022: 23.9 minutes (22.2 minutes in state)
- Metro areas considered in state: 12
Wyoming: Cheyenne
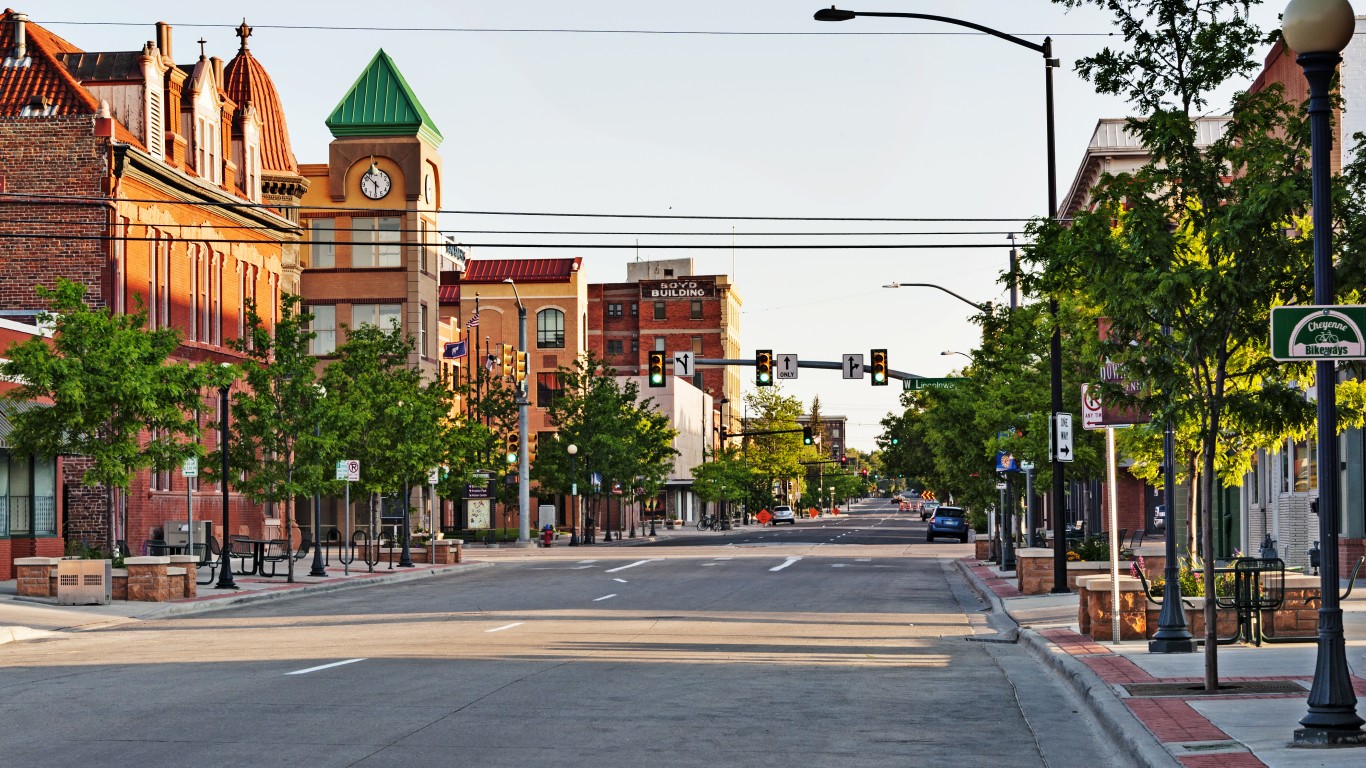
Source: jmoor17 / iStock Unreleased via Getty Images
- Fatal crash rate in 2021: 13.9 per 100,000 people (17.5 per 100,000 in state)
- Total fatal crashes in 2021: 14 (102 in state)
- Vehicle theft rate in 2022: 283 per 100,000 people (132 per 100,000 in state)
- Total vehicle thefts reported in 2022: 285 (770 in state)
- Avg. commute time in 2022: 16.3 minutes (18.0 minutes in state)
- Metro areas considered in state: 2
Sponsored: Attention Savvy Investors: Speak to 3 Financial Experts – FREE
Ever wanted an extra set of eyes on an investment you’re considering? Now you can speak with up to 3 financial experts in your area for FREE. By simply
clicking here you can begin to match with financial professionals who can help guide you through the financial decisions you’re making. And the best part? The first conversation with them is free.
Click here to match with up to 3 financial pros who would be excited to help you make financial decisions.
Thank you for reading! Have some feedback for us?
Contact the 24/7 Wall St. editorial team.
Editors' Picks