
Whether they realize it or not, getting behind the wheel is the most dangerous thing many Americans do every day. According to the U.S. Department of Transportation, there were over 39,500 fatal crashes nationwide in 2021, resulting in nearly 43,000 deaths — the most in over a decade and a half.
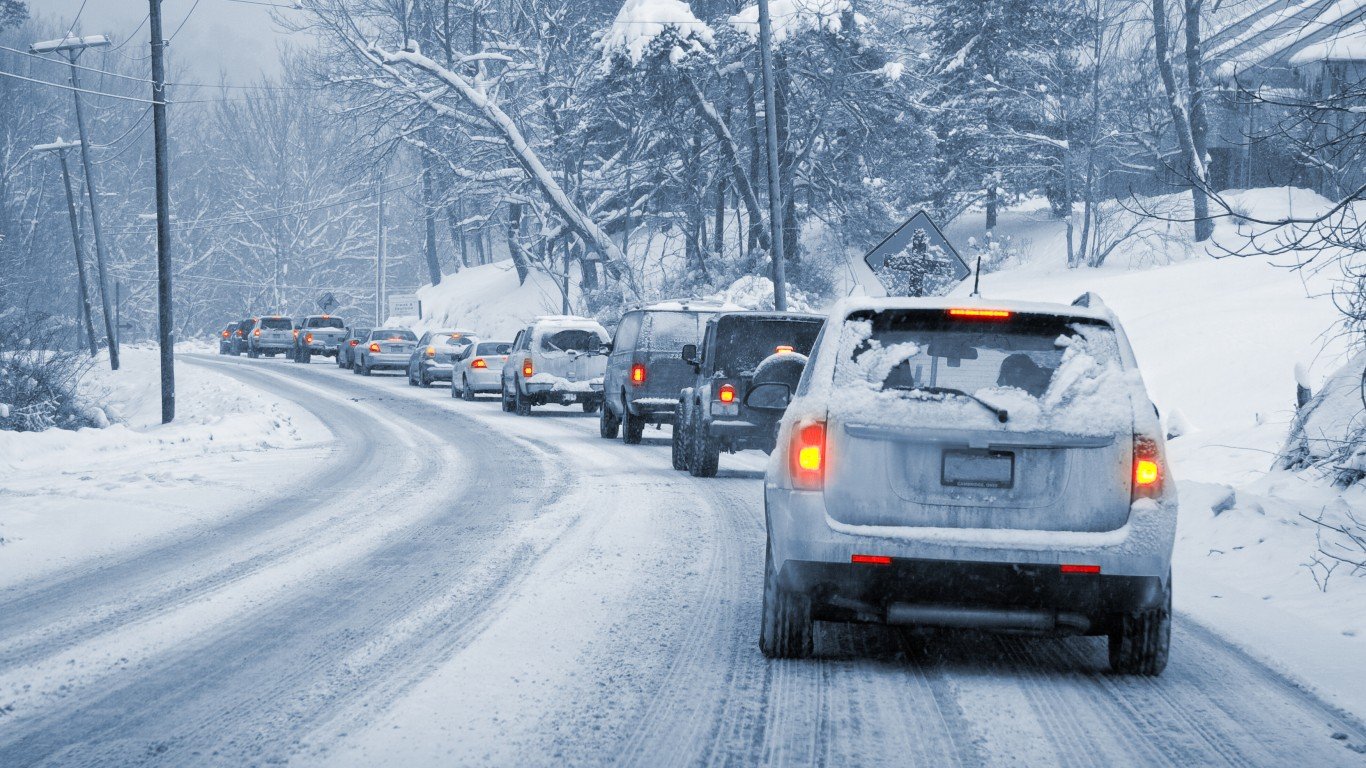
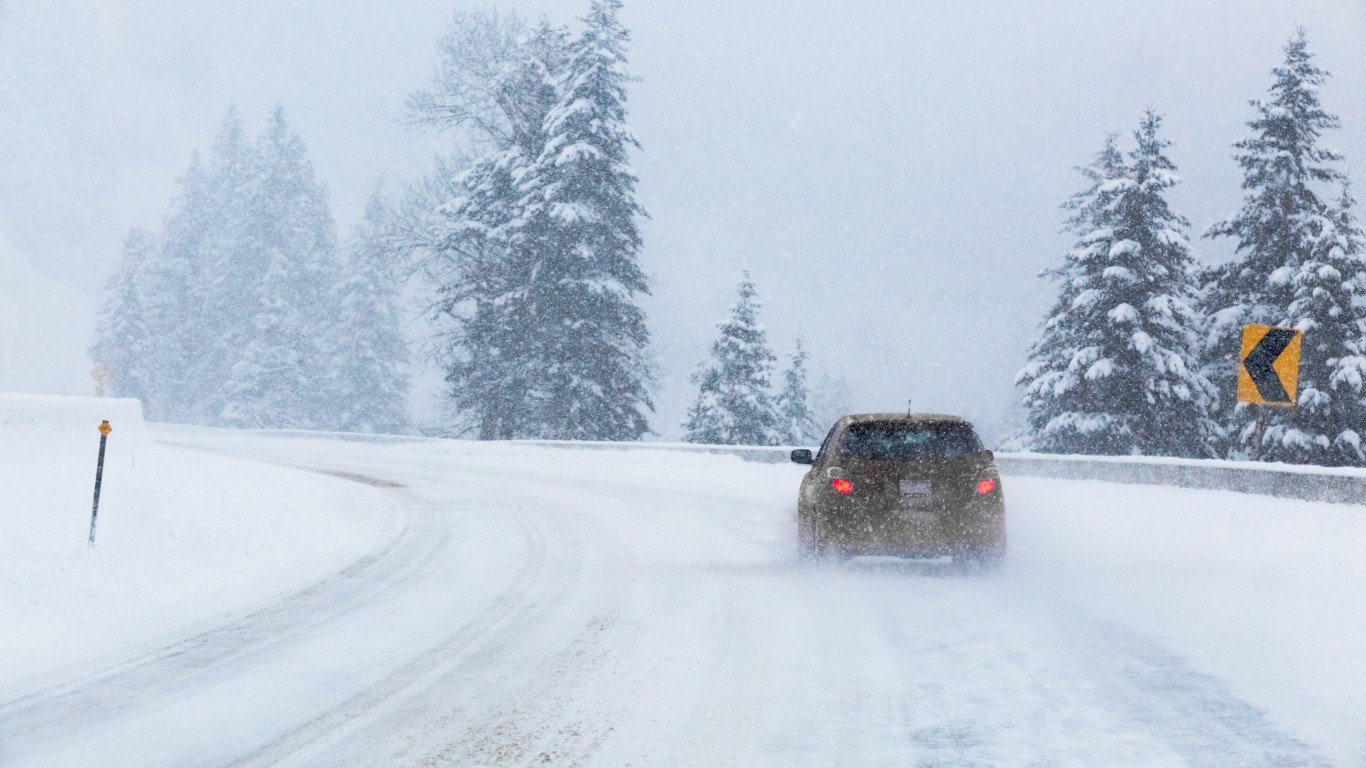
Many risk factors associated with driving are outside the control of even the safest motorists. These not only include not only distracted, drowsy, or reckless drivers, but also weather conditions — particularly in the winter months. In much of the country, winter weather conditions can close lanes, limit visibility, reduce vehicle maneuverability, and greatly increase the likelihood of an accident.
Data from the DOT shows that nearly a quarter of all weather-related crashes in the U.S. occur on icy, slushy, and snowy roads. These conditions contribute to more than 1,300 roadway deaths and over 116,800 injuries every year in the United States. In some parts of the country, fatal winter weather crashes are far more common than in others. (Here is a look at the most dangerous cars on the road.)
Using data from the National Highway Traffic Safety Administration, 24/7 Wall St. identified the worst states for winter driving. States are ranked on the total number of fatal crashes between 2017 and 2021 in winter weather conditions — including snow, sleet, and freezing rain — for every 100,000 licensed drivers. The total number of licensed drivers by state, as reported by the DOT, is for the 2020 calendar year.
Among the 30 states on this list, the number of fatal winter-weather crashes between 2017 and 2021 ranges from fewer than 1 for every 100,000 drivers to over 12 per 100,000. While every state on this list is subject to hazardous winter driving conditions, fatality rates are also subject to a number of other related factors, including road maintenance.
Bordering two great lakes, which can produce devastating lake-effect winter storms, New York state is home to some of the snowiest counties in the continental United States. However, New York was also the only state to apply over 900,000 tons of salt to the roads in the winter of 2020 through 2021 to reduce the likelihood of ice forming. Despite its susceptibility to hazardous winter driving conditions, New York was one of only four states to report fewer than 1 fatal winter-weather crash per 100,000 drivers in the last five years.
Population density also appears to play a role. Rural areas tend to have much higher fatal crash rates than urban areas, and many of the highest ranking states on this list are largely rural. According to the U.S. Census Bureau, only 20% of Americans live in rural areas — but in eight of the 10 worst states for winter driving, over a third of the population reside in rural areas. (Here is a look at the most challenging American cities to drive in.)
These are the worst states for winter driving.
30. Massachusetts
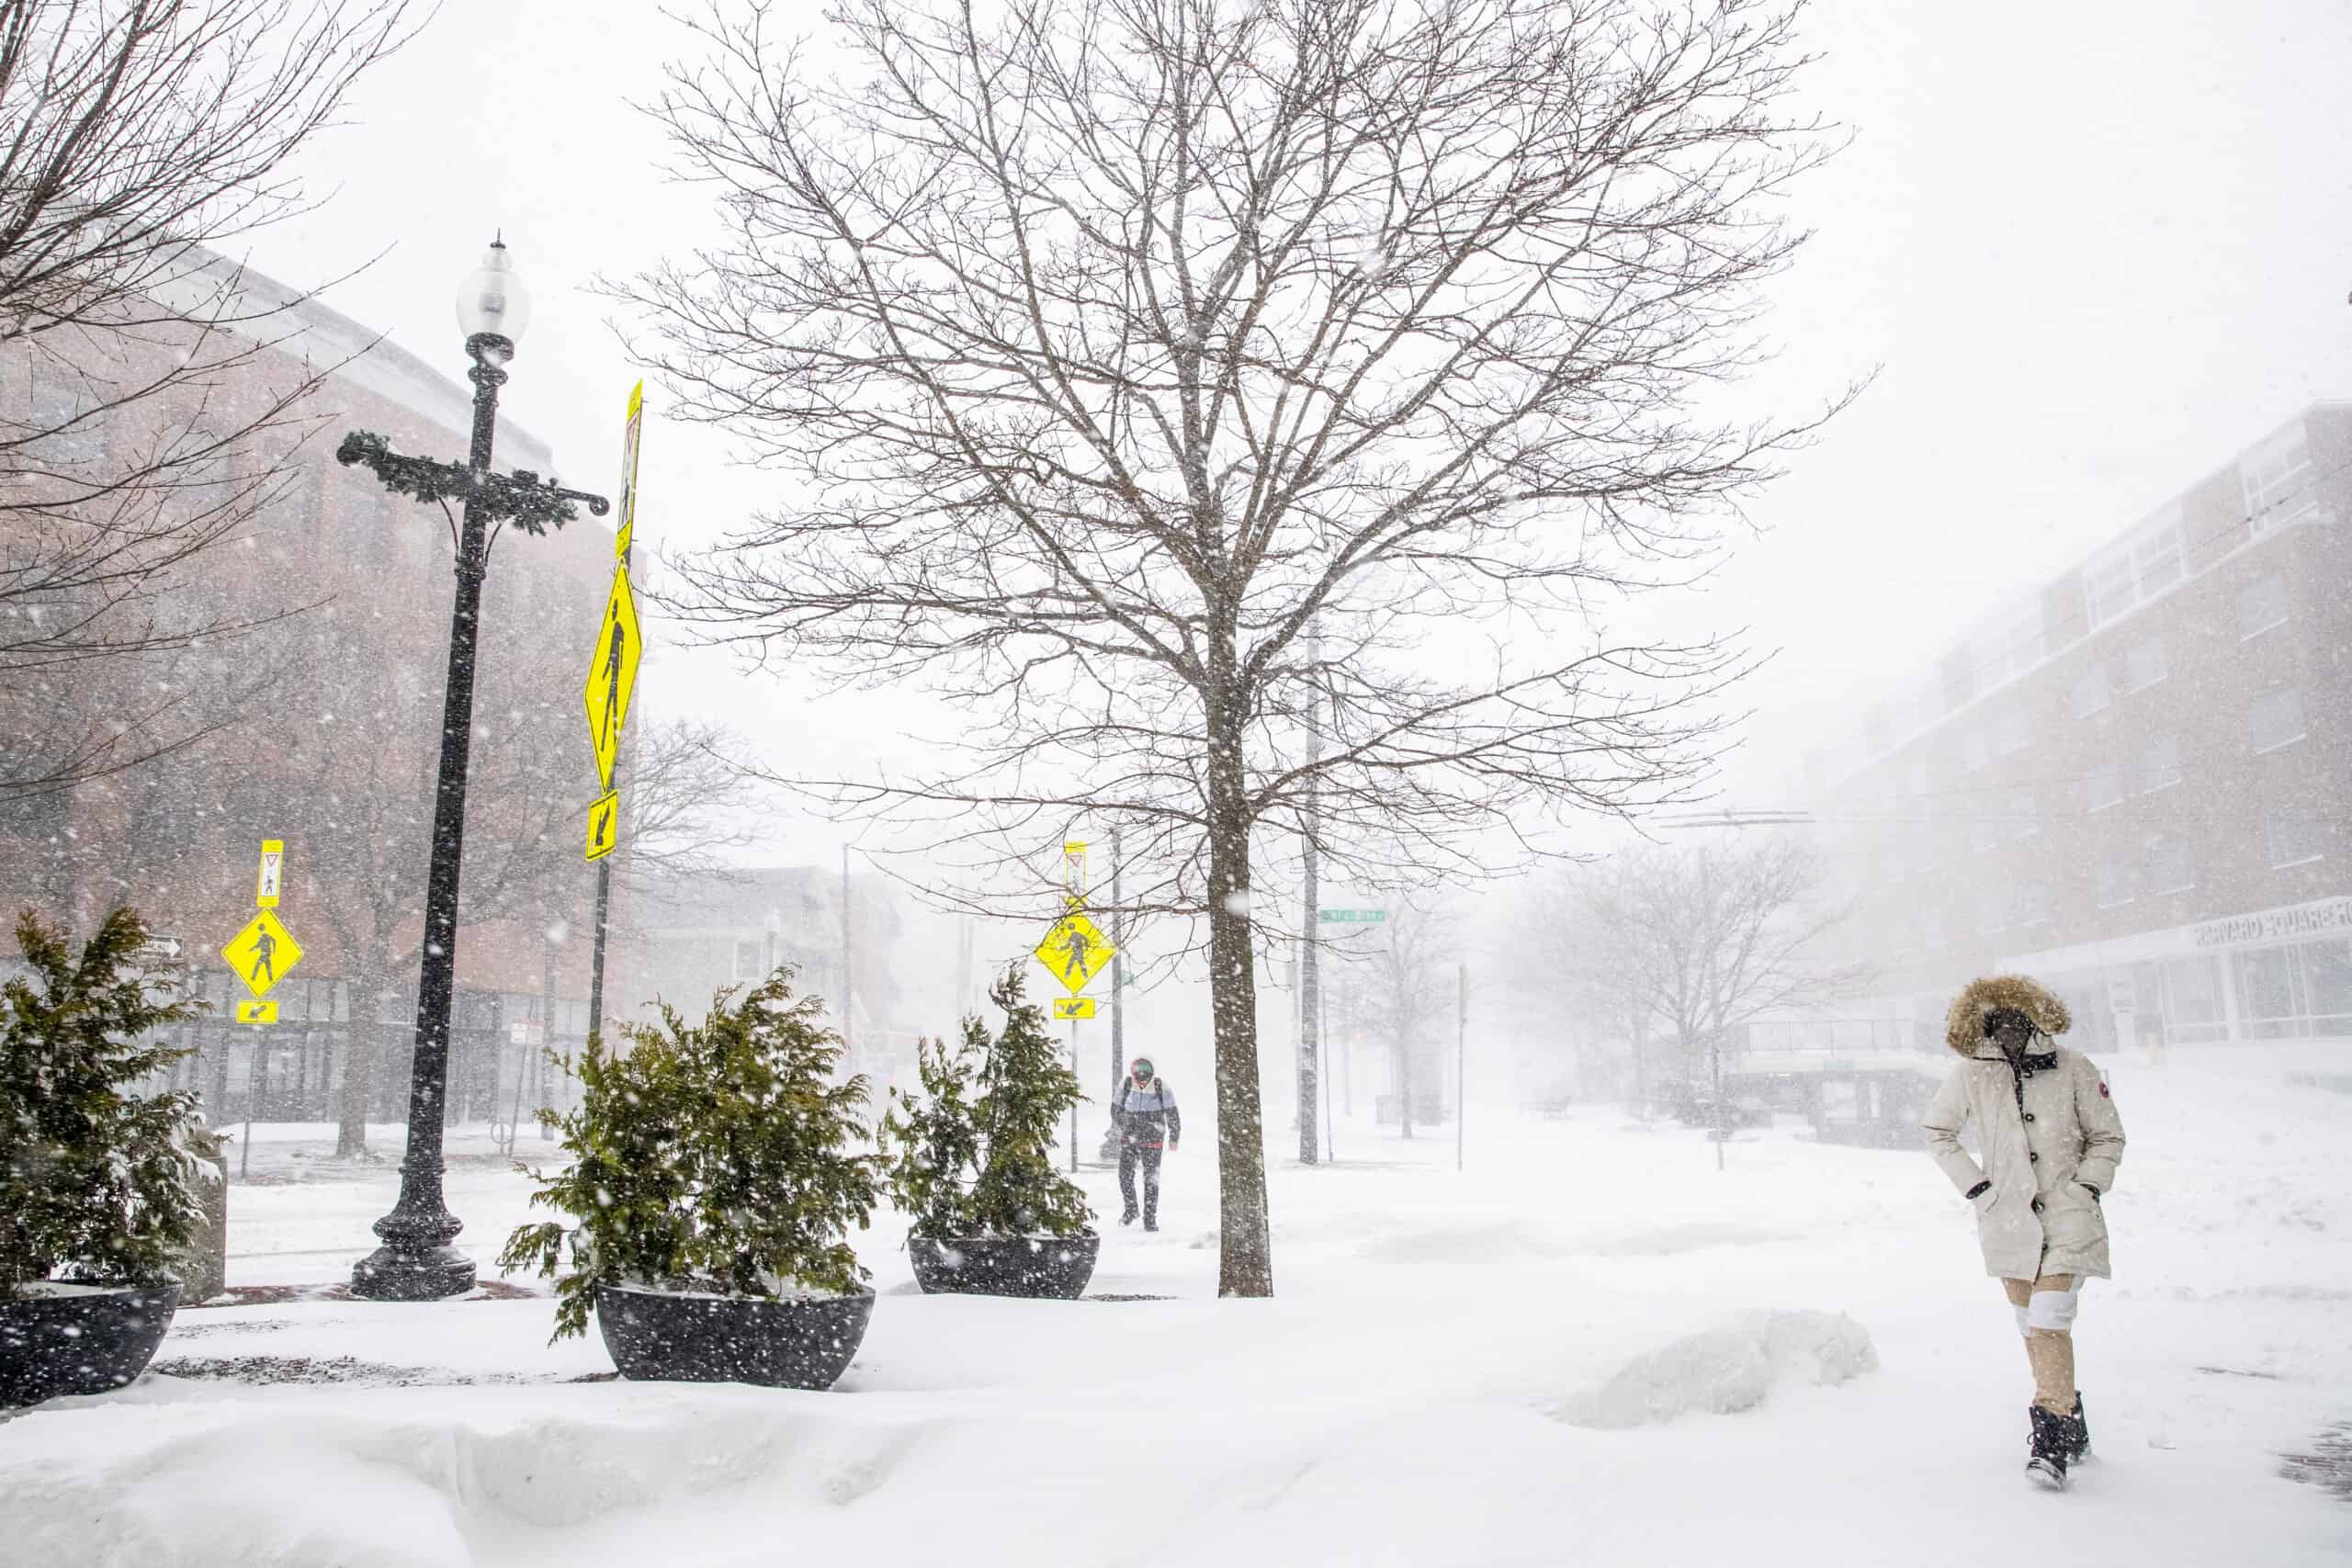
- Winter weather fatal crash rate, 2017-2021: 0.65 per 100,000 licensed drivers
- Total fatal crashes in winter conditions, 2017-2021: 32 (1.5% of U.S. total)
- Worst year for winter driving, 2017-2021: 2019, 8 fatal crashes
- Avg. number of fatal crashes in winter conditions, 2017-2021: 6 per year
29. Connecticut
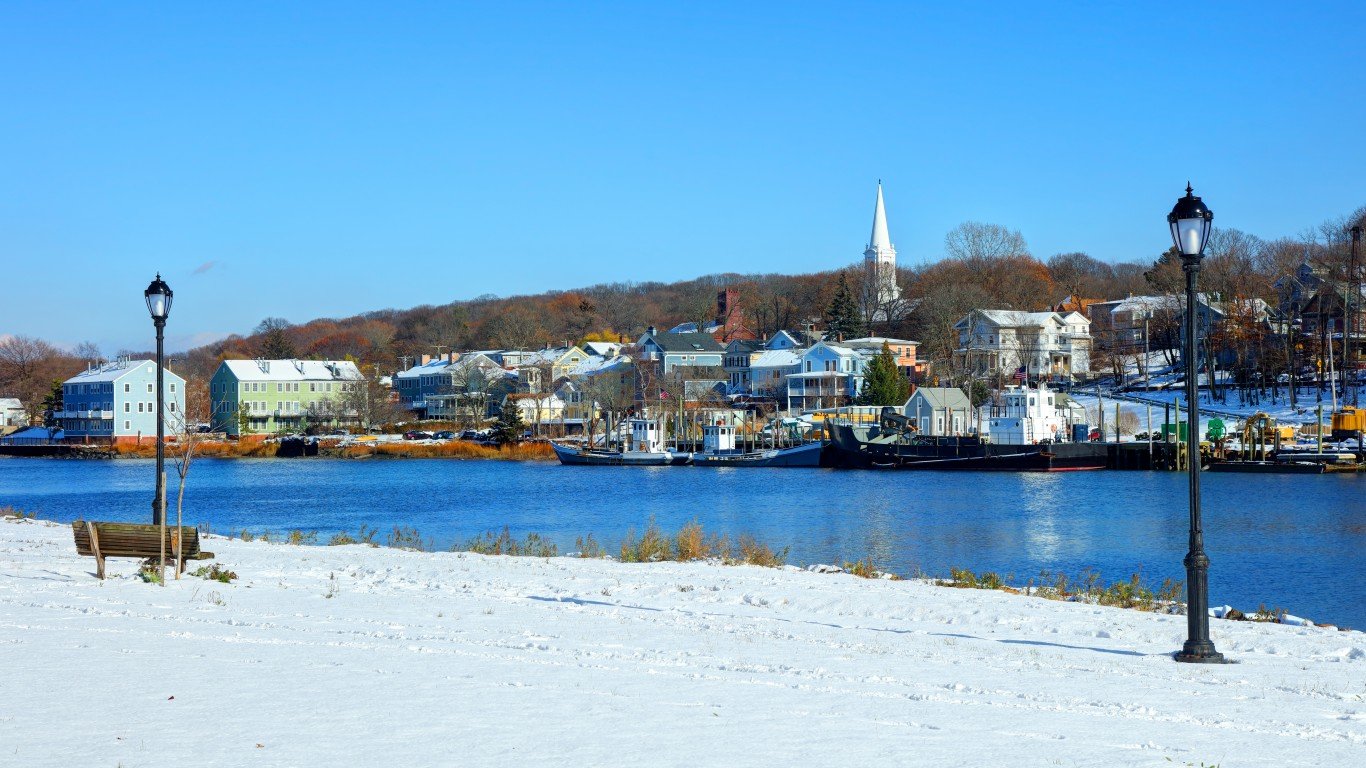
- Winter weather fatal crash rate, 2017-2021: 0.72 per 100,000 licensed drivers
- Total fatal crashes in winter conditions, 2017-2021: 18 (0.8% of U.S. total)
- Worst year for winter driving, 2017-2021: 2018, 7 fatal crashes
- Avg. number of fatal crashes in winter conditions, 2017-2021: 4 per year
28. New York
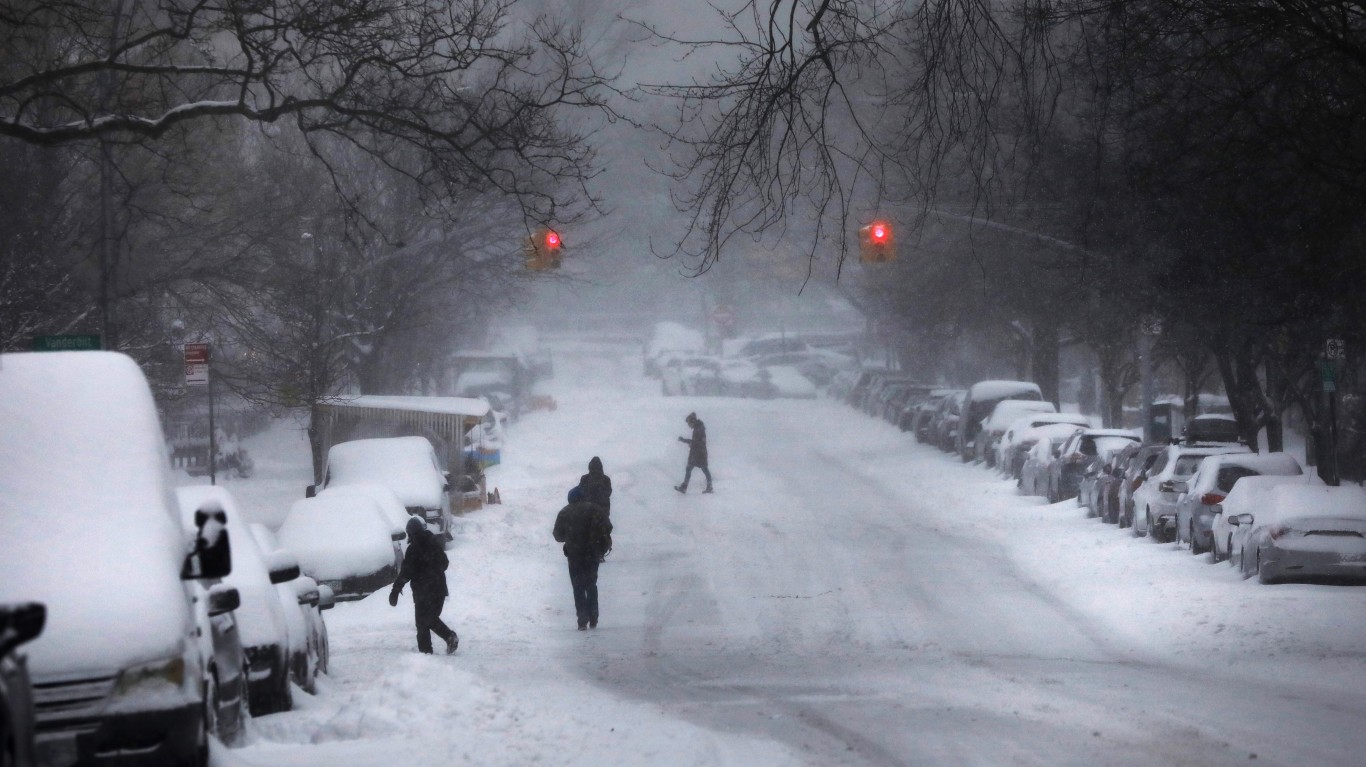
- Winter weather fatal crash rate, 2017-2021: 0.75 per 100,000 licensed drivers
- Total fatal crashes in winter conditions, 2017-2021: 92 (4.3% of U.S. total)
- Worst year for winter driving, 2017-2021: 2018, 25 fatal crashes
- Avg. number of fatal crashes in winter conditions, 2017-2021: 18 per year
27. Washington

- Winter weather fatal crash rate, 2017-2021: 0.84 per 100,000 licensed drivers
- Total fatal crashes in winter conditions, 2017-2021: 49 (2.3% of U.S. total)
- Worst year for winter driving, 2017-2021: 2017, 16 fatal crashes
- Avg. number of fatal crashes in winter conditions, 2017-2021: 10 per year
26. New Mexico
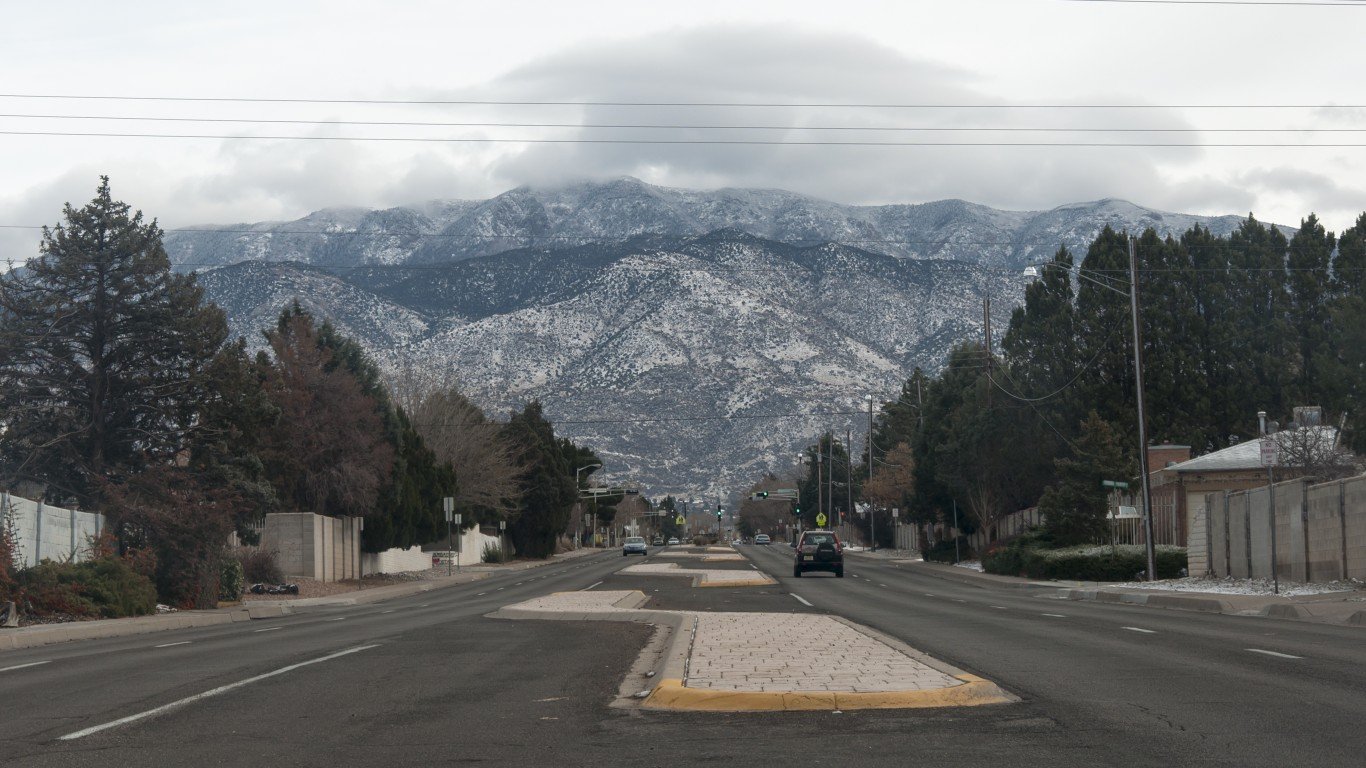
- Winter weather fatal crash rate, 2017-2021: 1.15 per 100,000 licensed drivers
- Total fatal crashes in winter conditions, 2017-2021: 17 (0.8% of U.S. total)
- Worst year for winter driving, 2017-2021: 2019, 7 fatal crashes
- Avg. number of fatal crashes in winter conditions, 2017-2021: 3 per year
25. Oregon
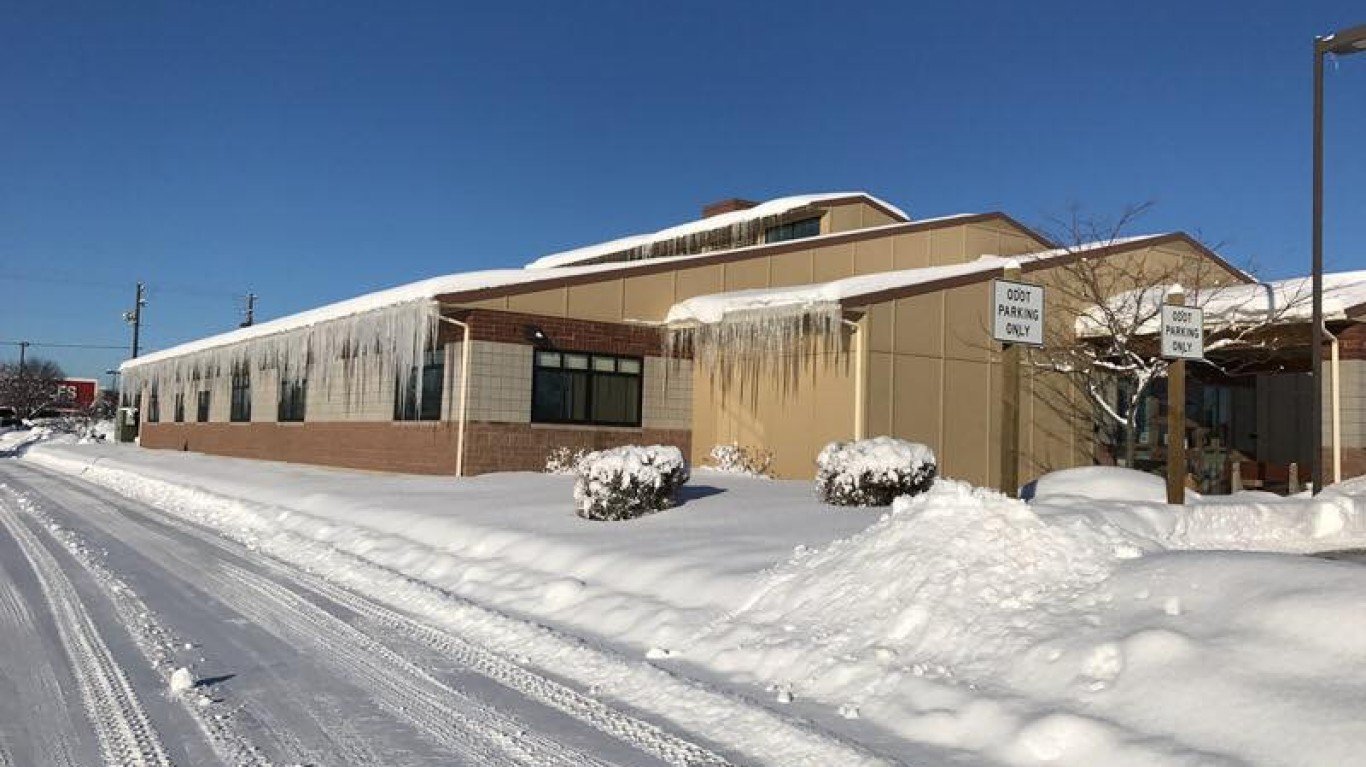
- Winter weather fatal crash rate, 2017-2021: 1.22 per 100,000 licensed drivers
- Total fatal crashes in winter conditions, 2017-2021: 36 (1.7% of U.S. total)
- Worst year for winter driving, 2017-2021: 2017, 13 fatal crashes
- Avg. number of fatal crashes in winter conditions, 2017-2021: 7 per year
24. Kentucky
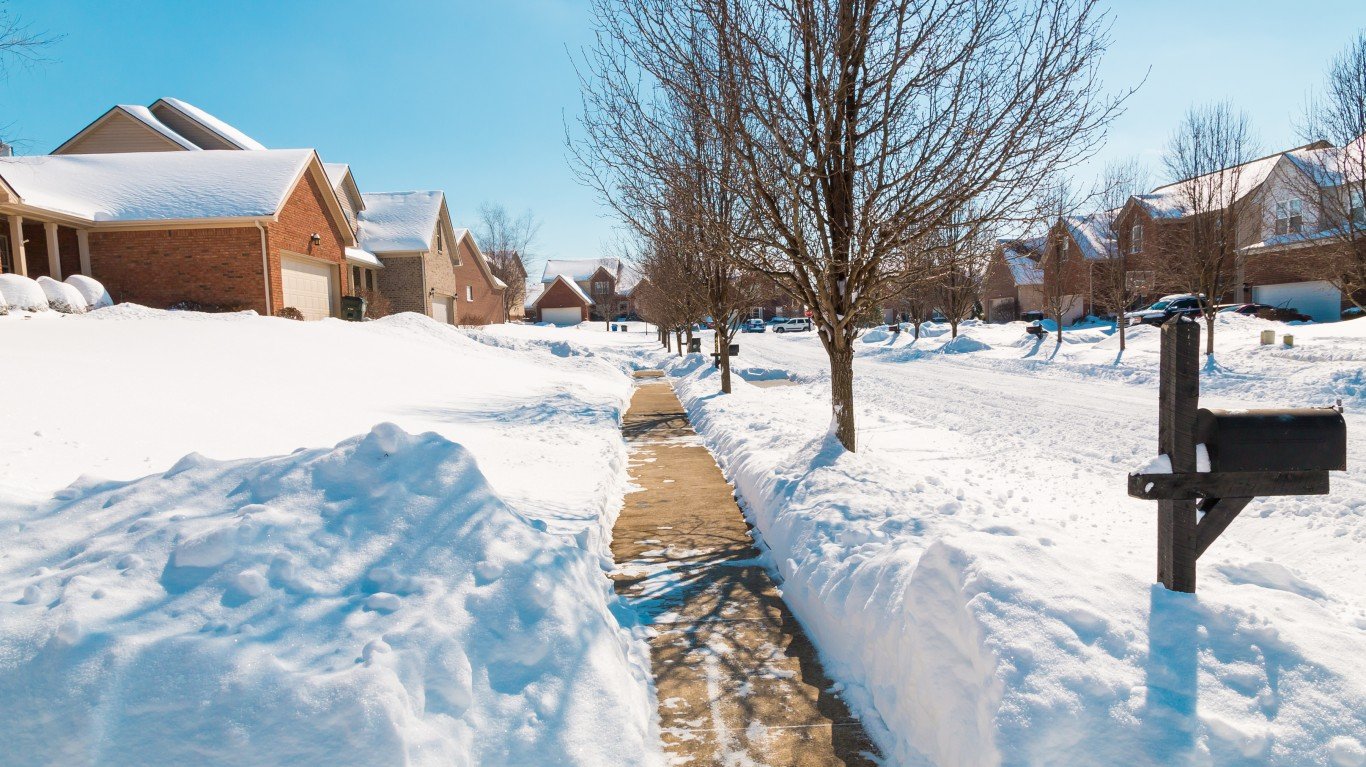
- Winter weather fatal crash rate, 2017-2021: 1.24 per 100,000 licensed drivers
- Total fatal crashes in winter conditions, 2017-2021: 36 (1.7% of U.S. total)
- Worst year for winter driving, 2017-2021: 2018, 10 fatal crashes
- Avg. number of fatal crashes in winter conditions, 2017-2021: 7 per year
23. Colorado

- Winter weather fatal crash rate, 2017-2021: 1.35 per 100,000 licensed drivers
- Total fatal crashes in winter conditions, 2017-2021: 58 (2.7% of U.S. total)
- Worst year for winter driving, 2017-2021: 2021, 14 fatal crashes
- Avg. number of fatal crashes in winter conditions, 2017-2021: 12 per year
22. Illinois
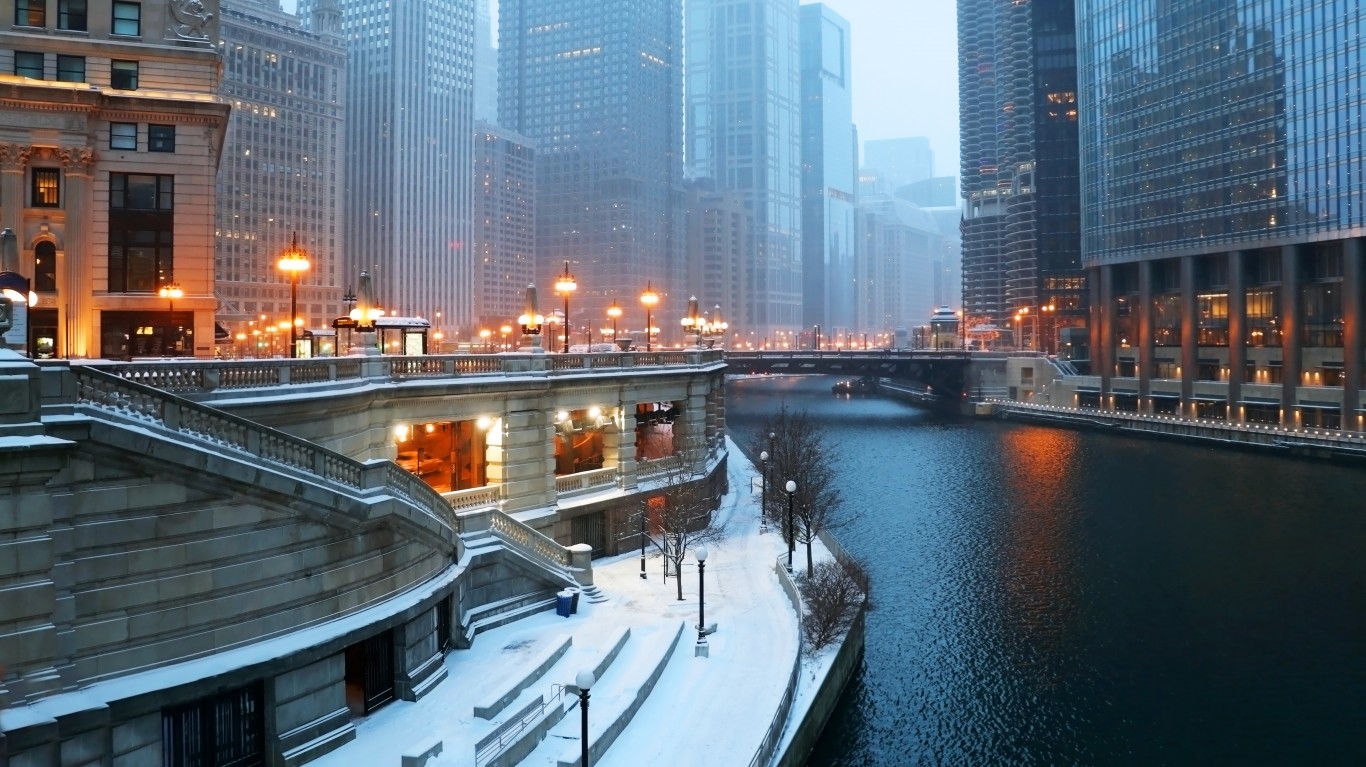
- Winter weather fatal crash rate, 2017-2021: 1.37 per 100,000 licensed drivers
- Total fatal crashes in winter conditions, 2017-2021: 113 (5.3% of U.S. total)
- Worst year for winter driving, 2017-2021: 2018, 32 fatal crashes
- Avg. number of fatal crashes in winter conditions, 2017-2021: 23 per year
21. Pennsylvania
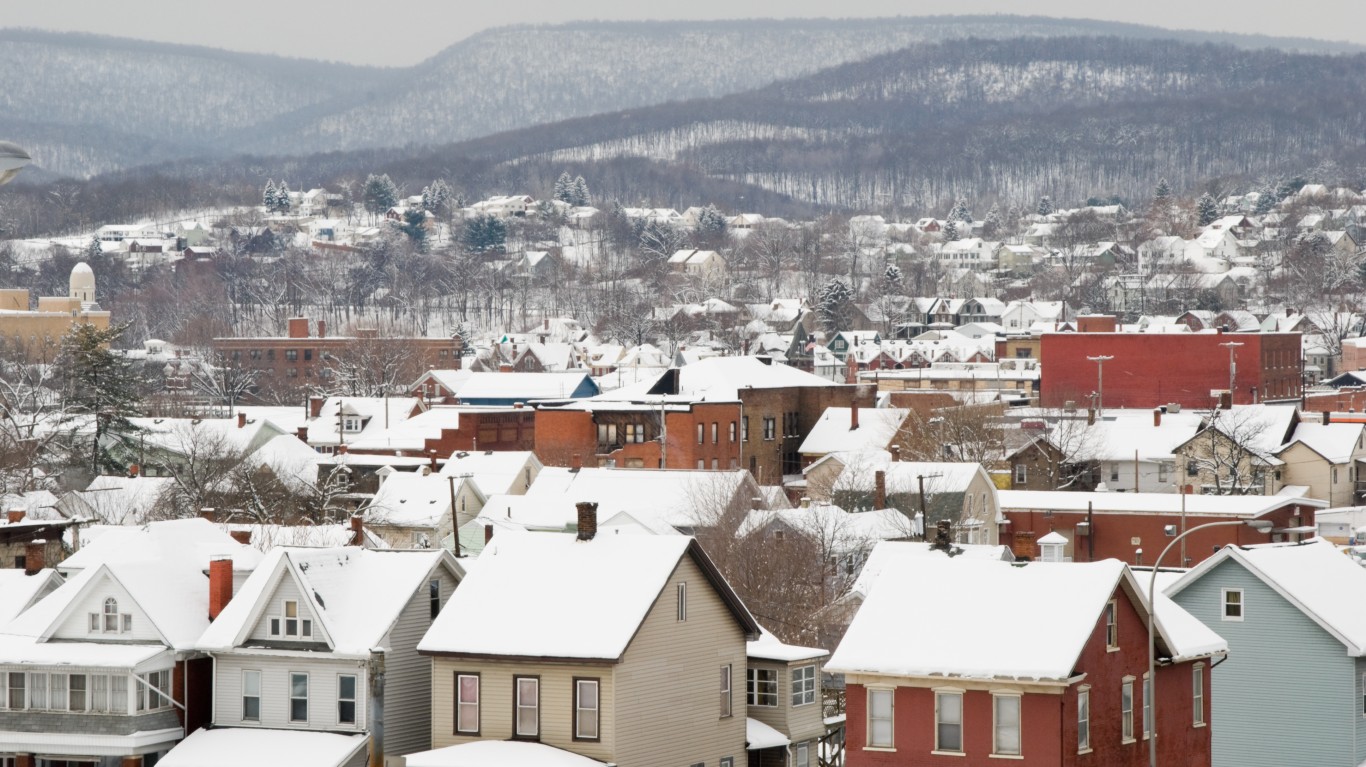
- Winter weather fatal crash rate, 2017-2021: 1.55 per 100,000 licensed drivers
- Total fatal crashes in winter conditions, 2017-2021: 138 (6.5% of U.S. total)
- Worst year for winter driving, 2017-2021: 2018, 30 fatal crashes
- Avg. number of fatal crashes in winter conditions, 2017-2021: 28 per year
20. Missouri
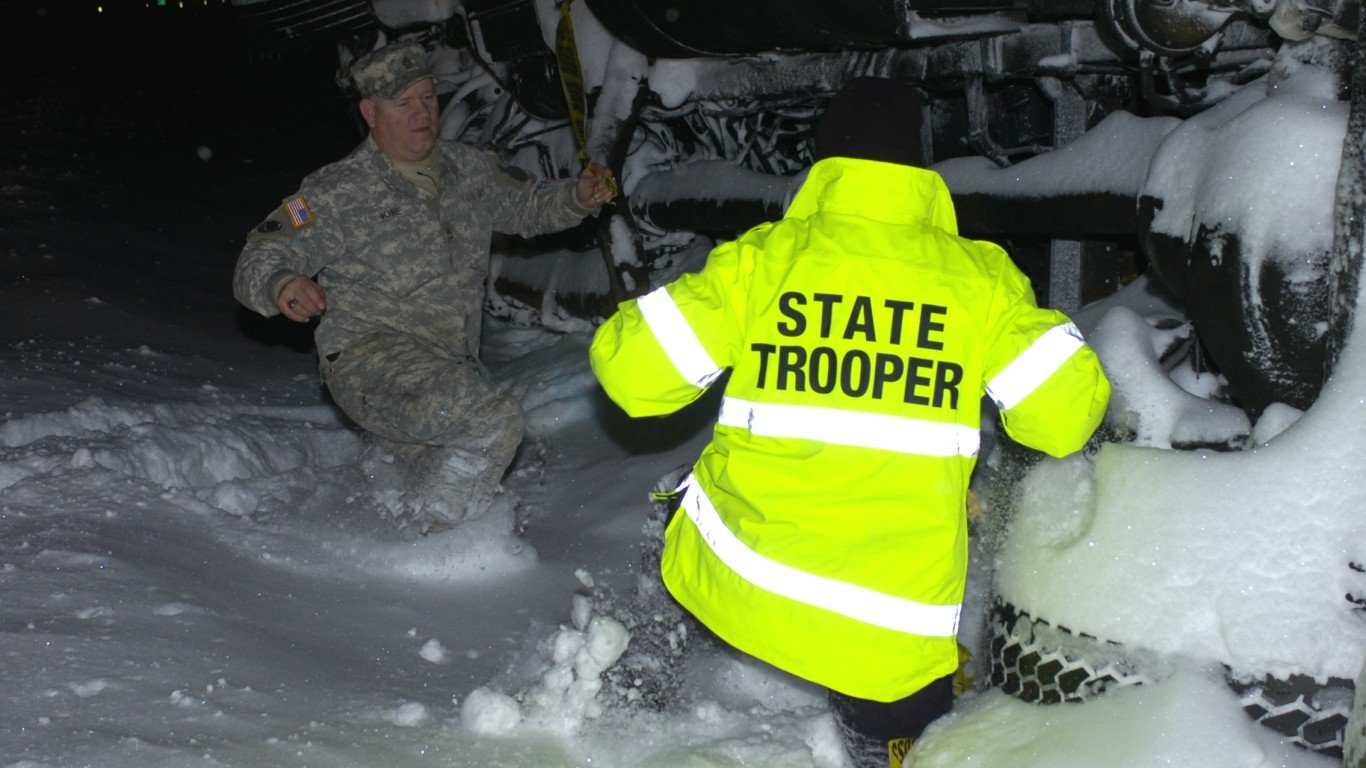
- Winter weather fatal crash rate, 2017-2021: 1.67 per 100,000 licensed drivers
- Total fatal crashes in winter conditions, 2017-2021: 71 (3.3% of U.S. total)
- Worst year for winter driving, 2017-2021: 2018, 28 fatal crashes
- Avg. number of fatal crashes in winter conditions, 2017-2021: 14 per year
19. Utah
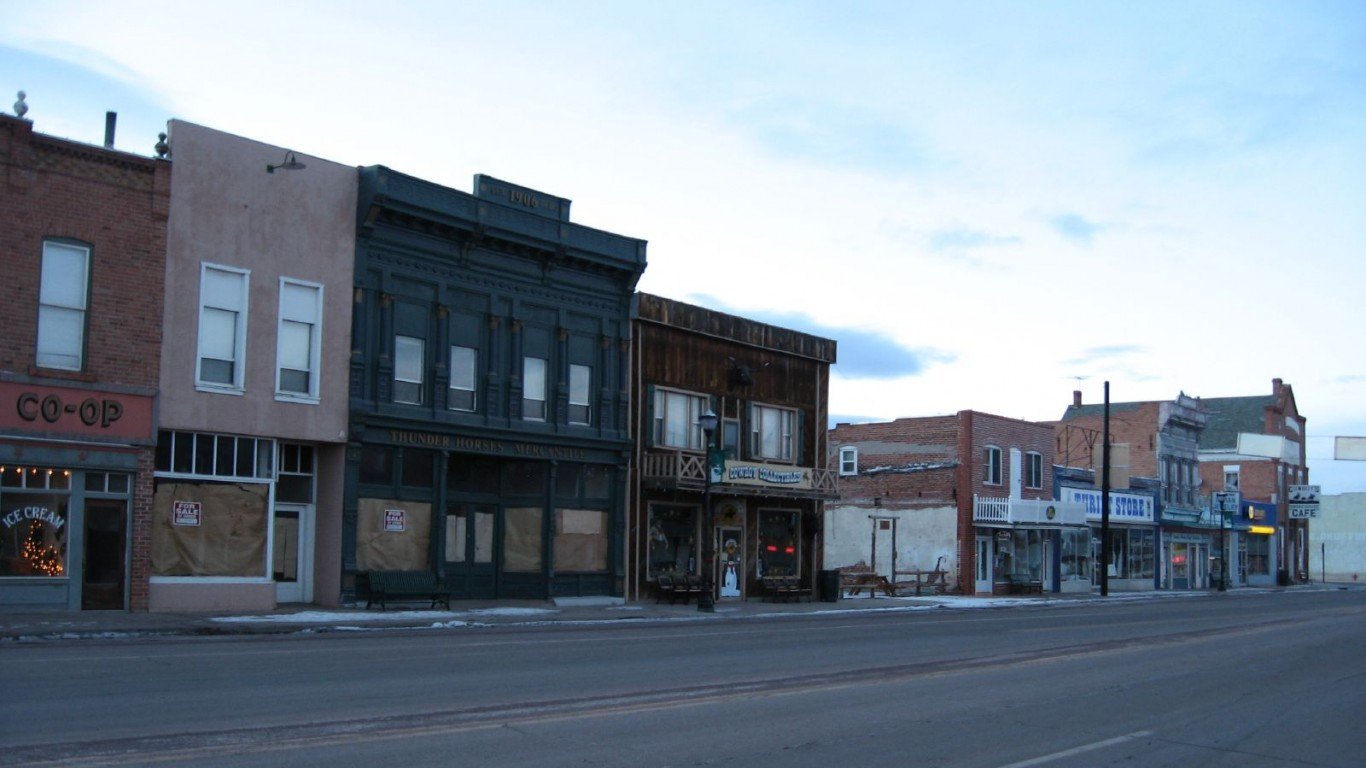
- Winter weather fatal crash rate, 2017-2021: 1.67 per 100,000 licensed drivers
- Total fatal crashes in winter conditions, 2017-2021: 36 (1.7% of U.S. total)
- Worst year for winter driving, 2017-2021: 2017, 8 fatal crashes
- Avg. number of fatal crashes in winter conditions, 2017-2021: 7 per year
18. Ohio
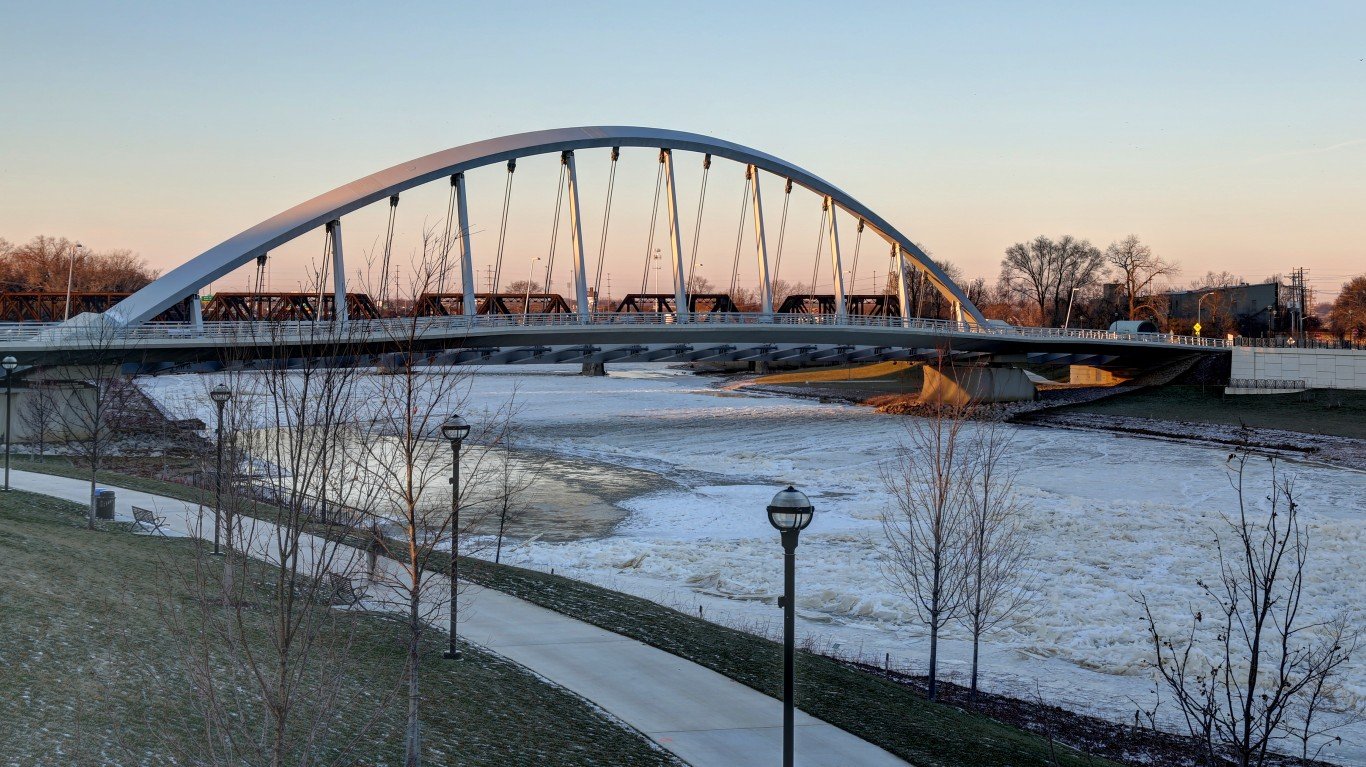
- Winter weather fatal crash rate, 2017-2021: 1.88 per 100,000 licensed drivers
- Total fatal crashes in winter conditions, 2017-2021: 152 (7.1% of U.S. total)
- Worst year for winter driving, 2017-2021: 2018, 36 fatal crashes
- Avg. number of fatal crashes in winter conditions, 2017-2021: 30 per year
17. Indiana
- Winter weather fatal crash rate, 2017-2021: 1.94 per 100,000 licensed drivers
- Total fatal crashes in winter conditions, 2017-2021: 88 (4.1% of U.S. total)
- Worst year for winter driving, 2017-2021: 2018, 23 fatal crashes
- Avg. number of fatal crashes in winter conditions, 2017-2021: 18 per year
16. Kansas
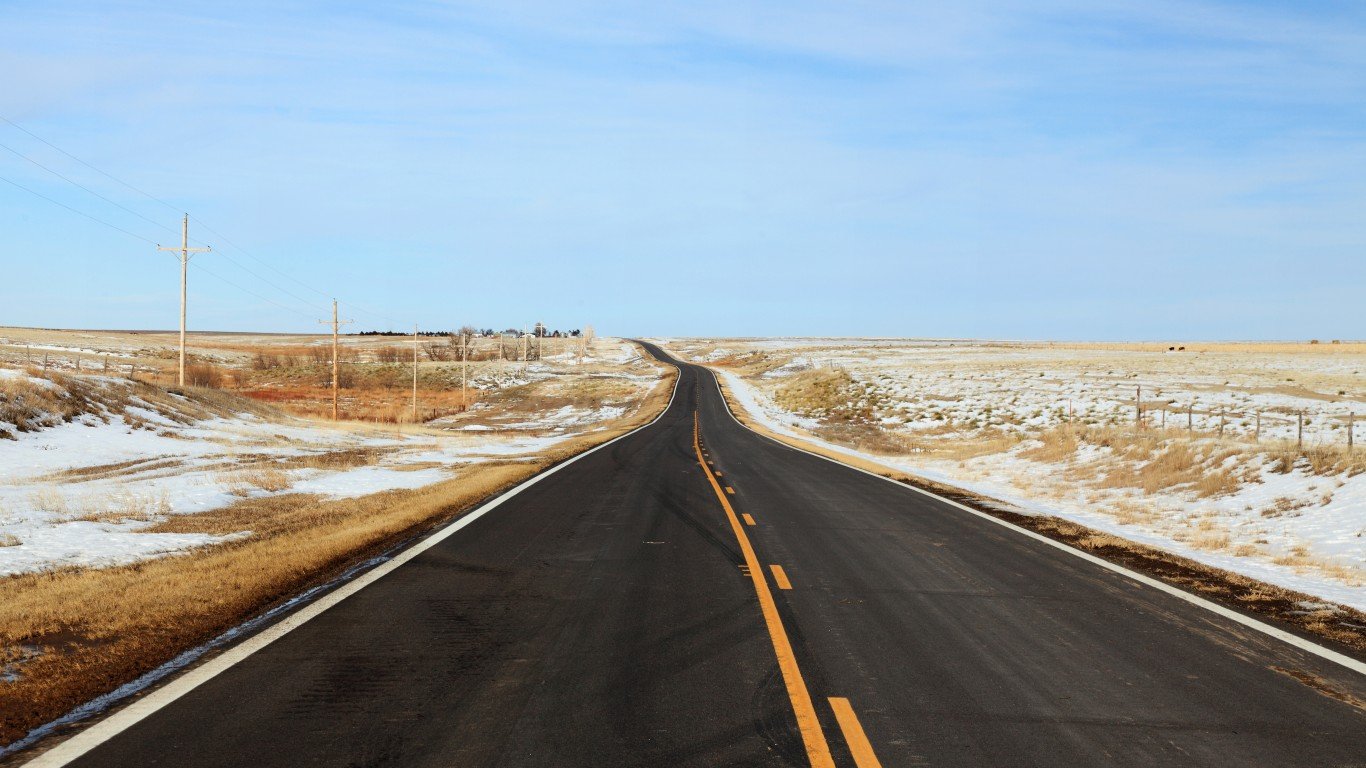
- Winter weather fatal crash rate, 2017-2021: 2.25 per 100,000 licensed drivers
- Total fatal crashes in winter conditions, 2017-2021: 45 (2.1% of U.S. total)
- Worst year for winter driving, 2017-2021: 2019, 15 fatal crashes
- Avg. number of fatal crashes in winter conditions, 2017-2021: 9 per year
15. Wisconsin

- Winter weather fatal crash rate, 2017-2021: 2.41 per 100,000 licensed drivers
- Total fatal crashes in winter conditions, 2017-2021: 104 (4.9% of U.S. total)
- Worst year for winter driving, 2017-2021: 2018, 30 fatal crashes
- Avg. number of fatal crashes in winter conditions, 2017-2021: 21 per year
14. Idaho
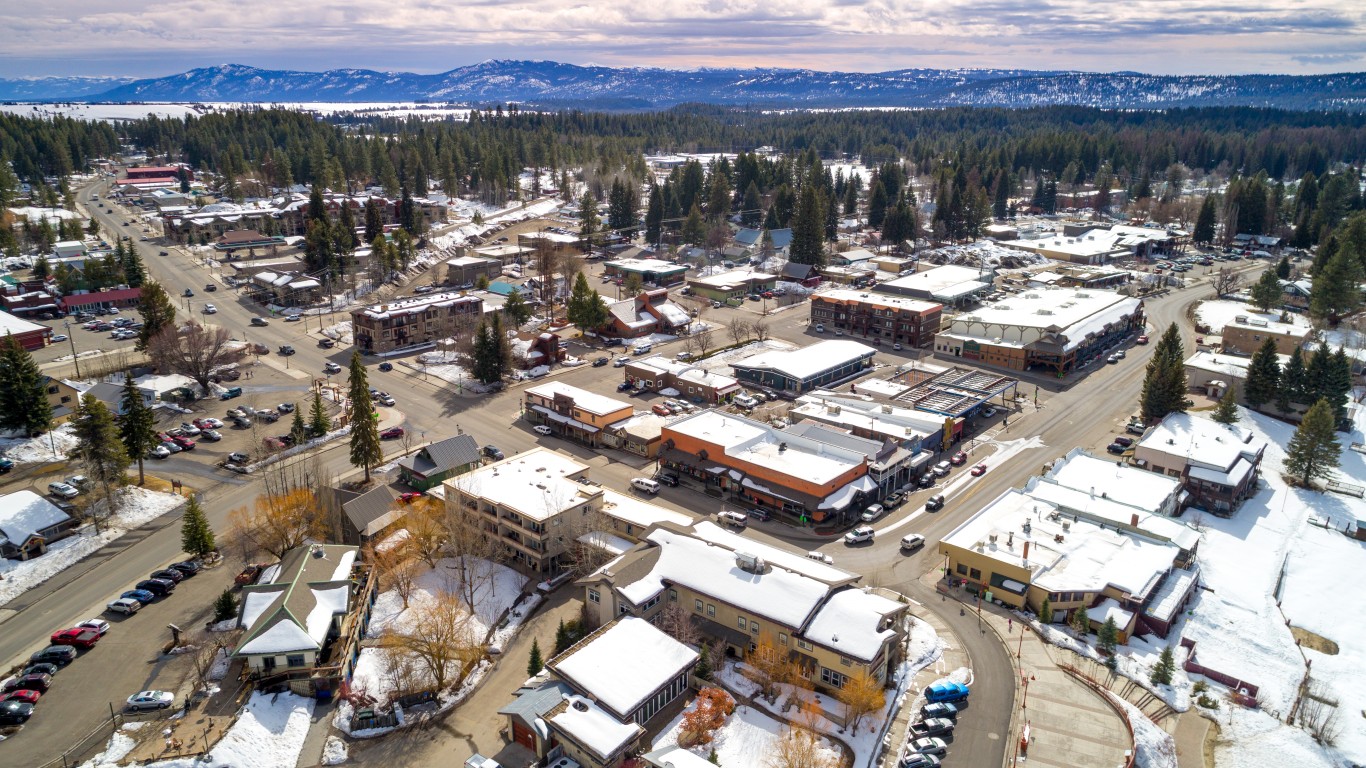
- Winter weather fatal crash rate, 2017-2021: 2.41 per 100,000 licensed drivers
- Total fatal crashes in winter conditions, 2017-2021: 31 (1.5% of U.S. total)
- Worst year for winter driving, 2017-2021: 2019, 10 fatal crashes
- Avg. number of fatal crashes in winter conditions, 2017-2021: 6 per year
13. Minnesota
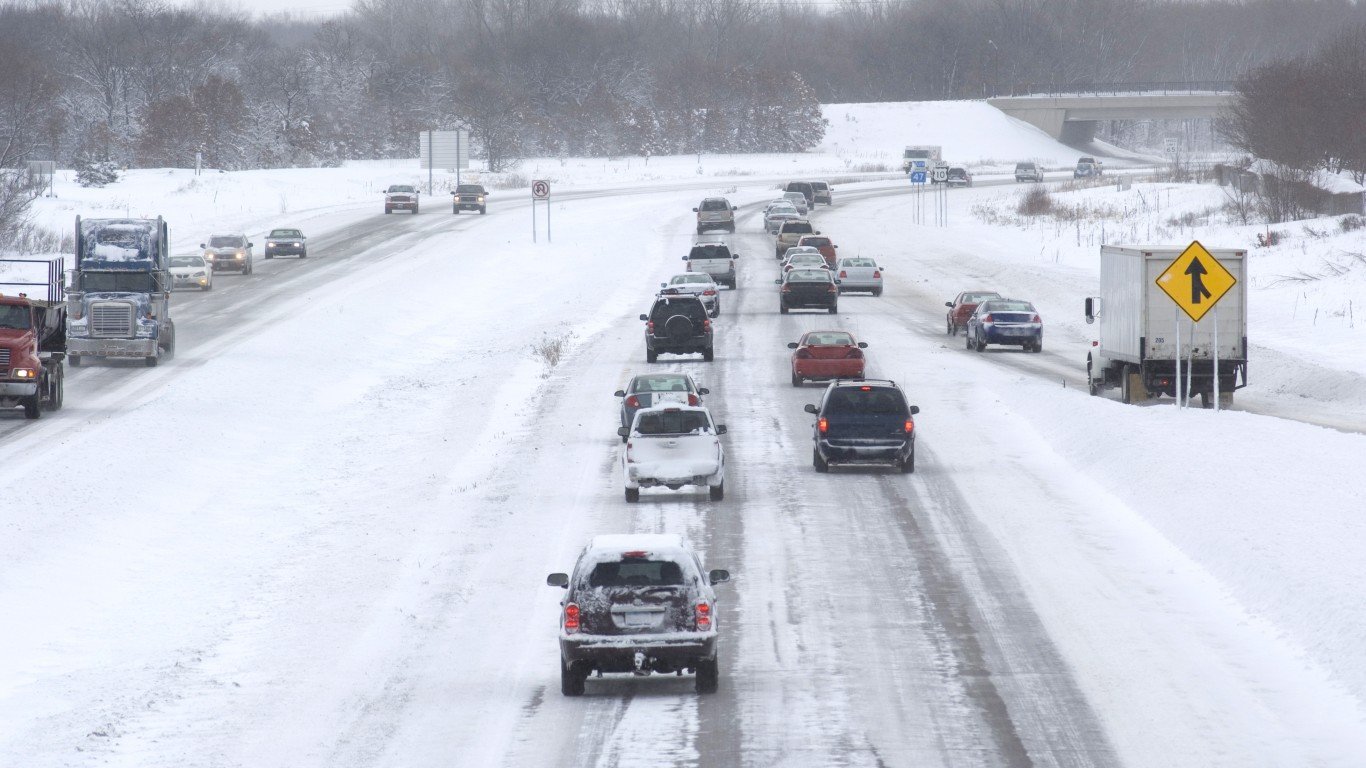
- Winter weather fatal crash rate, 2017-2021: 2.44 per 100,000 licensed drivers
- Total fatal crashes in winter conditions, 2017-2021: 100 (4.7% of U.S. total)
- Worst year for winter driving, 2017-2021: 2018, 25 fatal crashes
- Avg. number of fatal crashes in winter conditions, 2017-2021: 20 per year
12. New Hampshire
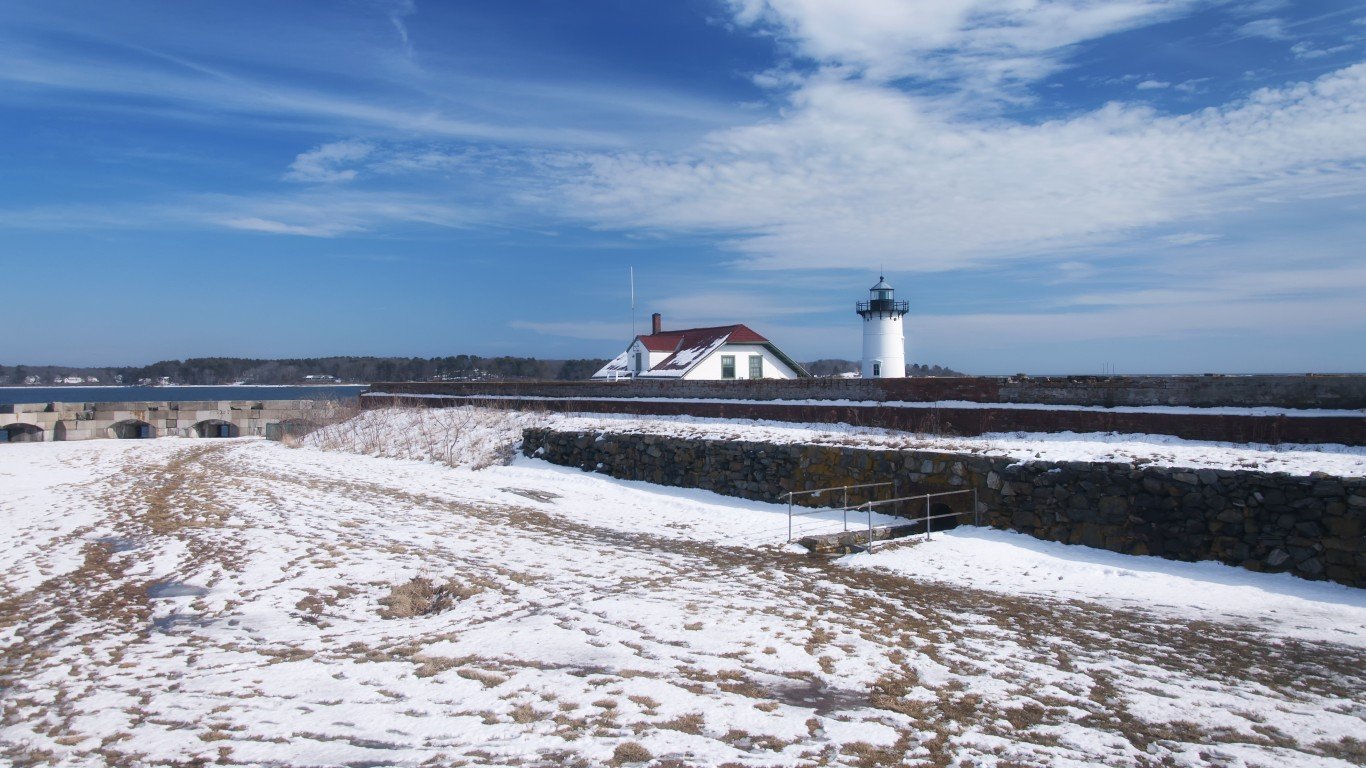
- Winter weather fatal crash rate, 2017-2021: 2.55 per 100,000 licensed drivers
- Total fatal crashes in winter conditions, 2017-2021: 27 (1.3% of U.S. total)
- Worst year for winter driving, 2017-2021: 2017, 10 fatal crashes
- Avg. number of fatal crashes in winter conditions, 2017-2021: 5 per year
11. Iowa
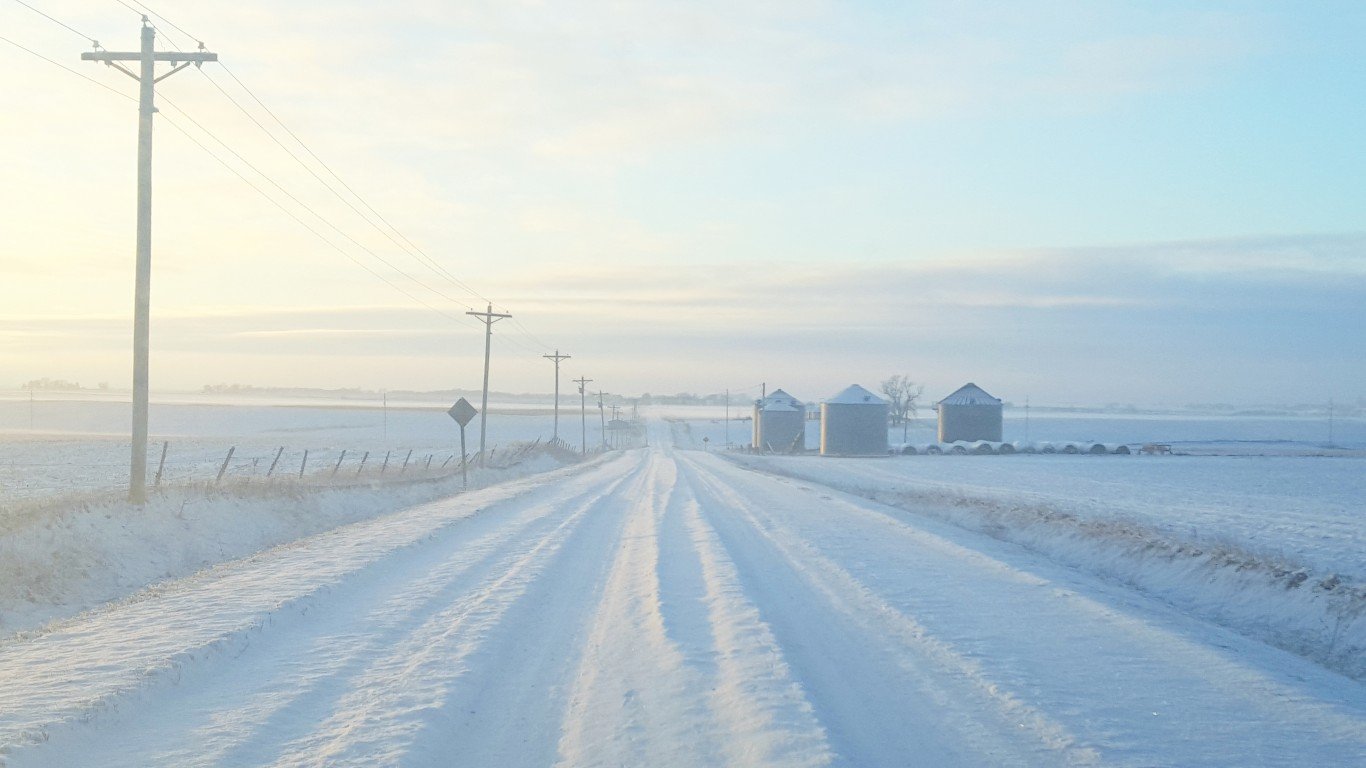
- Winter weather fatal crash rate, 2017-2021: 2.73 per 100,000 licensed drivers
- Total fatal crashes in winter conditions, 2017-2021: 62 (2.9% of U.S. total)
- Worst year for winter driving, 2017-2021: 2019, 20 fatal crashes
- Avg. number of fatal crashes in winter conditions, 2017-2021: 12 per year
10. Maine
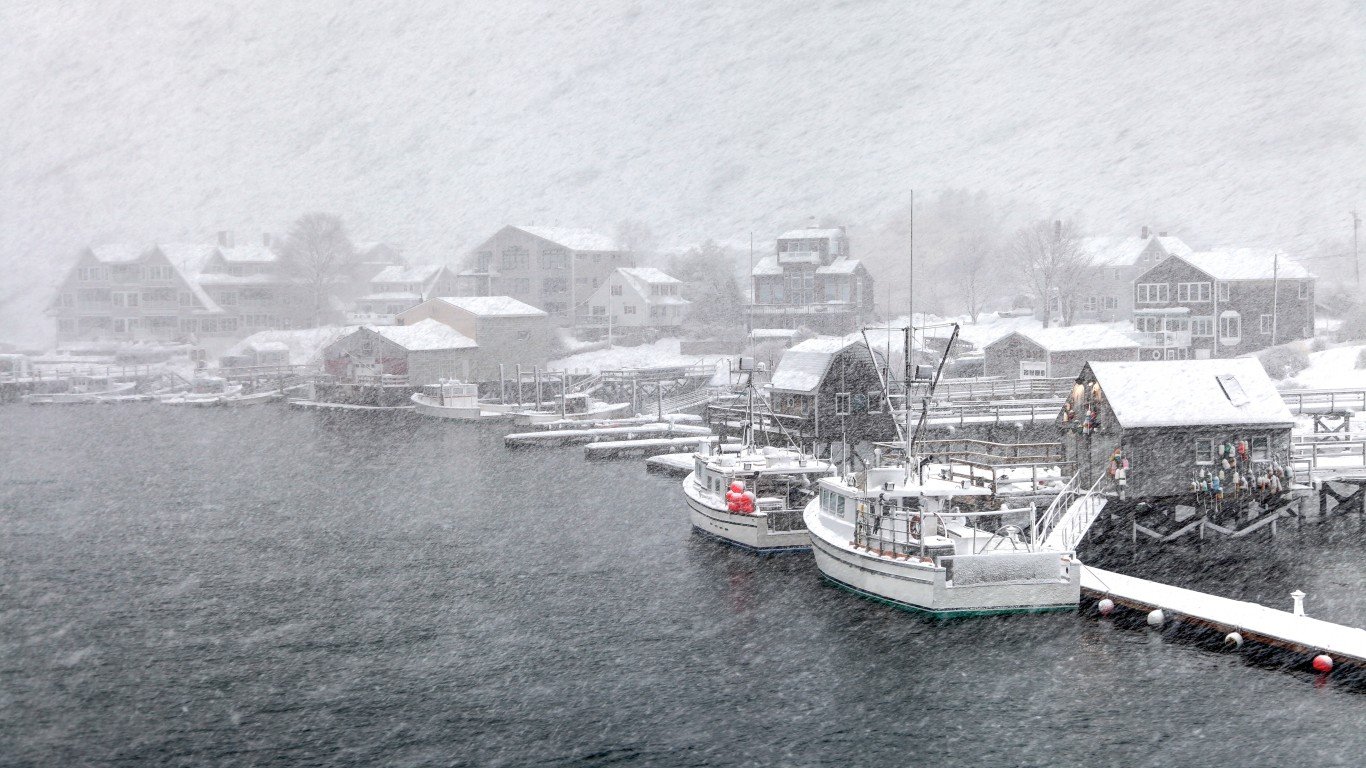
- Winter weather fatal crash rate, 2017-2021: 3.05 per 100,000 licensed drivers
- Total fatal crashes in winter conditions, 2017-2021: 32 (1.5% of U.S. total)
- Worst year for winter driving, 2017-2021: 2018, 10 fatal crashes
- Avg. number of fatal crashes in winter conditions, 2017-2021: 6 per year
9. Michigan
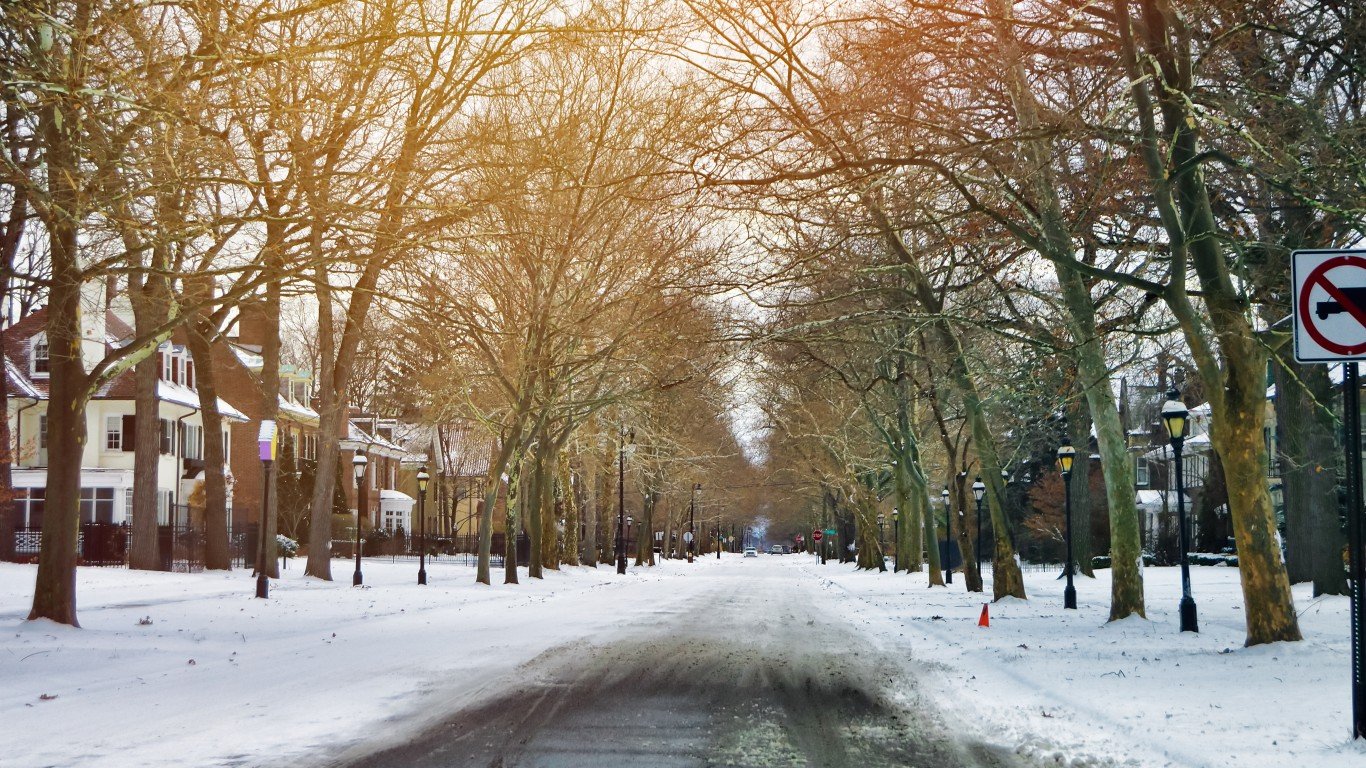
- Winter weather fatal crash rate, 2017-2021: 3.15 per 100,000 licensed drivers
- Total fatal crashes in winter conditions, 2017-2021: 221 (10.4% of U.S. total)
- Worst year for winter driving, 2017-2021: 2018, 56 fatal crashes
- Avg. number of fatal crashes in winter conditions, 2017-2021: 44 per year
8. West Virginia
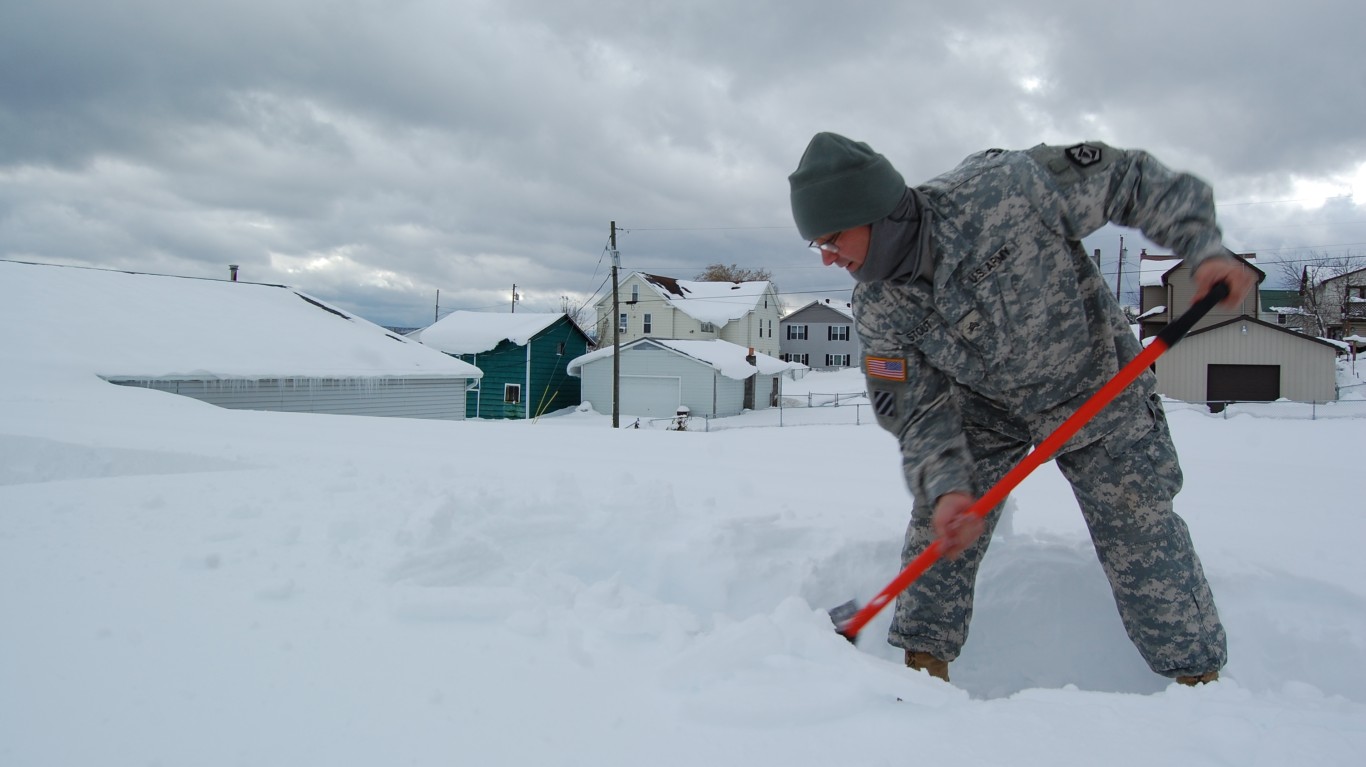
- Winter weather fatal crash rate, 2017-2021: 3.27 per 100,000 licensed drivers
- Total fatal crashes in winter conditions, 2017-2021: 36 (1.7% of U.S. total)
- Worst year for winter driving, 2017-2021: 2019, 11 fatal crashes
- Avg. number of fatal crashes in winter conditions, 2017-2021: 7 per year
7. Nebraska
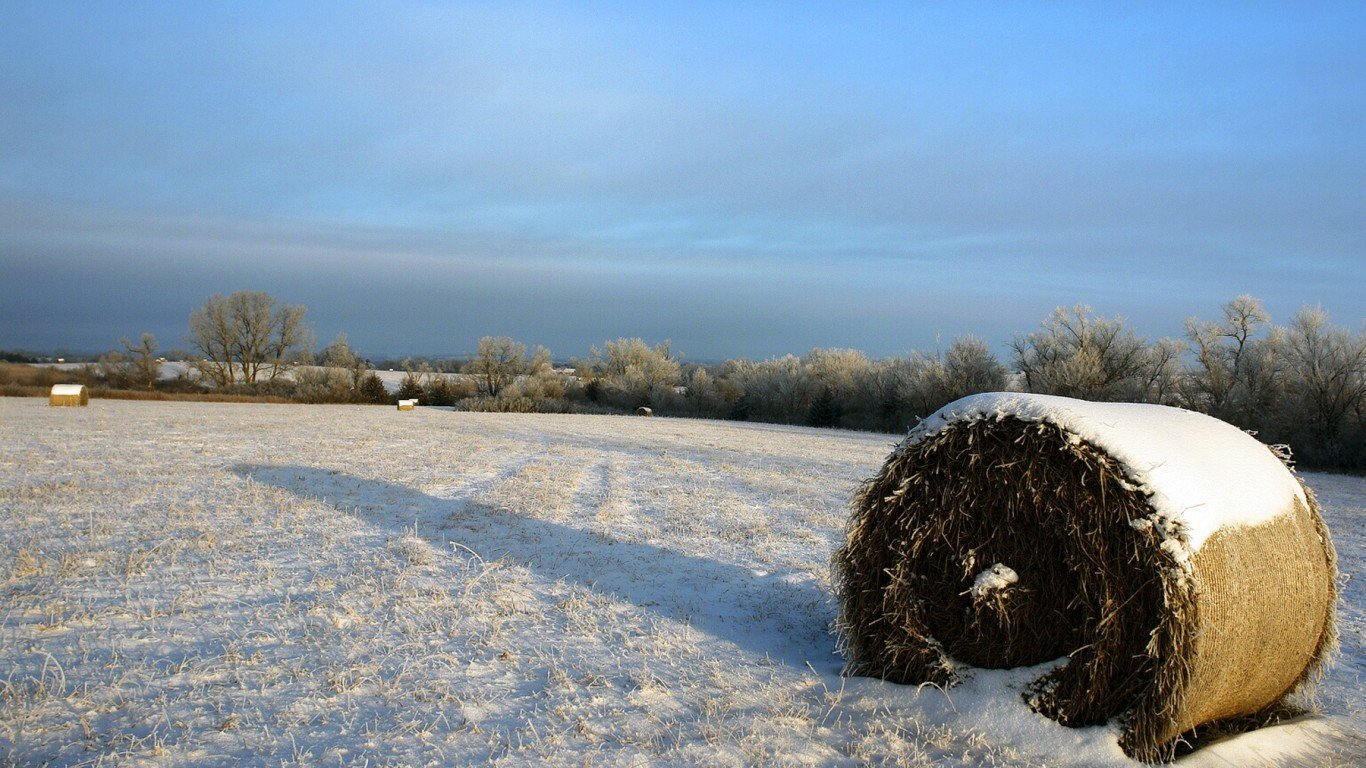
- Winter weather fatal crash rate, 2017-2021: 3.61 per 100,000 licensed drivers
- Total fatal crashes in winter conditions, 2017-2021: 52 (2.4% of U.S. total)
- Worst year for winter driving, 2017-2021: 2018, 18 fatal crashes
- Avg. number of fatal crashes in winter conditions, 2017-2021: 10 per year
6. South Dakota
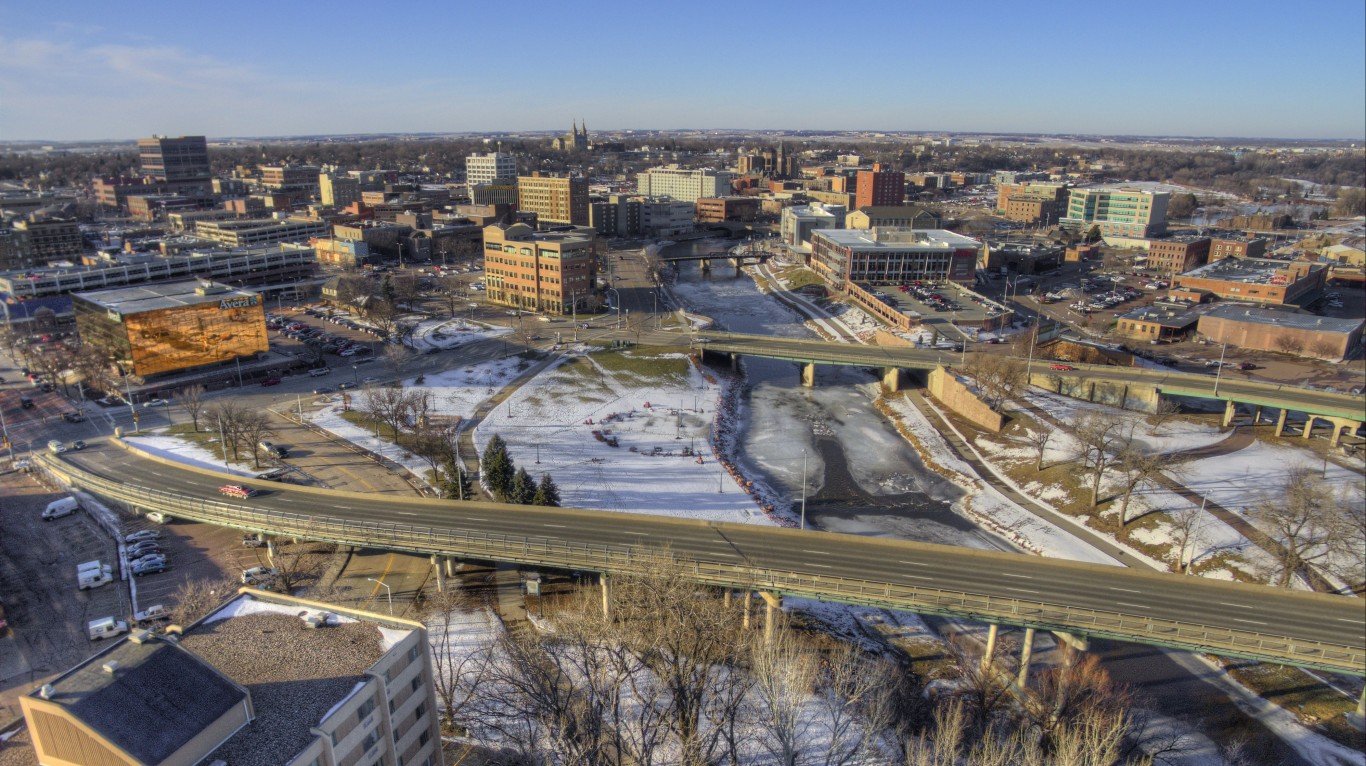
- Winter weather fatal crash rate, 2017-2021: 4.10 per 100,000 licensed drivers
- Total fatal crashes in winter conditions, 2017-2021: 27 (1.3% of U.S. total)
- Worst year for winter driving, 2017-2021: 2020, 8 fatal crashes
- Avg. number of fatal crashes in winter conditions, 2017-2021: 5 per year
5. North Dakota
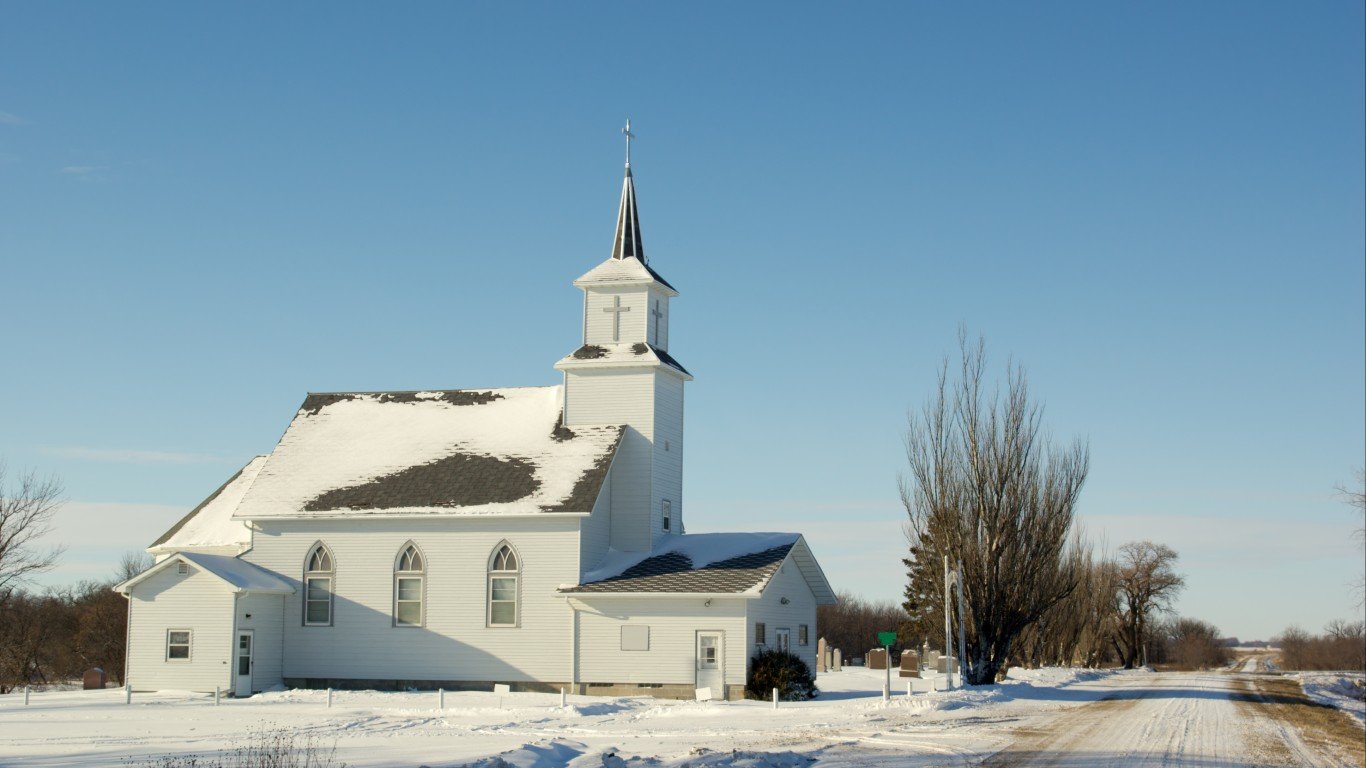
- Winter weather fatal crash rate, 2017-2021: 5.38 per 100,000 licensed drivers
- Total fatal crashes in winter conditions, 2017-2021: 29 (1.4% of U.S. total)
- Worst year for winter driving, 2017-2021: 2018, 11 fatal crashes
- Avg. number of fatal crashes in winter conditions, 2017-2021: 6 per year
4. Vermont

- Winter weather fatal crash rate, 2017-2021: 5.42 per 100,000 licensed drivers
- Total fatal crashes in winter conditions, 2017-2021: 25 (1.2% of U.S. total)
- Worst year for winter driving, 2017-2021: 2018, 7 fatal crashes
- Avg. number of fatal crashes in winter conditions, 2017-2021: 5 per year
3. Montana
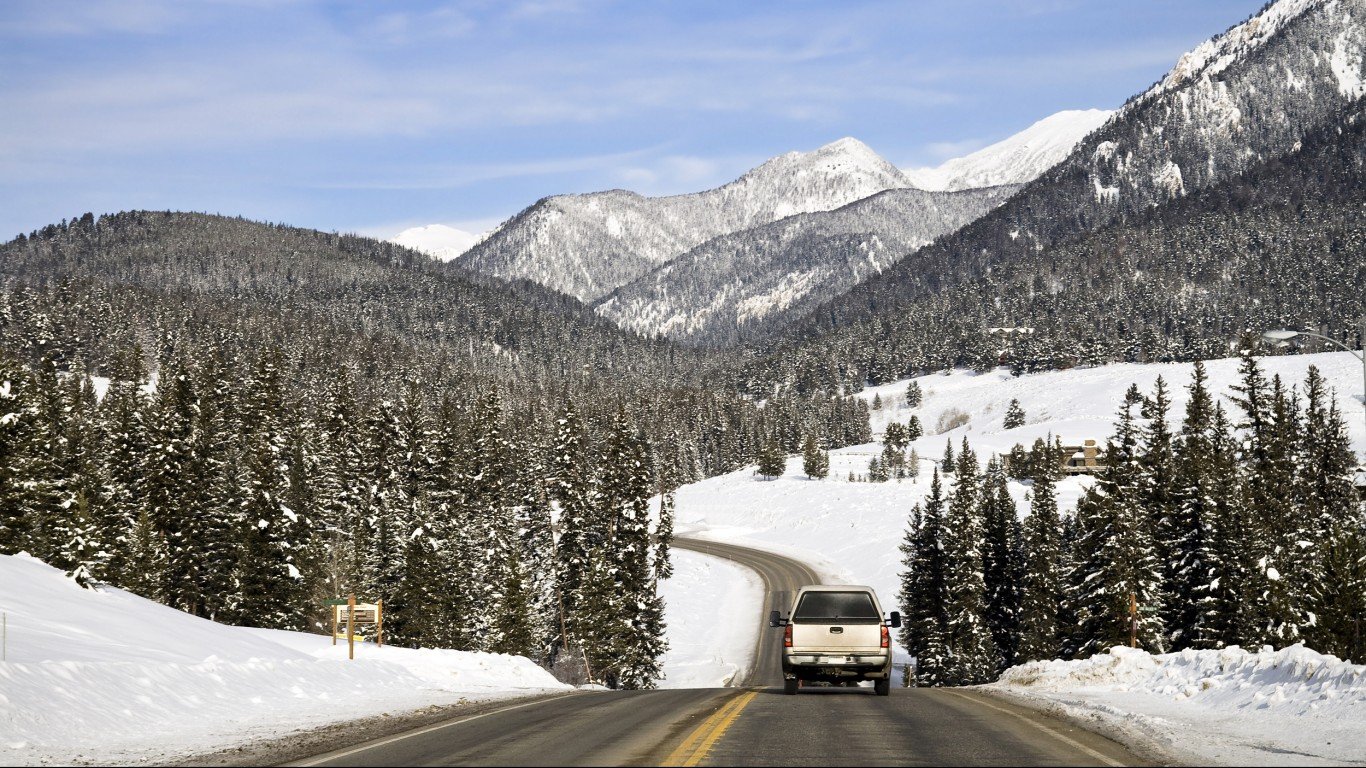
- Winter weather fatal crash rate, 2017-2021: 5.44 per 100,000 licensed drivers
- Total fatal crashes in winter conditions, 2017-2021: 45 (2.1% of U.S. total)
- Worst year for winter driving, 2017-2021: 2021, 13 fatal crashes
- Avg. number of fatal crashes in winter conditions, 2017-2021: 9 per year
2. Alaska
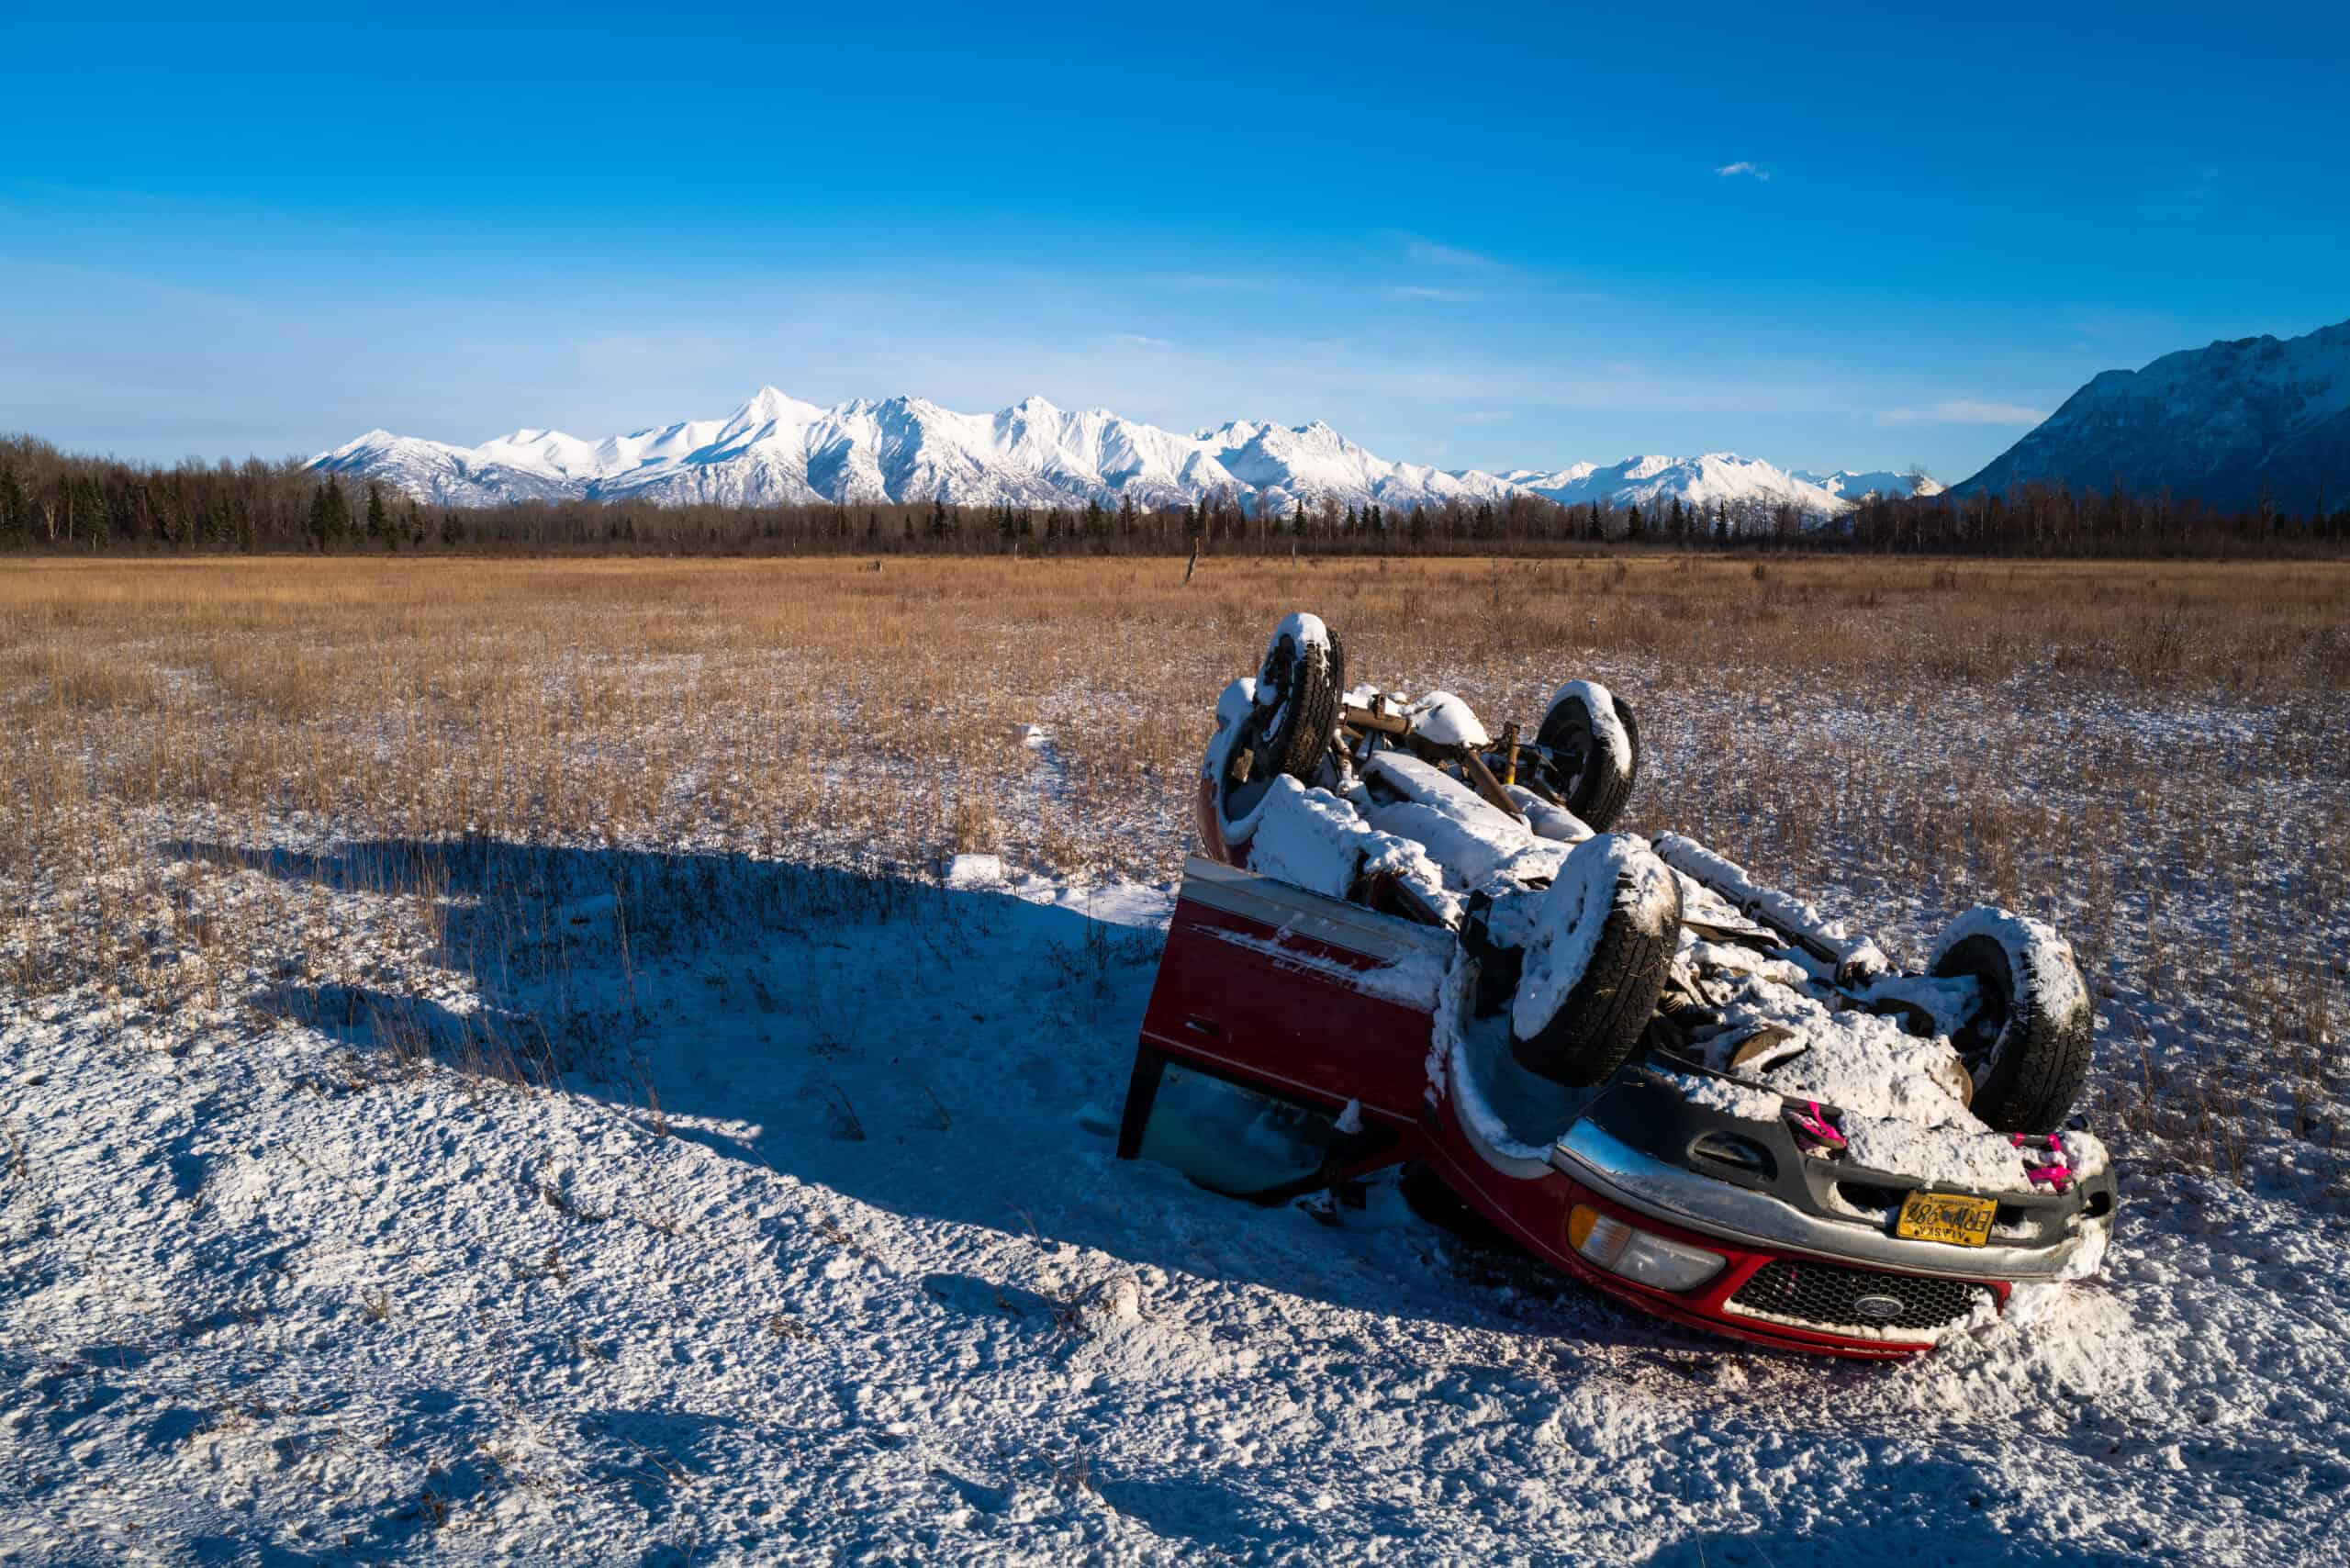
- Winter weather fatal crash rate, 2017-2021: 8.48 per 100,000 licensed drivers
- Total fatal crashes in winter conditions, 2017-2021: 44 (2.1% of U.S. total)
- Worst year for winter driving, 2017-2021: 2017, 10 fatal crashes
- Avg. number of fatal crashes in winter conditions, 2017-2021: 9 per year
1. Wyoming
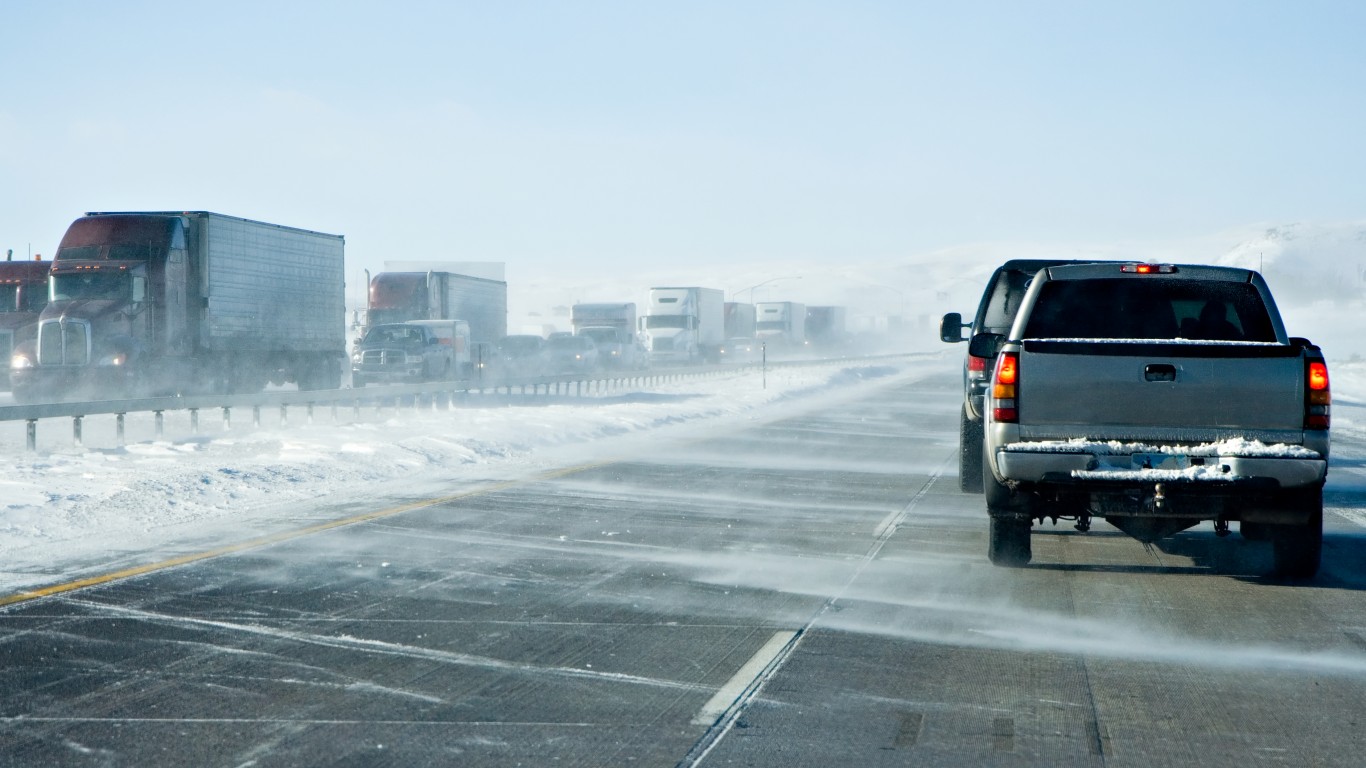
- Winter weather fatal crash rate, 2017-2021: 12.17 per 100,000 licensed drivers
- Total fatal crashes in winter conditions, 2017-2021: 52 (2.4% of U.S. total)
- Worst year for winter driving, 2017-2021: 2018, 14 fatal crashes
- Avg. number of fatal crashes in winter conditions, 2017-2021: 10 per year
Sponsored: Find a Qualified Financial Advisor
Finding a qualified financial advisor doesn’t have to be hard. SmartAsset’s free tool matches you with up to 3 fiduciary financial advisors in your area in 5 minutes. Each advisor has been vetted by SmartAsset and is held to a fiduciary standard to act in your best interests. If you’re ready to be matched with local advisors that can help you achieve your financial goals, get started now.
Thank you for reading! Have some feedback for us?
Contact the 24/7 Wall St. editorial team.

