Firearm sales have hit historic highs in the U.S. in recent years, and the ongoing proliferation of firearms may be fueling a rise in gun crime.
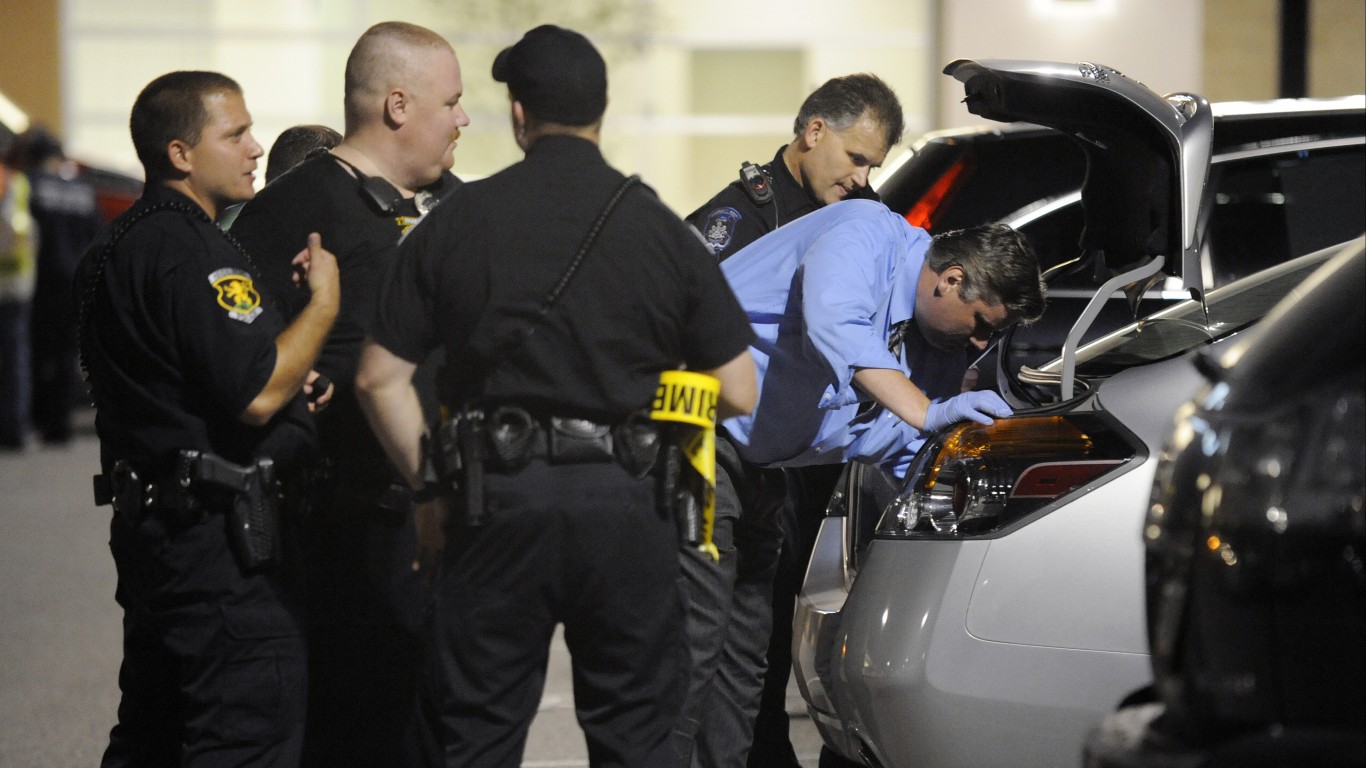
When firearms are recovered at a crime scene or taken from a suspect, they are often reported to the Bureau of Alcohol, Tobacco, Firearms, and Explosives for tracing. In these cases, the ATF assists in criminal investigations by using serial numbers and other markings to determine when and where a firearm was originally purchased — and over the last 12 years, firearm-related offenses have been taking up a growing share of federal resources.
Between 2010 and 2022, the number of guns traced by the ATF surged by 174%, from 145,600 to 399,400, climbing by anywhere from 3% to 18% in a single year. Most homicides in the U.S. are committed with a firearm, and over the same period, the national homicide rate climbed by over 50%.
While not all guns traced by the ATF were used in a crime — and not all firearms used for illicit purposes are traced – federal tracing data offers valuable insight into trends and geographic patterns related to gun violence in the United States.
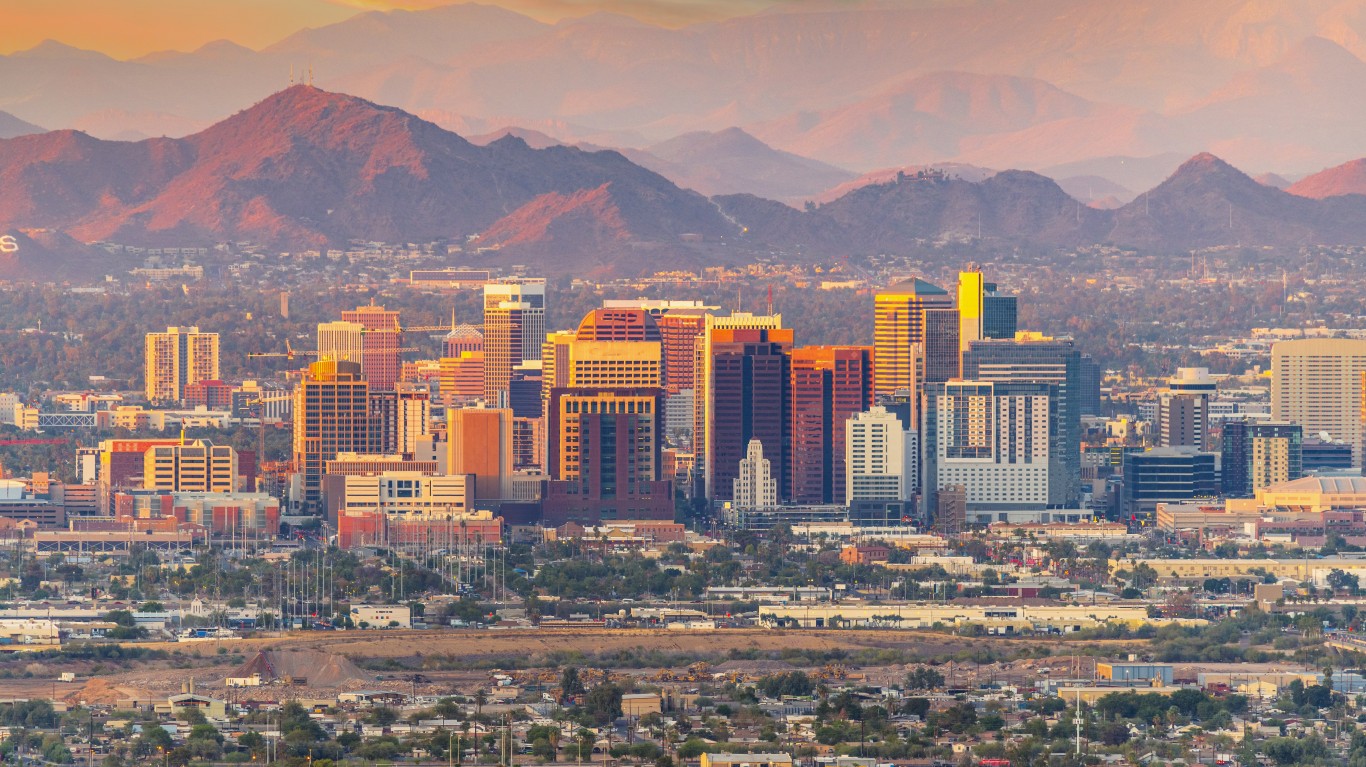
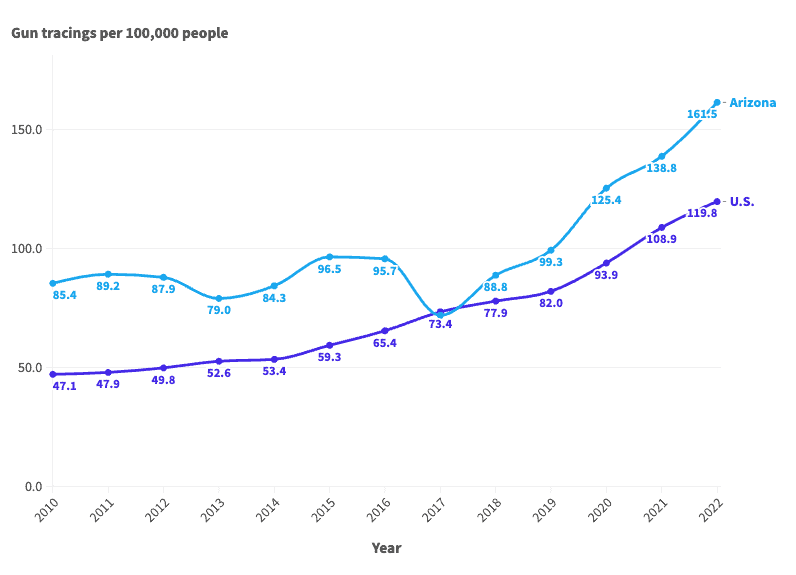
Mirroring the national trend, gun tracings are up sharply in Arizona. The ATF traced 11,885 seized firearms in the state in 2022, compared to 5,477 in 2010. Adjusting for population, gun crime has long been more common in Arizona than it is across the U.S. as a whole. In 12 of the last 13 years, the number of firearm tracings for every 100,000 people in the state was above the comparable national rate.
As of 2022, the most recent year of available data, the ATF traced 161.5 seized firearms for every 100,000 people in the state, the eighth highest gun-tracing rate among states.
2010: 5,477 firearms traced by the ATF
- Firearms traced by the ATF in Arizona, 2010: 85.4 per 100,000 people (2nd highest)
- Firearms traced by the ATF nationwide, 2010: 47.1 per 100,000 people
- Arizona homicide rate, 2010: 6.4 per 100,000 people (6th highest)
- U.S. homicide rate, 2010: 4.8 per 100,000 people
2011: 5,781 firearms traced by the ATF

- Firearms traced by the ATF in Arizona, 2011: 89.2 per 100,000 people (2nd highest)
- Firearms traced by the ATF nationwide, 2011: 47.9 per 100,000 people
- Arizona homicide rate, 2011: 6.1 per 100,000 people (8th highest)
- U.S. homicide rate, 2011: 4.7 per 100,000 people
2012: 5,762 firearms traced by the ATF
- Firearms traced by the ATF in Arizona, 2012: 87.9 per 100,000 people (2nd highest)
- Firearms traced by the ATF nationwide, 2012: 49.8 per 100,000 people
- Arizona homicide rate, 2012: 5.5 per 100,000 people (16th highest)
- U.S. homicide rate, 2012: 4.7 per 100,000 people
2013: 5,234 firearms traced by the ATF
- Firearms traced by the ATF in Arizona, 2013: 79.0 per 100,000 people (8th highest)
- Firearms traced by the ATF nationwide, 2013: 52.6 per 100,000 people
- Arizona homicide rate, 2013: 5.4 per 100,000 people (13th highest)
- U.S. homicide rate, 2013: 4.5 per 100,000 people
2014: 5,677 firearms traced by the ATF
- Firearms traced by the ATF in Arizona, 2014: 84.3 per 100,000 people (6th highest)
- Firearms traced by the ATF nationwide, 2014: 53.4 per 100,000 people
- Arizona homicide rate, 2014: 4.6 per 100,000 people (21st highest)
- U.S. homicide rate, 2014: 4.4 per 100,000 people
2015: 6,586 firearms traced by the ATF
- Firearms traced by the ATF in Arizona, 2015: 96.5 per 100,000 people (2nd highest)
- Firearms traced by the ATF nationwide, 2015: 59.3 per 100,000 people
- Arizona homicide rate, 2015: 4.5 per 100,000 people (24th lowest)
- U.S. homicide rate, 2015: 4.9 per 100,000 people
2016: 6,630 firearms traced by the ATF
- Firearms traced by the ATF in Arizona, 2016: 95.7 per 100,000 people (6th highest)
- Firearms traced by the ATF nationwide, 2016: 65.4 per 100,000 people
- Arizona homicide rate, 2016: 5.6 per 100,000 people (22nd highest)
- U.S. homicide rate, 2016: 5.4 per 100,000 people
2017: 5,042 firearms traced by the ATF
- Firearms traced by the ATF in Arizona, 2017: 71.9 per 100,000 people (24th highest)
- Firearms traced by the ATF nationwide, 2017: 73.4 per 100,000 people
- Arizona homicide rate, 2017: 6.0 per 100,000 people (18th highest)
- U.S. homicide rate, 2017: 5.3 per 100,000 people
2018: 6,369 firearms traced by the ATF
- Firearms traced by the ATF in Arizona, 2018: 88.8 per 100,000 people (17th highest)
- Firearms traced by the ATF nationwide, 2018: 77.9 per 100,000 people
- Arizona homicide rate, 2018: 5.4 per 100,000 people (20th highest)
- U.S. homicide rate, 2018: 5.0 per 100,000 people
2019: 7,228 firearms traced by the ATF
- Firearms traced by the ATF in Arizona, 2019: 99.3 per 100,000 people (16th highest)
- Firearms traced by the ATF nationwide, 2019: 82.0 per 100,000 people
- Arizona homicide rate, 2019: 5.4 per 100,000 people (18th highest)
- U.S. homicide rate, 2019: 5.1 per 100,000 people
2020: 8,994 firearms traced by the ATF
- Firearms traced by the ATF in Arizona, 2020: 125.4 per 100,000 people (11th highest)
- Firearms traced by the ATF nationwide, 2020: 93.9 per 100,000 people
- Arizona homicide rate, 2020: 6.9 per 100,000 people (20th highest)
- U.S. homicide rate, 2020: 6.5 per 100,000 people
2021: 10,097 firearms traced by the ATF
- Firearms traced by the ATF in Arizona, 2021: 138.8 per 100,000 people (12th highest)
- Firearms traced by the ATF nationwide, 2021: 108.9 per 100,000 people
- Arizona homicide rate, 2021: 6.0 per 100,000 people
- U.S. homicide rate, 2021: 7.7 per 100,000 people
2022: 11,885 firearms traced by the ATF
- Firearms traced by the ATF in Arizona, 2022: 161.5 per 100,000 people (8th highest)
- Firearms traced by the ATF nationwide, 2022: 119.8 per 100,000 people
- Arizona homicide rate, 2022: 6.4 per 100,000 people (24th lowest)
- U.S. homicide rate, 2022: 7.3 per 100,000 people
| Year | Firearm tracings per 100,000 people in Arizona | Firearm tracings per 100,000 people in the US | Total firearms traced by the ATF in Arizona | Total firearms traced by the ATF in the US |
|---|---|---|---|---|
| 2022 | 161.5 | 119.8 | 11,885 | 399,397 |
| 2021 | 138.8 | 108.9 | 10,097 | 361,587 |
| 2020 | 125.4 | 93.9 | 8,994 | 306,686 |
| 2019 | 99.3 | 82.0 | 7,228 | 269,250 |
| 2018 | 88.8 | 77.9 | 6,369 | 254,700 |
| 2017 | 71.9 | 73.4 | 5,042 | 239,175 |
| 2016 | 95.7 | 65.4 | 6,630 | 211,384 |
| 2015 | 96.5 | 59.3 | 6,586 | 190,538 |
| 2014 | 84.3 | 53.4 | 5,677 | 170,344 |
| 2013 | 79.0 | 52.6 | 5,234 | 166,426 |
| 2012 | 87.9 | 49.8 | 5,762 | 156,346 |
| 2011 | 89.2 | 47.9 | 5,781 | 149,276 |
| 2010 | 85.4 | 47.1 | 5,477 | 145,604 |
Contact [email protected] for any questions or corrections.