The National Hurricane Center is tracking a low pressure system in the Atlantic Ocean that could become the first hurricane of the 2024 season. Located far in the Atlantic, the disturbance has a 90% chance of becoming a tropical depression or tropical storm later Friday or Saturday, the NHS noted. Then it is expected to move westward at 15 to 20 mph and approach the Lesser Antilles by the end of the weekend.
In general, forecasters at the National Weather Service predict above-normal hurricane activity for the 2024 Atlantic hurricane season (from June 1 to Nov. 30). They expect eight to 13 hurricanes (winds of 74 mph or higher) in the season, including four to seven major hurricanes (category 3, 4, 5; with winds of 111 mph or higher).
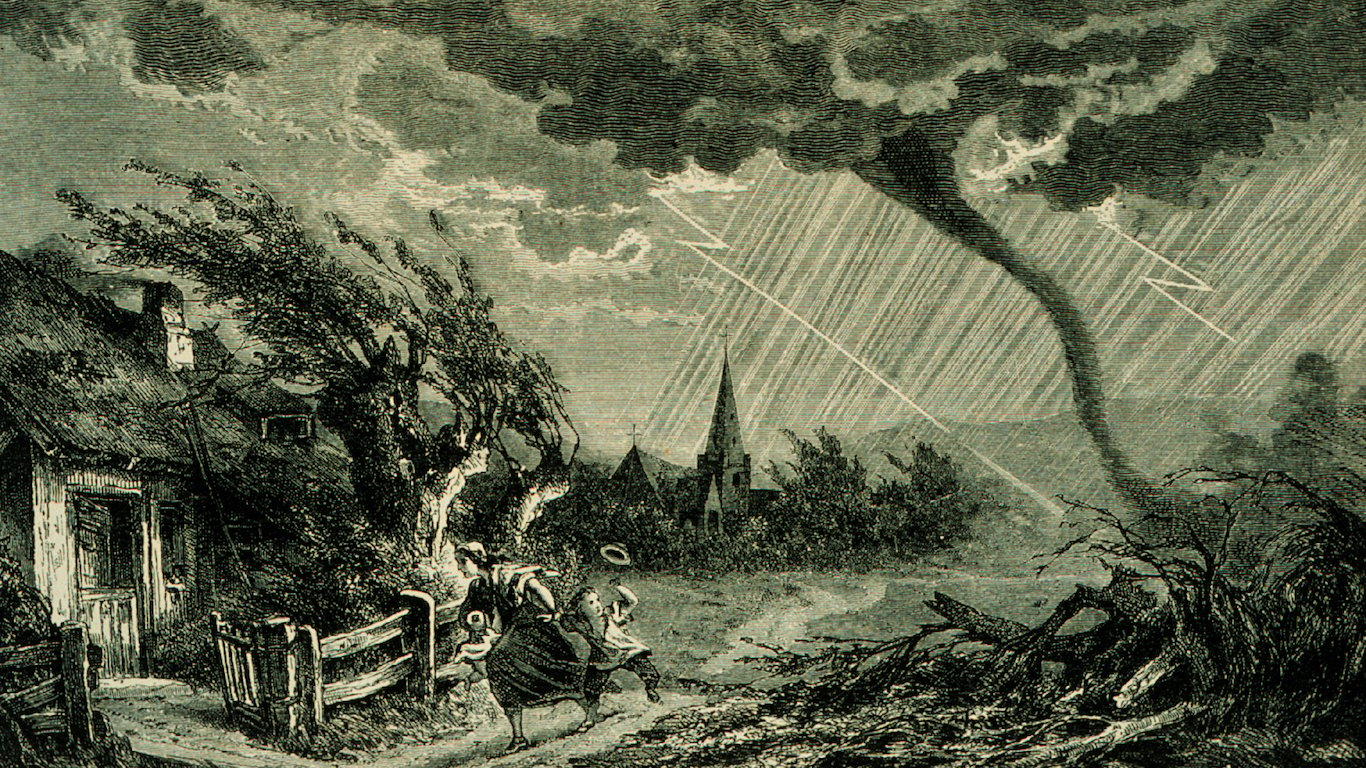
One way to measure the intensity of a hurricane is using atmospheric pressure. On a basic level, the lower the atmospheric pressure, the more intense the hurricane. The reason is that in a depression, air is rising around the low, cools and condenses, forming clouds and rain and snow. As the amount of rising air increases, air from the sides rushes in to replace the rising air near the center of the storm. The stronger the rising of air in the center, the faster the air must rush in from the sides, causing strong winds.
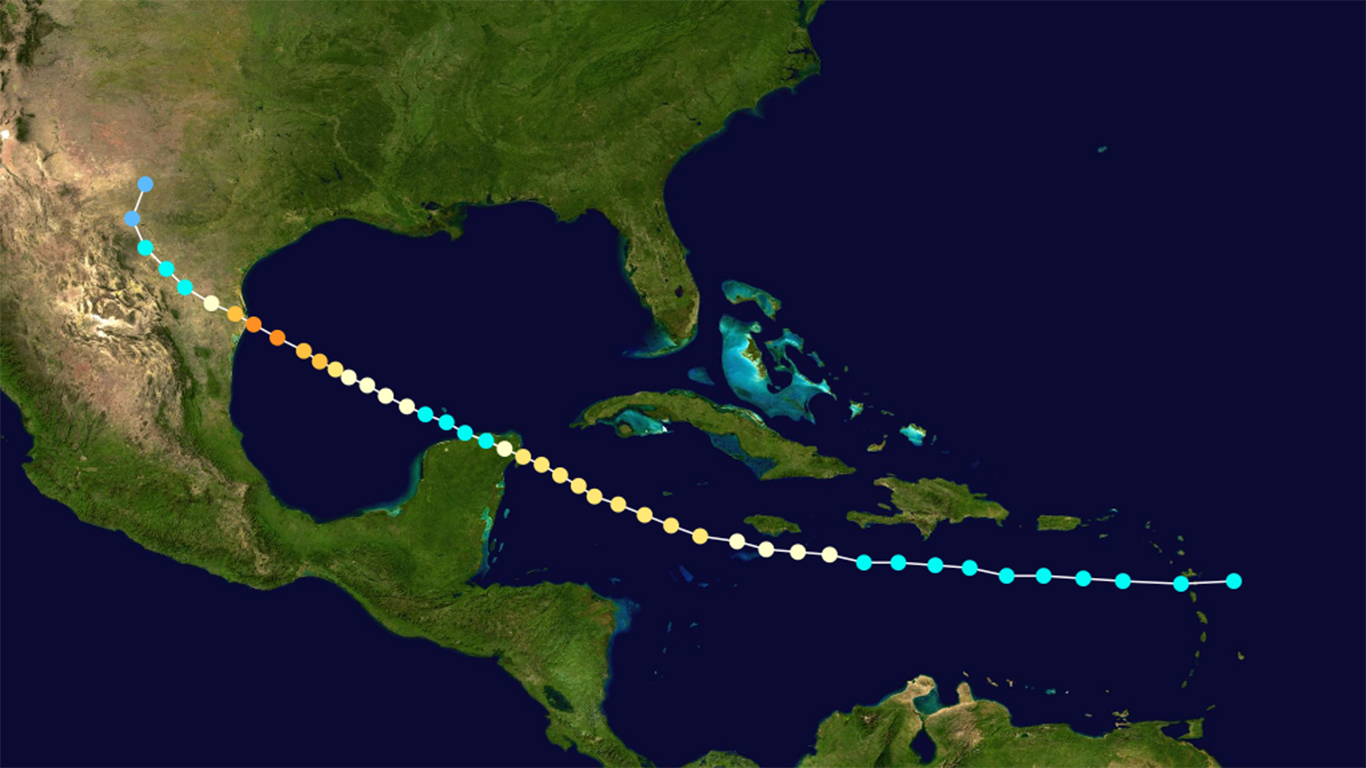
To find the most powerful hurricanes of all time, 24/7 Wall St. used data from NOAA ‘s HURDAT2 Best Track Data dating back to 1851 to update a previous ranking we did. We ranked tropical cyclones formed in the Atlantic and the Pacific based on estimated central pressure at time of landfall for all hurricanes. Hurricanes were ranked according to their minimum pressure in millibars.
For context, the average sea level air pressure is about 1013 millibars, but the 57 storms on the list had minimum pressure of 942 millibars or lower. (Also see, Every Billion Dollar Weather Disaster in the US in the Past Year.)
The earliest hurricane on the list is the “Last Island Hurricane” of August 1856. The hurricane made landfall on Last Island, Louisiana, with winds at 150 mph and a low pressure of 934 millibars. Overall, the hurricane, which ranks 31 on the list, resulted in at least 300 fatalities.
The latest hurricane on the list is Hurricane Otis in late October 2023. The hurricane produced catastrophic damage when it made landfall near Acapulco, Mexico, as a category 5 hurricane. At landfall, it had a pressure of just 929 millibars and wind of about 160 mph. Otis, which ranks 17 on the list, caused at least 52 fatalities and an estimated $12–16 billion of damage in Mexico,
Interestingly, 26 of the 57 hurricanes on the list are from this millennia, year 2000 or later, including eight from this decade — 2020 or later.
Why are we covering this
Source: Public Domain / Wikimedia Commons
57. Hurricane Gloria (Sep 16, 1985 – Oct 2, 1985)

- Minimum pressure at landfall: 942 millibars
- Max. wind speed at landfall: 90 knots (~104 mph)
- Minimum pressure overall: 920 millibars
- Max wind speed measured: 125 knots (~144 mph)
- Areas affected: Bahamas, U.S. East Coast, New England
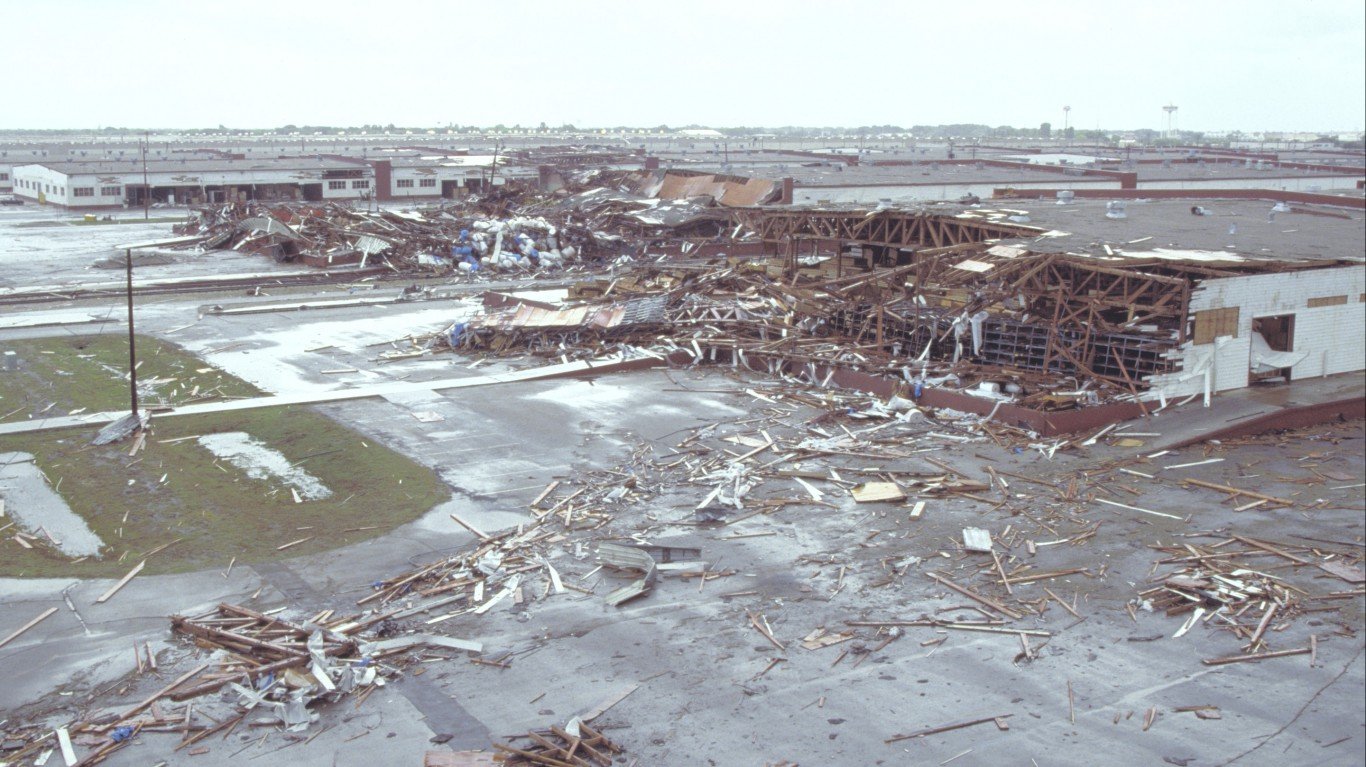
56. Hurricane Opal (Sep 27, 1995 – Oct 6, 1995)
Source: Public Domain / Wikimedia Commons
- Minimum pressure at landfall: 942 millibars
- Max. wind speed at landfall: 100 knots (~115 mph)
- Minimum pressure overall: 916 millibars
- Max wind speed measured: 130 knots (~150 mph)
- Areas affected: Eastern Mexico, Alabama, Florida
55. Hurricane Lidia (Oct 3, 2023 – Oct 11, 2023)
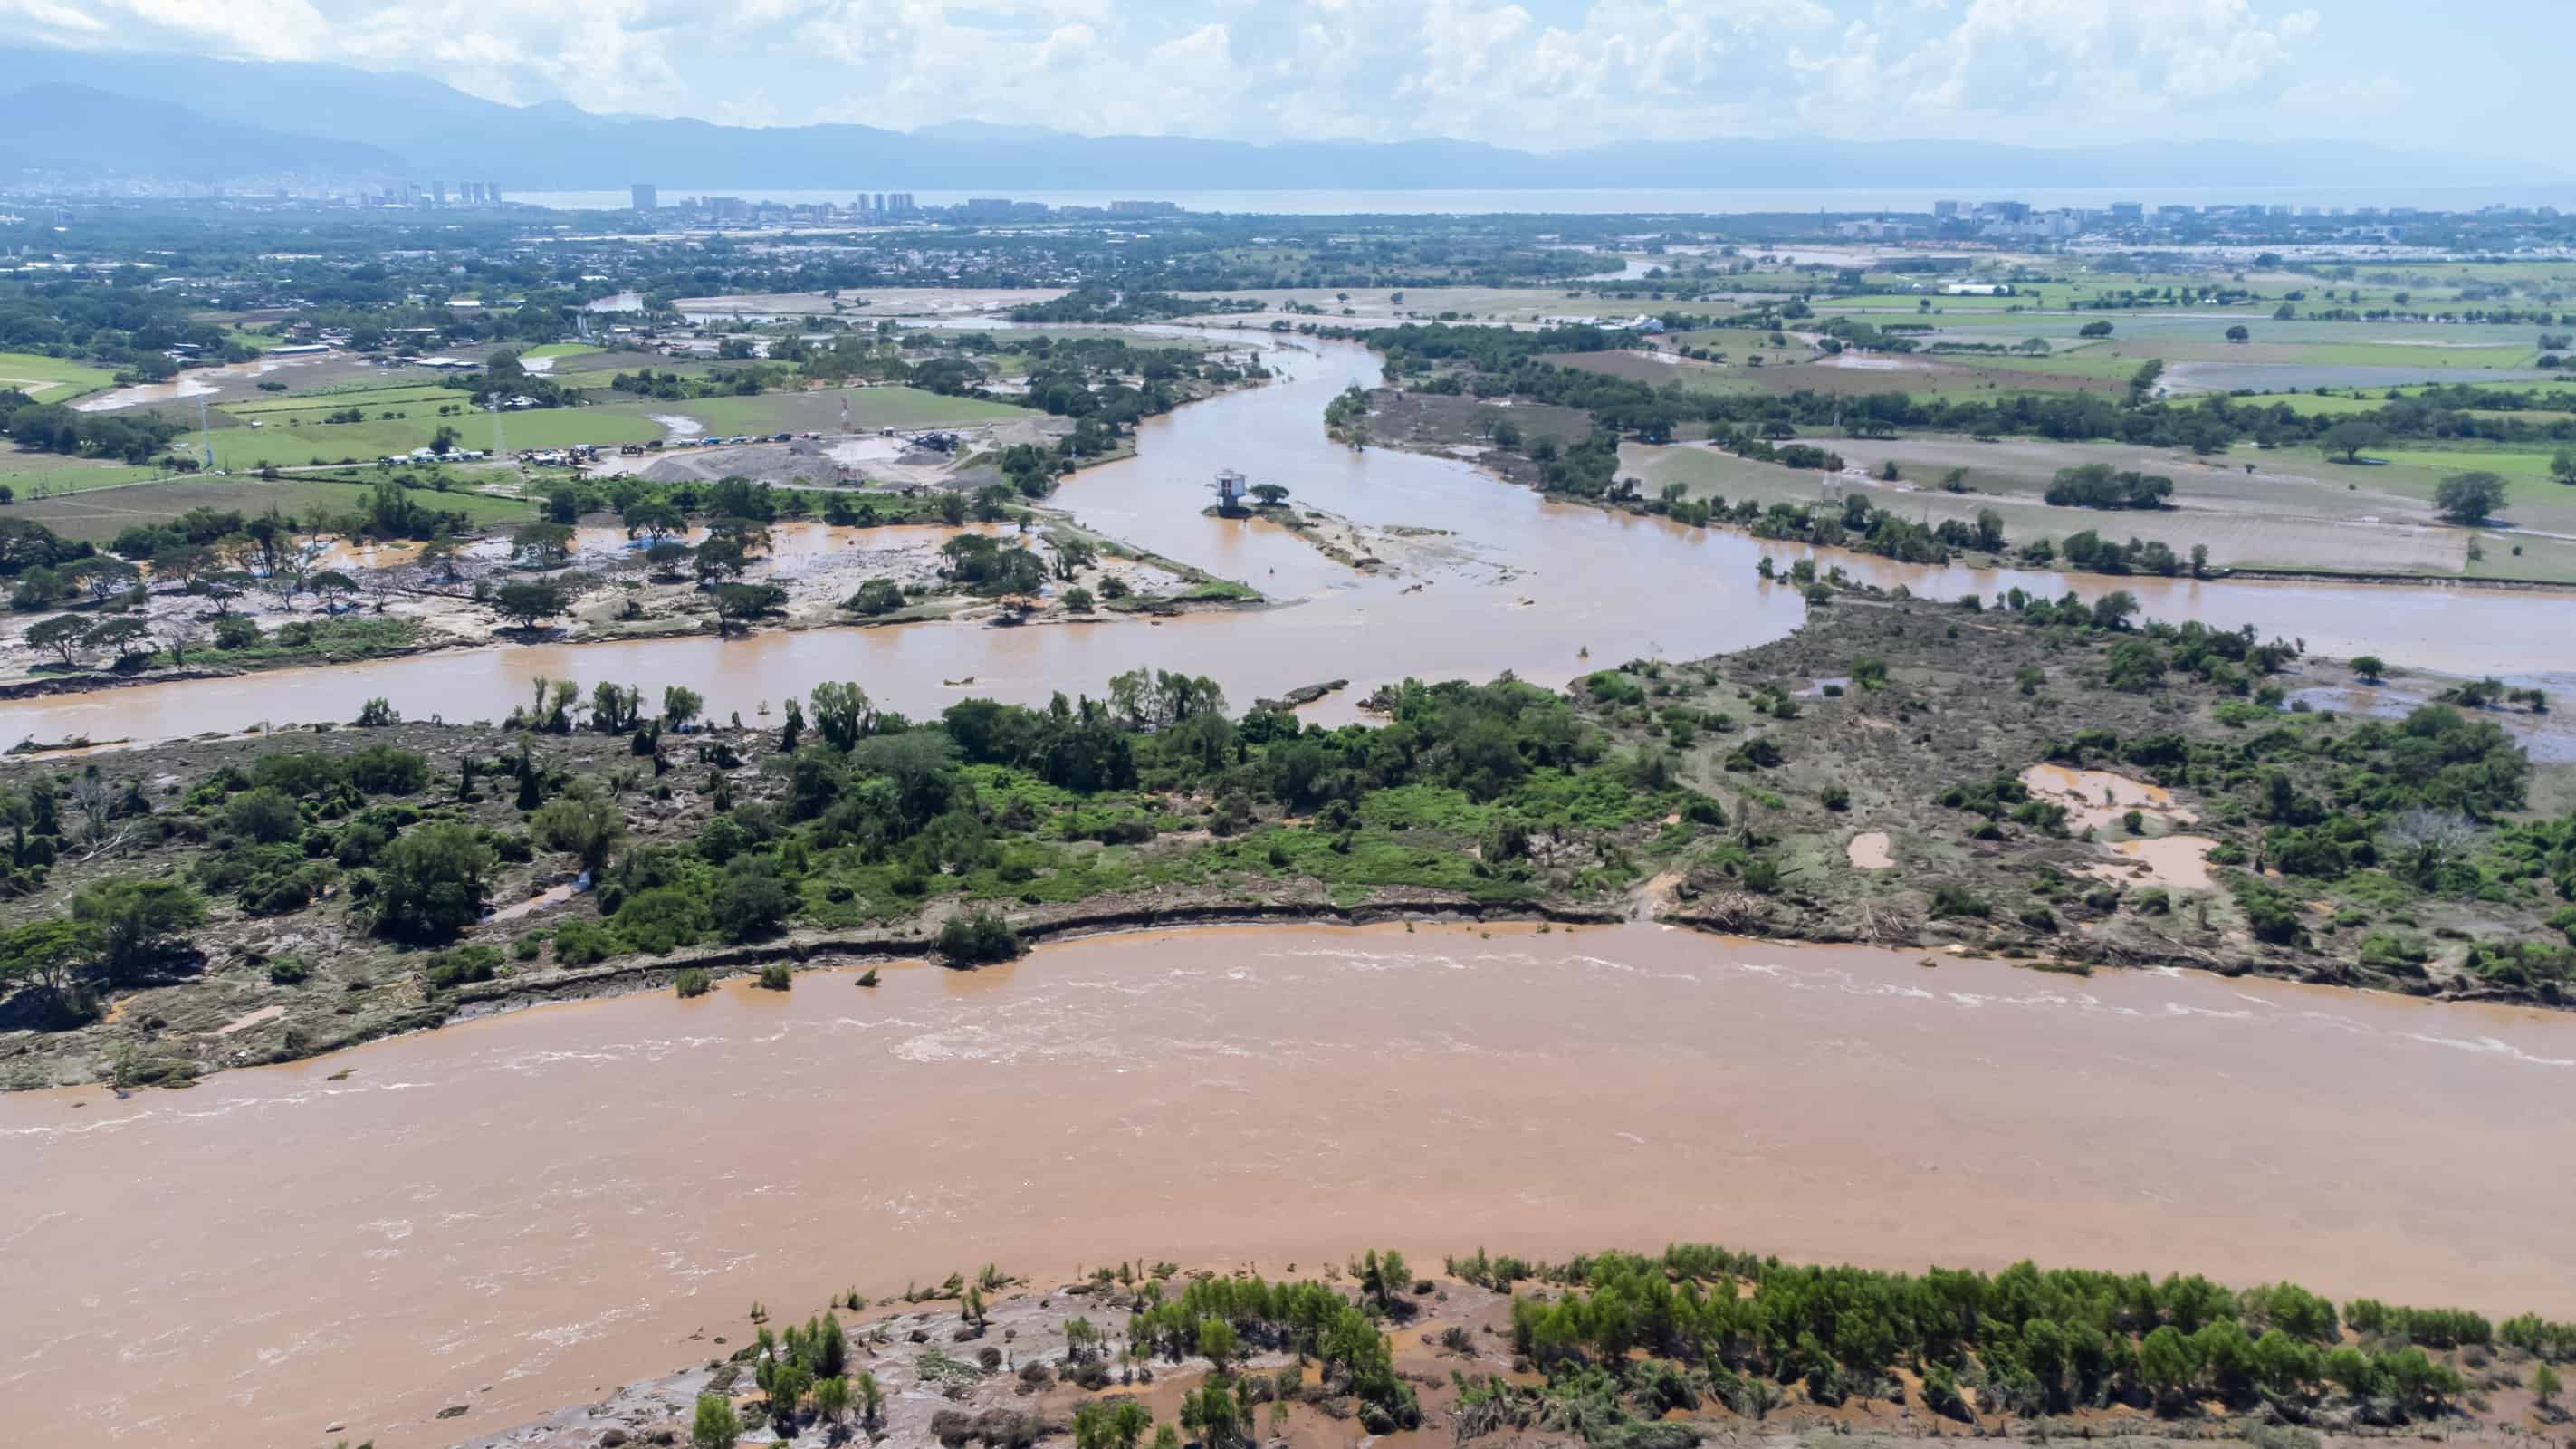
Source: Carlos Flores / iStock via Getty Images
- Minimum pressure at landfall: 942 millibars
- Max. wind speed at landfall: 120 knots (~138 mph)
- Minimum pressure overall: 942 millibars
- Max wind speed measured: 120 knots (~138 mph)
- Areas affected: Western Mexico, Islas Marías, Southwestern Mexico, Texas
54. Unnamed — The Great New England Hurricane of 1938 (Sep 9, 1938 – Sep 23, 1938)

- Minimum pressure at landfall: 941 millibars
- Max. wind speed at landfall: 105 knots (~121 mph)
- Minimum pressure overall: 940 millibars
- Max wind speed measured: 140 knots (~161 mph)
- Areas affected: Southeastern US, Long Island, New England, southwestern Quebec
53. Hurricane Odile (Sep 9, 2014 – Sep 18, 2014)
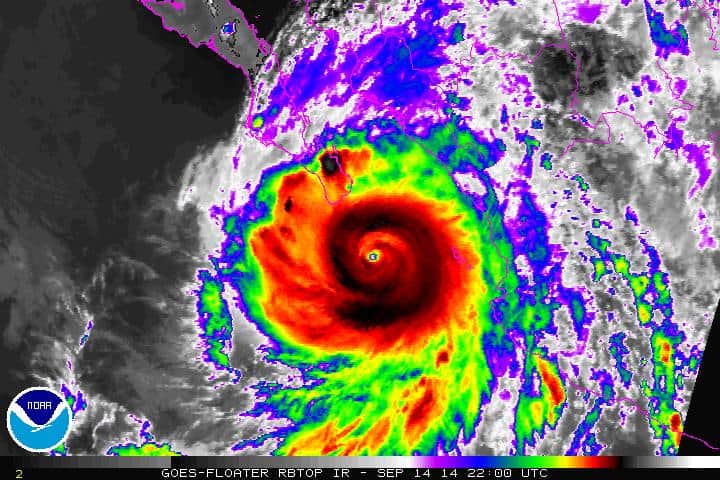
Source: Public Domain / Wikimedia Commons
- Minimum pressure at landfall: 941 millibars
- Max. wind speed at landfall: 110 knots (~127 mph)
- Minimum pressure overall: 918 millibars
- Max wind speed measured: 120 knots (~138 mph)
- Areas affected: Northwestern Mexico, the Baja California Peninsula, Southwestern US, Texas
52. Hurricane Dennis (Jul 4, 2005 – Jul 18, 2005)

- Minimum pressure at landfall: 941 millibars
- Max. wind speed at landfall: 120 knots (~138 mph)
- Minimum pressure overall: 930 millibars
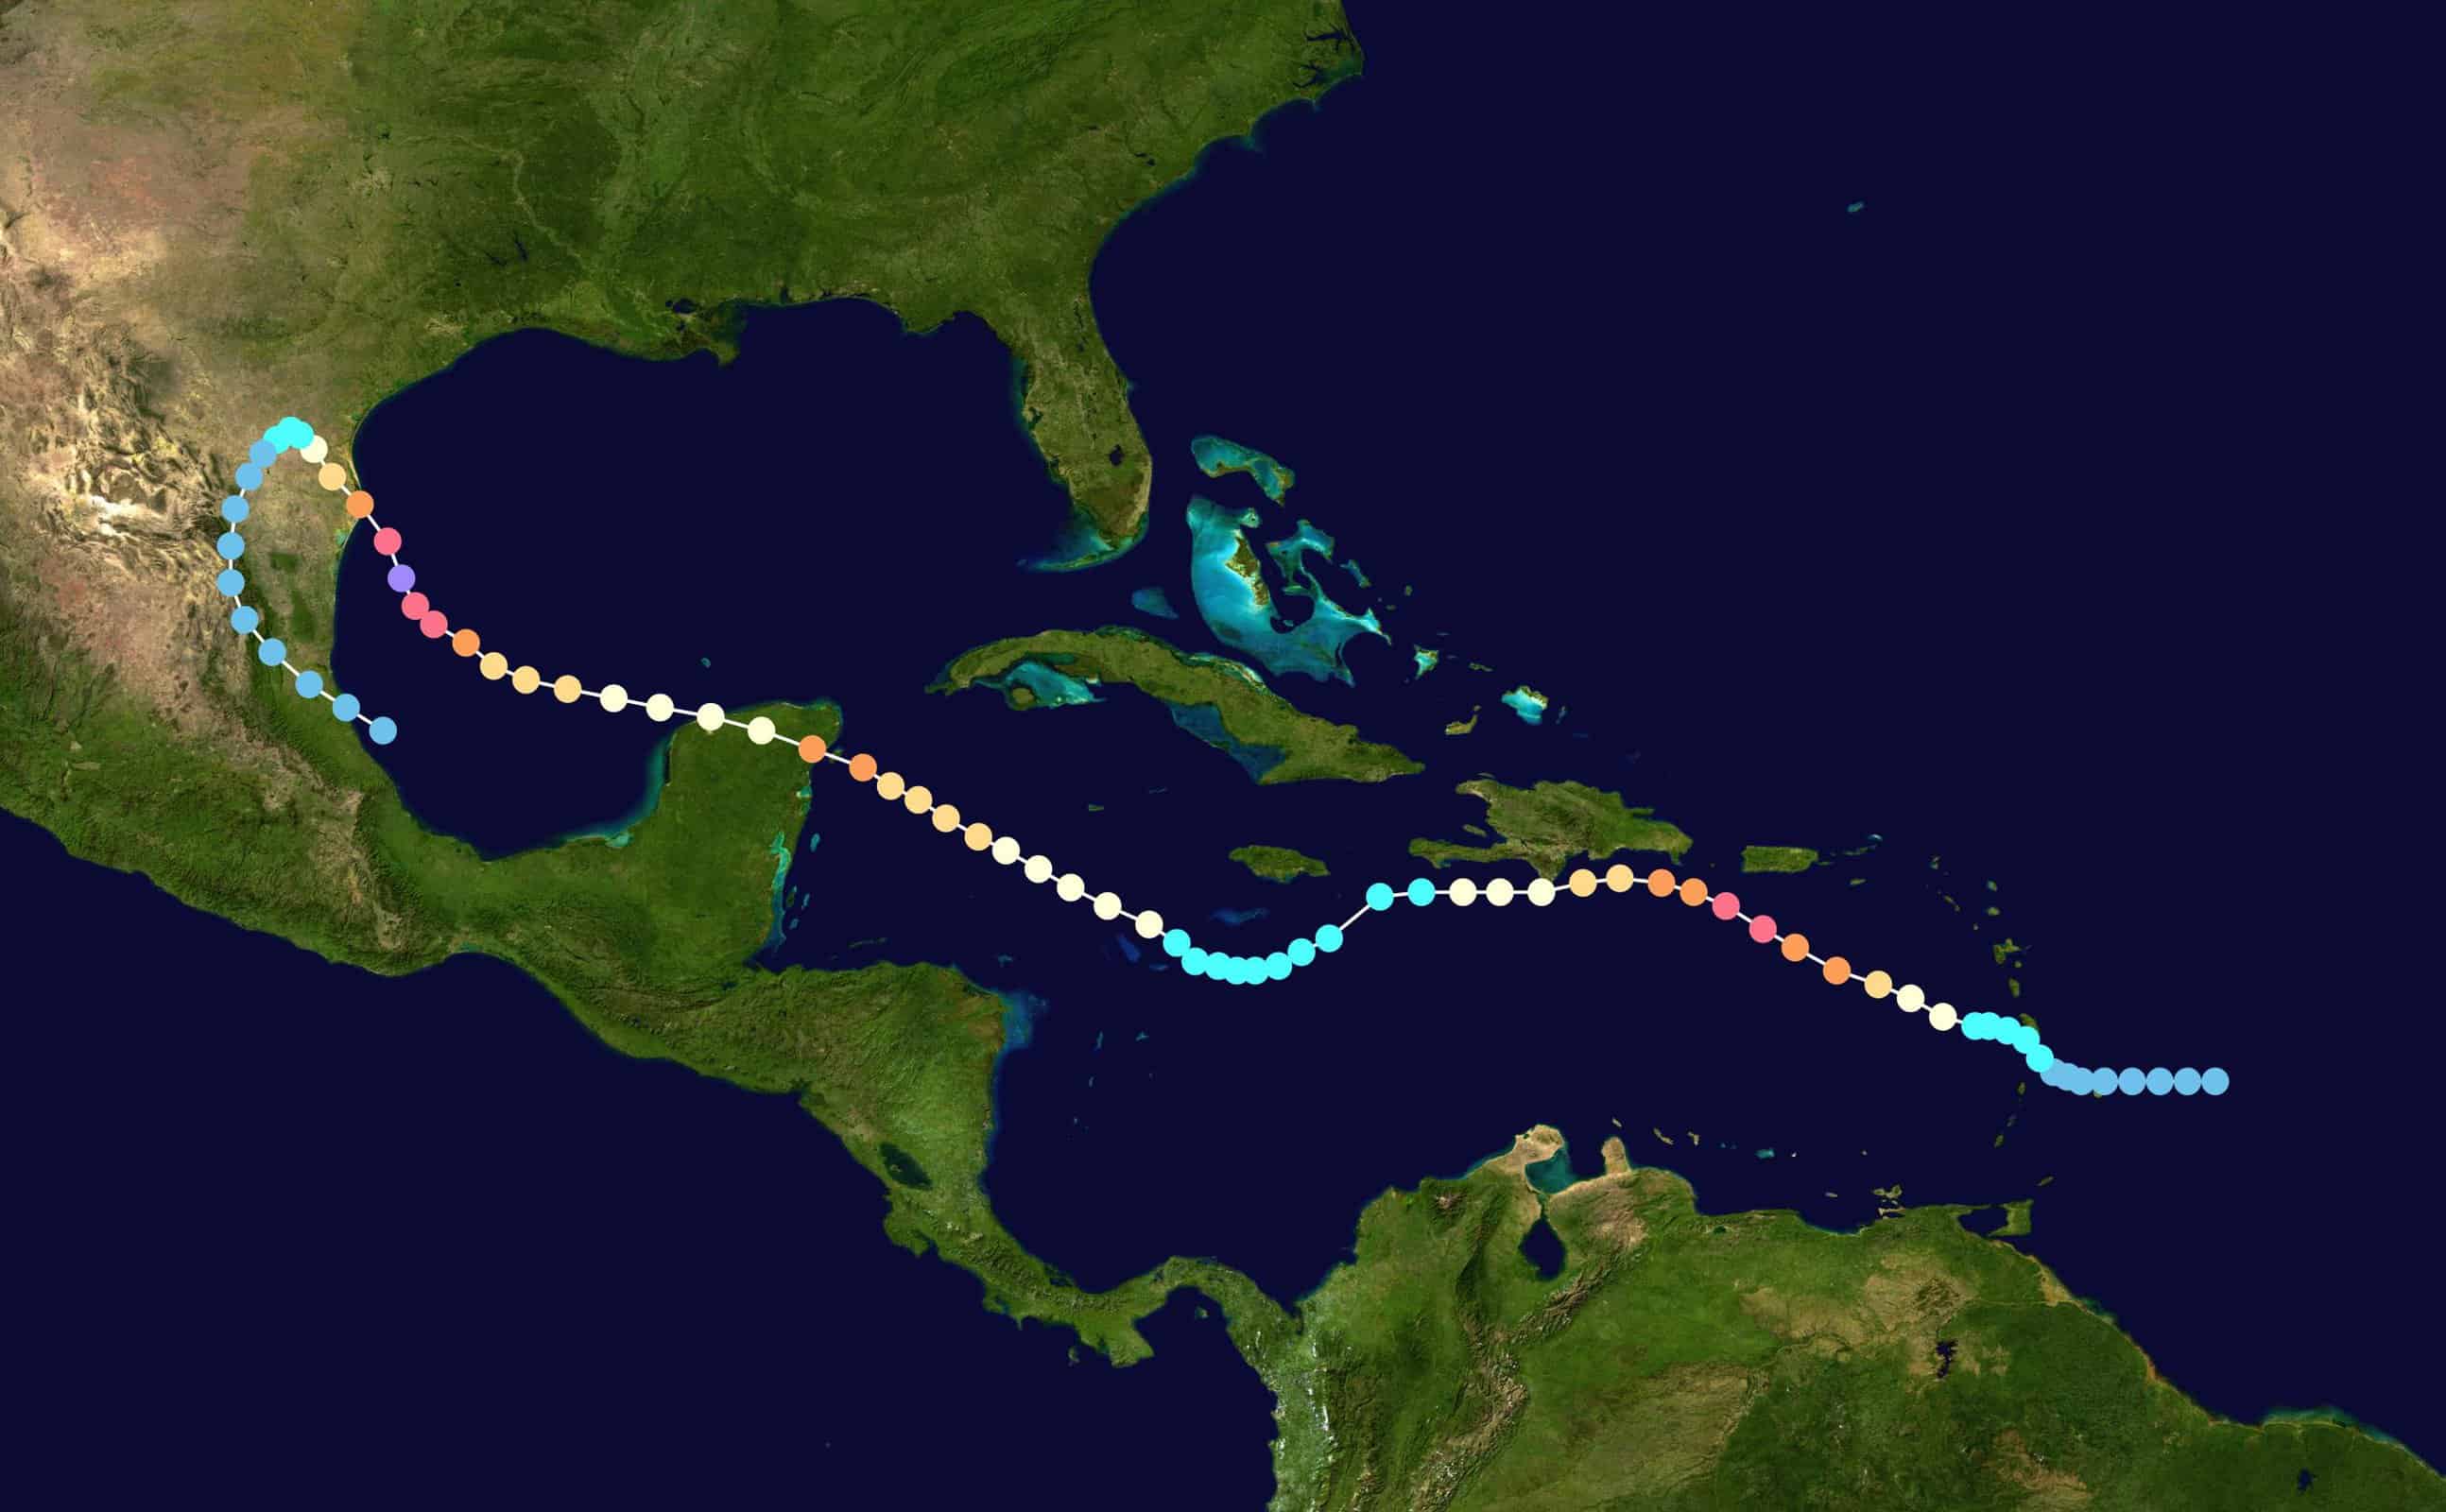
- Max wind speed measured: 130 knots (~150 mph)
- Areas affected: Windward Islands, Jamaica, Cuba, western Florida
51. Hurricane Charley (Aug 9, 2004 – Aug 15, 2004)

- Minimum pressure at landfall: 941 millibars
- Max. wind speed at landfall: 130 knots (~150 mph)
- Minimum pressure overall: 941 millibars
- Max wind speed measured: 130 knots (~150 mph)
- Areas affected: Jamaica, Grand Cayman Island, Cuba, Florida, Carolinas, Virginia
50. Hurricane Ian (Sep 22, 2022 – Oct 1, 2022)
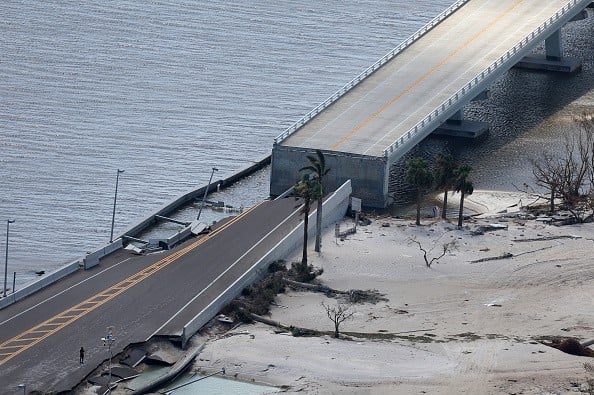
Source: 2022 Getty Images / Getty Images News via Getty Images
- Minimum pressure at landfall: 941 millibars
- Max. wind speed at landfall: 130 knots (~150 mph)
- Minimum pressure overall: 937 millibars
- Max wind speed measured: 140 knots (~161 mph)
- Areas affected: Trinidad and Tobago, Venezuela, Colombia, ABC islands, Jamaica, Cayman Islands, Cuba, Florida, the Carolinas
49. Hurricane Gustav (Aug 25, 2008 – Sep 5, 2008)

- Minimum pressure at landfall: 941 millibars
- Max. wind speed at landfall: 135 knots (~155 mph)
- Minimum pressure overall: 941 millibars
- Max wind speed measured: 135 knots (~155 mph)
- Areas affected: Haiti, Cuba, and Louisiana
48. Unnamed — Cuba-Brownsville Hurricane (Aug 22, 1933 – Sep 5, 1933)
Source: Hurricane Research Division / Wikimedia Commons
- Minimum pressure at landfall: 940 millibars
- Max. wind speed at landfall: 110 knots (~127 mph)
- Minimum pressure overall: 940 millibars
- Max wind speed measured: 140 knots (~161 mph)
- Areas affected: Bahamas, Cuba, southeastern Texas
47. Hurricane Beulah (Sep 5, 1967 – Sep 24, 1967)
Source: Public Domain / Wikimedia Commons
- Minimum pressure at landfall: 940 millibars
- Max. wind speed at landfall: 110 knots (~127 mph)
- Minimum pressure overall: 923 millibars
- Max wind speed measured: 140 knots (~161 mph)
- Areas affected: Greater Antilles, Yucatán Peninsula, Northeastern Mexico, South Texas
46. Unnamed — 1948 Miami Hurricane (Sep 18, 1948 – Sep 26, 1948)
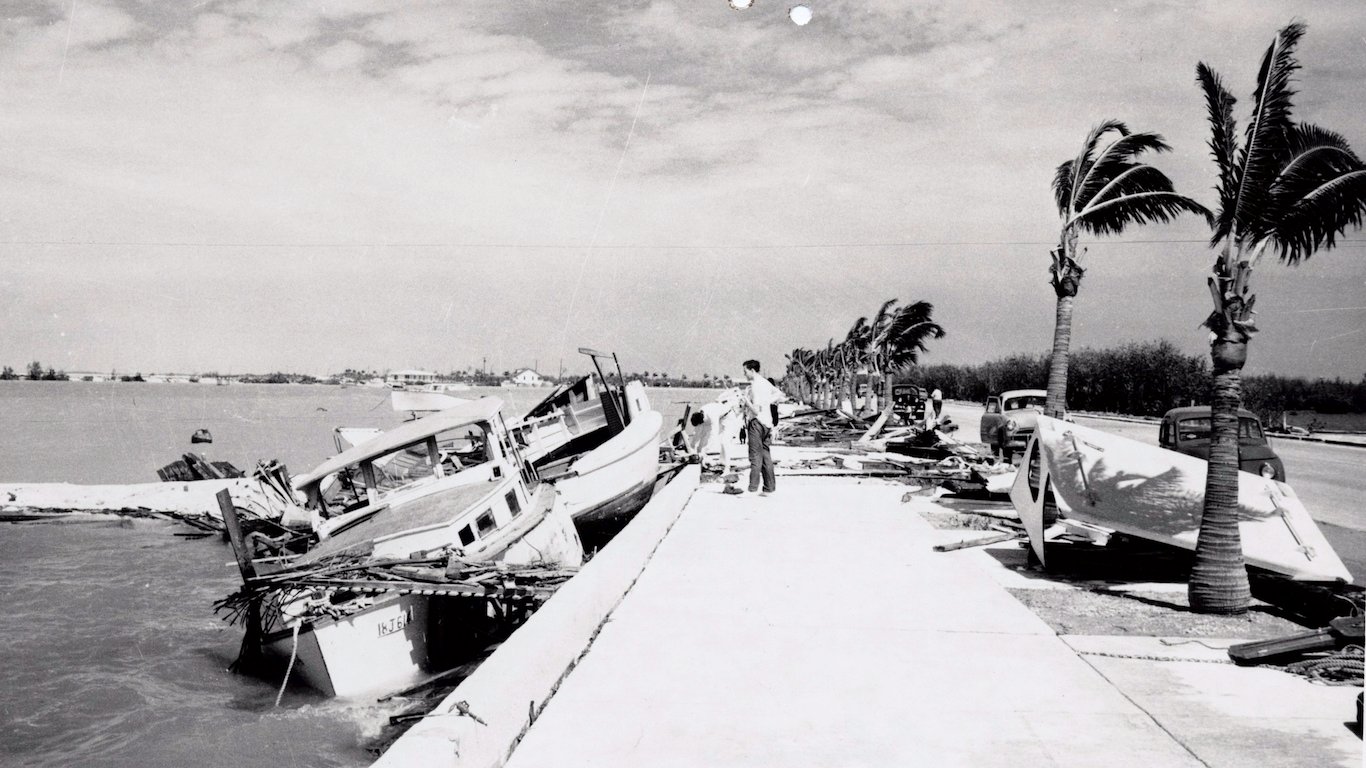
Source: Florida Keys--Public Libraries / Flickr
- Minimum pressure at landfall: 940 millibars
- Max. wind speed at landfall: 115 knots (~132 mph)
- Minimum pressure overall: 940 millibars
- Max wind speed measured: 115 knots (~132 mph)
- Areas affected: Cuba, Florida, Bahamas, Bermuda
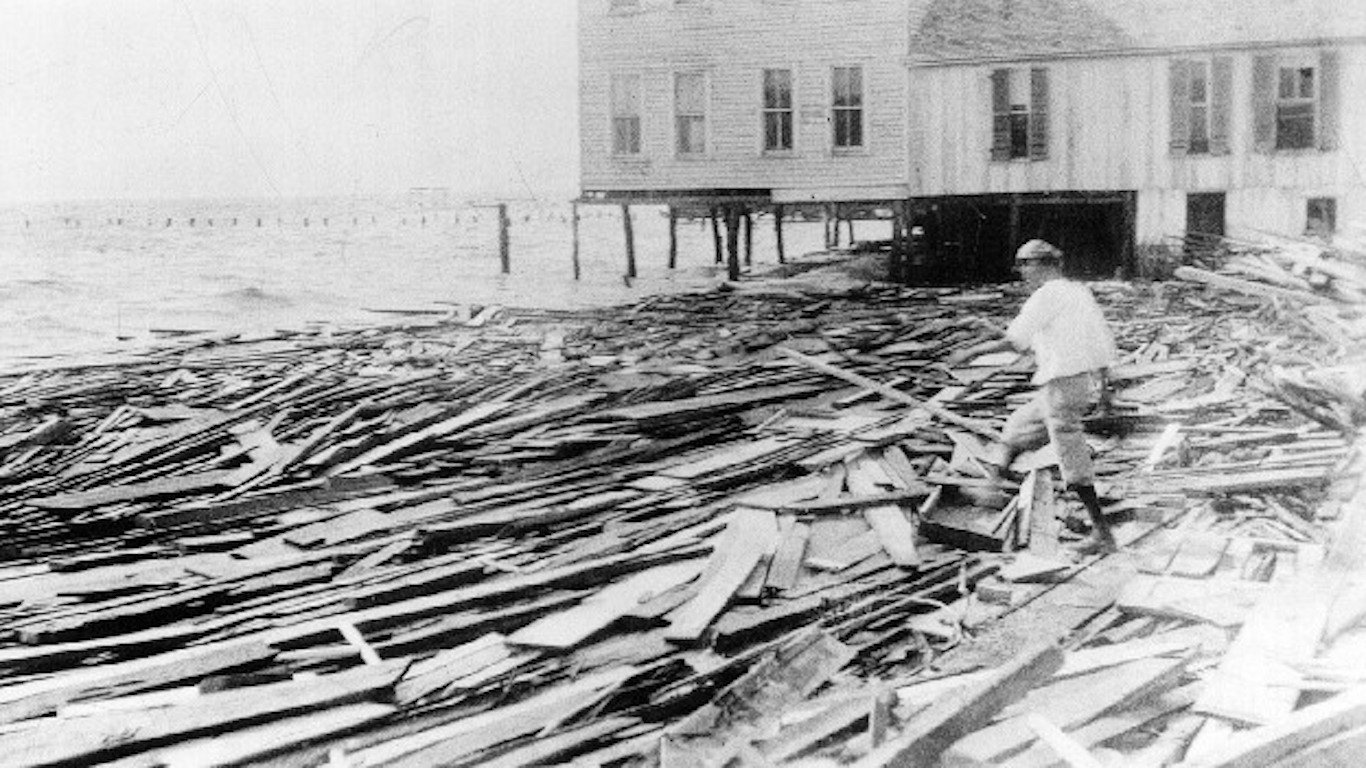
45. Unnamed — 1915 Galveston Hurricane (Aug 5, 1915 – Aug 23, 1915)

Source: Public Domain / Wikimedia Commons
- Minimum pressure at landfall: 940 millibars
- Max. wind speed at landfall: 115 knots (~132 mph)
- Minimum pressure overall: 940 millibars
- Max wind speed measured: 125 knots (~144 mph)
- Areas affected: Greater Antilles, southeastern Texas
44. Hurricane Joaquin (Sep 26, 2015 – Oct 15, 2015)

- Minimum pressure at landfall: 940 millibars
- Max. wind speed at landfall: 115 knots (~132 mph)
- Minimum pressure overall: 931 millibars
- Max wind speed measured: 135 knots (~155 mph)
- Areas affected: Cuba, Bermuda, Turks and Caicos Islands
43. Hurricane Eta (Oct 31, 2020 – Nov 14, 2020)

- Minimum pressure at landfall: 940 millibars
- Max. wind speed at landfall: 120 knots (~138 mph)
- Minimum pressure overall: 922 millibars
- Max wind speed measured: 130 knots (~150 mph)
- Areas affected: San Andrés, Jamaica Central America, Cayman Islands, Cuba, The Bahamas, Southeastern US
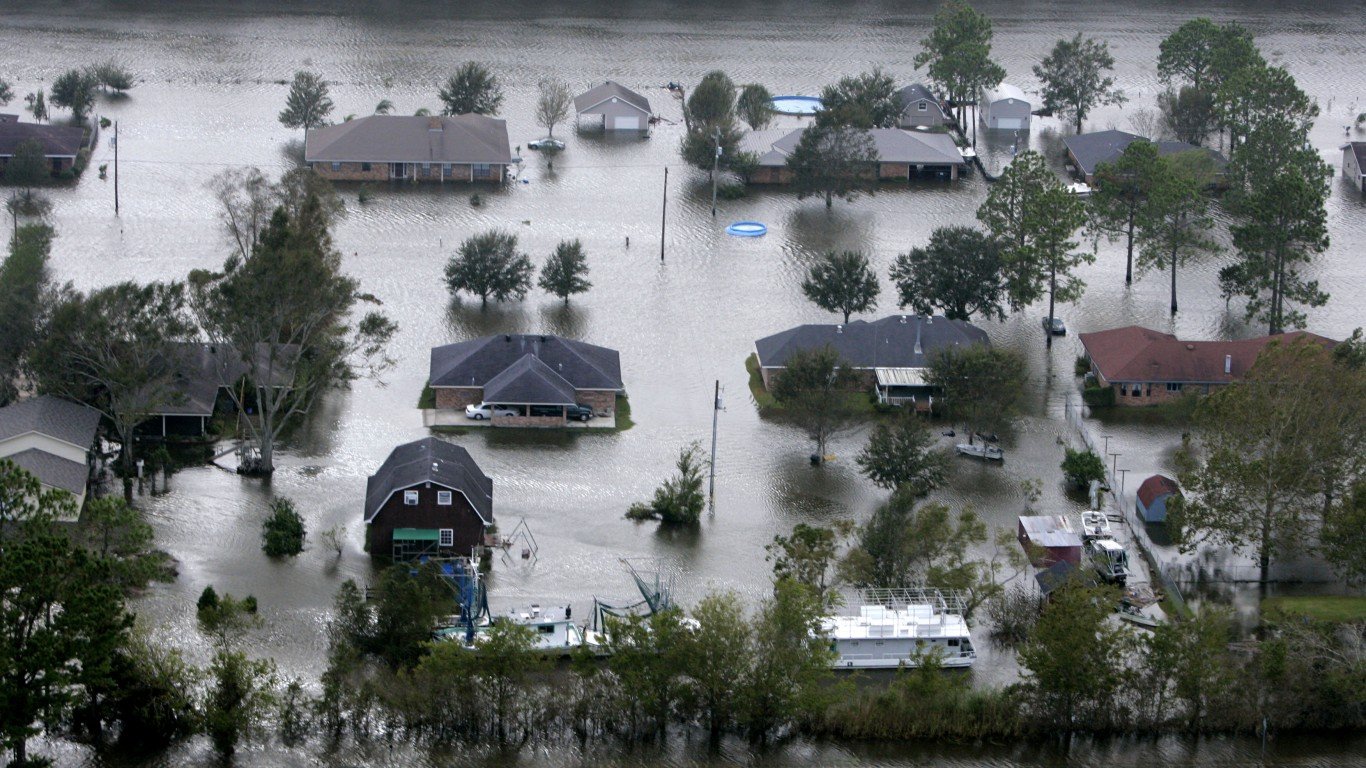
42. Hurricane Laura (Aug 20, 2020 – Aug 29, 2020)
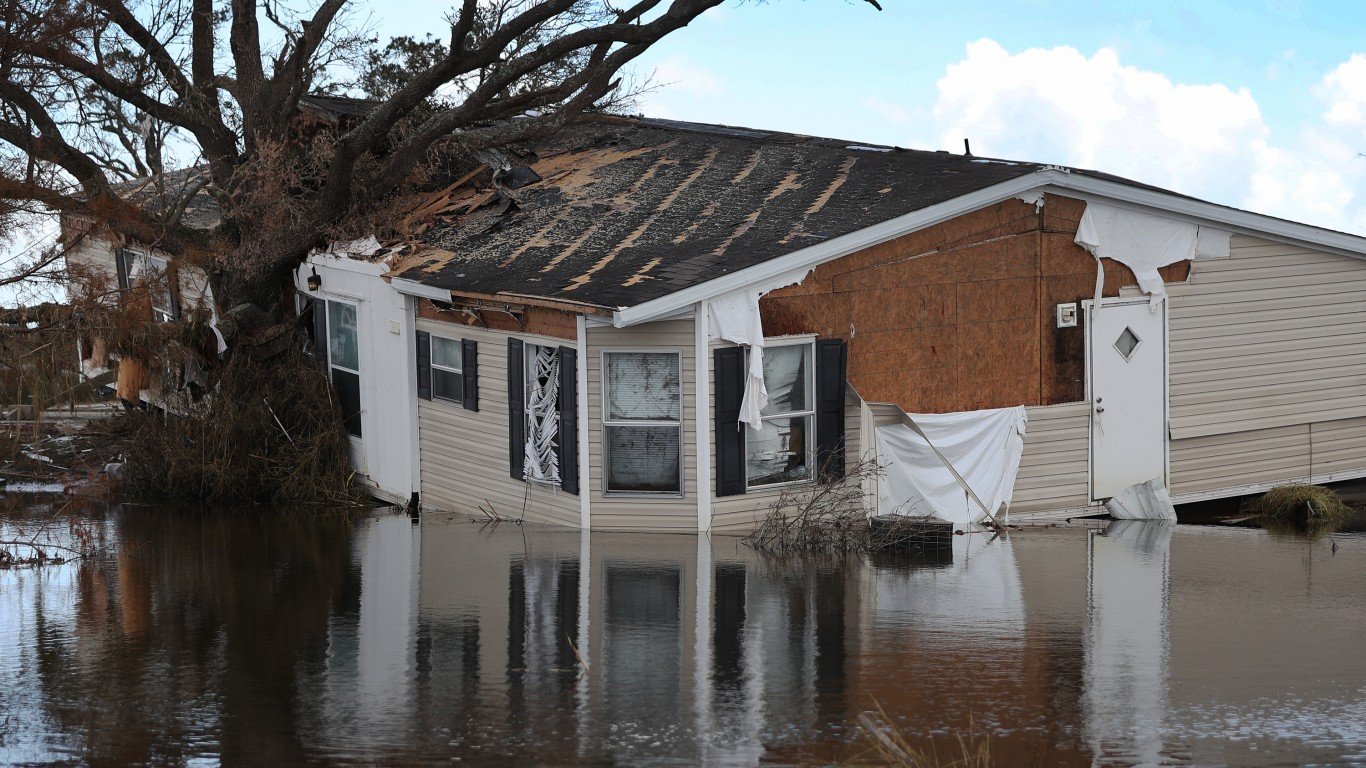
Source: Joe Raedle / Getty Images News via Getty Images
- Minimum pressure at landfall: 939 millibars
- Max. wind speed at landfall: 130 knots (~150 mph)
- Minimum pressure overall: 937 millibars
- Max wind speed measured: 130 knots (~150 mph)
- Areas affected: Lesser Antilles, Greater Antilles, The Bahamas, US Gulf Coast — mostly Louisiana (and some Texas), Midwest
41. Unnamed — Hurricane No.7 of the season (1898 Georgia hurricane) (Sep 25, 1898 – Oct 6, 1898)
Source: Public Domain / Wikimedia Commons
- Minimum pressure at landfall: 938 millibars
- Max. wind speed at landfall: 115 knots (~132 mph)
- Minimum pressure overall: 938 millibars
- Max wind speed measured: 115 knots (~132 mph)
- Areas affected: Georgia, Florida, Midwestern US, Atlantic Canada
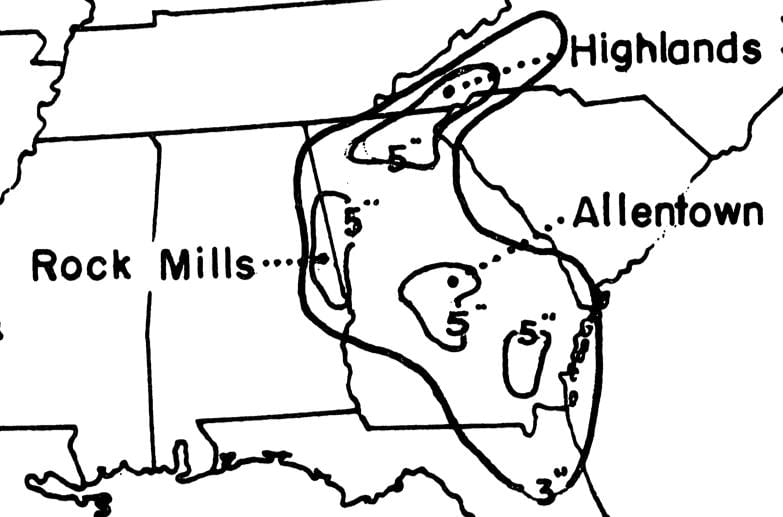
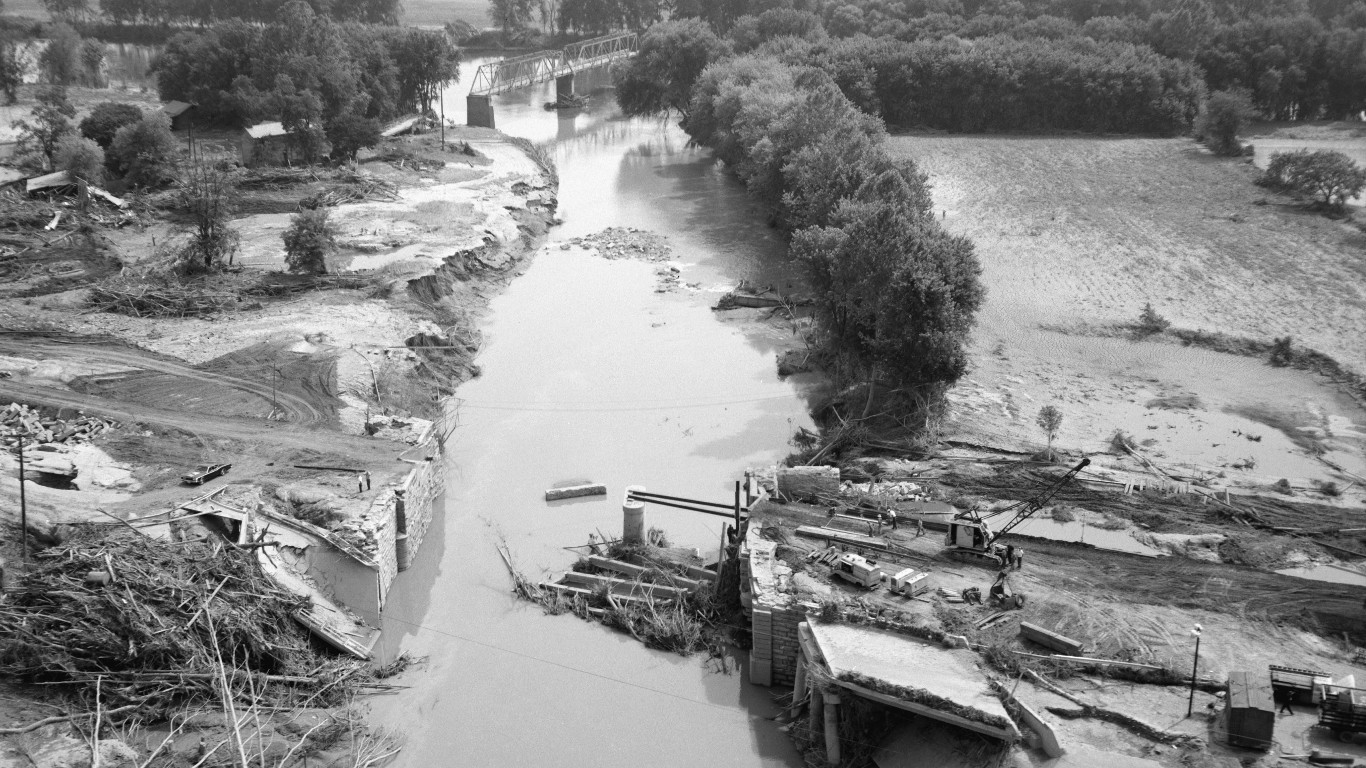
40. Hurricane Hazel (Oct 5, 1954 – Oct 18, 1954)
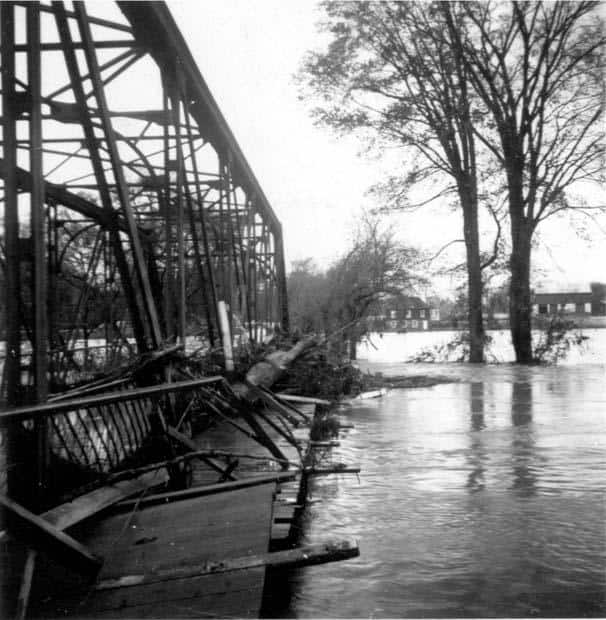
Source: Hurricane Hazel -- Albion bridge by Martin Taylor / BY-SA 3.0 (https://creativecommons.org/licenses/by-sa/3.0/)
- Minimum pressure at landfall: 938 millibars
- Max. wind speed at landfall: 115 knots (~132 mph)
- Minimum pressure overall: 938 millibars
- Max wind speed measured: 115 knots (~132 mph)
- Areas affected: Windward Islands, Haiti, Bahamas, U.S. East Coast, Canada
39. Hurricane Rita (Sep 18, 2005 – Sep 26, 2005)
Source: Sandy Huffaker / Getty Images News via Getty Images
- Minimum pressure at landfall: 937 millibars
- Max. wind speed at landfall: 100 knots (~115 mph)
- Minimum pressure overall: 895 millibars
- Max wind speed measured: 155 knots (~178 mph)
- Areas affected: Southeastern Texas, southwestern Louisiana, Florida Keys
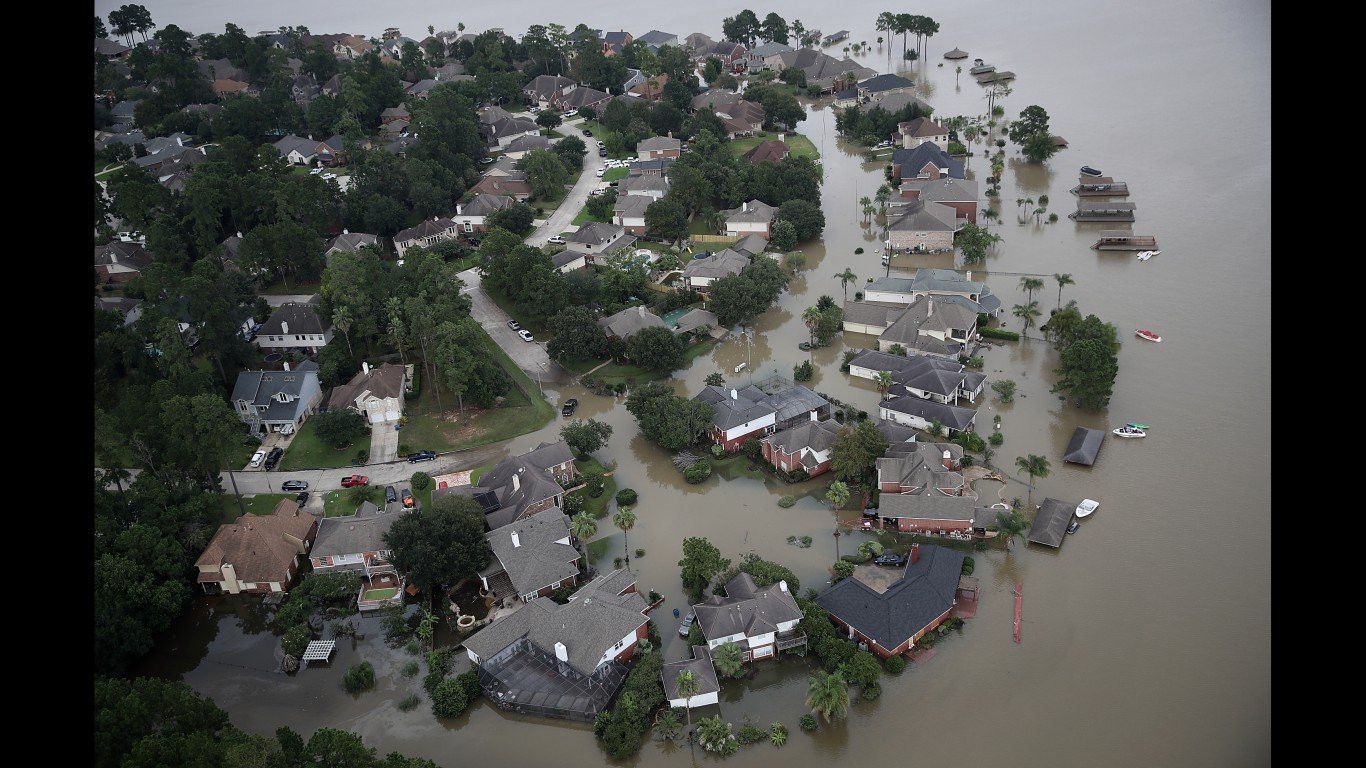
38. Hurricane Harvey (Aug 16, 2017 – Sep 2, 2017)
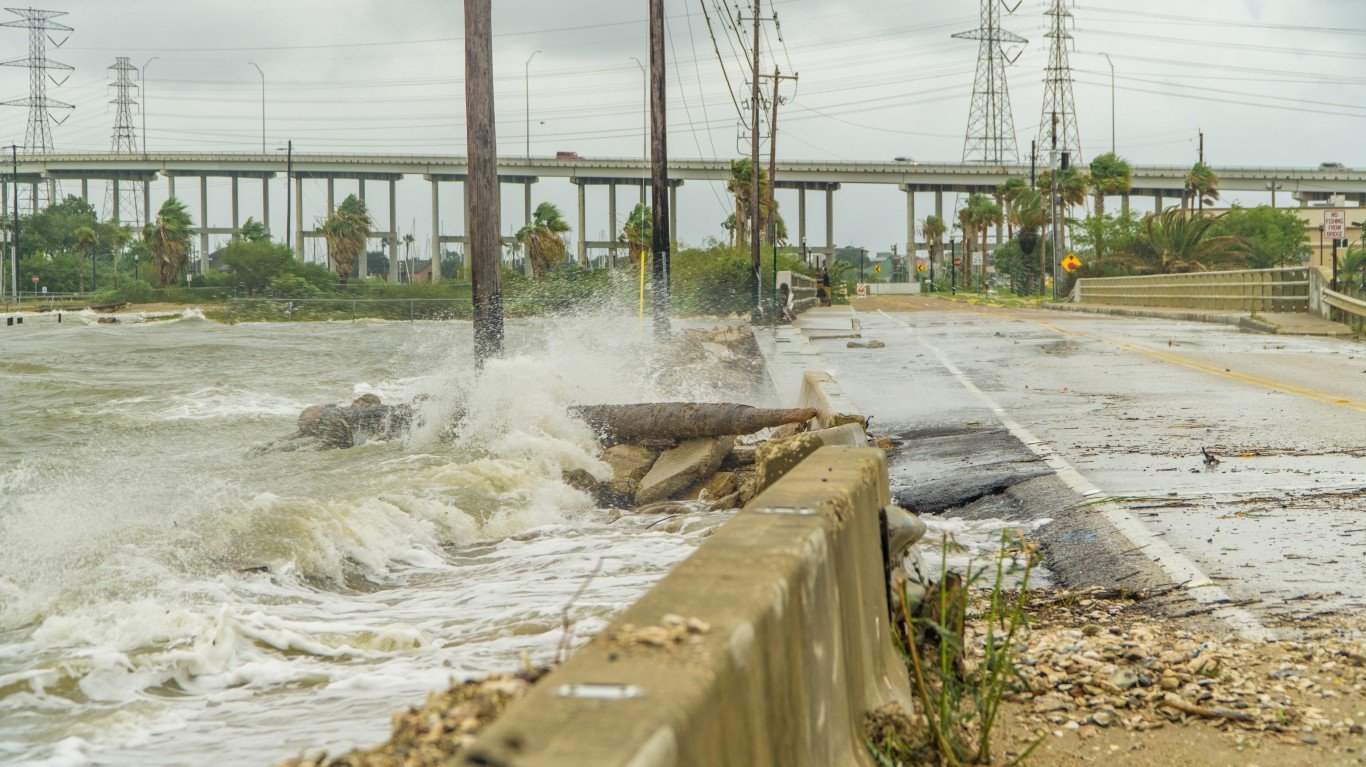
Source: Eric Overton / iStock via Getty Images
- Minimum pressure at landfall: 937 millibars
- Max. wind speed at landfall: 115 knots (~132 mph)
- Minimum pressure overall: 937 millibars
- Max wind speed measured: 115 knots (~132 mph)
- Areas affected: Southeastern Texas
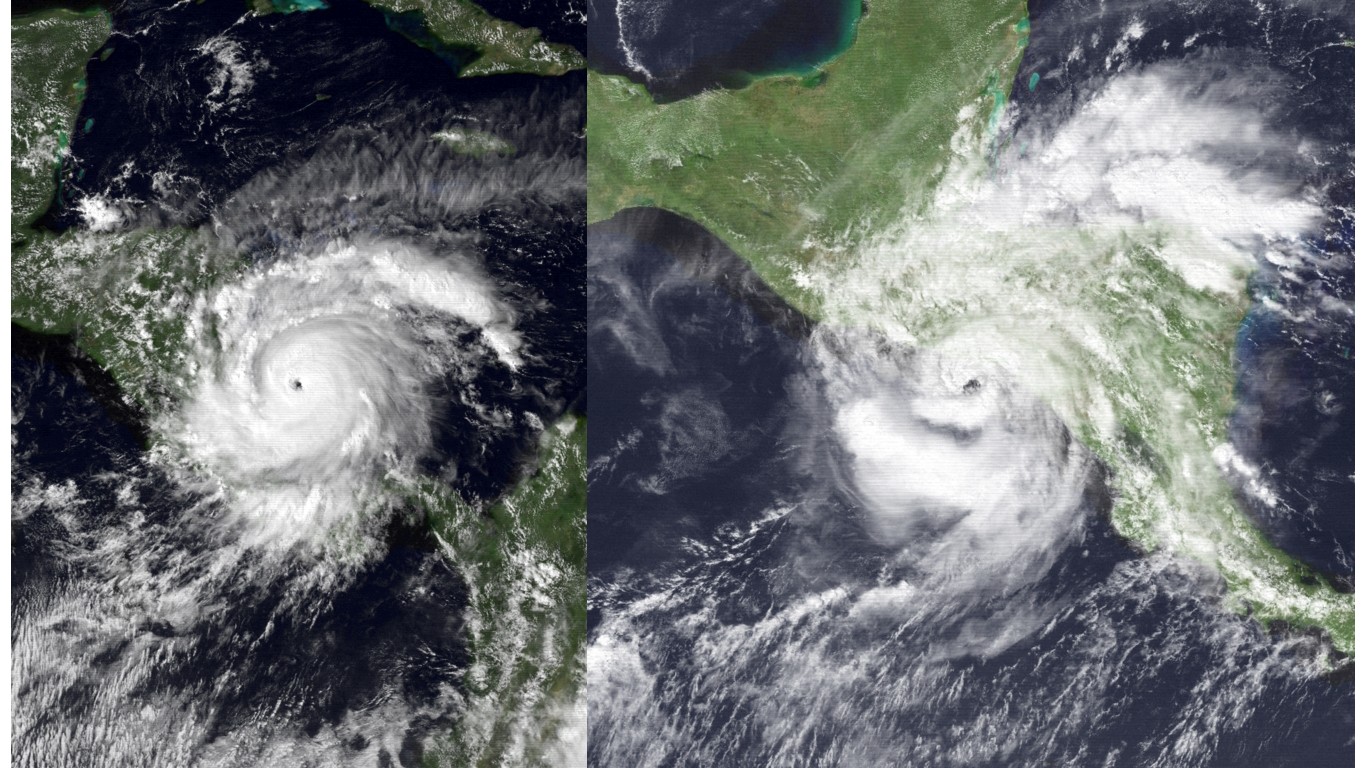
37. Hurricane Isidore (Sep 14, 2002 – Sep 27, 2002)

- Minimum pressure at landfall: 936 millibars
- Max. wind speed at landfall: 110 knots (~127 mph)
- Minimum pressure overall: 934 millibars
- Max wind speed measured: 110 knots (~127 mph)
- Areas affected: Cuba, southeastern Texas
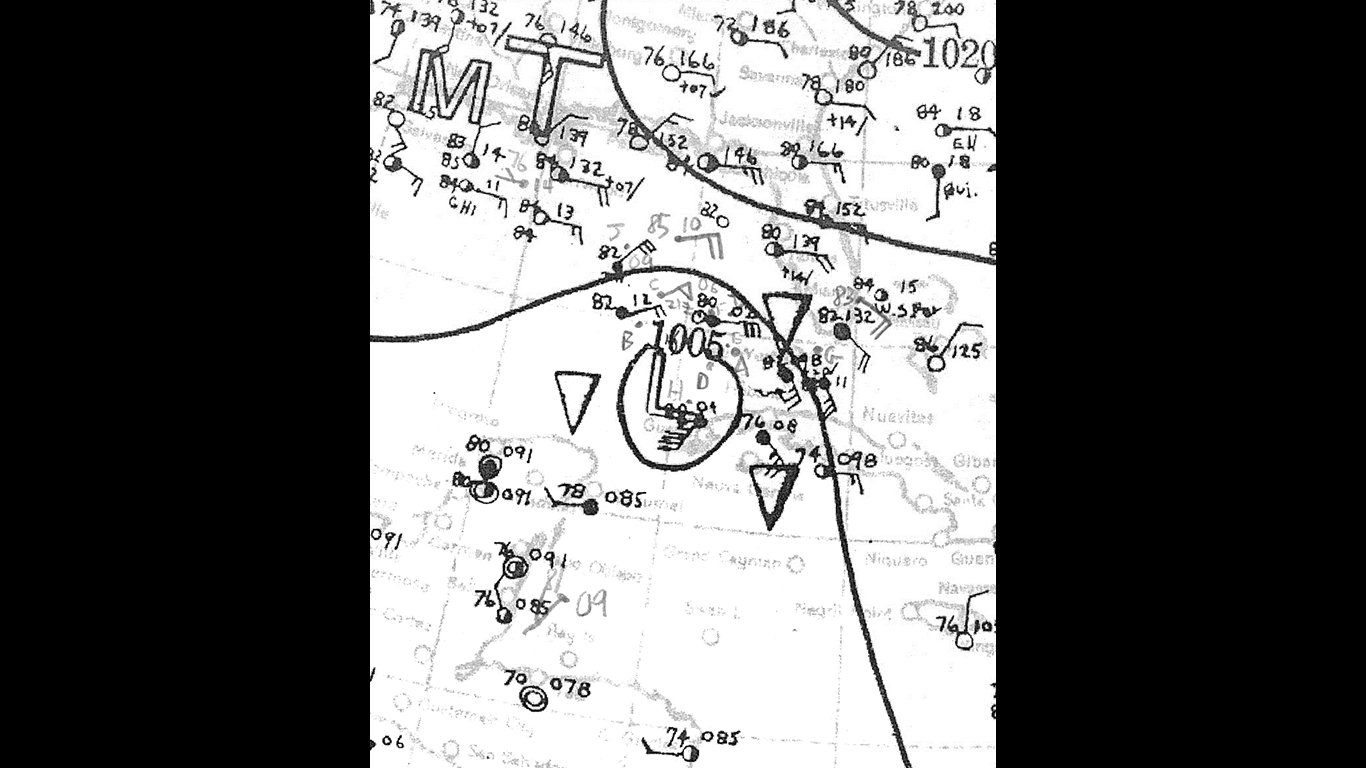
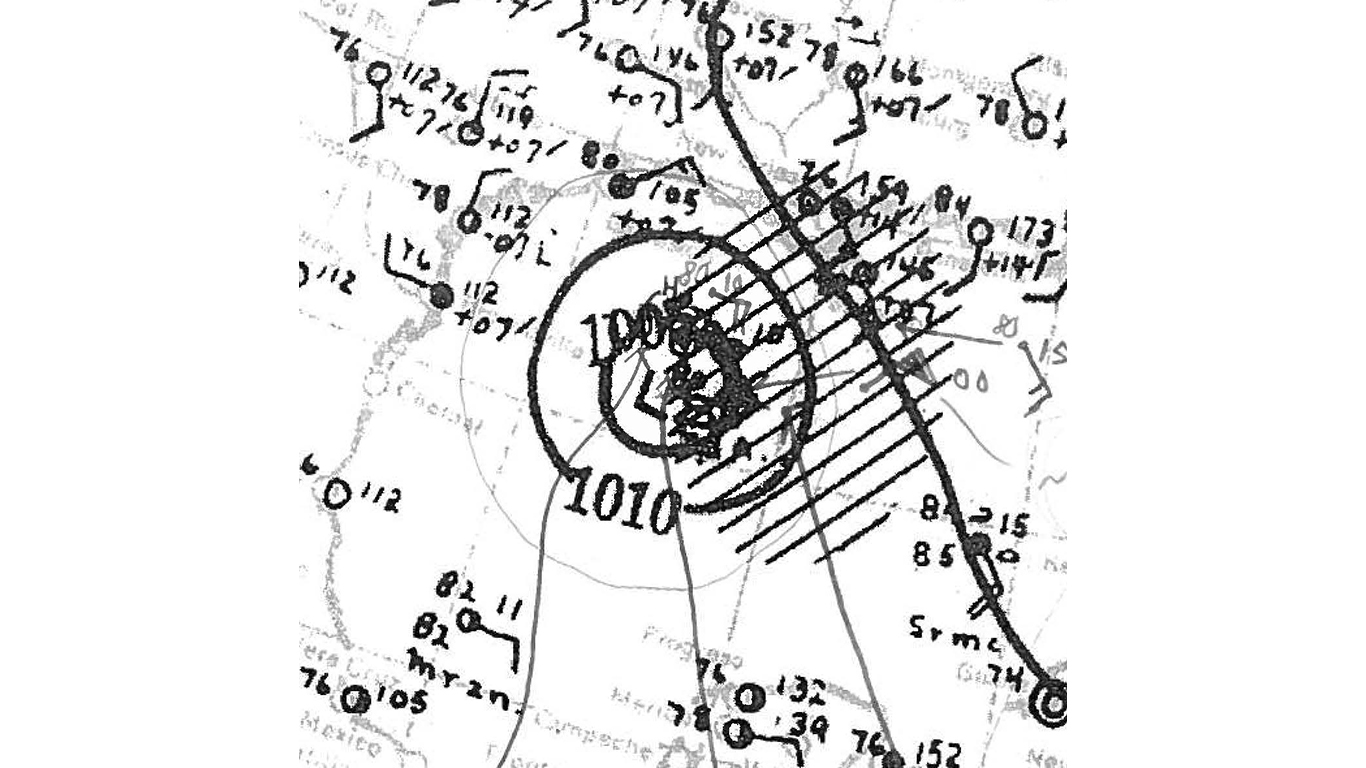
36. Unnamed — Galveston Hurricane of 1900 (Aug 27, 1900 – Sep 15, 1900)

Source: National Oceanic and Atmospheric Administration / Department of Commerce
- Minimum pressure at landfall: 936 millibars
- Max. wind speed at landfall: 120 knots (~138 mph)
- Minimum pressure overall: 936 millibars
- Max wind speed measured: 125 knots (~144 mph)
- Areas affected: Cuba, southeastern Texas
35. Unnamed — Freeport Hurricane (Aug 12, 1932 – Aug 15, 1932)
Source: NOAA / Wikimedia Commons
- Minimum pressure at landfall: 935 millibars
- Max. wind speed at landfall: 130 knots (~150 mph)
- Minimum pressure overall: 935 millibars
- Max wind speed measured: 130 knots (~150 mph)
- Areas affected: Southeastern Texas
34. Hurricane Matthew (Sep 28, 2016 – Oct 10, 2016)

- Minimum pressure at landfall: 935 millibars
- Max. wind speed at landfall: 130 knots (~150 mph)
- Minimum pressure overall: 934 millibars
- Max wind speed measured: 145 knots (~167 mph)
- Areas affected: Haiti, Cuba, Bahamas, South Carolina
33. Hurricane Hugo (Sep 10, 1989 – Sep 25, 1989)
Source: scguard / Flickr
- Minimum pressure at landfall: 934 millibars
- Max. wind speed at landfall: 120 knots (~138 mph)
- Minimum pressure overall: 918 millibars
- Max wind speed measured: 140 knots (~161 mph)
- Areas affected: Leeward Islands, U.S. Virgin Islands, Puerto Rico, Carolinas
32. Hurricane Fox (Oct 20, 1952 – Oct 28, 1952)
Source: NOAA Central Library / Wikimedia Commons
- Minimum pressure at landfall: 934 millibars
- Max. wind speed at landfall: 125 knots (~144 mph)
- Minimum pressure overall: 934 millibars
- Max wind speed measured: 125 knots (~144 mph)
- Areas affected: Cuba, Florida, Bahamas
31. Unnamed — Last Island hurricane (Aug 9, 1856 – Aug 12, 1856)
Source: Public Domain / Wikimedia Commons
- Minimum pressure at landfall: 934 millibars
- Max. wind speed at landfall: 130 knots (~150 mph)
- Minimum pressure overall: 934 millibars
- Max wind speed measured: 130 knots (~150 mph)
- Areas affected: Coastal Louisiana
30. Hurricane Felix (Aug 31, 2007 – Sep 6, 2007)
Source: Mass Communication Specialist 2nd Class Zachary Borden / U.S. Navy via Getty Images
- Minimum pressure at landfall: 934 millibars
- Max. wind speed at landfall: 140 knots (~161 mph)
- Minimum pressure overall: 929 millibars
- Max wind speed measured: 150 knots (~173 mph)
- Areas affected: Nicaragua
29. Hurricane Lenny (Nov 13, 1999 – Nov 23, 1999)
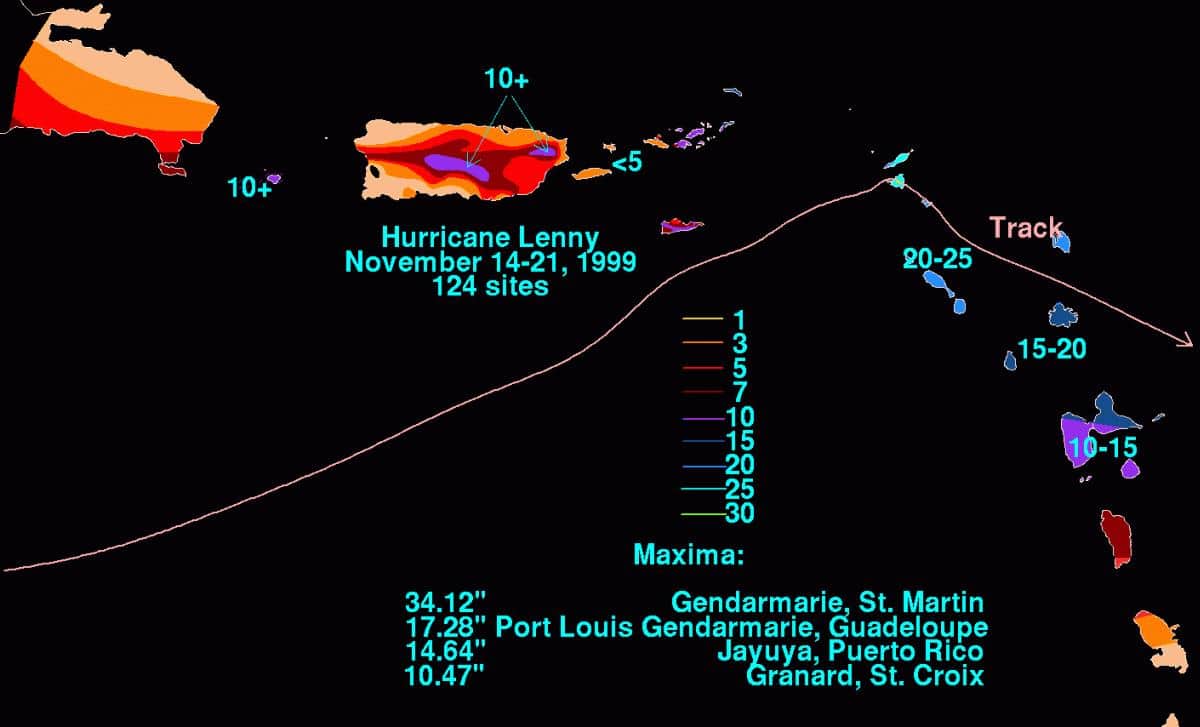
Source: Public Domain / Wikimedia Commons
- Minimum pressure at landfall: 933 millibars
- Max. wind speed at landfall: 135 knots (~155 mph)
- Minimum pressure overall: 933 millibars
- Max wind speed measured: 135 knots (~155 mph)
- Areas affected: Eastern Caribbean islands, Leeward and Windward islands
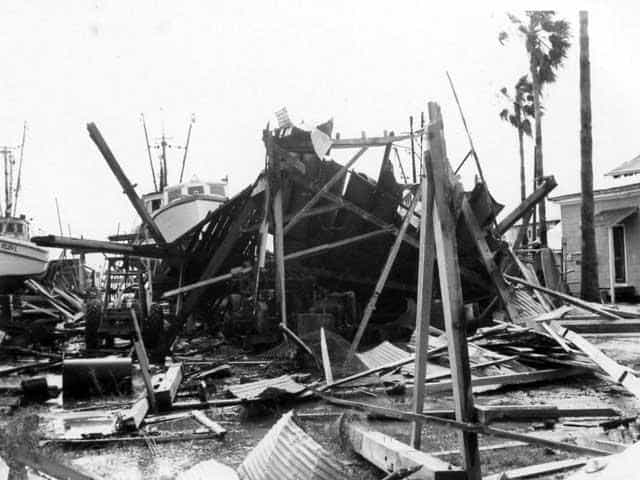
28. Unnamed — 1916 Texas Hurricane (Aug 12, 1916 – Aug 20, 1916)
Source: Public Domain / Wikimedia Commons
- Minimum pressure at landfall: 932 millibars
- Max. wind speed at landfall: 115 knots (~132 mph)
- Minimum pressure overall: 932 millibars
- Max wind speed measured: 115 knots (~132 mph)
- Areas affected: Caribbean islands, southeastern Texas
27. Hurricane Joan (Oct 10, 1988 – Oct 23, 1988)
Source: Public Domain / Wikimedia Commons
- Minimum pressure at landfall: 932 millibars
- Max. wind speed at landfall: 125 knots (~144 mph)
- Minimum pressure overall: 932 millibars
- Max wind speed measured: 125 knots (~144 mph)
- Areas affected: North coast of South America, Central America, Curacao, Guajira Peninsula of Colombia
26. Hurricane Patricia (Oct 20, 2015 – Oct 24, 2015)
 map by Phoenix7777")
- Minimum pressure at landfall: 932 millibars
- Max. wind speed at landfall: 130 knots (~150 mph)
- Minimum pressure overall: 872 millibars
- Max wind speed measured: 185 knots (~213 mph)
- Areas affected: Mexico
25. Hurricane Fiona (Sep 14, 2022 – Sep 27, 2022)

- Minimum pressure at landfall: 931 millibars
- Max. wind speed at landfall: 100 knots (~115 mph)
- Minimum pressure overall: 931 millibars
- Max wind speed measured: 120 knots (~138 mph)
- Areas affected: Leeward Islands, Guadalupe, Puerto Rico, Dominican Republic, Bermuda, Atlantic Canada, Greenland
24. Hurricane Carla (Sep 3, 1961 – Sep 18, 1961)
Source: Public Domain / Wikimedia Commons
- Minimum pressure at landfall: 931 millibars
- Max. wind speed at landfall: 125 knots (~144 mph)
- Minimum pressure overall: 927 millibars
- Max wind speed measured: 125 knots (~144 mph)
- Areas affected: Yucatán Peninsula, Texas, Central US
23. Unnamed — Hurricane No.2 of the season (Aug 4, 1880 – Aug 14, 1880)
Source: Public Domain / Wikimedia Commons
- Minimum pressure at landfall: 931 millibars
- Max. wind speed at landfall: 130 knots (~150 mph)
- Minimum pressure overall: 931 millibars
- Max wind speed measured: 130 knots (~150 mph)
- Areas affected: Yucatán Peninsula, northern Tamaulipas, Mexico; Port Isabel, Texas; south Texas,
22. Hurricane Ida (Aug 26, 2021 – Sep 4, 2021)

Source: Olga Kaya / iStock Unreleased via Getty Images
- Minimum pressure at landfall: 931 millibars
- Max. wind speed at landfall: 130 knots (~150 mph)
- Minimum pressure overall: 929 millibars
- Max wind speed measured: 130 knots (~150 mph)
- Areas affected: Venezuela, Colombia, Jamaica, Cayman Islands, Cuba, US Gulf Coast (mainly Louisiana)
21. Hurricane Floyd (Sep 7, 1999 – Sep 19, 1999)
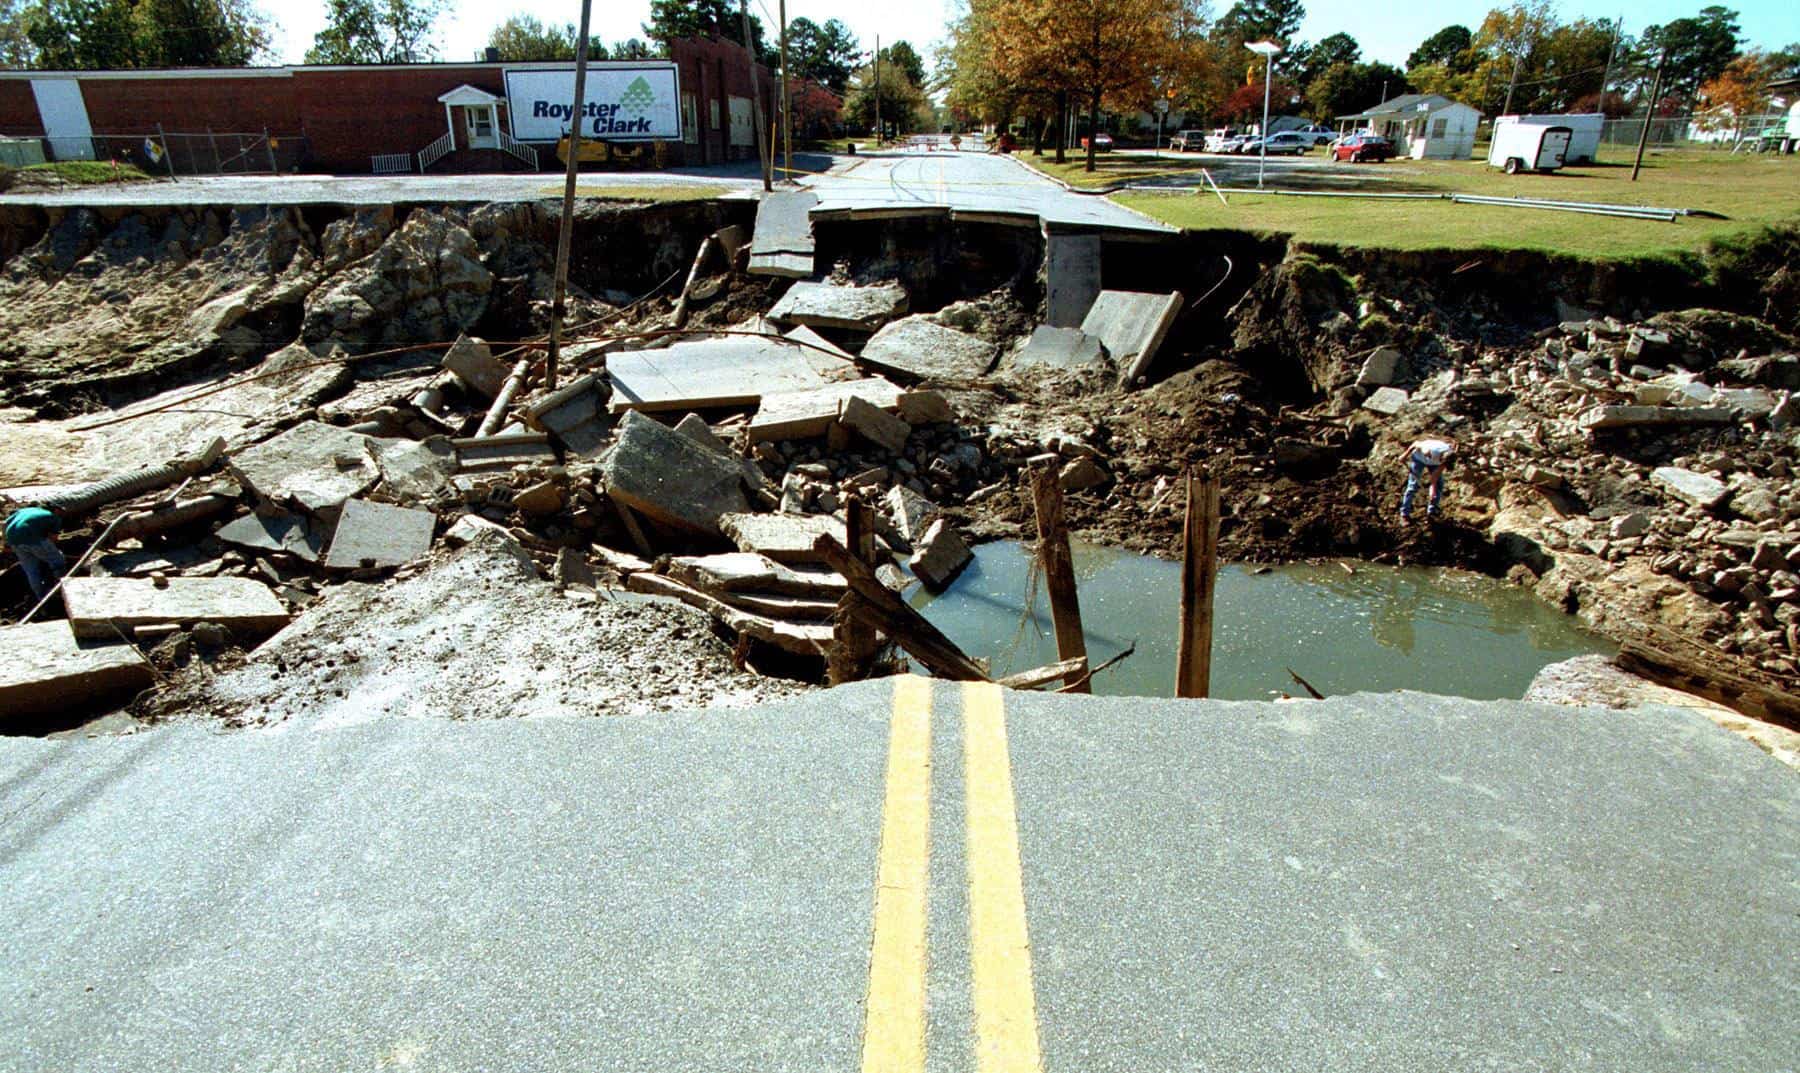
Source: Public Domain / Wikimedia Commons
- Minimum pressure at landfall: 930 millibars
- Max. wind speed at landfall: 110 knots (~127 mph)
- Minimum pressure overall: 921 millibars
- Max wind speed measured: 135 knots (~155 mph)
- Areas affected: Bahamas, North Carolina, mid-Atlantic states, New England
20. Hurricane Donna (Aug 29, 1960 – Sep 14, 1960)

Source: Keystone / Hulton Archive via Getty Images
- Minimum pressure at landfall: 930 millibars
- Max. wind speed at landfall: 125 knots (~144 mph)
- Minimum pressure overall: 930 millibars
- Max wind speed measured: 125 knots (~144 mph)
- Areas affected: West Africa, Cape Verde, Lesser Antilles, Guadeloupe, Virgin Islands, Puerto Rico, The Bahamas, Florida, Georgia, East Coast of the United States, Northeastern United States, Eastern Canada
19. Unnamed — The Great Miami Hurricane (Sep 11, 1926 – Sep 22, 1926)

- Minimum pressure at landfall: 930 millibars
- Max. wind speed at landfall: 125 knots (~144 mph)
- Minimum pressure overall: 930 millibars
- Max wind speed measured: 130 knots (~150 mph)
- Areas affected: Turks and Caicos, The Bahamas, Florida, Louisiana
18. Unnamed — Okeechobee hurricane (Sep 6, 1928 – Sep 21, 1928)

Source: Public Domain / Wikimedia Commons
- Minimum pressure at landfall: 929 millibars
- Max. wind speed at landfall: 125 knots (~144 mph)
- Minimum pressure overall: 929 millibars
- Max wind speed measured: 140 knots (~161 mph)
- Areas affected: West Africa, Guadeloupe, Virgin Islands, Puerto Rico, The Bahamas, Florida, Georgia, East Coast of the United States, Northeastern United States, Eastern Canada
17. Hurricane Otis (Oct 21, 2023 – Oct 25, 2023)

- Minimum pressure at landfall: 929 millibars
- Max. wind speed at landfall: 140 knots (~161 mph)
- Minimum pressure overall: 922 millibars
- Max wind speed measured: 145 knots (~167 mph)
- Areas affected: Southern Mexico
16. Unnamed — Florida Keys hurricane (Sep 2, 1919 – Sep 16, 1919)

Source: Florida Keys—Public Libraries / Wikimedia Commons
- Minimum pressure at landfall: 927 millibars
- Max. wind speed at landfall: 130 knots (~150 mph)
- Minimum pressure overall: 927 millibars
- Max wind speed measured: 130 knots (~150 mph)
- Areas affected: Lesser Antilles, Puerto Rico, Hispaniola, Turks and Caicos, Bahamas, Cuba, Florida, Louisiana, Mississippi, Mexico, Texas, New Mexico
15. Hurricane Wilma (Oct 15, 2005 – Oct 26, 2005)
")
- Minimum pressure at landfall: 927 millibars
- Max. wind speed at landfall: 130 knots (~150 mph)
- Minimum pressure overall: 882 millibars
- Max wind speed measured: 160 knots (~184 mph)
- Areas affected: Jamaica, Grand Cayman Island, eastern Mexico, Florida
14. Unnamed — Indianola Hurricane (Aug 12, 1886 – Aug 21, 1886)
Source: Courtesy of NOAA
- Minimum pressure at landfall: 925 millibars
- Max. wind speed at landfall: 130 knots (~150 mph)
- Minimum pressure overall: 925 millibars
- Max wind speed measured: 130 knots (~150 mph)
- Areas affected: Southeastern Texas
13. Hurricane Hattie (Oct 26, 1961 – Nov 1, 1961)

Source: Public Domain / Wikimedia Commons
- Minimum pressure at landfall: 924 millibars
- Max. wind speed at landfall: 130 knots (~150 mph)
- Minimum pressure overall: 914 millibars
- Max wind speed measured: 145 knots (~167 mph)
- Areas affected: Belize, Guatemala, Honduras
12. Hurricane Iota (Nov 12, 2020 – Nov 18, 2020)
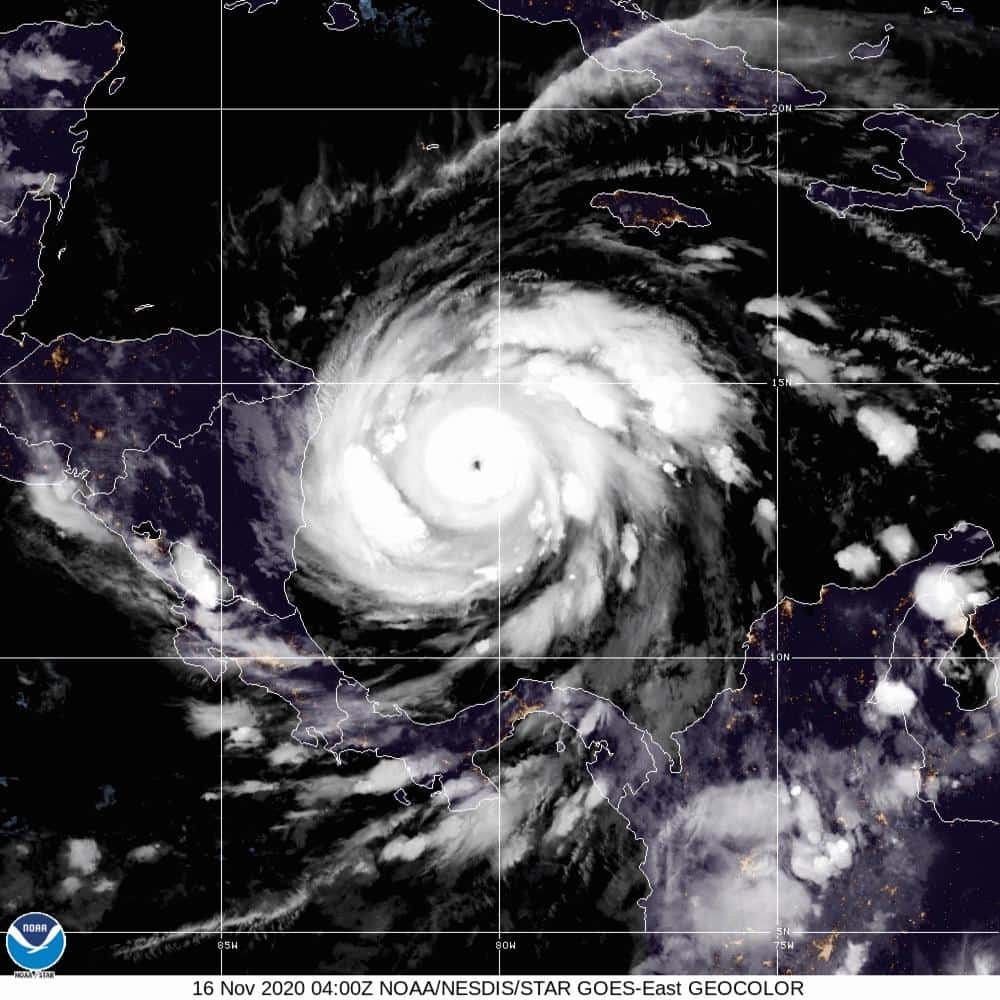
Source: File:Satellite Loop of Hurricane Iota 11-16-2020.gif by NOAA / BY-SA 4.0 (https://creativecommons.org/licenses/by-sa/4.0/)
- Minimum pressure at landfall: 922 millibars
- Max. wind speed at landfall: 125 knots (~144 mph)
- Minimum pressure overall: 917 millibars
- Max wind speed measured: 135 knots (~155 mph)
- Areas affected: ABC islands, Colombia, Jamaica, Central America (esp Honduras and Nicaragua)
11. Hurricane Andrew (Aug 16, 1992 – Aug 28, 1992)
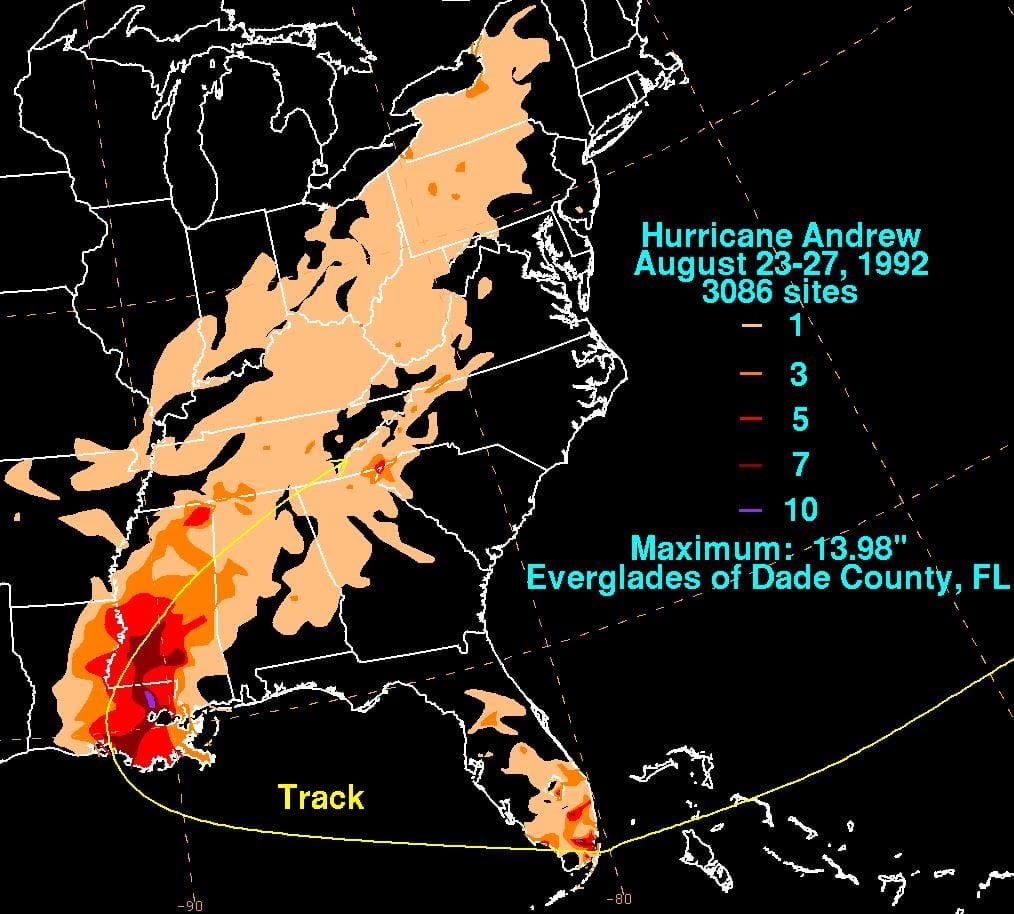
Source: Public Domain / Wikimedia Commons
- Minimum pressure at landfall: 922 millibars
- Max. wind speed at landfall: 145 knots (~167 mph)
- Minimum pressure overall: 922 millibars
- Max wind speed measured: 150 knots (~173 mph)
- Areas affected: Bermuda, Puerto Rico, Florida, Louisiana
10. Hurricane Katrina (Aug 23, 2005 – Aug 31, 2005)

Source: Eifel Kreutz / iStock via Getty Images
- Minimum pressure at landfall: 920 millibars
- Max. wind speed at landfall: 110 knots (~127 mph)
- Minimum pressure overall: 902 millibars
- Max wind speed measured: 150 knots (~173 mph)
- Areas affected: Louisiana, Mississippi, Alabama
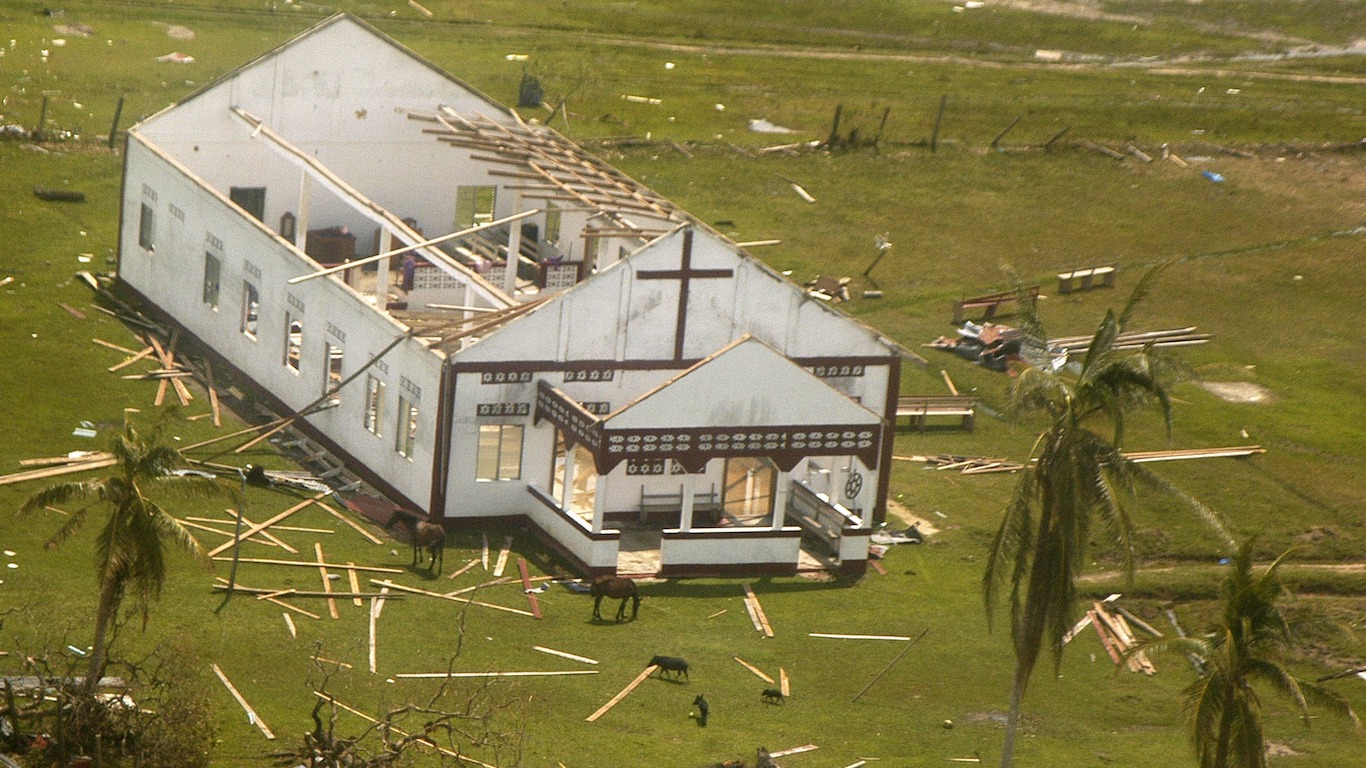
9. Hurricane Maria (Sep 16, 2017 – Oct 2, 2017)
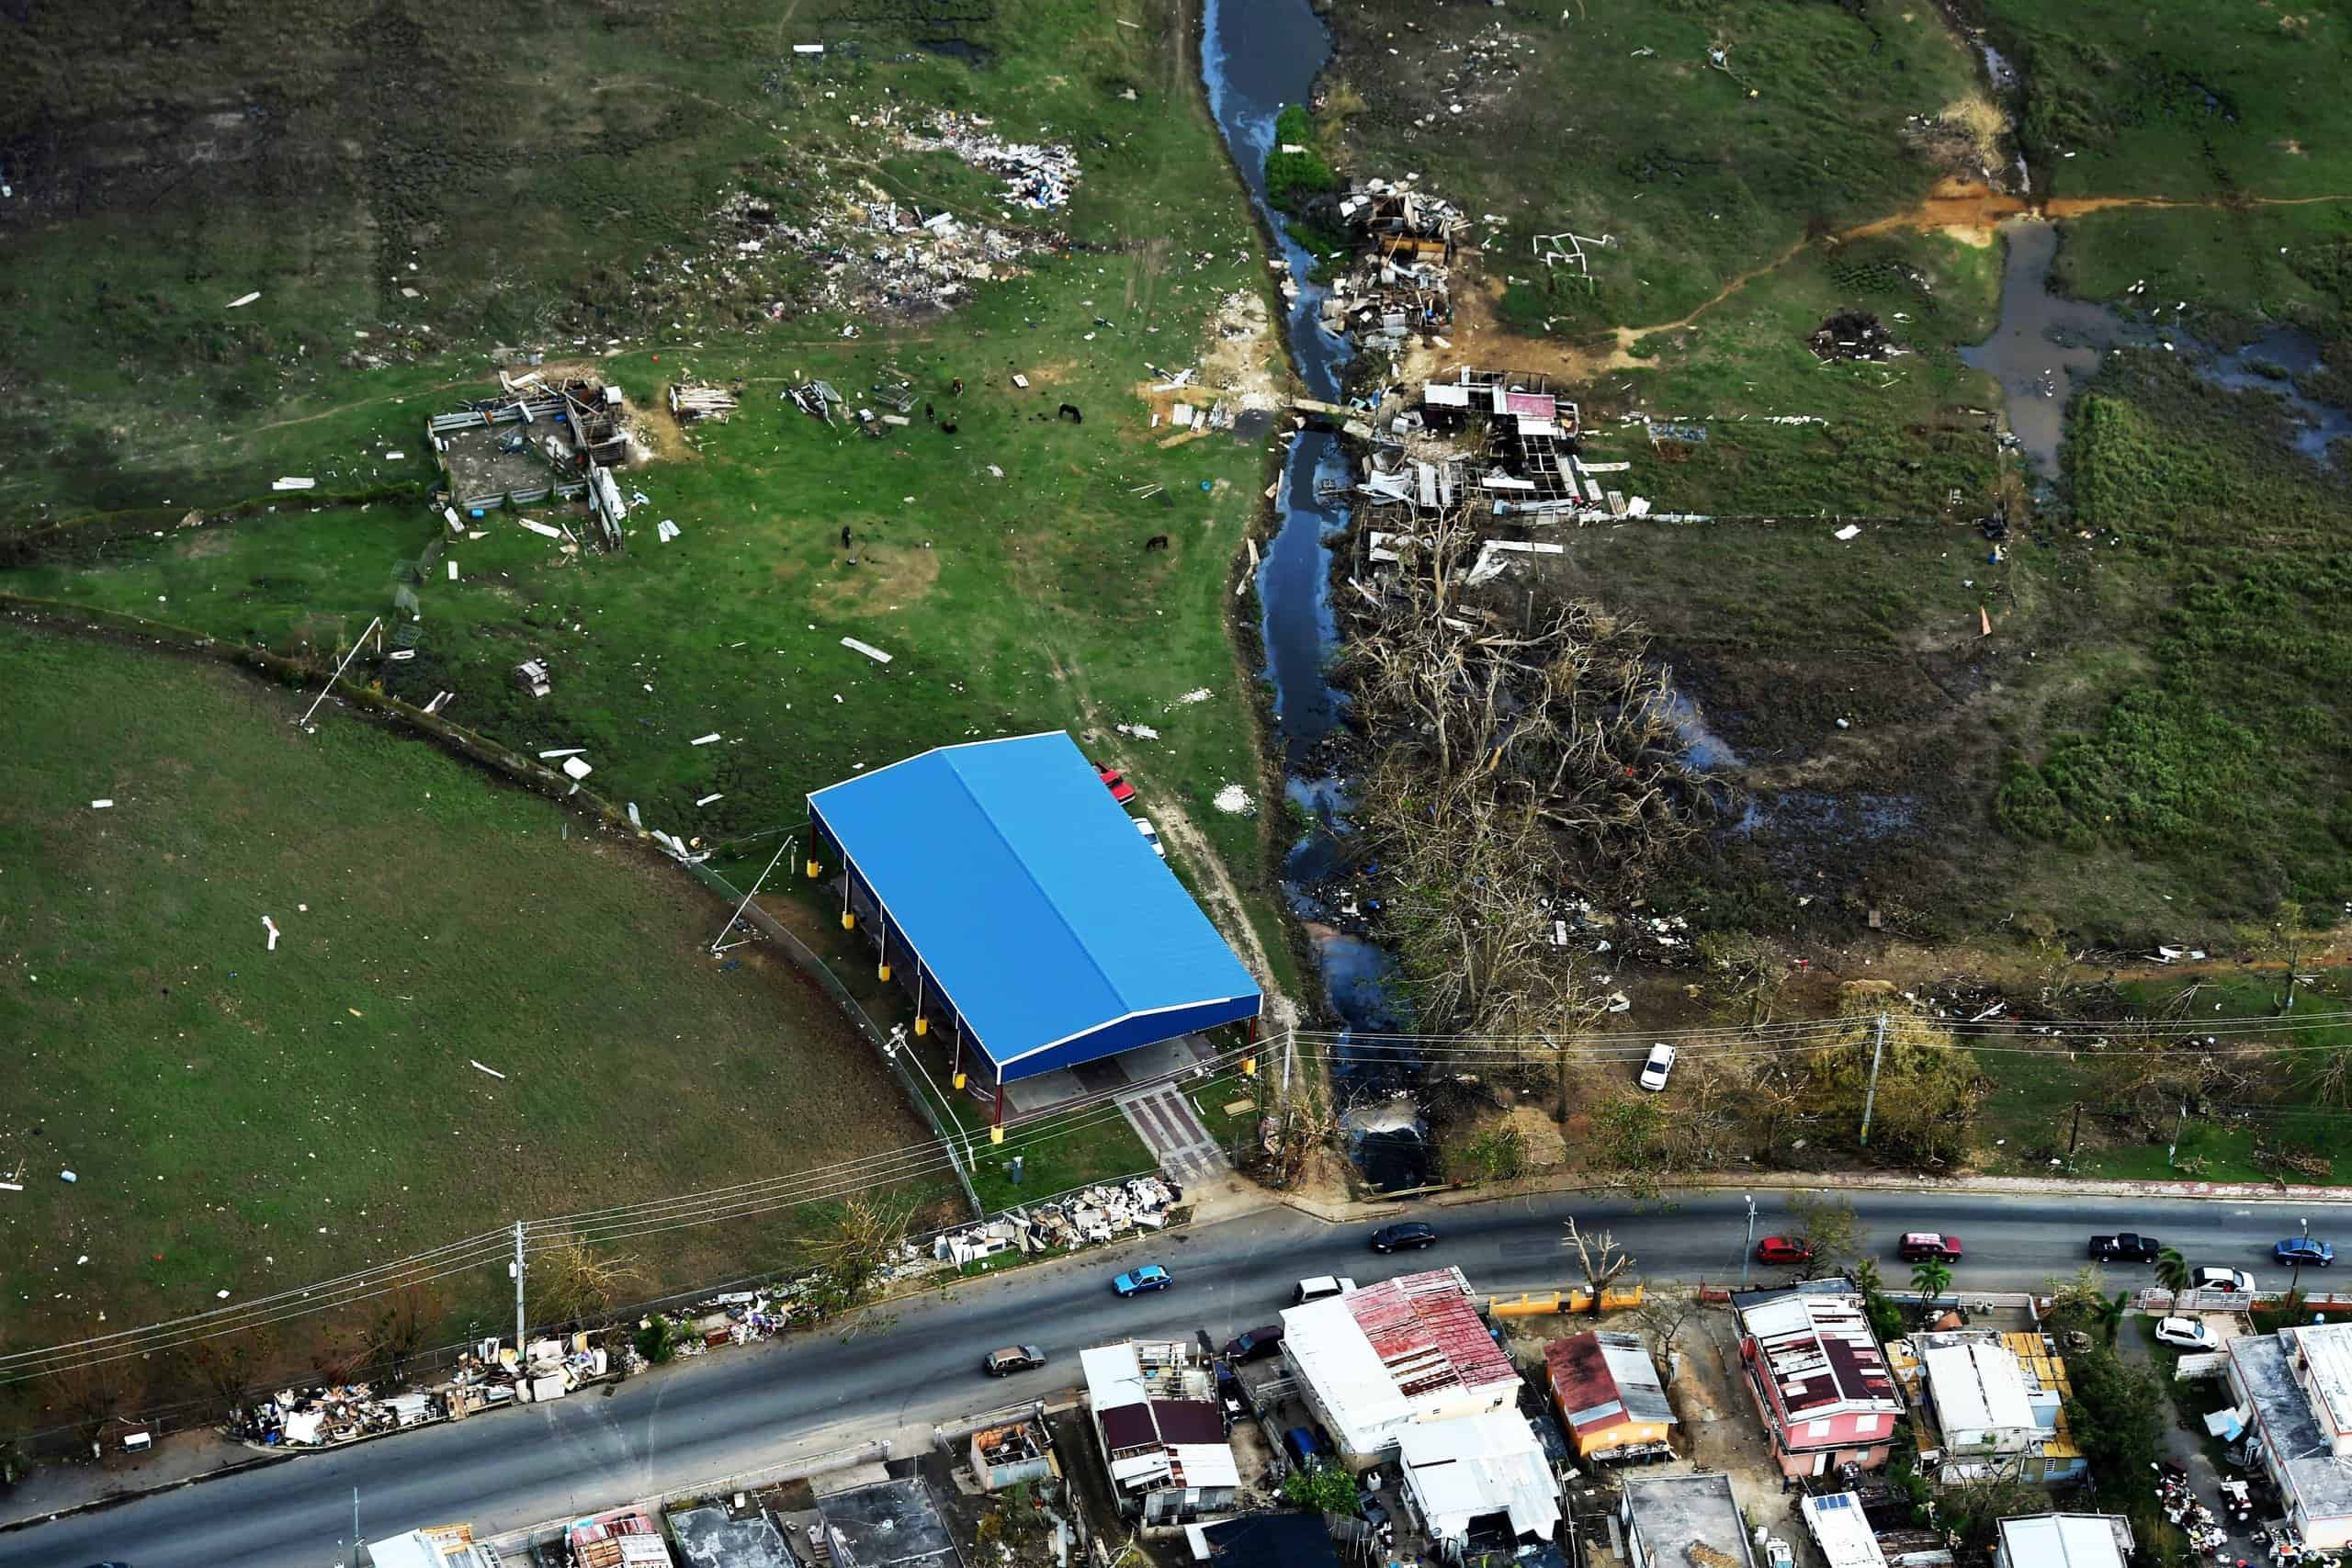
Source: usdagov / Flickr
- Minimum pressure at landfall: 920 millibars
- Max. wind speed at landfall: 145 knots (~167 mph)
- Minimum pressure overall: 908 millibars
- Max wind speed measured: 150 knots (~173 mph)
- Areas affected: Puerto Rico, northeastern Caribbean islands
8. Hurricane Michael (Oct 6, 2018 – Oct 15, 2018)
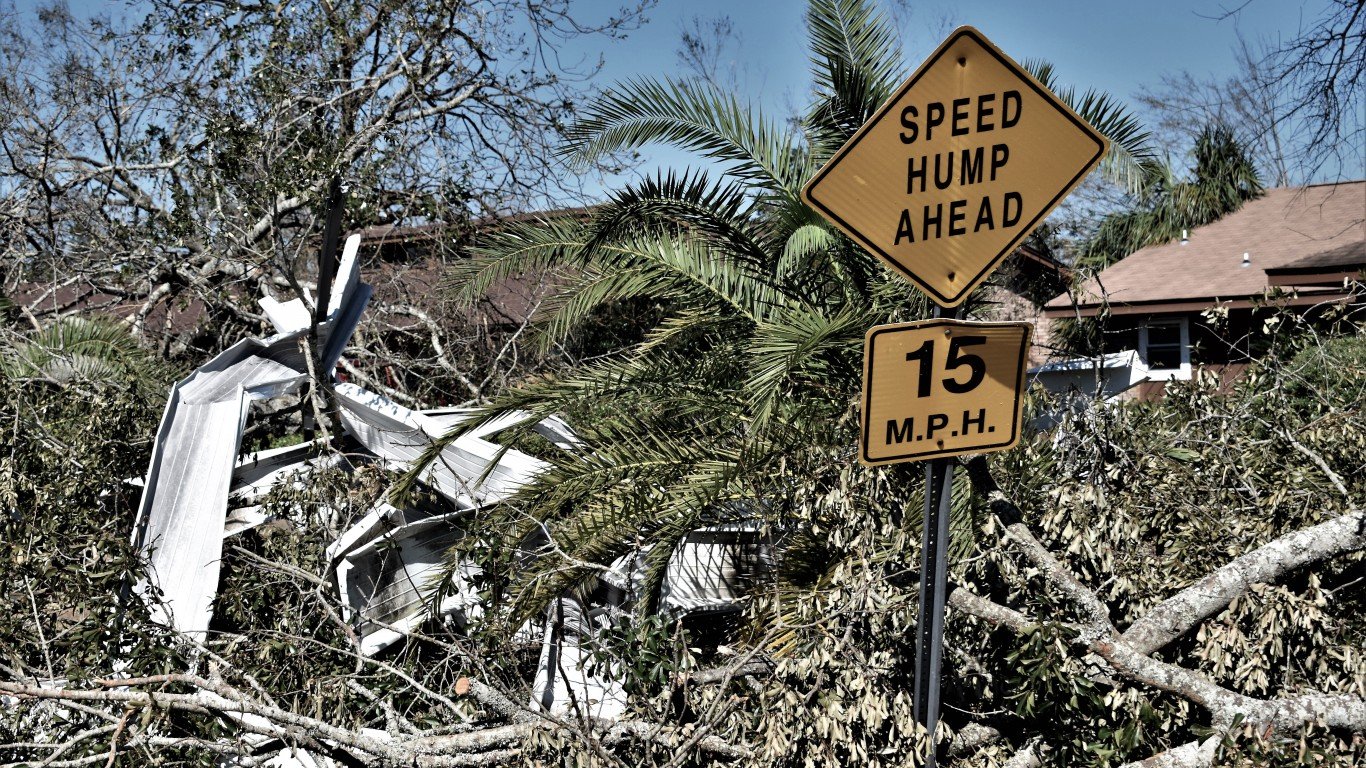
Source: Breawna Smith / iStock via Getty Images
- Minimum pressure at landfall: 919 millibars
- Max. wind speed at landfall: 140 knots (~161 mph)
- Minimum pressure overall: 919 millibars
- Max wind speed measured: 140 knots (~161 mph)
- Areas affected: Louisiana, Mississippi, Alabama
7. Hurricane Janet (Sep 21, 1955 – Sep 30, 1955)

Source: Photograph Curator / Public Domain / Flickr
- Minimum pressure at landfall: 914 millibars
- Max. wind speed at landfall: 150 knots (~173 mph)
- Minimum pressure overall: 914 millibars
- Max wind speed measured: 150 knots (~173 mph)
- Areas affected: Caribbean islands, Mexico
6. Hurricane Irma (Aug 30, 2017 – Sep 13, 2017)

- Minimum pressure at landfall: 914 millibars
- Max. wind speed at landfall: 155 knots (~178 mph)
- Minimum pressure overall: 914 millibars
- Max wind speed measured: 155 knots (~178 mph)
- Areas affected: Caribbean islands, Florida
5. Hurricane Dorian (Aug 24, 2019 – Sep 9, 2019)
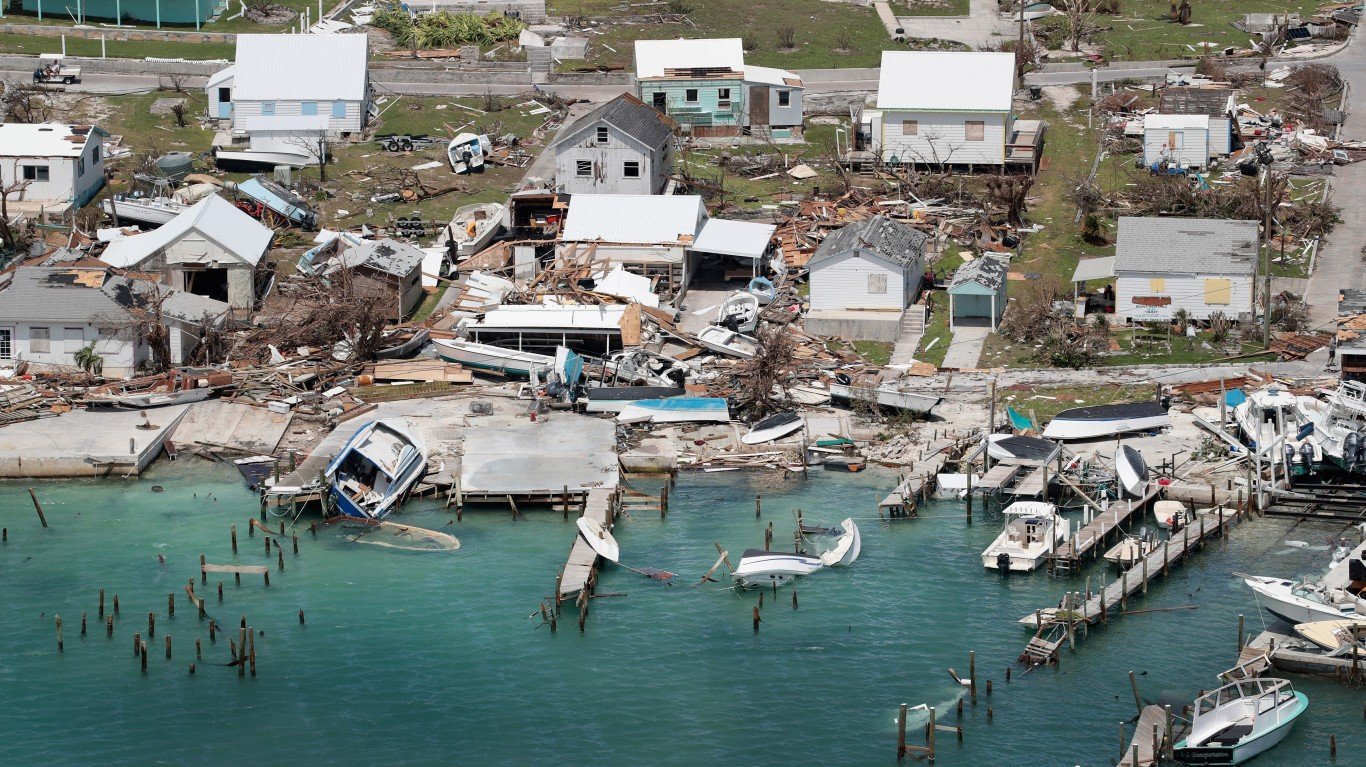
Source: Scott Olson / Getty Images News via Getty Images
- Minimum pressure at landfall: 910 millibars
- Max. wind speed at landfall: 160 knots (~184 mph)
- Minimum pressure overall: 910 millibars
- Max wind speed measured: 160 knots (~184 mph)
- Areas affected: Lesser Antilles, Puerto Rico, The Bahamas (especially Grand Bahama), Eastern United States (especially North Carolina)
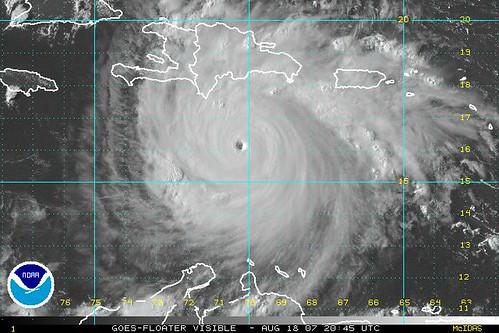
4. Hurricane Dean (Aug 13, 2007 – Aug 23, 2007)

- Minimum pressure at landfall: 905 millibars
- Max. wind speed at landfall: 150 knots (~173 mph)
- Minimum pressure overall: 905 millibars
- Max wind speed measured: 150 knots (~173 mph)
- Areas affected: Jamaica, eastern Mexico
3. Hurricane Gilbert (Sep 8, 1988 – Sep 20, 1988)
Source: Public Domain / Wikimedia Commons
- Minimum pressure at landfall: 900 millibars
- Max. wind speed at landfall: 140 knots (~161 mph)
- Minimum pressure overall: 888 millibars
- Max wind speed measured: 160 knots (~184 mph)
- Areas affected: Caribbean islands (esp Jamaica), Central America (Cozumel & Playa del Carmen, Mexico), parts of U.S. (Texas, Oklahoma, Midwest)
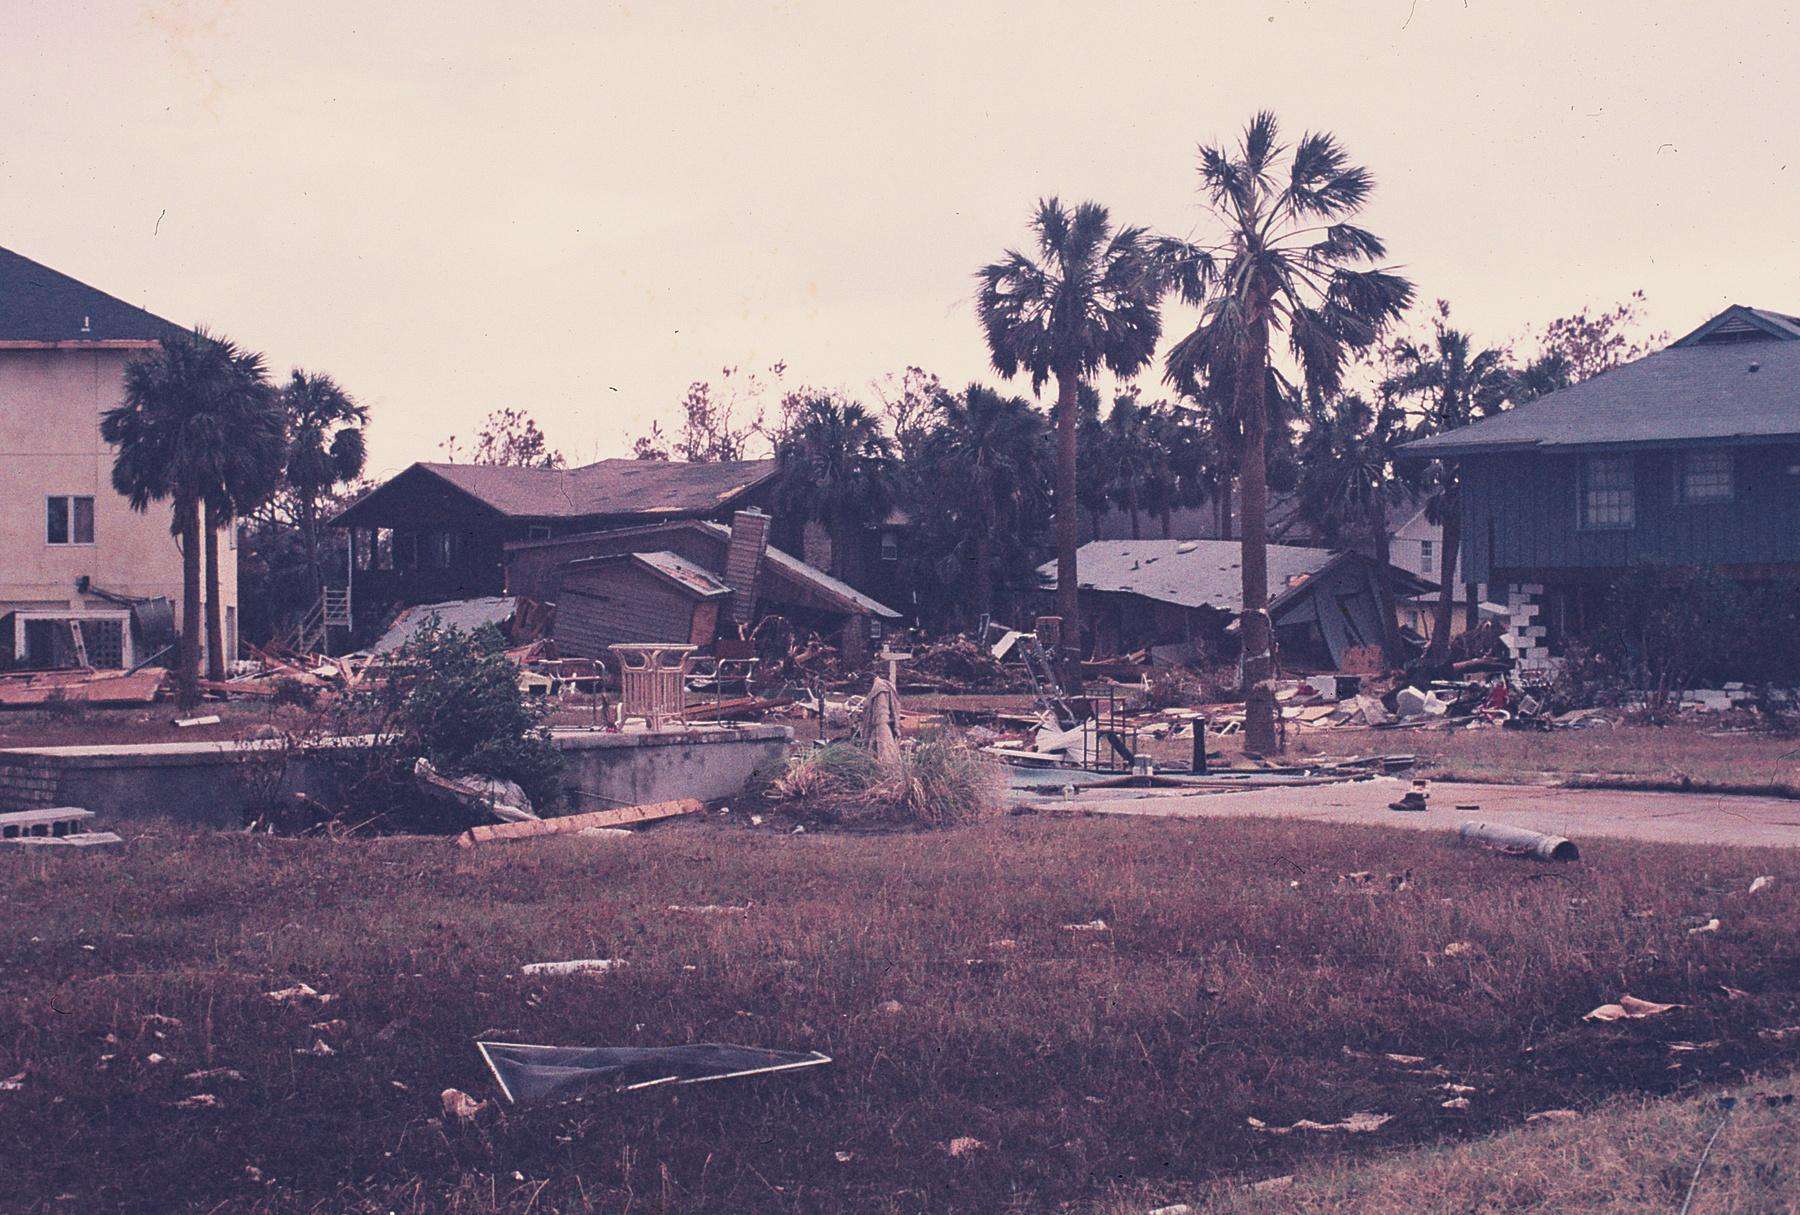
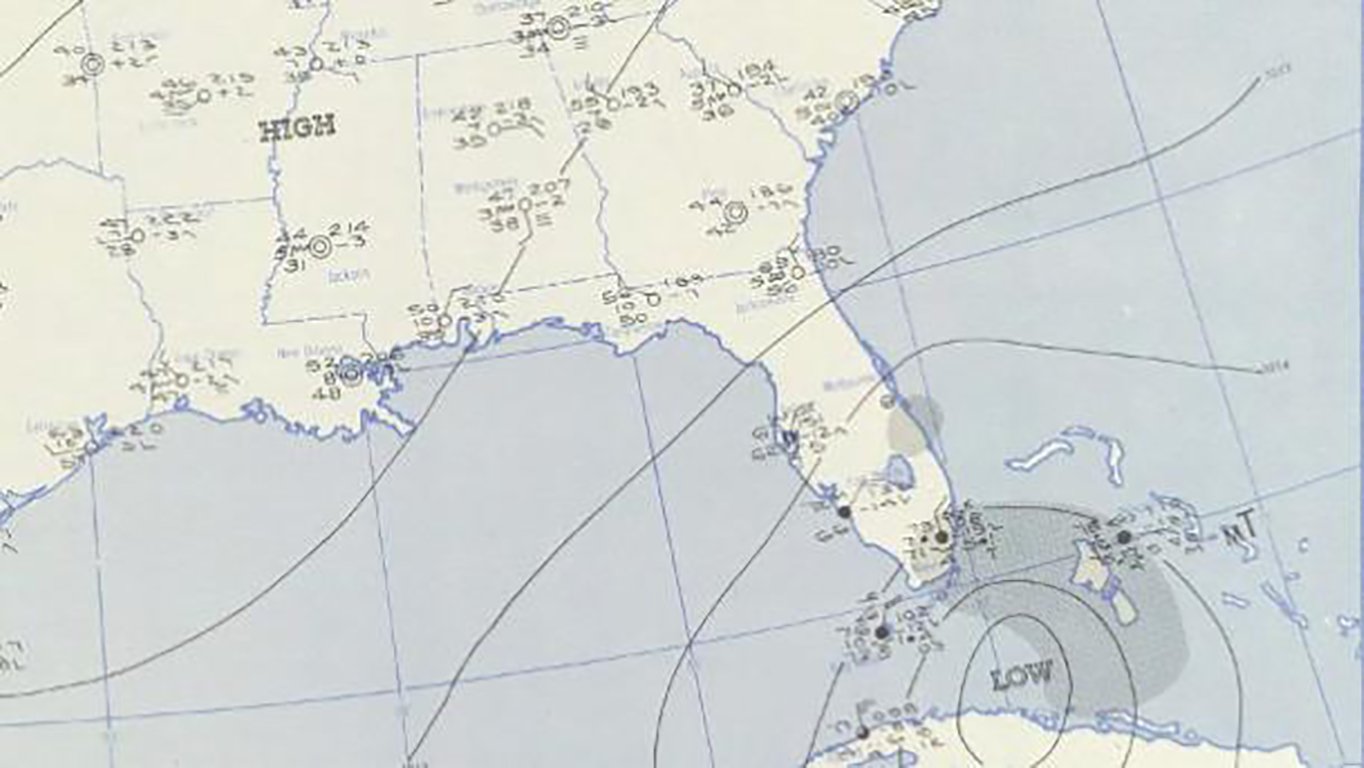
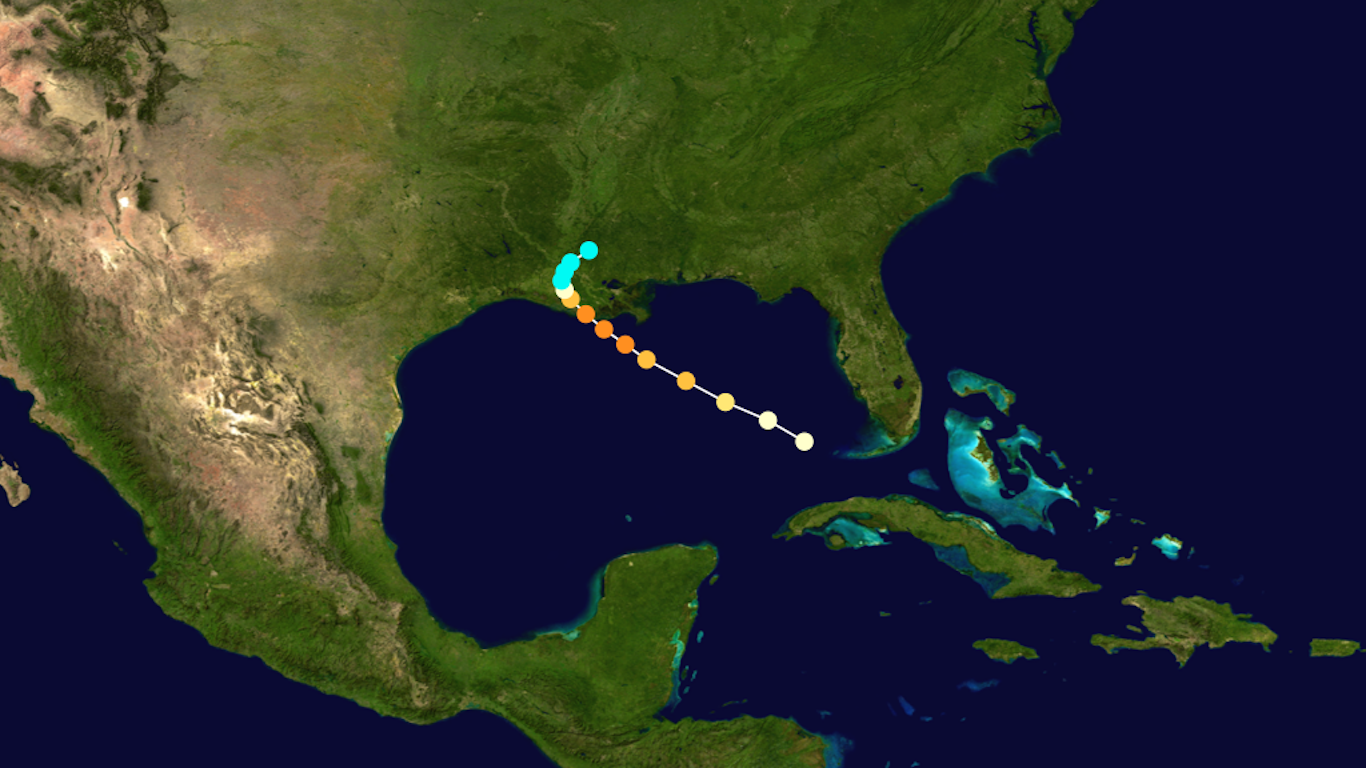
2. Hurricane Camille (Aug 14, 1969 – Aug 22, 1969)
Source: The Library of Virginia / flickr
- Minimum pressure at landfall: 900 millibars
- Max. wind speed at landfall: 150 knots (~173 mph)
- Minimum pressure overall: 900 millibars
- Max wind speed measured: 150 knots (~173 mph)
- Areas affected: Cuba, southern U.S.
1. Unnamed — Labor Day hurricane (Aug 29, 1935 – Sep 10, 1935)

Source: Public Domain / Wikimedia Commons
- Minimum pressure at landfall: 892 millibars
- Max. wind speed at landfall: 160 knots (~184 mph)
- Minimum pressure overall: 892 millibars
- Max wind speed measured: 160 knots (~184 mph)
- Areas affected: The Bahamas, Florida Keys, Southwest and North Florida (Big Bend), Georgia, The Carolinas, Virginia
Thank you for reading! Have some feedback for us?
Contact the 24/7 Wall St. editorial team.
Editors' Picks