The U.S. violent crime rate — an annual, population-adjusted measure of cases of rape, robbery, aggravated assault, and homicide — climbed by 5% in 2020. The increase was driven by a rise in aggravated assault and, most notably, a historic 29% surge in homicides that made 2020 the deadliest year in the United States since the mid-1990s.
Despite the largest single-year increase in homicides on record, the overall violent crime rate in 2020 remains relatively low by historical standards. There were 1.3 million violent crimes reported in the U.S. in 2020, or 399 for every 100,000 people. For context, the violent crime rate ranged between 523 and 758 incidents per 100,000 throughout the 1990s.
Of course, crime is a local phenomenon influenced by a wide range of factors. As a result, violent crime rates in the U.S. can vary considerably from place to place — and in some metro areas, rates of violence far exceed the nation-level highs recorded in decades past.
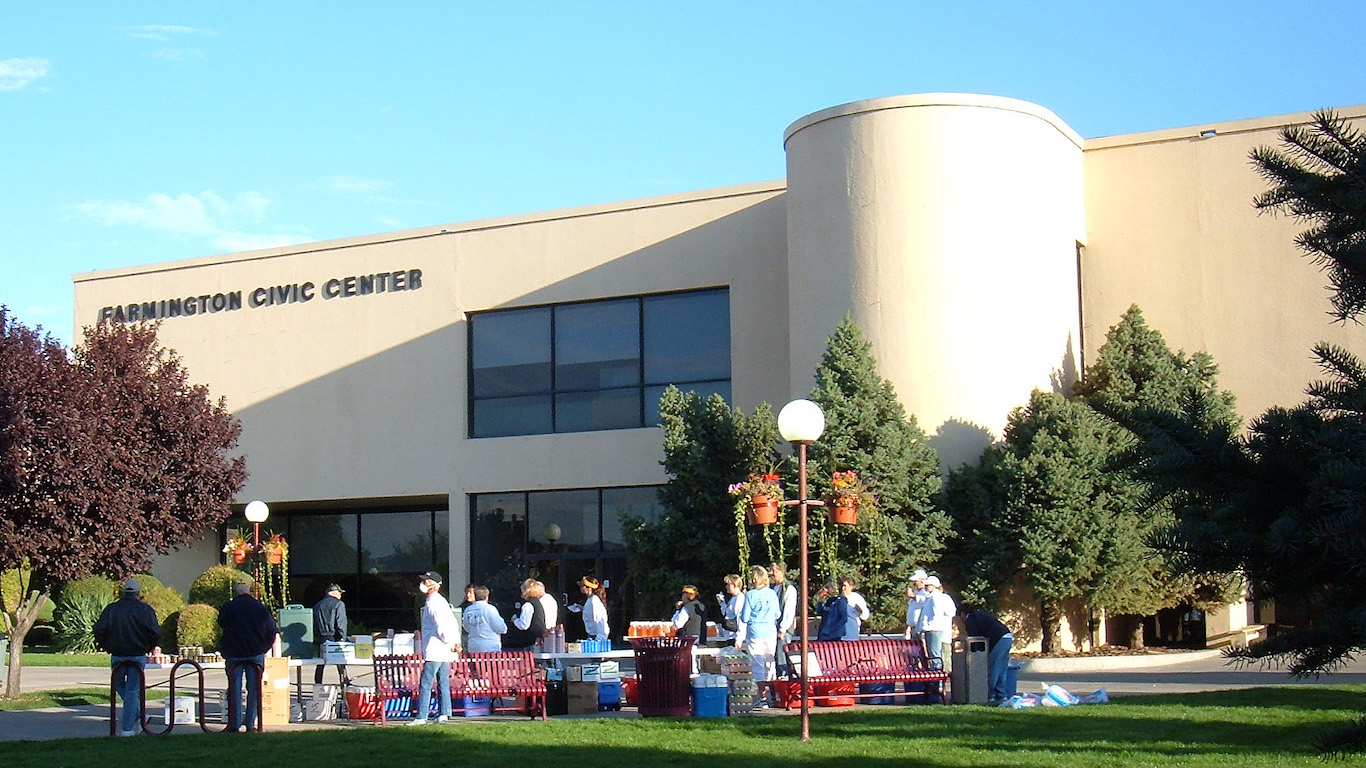
Farmington, New Mexico, is one of only 10 metro areas located in a Western state to rank among the 50 most dangerous metro areas in the country. There were 817 violent crimes reported in Farmington in 2020, or 661 for every 100,000 people.
Rates of violence are often higher in places with limited economic opportunity — and in Farmington, 21.2% of the population live below the poverty line, and average unemployment in 2020 was 10.0%. This compares to the national 12.3% poverty rate and 8.1% jobless rate that year.
Metro areas are ranked on their violent crime rate using data from the FBI’s 2020 Uniform Crime Report. Additional data on specific crimes are also from the 2020 FBI UCR. Poverty rates are one-year estimates from the U.S. Census Bureau’s 2019 American Community Survey.
| Rank | Metro area | Violent crimes per 100,000 people, 2020 | Total violent crimes, 2020 | Murders per 100,000 people, 2020 | Total murders, 2020 |
|---|---|---|---|---|---|
| 1 | Memphis, TN | 1,359 | 18,324 | 24.2 | 327 |
| 2 | Monroe, LA | 1,309 | 2,605 | 11.6 | 23 |
| 3 | Anchorage, AK | 1,171 | 3,576 | 5.9 | 18 |
| 4 | Pine Bluff, AR | 1,098 | 950 | 27.7 | 24 |
| 5 | Detroit, MI | 1,088 | 18,894 | 22.3 | 387 |
| 6 | Danville, IL | 1,050 | 785 | 17.4 | 13 |
| 7 | Albany, GA | 1,008 | 1,469 | 15.8 | 23 |
| 8 | Albuquerque, NM | 1,006 | 9,296 | 9.4 | 87 |
| 9 | Alexandria, LA | 968 | 1,464 | 14.5 | 22 |
| 10 | Little Rock, AR | 939 | 7,014 | 13.1 | 98 |
| 11 | Lubbock, TX | 919 | 2,985 | 9.5 | 31 |
| 12 | Florence, SC | 860 | 1,764 | 19.0 | 39 |
| 13 | Fairbanks, AK | 841 | 277 | 9.1 | 3 |
| 14 | Sumter, SC | 812 | 1,140 | 19.9 | 28 |
| 15 | Saginaw, MI | 795 | 1,501 | 17.5 | 33 |
| 16 | Lake Charles, LA | 789 | 1,663 | 9.0 | 19 |
| 17 | Rockford, IL | 771 | 2,566 | 10.8 | 36 |
| 18 | Gainesville, FL | 760 | 2,516 | 5.1 | 17 |
| 19 | Corpus Christi, TX | 738 | 3,176 | 10.0 | 43 |
| 20 | Stockton, CA | 723 | 5,517 | 11.0 | 84 |
| 21 | Pueblo, CO | 722 | 1,216 | 10.7 | 18 |
| 22 | Macon, GA | 708 | 1,624 | 19.2 | 44 |
| 23 | Odessa, TX | 697 | 1,180 | 11.2 | 19 |
| 24 | Bakersfield, CA | 692 | 6,216 | 12.9 | 116 |
| 25 | Shreveport, LA | 683 | 2,683 | 21.6 | 85 |
| 26 | Milwaukee, WI | 678 | 10,688 | 13.1 | 206 |
| 27 | Amarillo, TX | 673 | 1,787 | 6.8 | 18 |
| 28 | Springfield, IL | 667 | 1,369 | 5.8 | 12 |
| 29 | Rapid City, SD | 665 | 957 | 10.4 | 15 |
| 30 | Niles, MI | 664 | 1,013 | 5.2 | 8 |
| 31 | Battle Creek, MI | 664 | 886 | 10.5 | 14 |
| 32 | Kalamazoo, MI | 663 | 1,763 | 7.5 | 20 |
| 33 | Farmington, NM | 661 | 817 | 3.2 | 4 |
| 34 | Jonesboro, AR | 660 | 893 | 9.6 | 13 |
| 35 | South Bend, IN | 655 | 2,121 | 9.3 | 30 |
| 36 | Houston, TX | 632 | 45,368 | 9.2 | 662 |
| 37 | Springfield, MO | 632 | 2,993 | 5.5 | 26 |
| 38 | Billings, MT | 627 | 1,152 | 8.2 | 15 |
| 39 | Jackson, TN | 625 | 1,115 | 9.5 | 17 |
| 40 | New Orleans, LA | 624 | 7,960 | 21.7 | 277 |
| 41 | Nashville, TN | 616 | 12,137 | 7.7 | 152 |
| 42 | Fort Smith, AR | 615 | 1,541 | 4.4 | 11 |
| 43 | Chattanooga, TN | 613 | 3,487 | 7.9 | 45 |
| 44 | Beaumont, TX | 606 | 2,372 | 8.9 | 35 |
| 45 | Kokomo, IN | 604 | 498 | 9.7 | 8 |
| 46 | Lawton, OK | 603 | 759 | 12.7 | 16 |
| 47 | Merced, CA | 599 | 1,660 | 8.7 | 24 |
| 48 | Fresno, CA | 597 | 5,948 | 9.4 | 94 |
| 49 | Tulsa, OK | 591 | 5,947 | 9.3 | 94 |
| 50 | Hot Springs, AR | 583 | 582 | 9.0 | 9 |
Smart Investors Are Quietly Loading Up on These “Dividend Legends” (Sponsored)
If you want your portfolio to pay you cash like clockwork, it’s time to stop blindly following conventional wisdom like relying on Dividend Aristocrats. There’s a better option, and we want to show you. We’re offering a brand-new report on 2 stocks we believe offer the rare combination of a high dividend yield and significant stock appreciation upside. If you’re tired of feeling one step behind in this market, this free report is a must-read for you.
Click here to download your FREE copy of “2 Dividend Legends to Hold Forever” and start improving your portfolio today.
Thank you for reading! Have some feedback for us?
Contact the 24/7 Wall St. editorial team.
Editors' Picks

