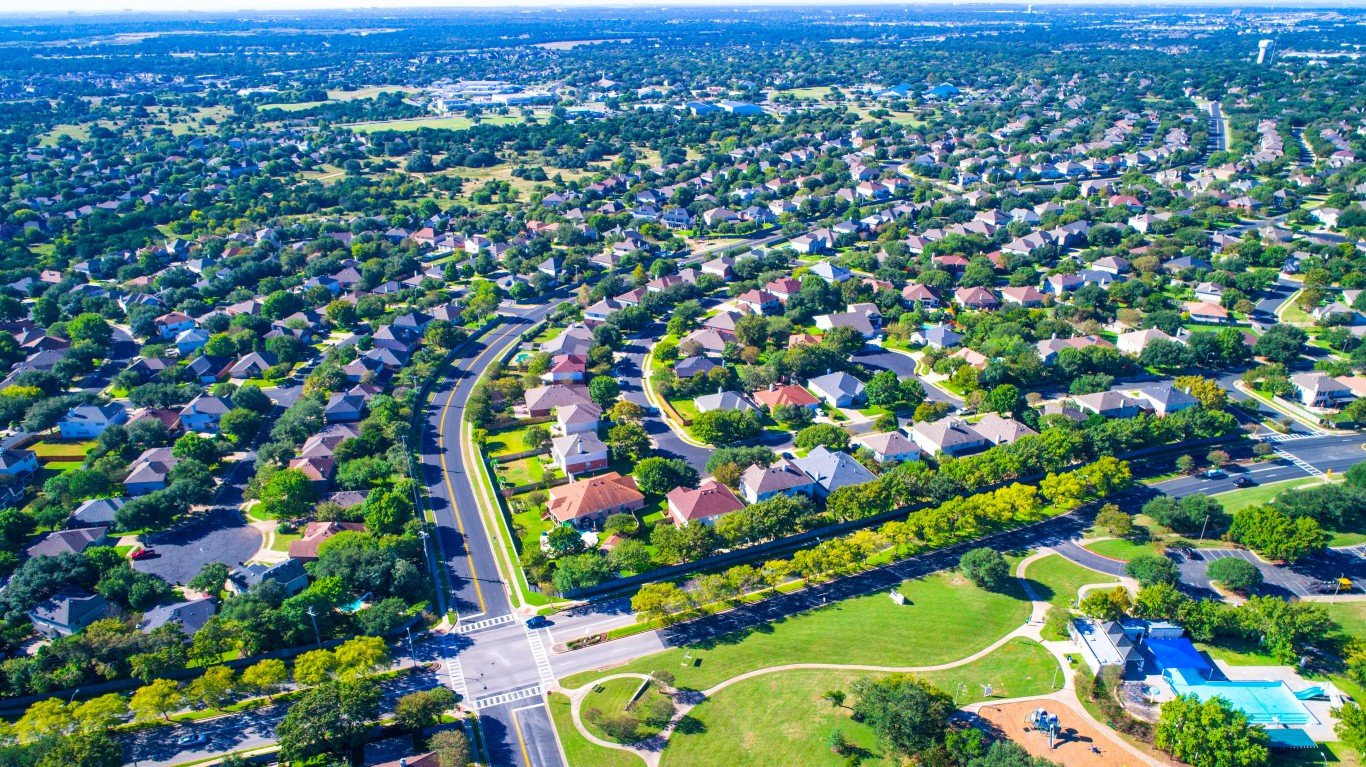

Compared to the third quarter of 2018, U.S. homeowner equity in the third quarter of this year rose by $457 billion, or 5.1%. The number of homeowners whose mortgages exceed the value of the property (called negative equity or underwater) fell by 10% (220,000 homes) to 2 million homes, representing 3.7% of all mortgaged properties. In 2018, 4.1% (2.2 million homes) of all mortgaged properties were underwater.
States with the largest percentage of underwater mortgages are Louisiana (10.1%), Connecticut (7.4%) and Illinois (7%). Iowa (6.1%) and New Jersey (5.8%) round out the five states with the largest shares of underwater mortgages.
The data was included Thursday in CoreLogic’s third-quarter Home Equity Insights report. The report reflects only mortgaged properties.
CoreLogic’s chief economist, Frank Nothaft, said:
Ten years ago, during the depths of the Great Recession, more than 11 million homeowners had negative equity or 25% of mortgaged homes. After more than eight years of rising home prices and employment growth, underwater owners have been slashed to just 2 million, or less than 4% of mortgaged homes.
CEO Frank Martell added:
The negative equity share continues to decline thanks to rising home prices across the nation. According to the latest [Home Price Index] report, home prices increased an average of 3.5% year over year in October 2019. Out of all 50 states, homeowners in Idaho experienced the largest annual home price increase at 10.9%, while they also gained the most home equity, averaging $25,800.
Nationally, average homeowner equity increased by about $5,300. In addition to Idaho, two other western states, Wyoming and Utah, posted gains above $20,000. Wyoming homeowners got a boost of $24,000 in the past 12 months, while Utah homeowners saw an increase of $21,000 in home equity. Homeowners in eight other states made gains of $10,000 or more in home equity: Montana ($18,000); Washington, D.C. ($17,000); Arizona and New Mexico ($15,000); Colorado and Kansas ($11,000); and New Hampshire and Massachusetts ($10,000).
Among the country’s largest metropolitan areas, CoreLogic called out current negative equity percentages in these 10 cities:
- Miami: 9.1%
- Chicago: 7.8%
- New York City: 4.6%
- Washington, D.C.: 4.2%
- Las Vegas: 4.0%
- Boston: 3.2%
- Houston: 1.5%
- Los Angeles: 1.6%
- Denver and Los Angeles: 1.4%
- San Francisco: 0.7%
As the percentage of homes with negative equity rises, the average amount of negative equity drops. Miami, the city with the highest rate of negative equity has the lowest average amount (under $100,000) of negative equity. Conversely, San Francisco, where the rate is lowest, posts average negative equity of around $800,000.
Smart Investors Are Quietly Loading Up on These “Dividend Legends” (Sponsored)
If you want your portfolio to pay you cash like clockwork, it’s time to stop blindly following conventional wisdom like relying on Dividend Aristocrats. There’s a better option, and we want to show you. We’re offering a brand-new report on 2 stocks we believe offer the rare combination of a high dividend yield and significant stock appreciation upside. If you’re tired of feeling one step behind in this market, this free report is a must-read for you.
Click here to download your FREE copy of “2 Dividend Legends to Hold Forever” and start improving your portfolio today.
Thank you for reading! Have some feedback for us?
Contact the 24/7 Wall St. editorial team.
 24/7 Wall St.