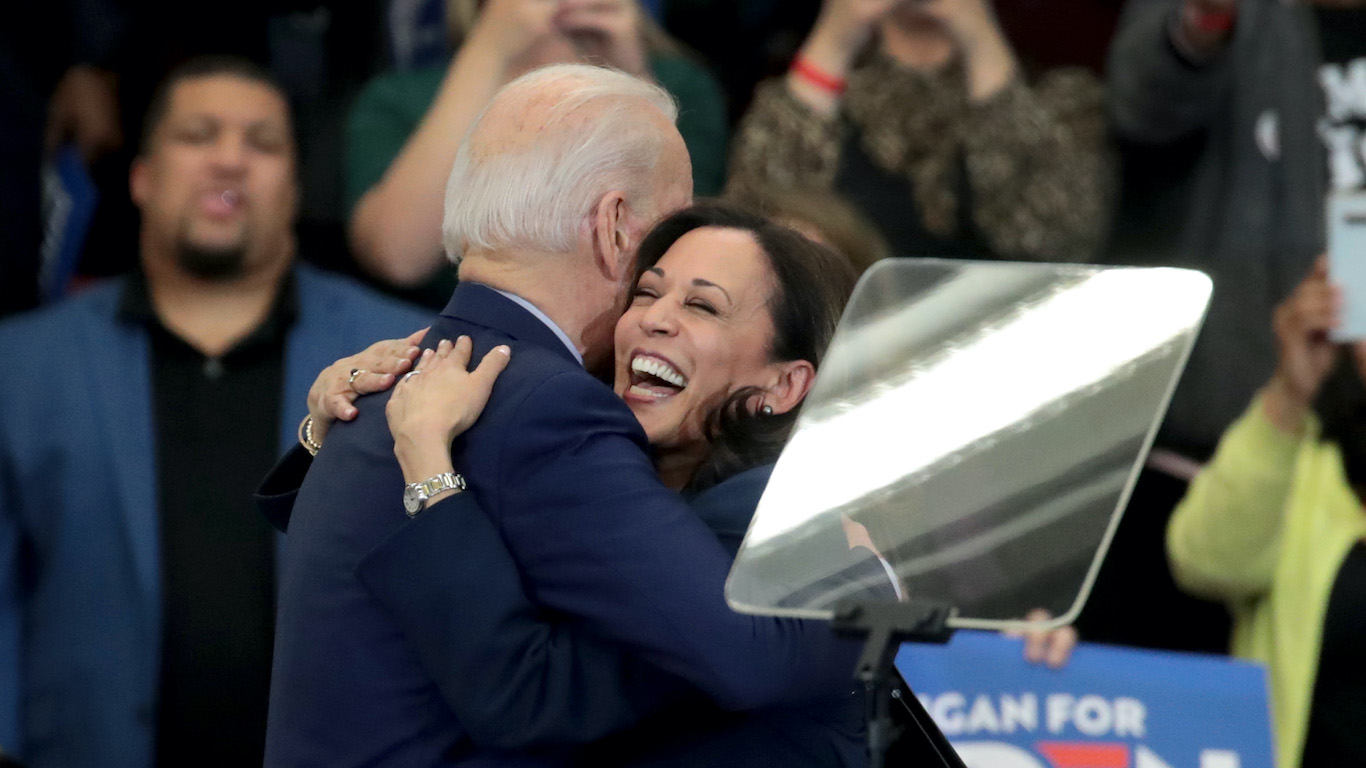
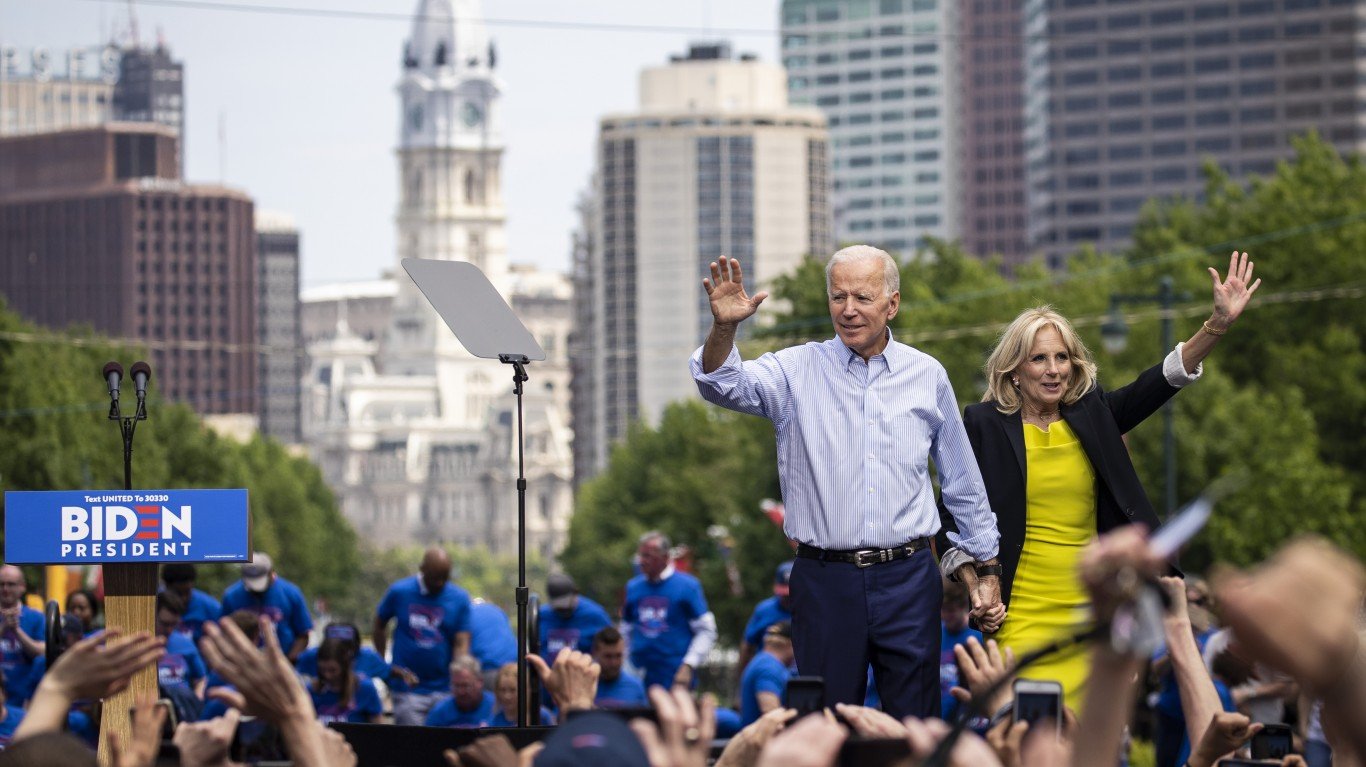
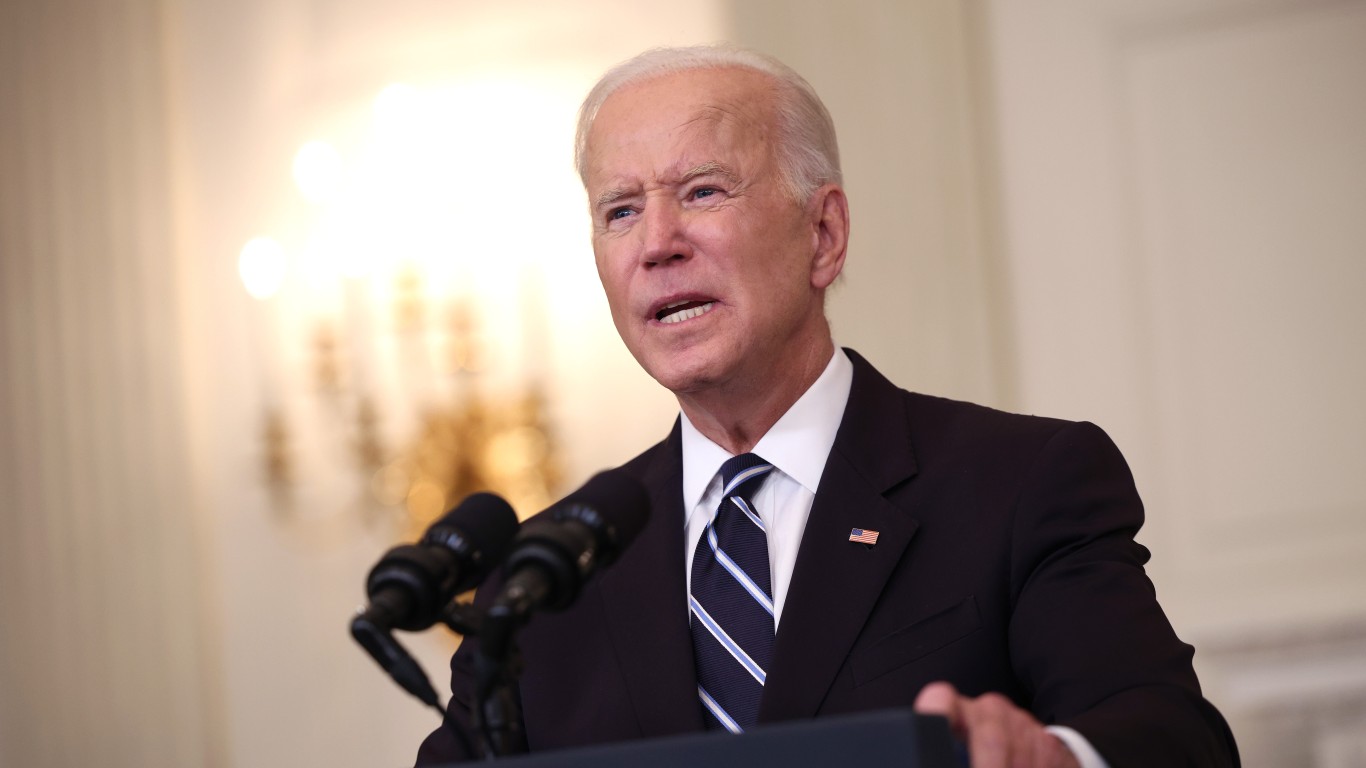
The November 2024 election is only six months away, and after trailing Donald Trump in the polls for much of the year, President Joe Biden is now in a dead heat with his Republican rival. According to the latest numbers from public opinion research company Morning Consult, if the election were today, 43% of American adults would vote for Biden and 43% would vote for Trump.
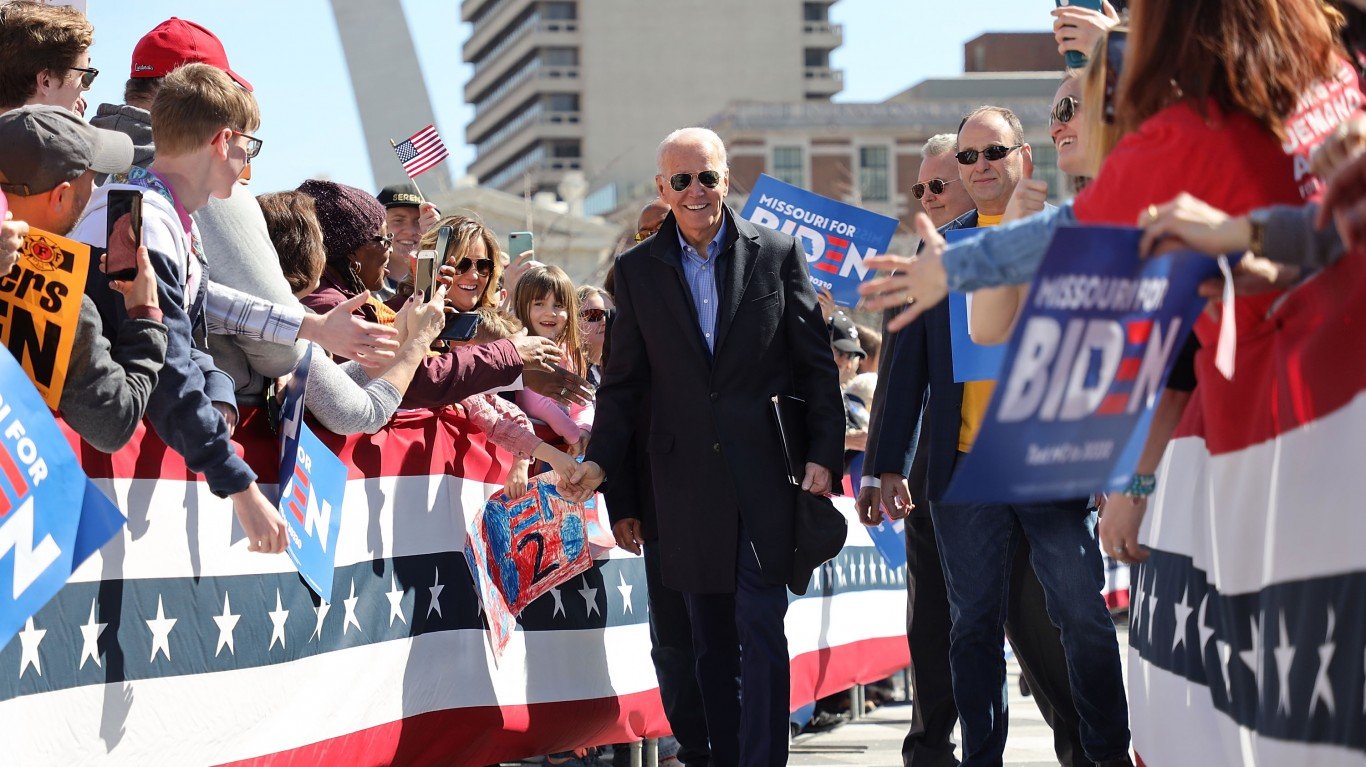
To win in November, Biden will need to mobilize a broad coalition of voters from all age groups, education levels, ethnicities, and even political ideologies. In the coming months, the Biden campaign will specifically target millions of Americans within these demographic groups to gain support. Currently, Biden is performing far better with certain subsets of voters.
Using data from Morning Consult, 24/7 Wall St. identified the Americans who are most likely to vote for Biden. We reviewed the share of Americans across 22 demographic segments who would vote for Biden if the election were today. The demographics on this list fall into one of seven categories: voting history, age, generation, education, ethnicity, political ideology, and assessments of Biden’s job as president. In the case of a tie, the demographic group with the larger sample size ranks higher. All polling data is current as of April 28, 2024, and due to rounding, percentages may not add to 100%.
Among the classifications of Americans on this list, the share who would vote for Biden today ranges from 3% to 88%. Not surprisingly, the strongest predictors of support for the president are those directly related to politics. The Americans most likely to vote for Biden voted for him in 2020, approve of the current administration, and identify as ideologically liberal. Biden also has relatively strong support from African Americans, college graduates, and voters between the ages of 35 and 44. (Here is a look at Biden’s approval rating in every state.)
Although Biden has closed the gap in the polls in recent months, his support among many of the demographic groups on this list has fallen over the last year. Since April 2023, Biden has only gained ground with four groups on this list, including voters in Generation X and Americans 65 and older. Meanwhile, his support has fallen within 14 demographic categories, including Hispanic Americans and voters under age 35.
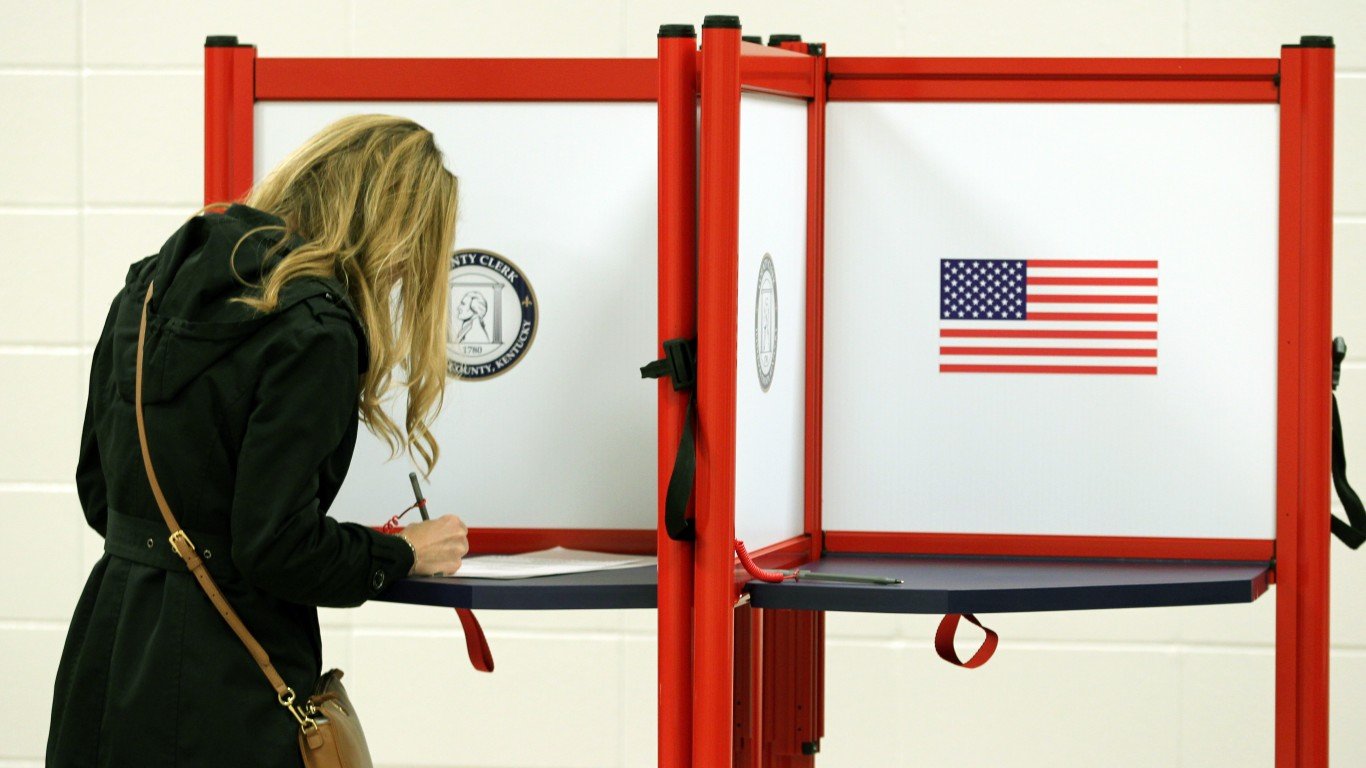
Within each of these 22 demographic groups, some share of voters say they would vote for someone other than Biden if the election were today. However, the election is not today, and the next six months could bring meaningful shifts in public sentiment — to Biden’s benefit or not.
Additionally, within each of these groups, some share of voters do not yet know who they will support. Among the groups on this list, the share of undecided voters ranges from 2% to 9%. A second term for Biden may well hinge on his campaign’s ability to reach these voters. (This is how Biden compares to Trump in every swing state.)
Why It Matters
Home to over 333 million people, the United States is one of the largest democracies in world history. With such a broad constituency of diverging interests and priorities, it is impossible for political candidates to appeal to every voter. But while no two voters are exactly alike, patterns within key demographic groups can shed light on where presidential campaigns need to focus their energy.
22. Americans who voted for Donald Trump in 2020
- Would vote for Biden if election were today: 3% (unchanged from 1 year ago)
- Would vote for someone other than Biden if election were today: 94% (+1 ppt. from 1 year ago)
- Undecided: 3% (unchanged from 1 year ago)
21. Americans who disapprove of Joe Biden’s job in office

- Would vote for Biden if election were today: 11% (+2 ppt. from 1 year ago)
- Would vote for someone other than Biden if election were today: 84% (-2 ppt. from 1 year ago)
- Undecided: 5% (unchanged from 1 year ago)
20. Americans who identify as ideologically conservative

- Would vote for Biden if election were today: 15% (-1 ppt. from 1 year ago)
- Would vote for someone other than Biden if election were today: 81% (unchanged from 1 year ago)
- Undecided: 3% (unchanged from 1 year ago)
18. Americans with no college education

- Would vote for Biden if election were today: 37% (unchanged from 1 year ago)
- Would vote for someone other than Biden if election were today: 57% (-1 ppt. from 1 year ago)
- Undecided: 6% (+1 ppt. from 1 year ago)
19. GenZers

- Would vote for Biden if election were today: 37% (-5 ppt. from 1 year ago)
- Would vote for someone other than Biden if election were today: 54% (+5 ppt. from 1 year ago)
- Undecided: 9% (-1 ppt. from 1 year ago)
16. White Americans

- Would vote for Biden if election were today: 39% (-1 ppt. from 1 year ago)
- Would vote for someone other than Biden if election were today: 57% (unchanged from 1 year ago)
- Undecided: 4% (+1 ppt. from 1 year ago)
17. Americans age 18-34

- Would vote for Biden if election were today: 39% (-10 ppt. from 1 year ago)
- Would vote for someone other than Biden if election were today: 54% (+9 ppt. from 1 year ago)
- Undecided: 7% (+1 ppt. from 1 year ago)
14. Americans age 45-64

- Would vote for Biden if election were today: 42% (unchanged from 1 year ago)
- Would vote for someone other than Biden if election were today: 54% (-1 ppt. from 1 year ago)
- Undecided: 5% (+1 ppt. from 1 year ago)
15. GenXers

- Would vote for Biden if election were today: 42% (+1 ppt. from 1 year ago)
- Would vote for someone other than Biden if election were today: 53% (-2 ppt. from 1 year ago)
- Undecided: 5% (+1 ppt. from 1 year ago)
12. All registered voters

- Would vote for Biden if election were today: 43% (-2 ppt. from 1 year ago)
- Would vote for someone other than Biden if election were today: 51% (-1 ppt. from 1 year ago)
- Undecided: 5% (+1 ppt. from 1 year ago)
13. Americans under age 45

- Would vote for Biden if election were today: 43% (-6 ppt. from 1 year ago)
- Would vote for someone other than Biden if election were today: 51% (+5 ppt. from 1 year ago)
- Undecided: 6% (unchanged from 1 year ago)
10. Baby Boomers

- Would vote for Biden if election were today: 45% (+3 ppt. from 1 year ago)
- Would vote for someone other than Biden if election were today: 51% (-5 ppt. from 1 year ago)
- Undecided: 4% (+1 ppt. from 1 year ago)
11. Millennials

- Would vote for Biden if election were today: 45% (-7 ppt. from 1 year ago)
- Would vote for someone other than Biden if election were today: 50% (+6 ppt. from 1 year ago)
- Undecided: 5% (+1 ppt. from 1 year ago)
9. Americans age 65 and up

- Would vote for Biden if election were today: 46% (+5 ppt. from 1 year ago)
- Would vote for someone other than Biden if election were today: 51% (-5 ppt. from 1 year ago)
- Undecided: 4% (+1 ppt. from 1 year ago)
8. Hispanic Americans

- Would vote for Biden if election were today: 47% (-8 ppt. from 1 year ago)
- Would vote for someone other than Biden if election were today: 46% (+5 ppt. from 1 year ago)
- Undecided: 7% (+4 ppt. from 1 year ago)
7. Americans who identify as ideologically moderate

- Would vote for Biden if election were today: 47% (-4 ppt. from 1 year ago)
- Would vote for someone other than Biden if election were today: 46% (+2 ppt. from 1 year ago)
- Undecided: 7% (+1 ppt. from 1 year ago)
5. College graduates

- Would vote for Biden if election were today: 49% (-1 ppt. from 1 year ago)
- Would vote for someone other than Biden if election were today: 47% (+1 ppt. from 1 year ago)
- Undecided: 4% (+1 ppt. from 1 year ago)
6. Americans age 35-44

- Would vote for Biden if election were today: 49% (-1 ppt. from 1 year ago)
- Would vote for someone other than Biden if election were today: 47% (+1 ppt. from 1 year ago)
- Undecided: 4% (unchanged from 1 year ago)
4. African Americans

- Would vote for Biden if election were today: 65% (-2 ppt. from 1 year ago)
- Would vote for someone other than Biden if election were today: 27% (+2 ppt. from 1 year ago)
- Undecided: 8% (unchanged from 1 year ago)
3. Americans who identify as ideologically Liberal
- Would vote for Biden if election were today: 79% (-3 ppt. from 1 year ago)
- Would vote for someone other than Biden if election were today: 20% (+4 ppt. from 1 year ago)
- Undecided: 2% (unchanged from 1 year ago)
2. Americans who voted for Joe Biden in 2020
- Would vote for Biden if election were today: 84% (-2 ppt. from 1 year ago)
- Would vote for someone other than Biden if election were today: 13% (+2 ppt. from 1 year ago)
- Undecided: 4% (+1 ppt. from 1 year ago)
1. Americans who approve of Joe Biden’s job in office
- Would vote for Biden if election were today: 88% (unchanged from 1 year ago)
- Would vote for someone other than Biden if election were today: 11% (+1 ppt. from 1 year ago)
- Undecided: 2% (unchanged from 1 year ago)
| Demographic | Would vote for Joe Biden (%) | Would vote for someone else (%) | Undecided (%) |
|---|---|---|---|
| 2020 Vote: Democrat Joe Biden | 84 | 13 | 4 |
| 2020 Vote: Republican Donald Trump | 3 | 94 | 3 |
| Age: 18-34 | 39 | 54 | 7 |
| Age: 35-44 | 49 | 47 | 4 |
| Age: 45-64 | 42 | 54 | 5 |
| Age: 65+ | 46 | 51 | 4 |
| Age: Under 45 | 43 | 51 | 6 |
| Baby Boomers: 1946-1964 | 45 | 51 | 4 |
| GenXers: 1965-1980 | 42 | 53 | 5 |
| GenZers: 1997-2012 | 37 | 54 | 9 |
| Millennials: 1981-1996 | 45 | 50 | 5 |
| Biden Approval: Approve | 88 | 11 | 2 |
| Biden Approval: Disapprove | 11 | 84 | 5 |
| Educ: < College | 37 | 57 | 6 |
| Educ: College Grad | 49 | 47 | 4 |
| Ethnicity: Afr. Am. | 65 | 27 | 8 |
| Ethnicity: Hispanic | 47 | 46 | 7 |
| Ethnicity: White | 39 | 57 | 4 |
| Ideo: Conservative | 15 | 81 | 3 |
| Ideo: Liberal | 79 | 20 | 2 |
| Ideo: Moderate | 47 | 46 | 7 |
| All registered Voters | 43 | 51 | 5 |
Contact [email protected] for any questions or corrections.