The 2024 presidential election is only months away, and for millions of Americans, the economy is top of mind. According to a June 2024 poll conducted by public opinion research company Morning Consult, 77% of voters consider the economy to be a “very important” factor in deciding who to support on Election Day. Of course, this trend is nothing new, as the U.S. economy has been a leading issue for American voters in every election going back at least half a century.
There are a number of key, commonly cited measures used to gauge economic prosperity. These include, but are not limited to, inflation, the unemployment rate, the national debt, the poverty rate, and income inequality. But perhaps the single most comprehensive economic measure is gross domestic product, or the total monetary value of all goods and services produced in the United States.
In times of economic expansion — reflected in rising GDP — consumer spending, corporate revenue, worker wages, and employment typically rise. Declines in GDP, meanwhile, indicate an economic contraction, which are often marked by rising unemployment, reduced output, and falling wages. Changes in GDP are closely watched by lawmakers, investors, and employers — and felt in the real-world by millions of everyday Americans. (Here is a look at the most important issues to voters in the 2024 election.)
American fiscal policy, which includes federal tax rates and spending priorities, can have a meaningful bearing on the trajectory of the economy — and perhaps no individual has greater control over fiscal policy than the U.S. president. While GDP is also subject to a number of macroeconomic factors that are beyond the control of any individual or entity — right or wrong — American presidents are often credited, or blamed, for the state of the economy.
Using data from the Bureau of Economic Analysis, 24/7 Wall St. identified the presidents who grew the U.S. economy the most. We ranked every president since 1930 on the average annual change in GDP during their time in office. Annual growth rates were calculated using GDP for each president’s first full-year in office to the year of their final day. To account for inflation, we used real, annual GDP figures chained to 2017 dollars.
Across the administrations of the 16 presidents who have served since 1930, average annual GDP growth rates range from -7.3% to a +12.2%. Of the five highest ranking presidents on this list, four were members of the Democratic Party and one was a Republican. Meanwhile, three of the five lowest ranking presidents served as Republicans and two as Democrats.
Ronald Reagan is the highest ranking Republican on this list. Managing an economic recession early in his administration, Reagan cut taxes and reduced government spending to stimulate growth. Franklin D. Roosevelt, the highest ranking Democratic president, served during the Great Depression and World War II. In stark contrast to Reagan, economic growth under FDR was driven largely by a surge in government spending to fund New Deal programs and the American war effort. (These are the U.S. presidents who added the most to the national debt.)
Why It Matters
Source: Darren415 / iStock via Getty Images
The health of the U.S. economy is subject to a wide-range of factors outside of any individual’s control. Still, the American president’s decisions and priorities — particularly in regard to fiscal policy — can have meaningful economic implications. Right or wrong, voters often link the state of the economy with the policies of the current administration. While the two major parties rarely agree on which policy prescriptions are necessary to foster economic growth, both the Democratic and Republican parties have sent candidates to the White House who have led through times of rapid economic expansion.
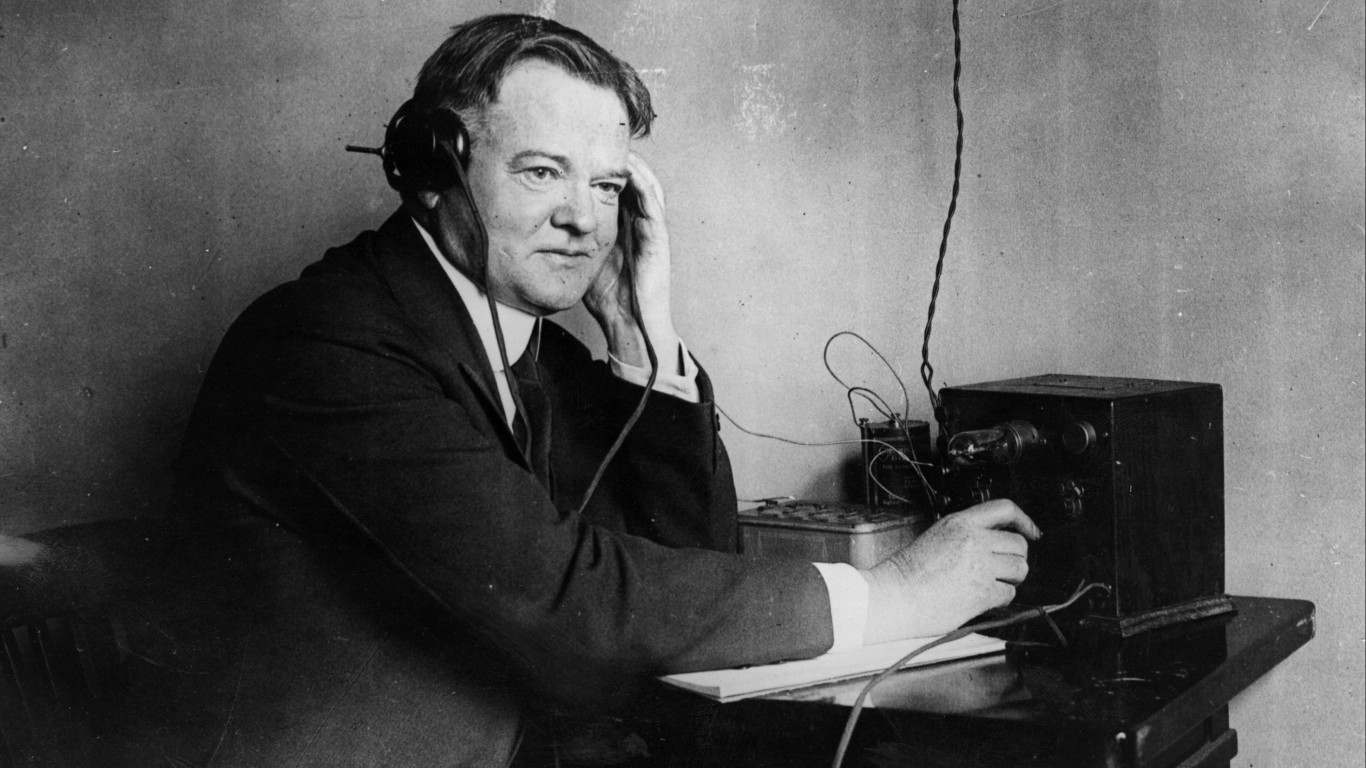
16. Herbert Hoover
Source: Topical Press Agency / Hulton Archive via Getty Images
- Avg. annual change in GDP during presidency: -7.3%
- Total change in GDP, 1930-1933: -19.5% (-$213.0 billion)
- GDP in 1933: $877.0 billion
- GDP in 1930: $1.1 trillion
- Party affiliation: Republican
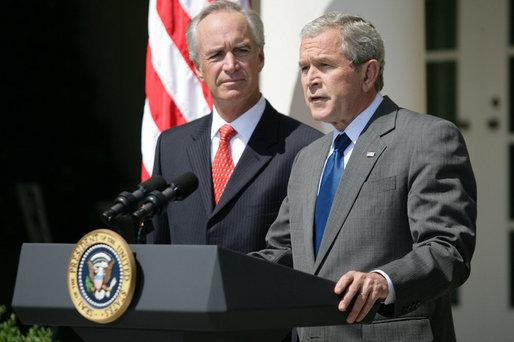
15. George W. Bush
Source: Public Domain / Wikimedia Commons
- Avg. annual change in GDP during presidency: +1.8%
- Total change in GDP, 2002-2009: +13.0% (+$1.9 trillion)
- GDP in 2009: $16.3 trillion
- GDP in 2002: $14.5 trillion
- Party affiliation: Republican
14. George H.W. Bush
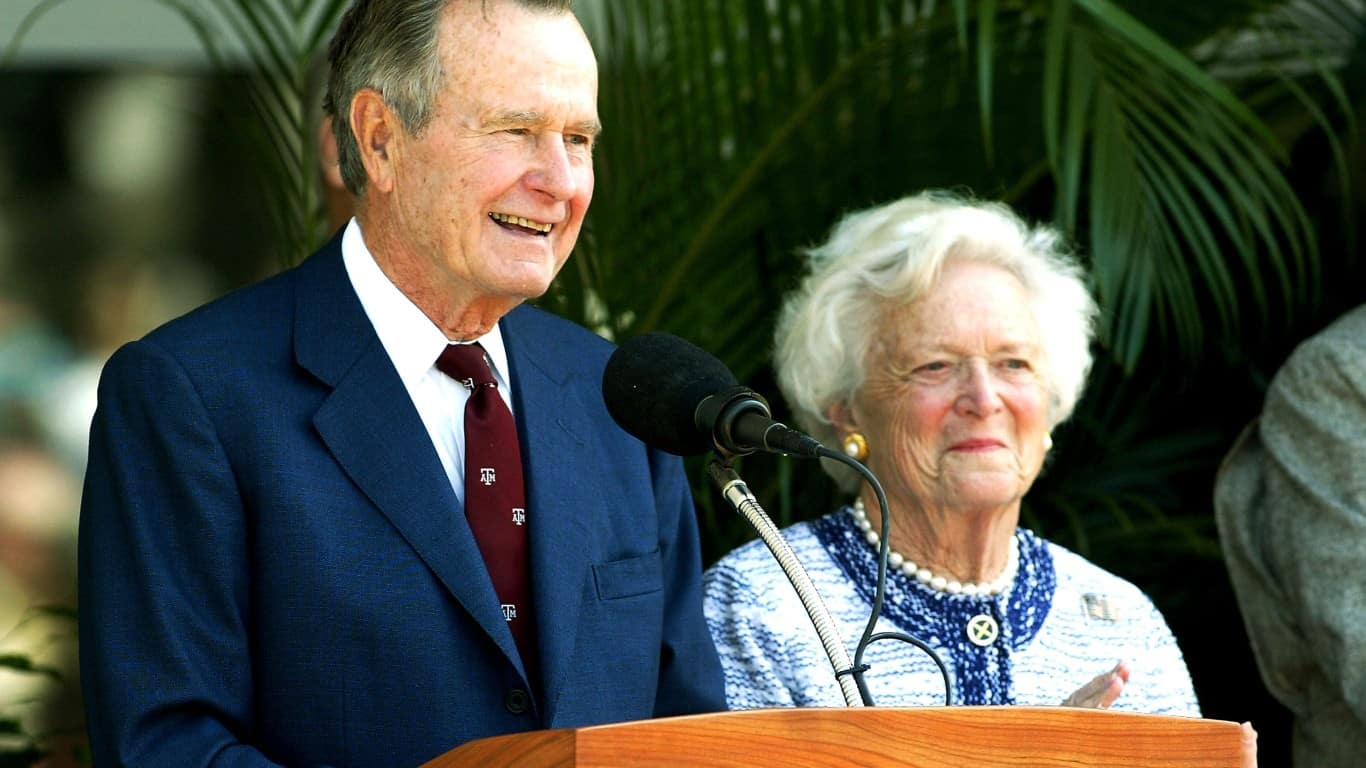
Source: Joe Mitchell / Getty Images News via Getty Images
- Avg. annual change in GDP during presidency: +2.0%
- Total change in GDP, 1990-1993: +6.3% (+$629.0 billion)
- GDP in 1993: $10.7 trillion
- GDP in 1990: $10.1 trillion
- Party affiliation: Republican
13. Harry S. Truman
 by pingnews.com")
- Avg. annual change in GDP during presidency: +2.0%
- Total change in GDP, 1946-1953: +31.0% (+$684.0 billion)
- GDP in 1953: $2.9 trillion
- GDP in 1946: $2.2 trillion
- Party affiliation: Democratic
12. Joseph R. Biden Jr.
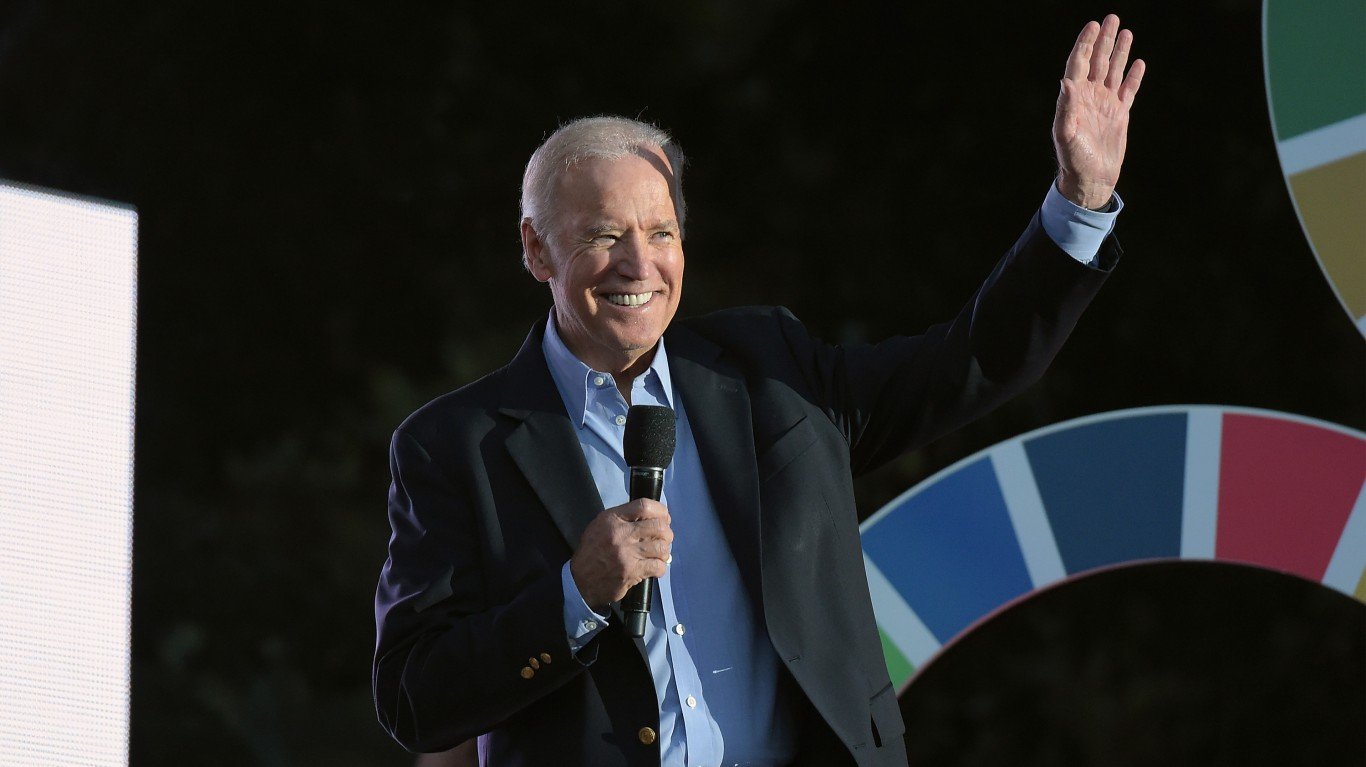
Source: Photo by Theo Wargo / Getty Images for Global Citizen
- Avg. annual change in GDP during presidency: +2.2%
- Total change in GDP, 2022-2023: +2.5% (+$555.0 billion)
- GDP in 2023: $22.4 trillion
- GDP in 2022: $21.8 trillion
- Party affiliation: Democratic
11. Donald J. Trump

Source: Pool / Getty Images News via Getty Images
- Avg. annual change in GDP during presidency: +2.3%
- Total change in GDP, 2018-2021: +6.0% (+$1.2 trillion)
- GDP in 2021: $21.4 trillion
- GDP in 2018: $20.2 trillion
- Party affiliation: Republican
10. Barack Obama
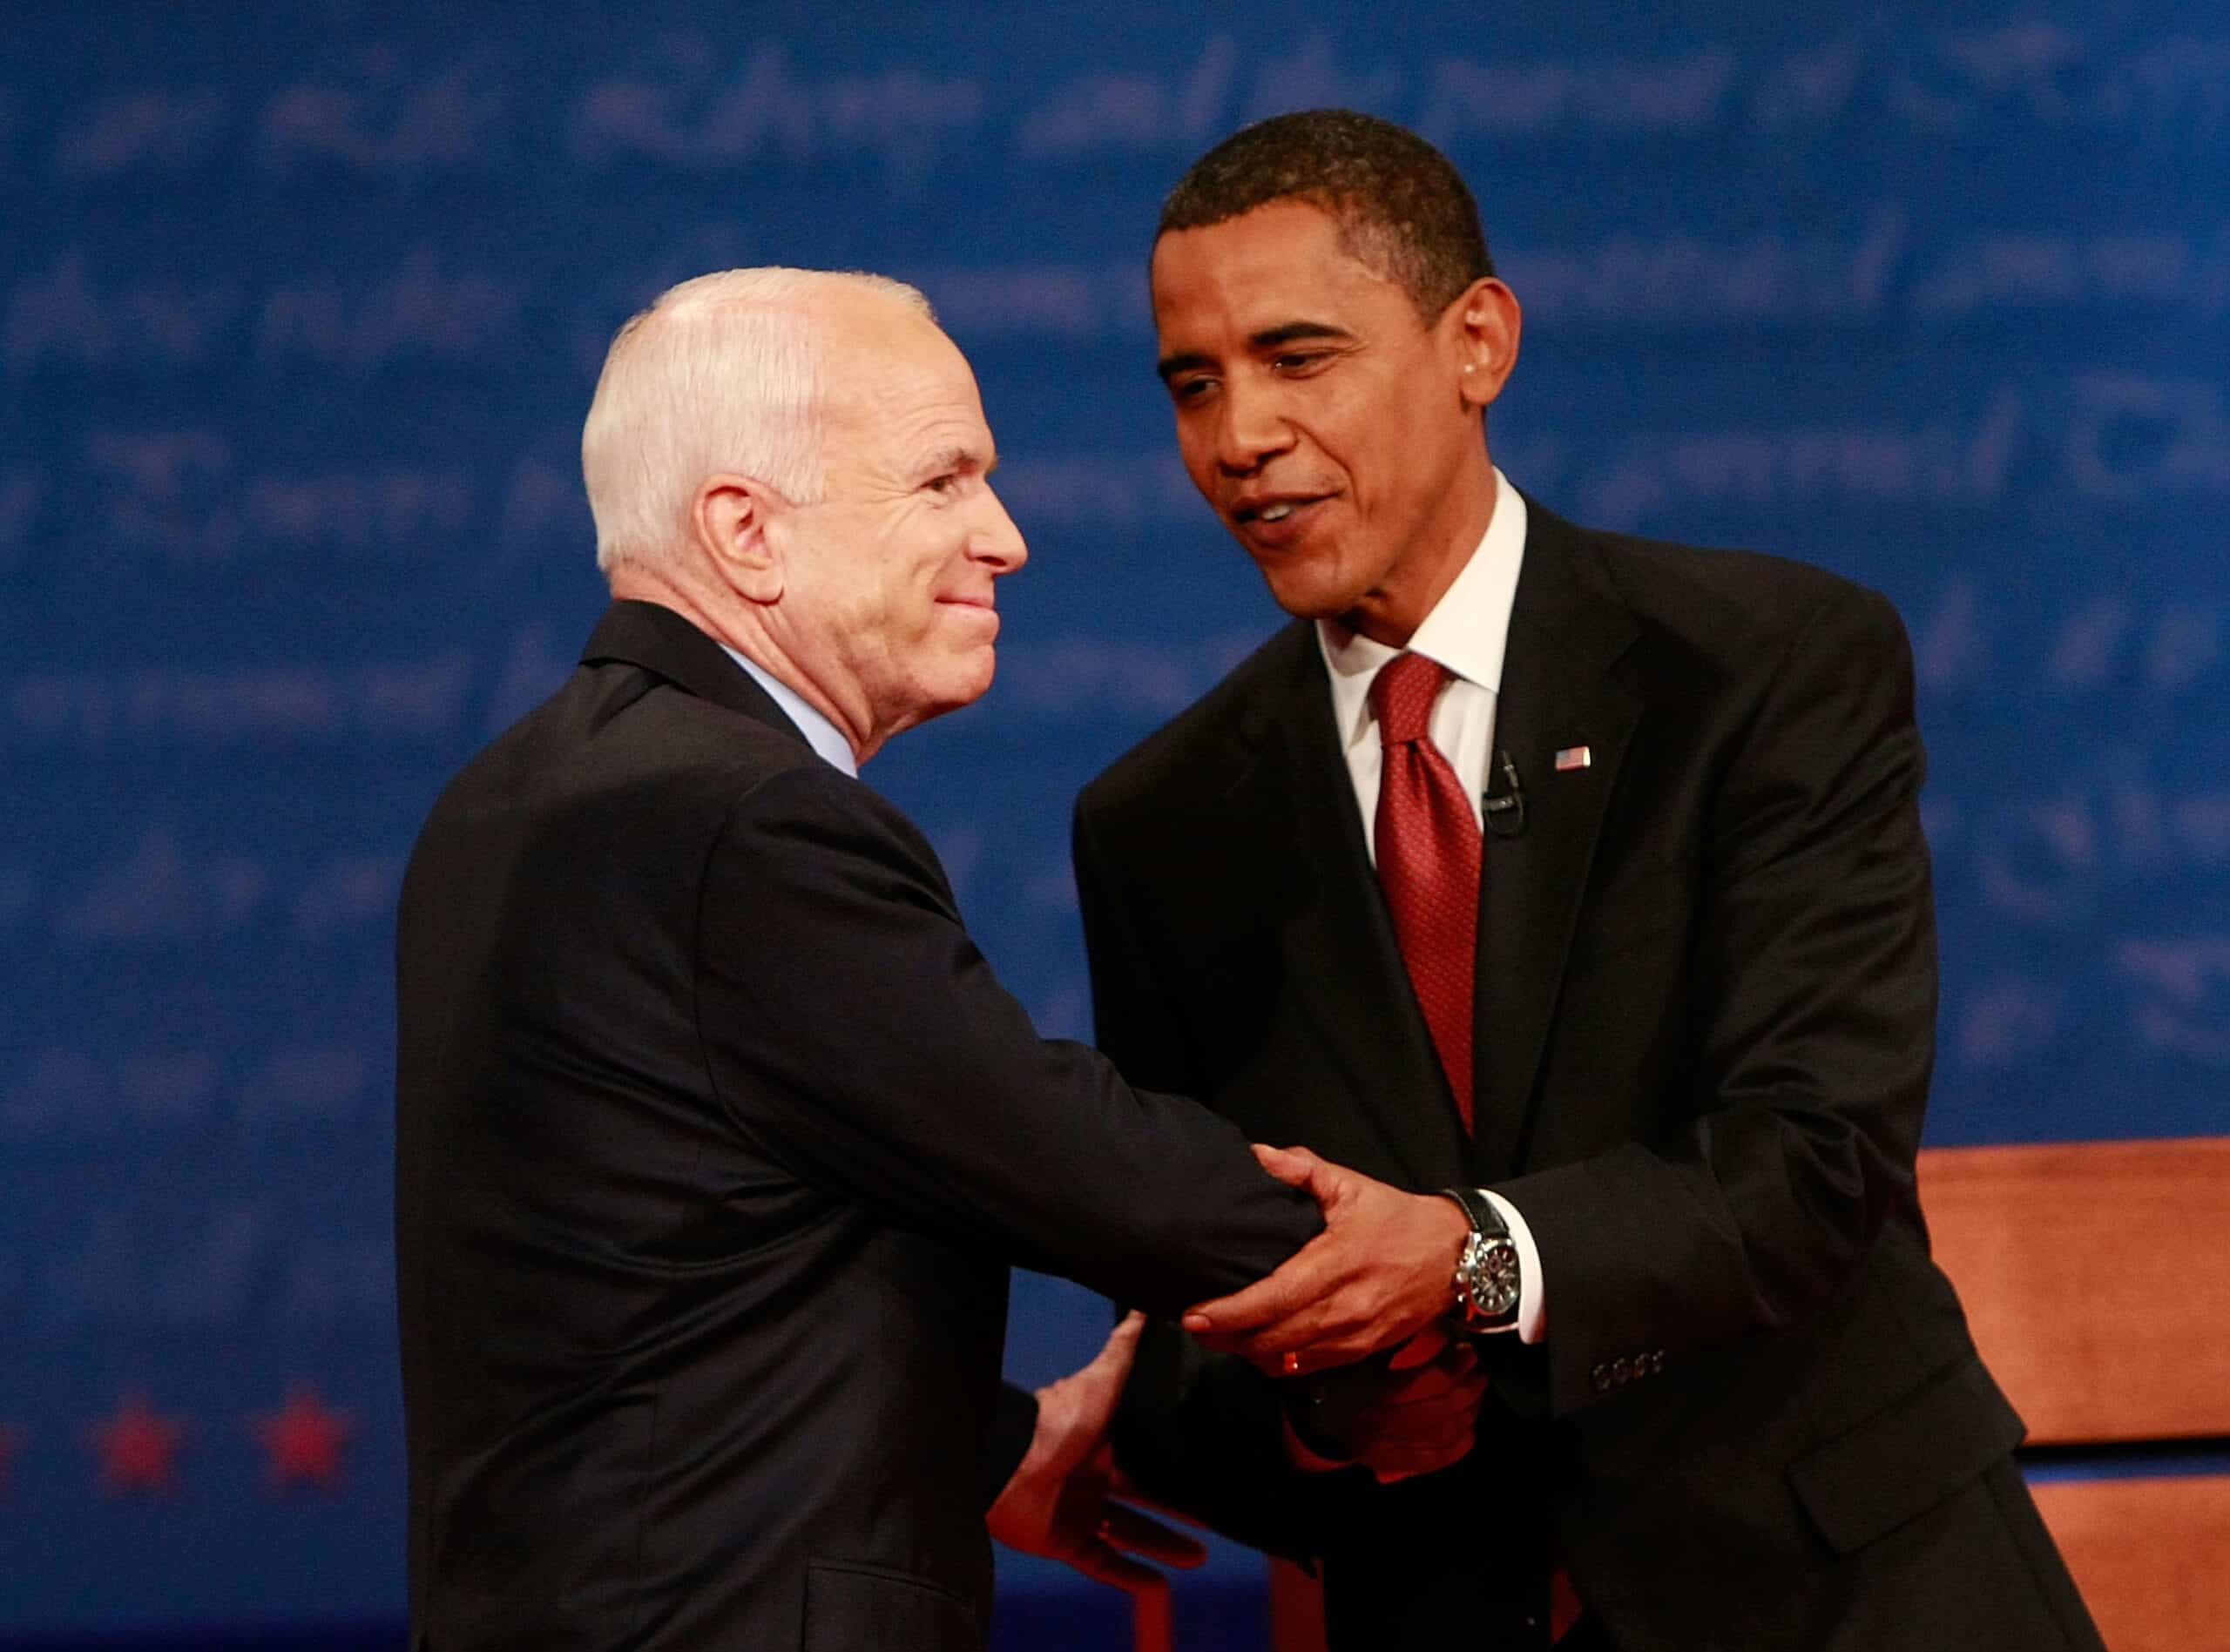
Source: Win McNamee / Getty Images News via Getty Images
- Avg. annual change in GDP during presidency: +2.3%
- Total change in GDP, 2010-2017: +16.8% (+$2.8 trillion)
- GDP in 2017: $19.6 trillion
- GDP in 2010: $16.8 trillion
- Party affiliation: Democratic
9. Jimmy Carter
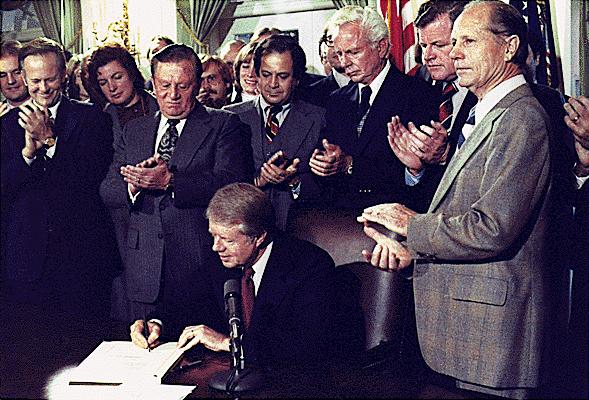
Source: Public Domain / Wikimedia Commons
- Avg. annual change in GDP during presidency: +2.7%
- Total change in GDP, 1978-1981: +5.5% (+$389.0 billion)
- GDP in 1981: $7.4 trillion
- GDP in 1978: $7.1 trillion
- Party affiliation: Democratic
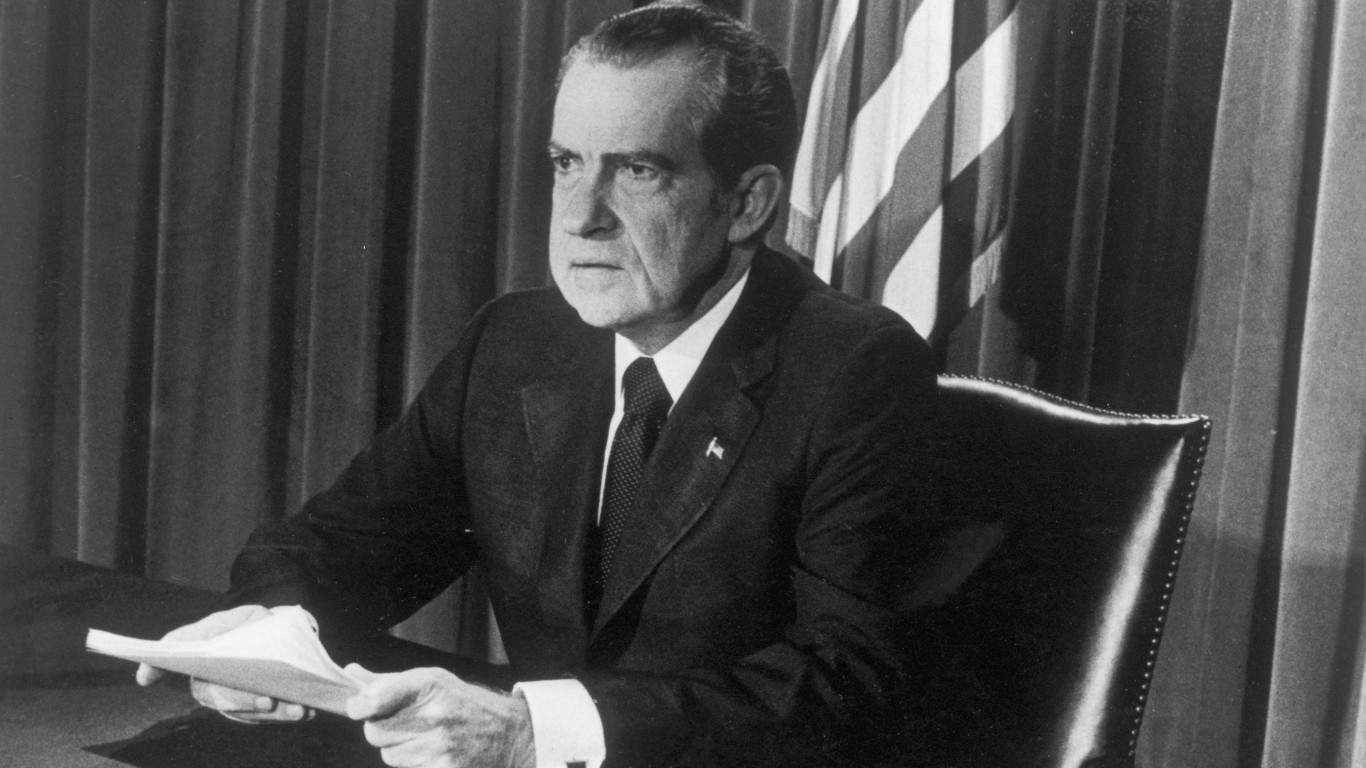
8. Richard M. Nixon
Source: Hulton Archive / Archive Photos via Getty Images
- Avg. annual change in GDP during presidency: +2.8%
- Total change in GDP, 1970-1974: +14.2% (+$757.0 billion)
- GDP in 1974: $6.1 trillion
- GDP in 1970: $5.3 trillion
- Party affiliation: Republican
7. Dwight D. Eisenhower

Source: Public Domain / Wikimedia Commons
- Avg. annual change in GDP during presidency: +2.8%
- Total change in GDP, 1954-1961: +24.7% (+$712.0 billion)
- GDP in 1961: $3.6 trillion
- GDP in 1954: $2.9 trillion
- Party affiliation: Republican
6. Gerald R. Ford
 by pingnews.com")
- Avg. annual change in GDP during presidency: +3.3%
- Total change in GDP, 1975-1977: +10.3% (+$622.0 billion)
- GDP in 1977: $6.7 trillion
- GDP in 1975: $6.1 trillion
- Party affiliation: Republican
5. Ronald Reagan
 by pingnews.com")
- Avg. annual change in GDP during presidency: +3.6%
- Total change in GDP, 1982-1989: +35.1% (+$2.6 trillion)
- GDP in 1989: $9.9 trillion
- GDP in 1982: $7.3 trillion
- Party affiliation: Republican
4. William J. Clinton

Source: Alex Wong / Hulton Archive via Getty Images
- Avg. annual change in GDP during presidency: +3.7%
- Total change in GDP, 1994-2001: +28.0% (+$3.1 trillion)
- GDP in 2001: $14.2 trillion
- GDP in 1994: $11.1 trillion
- Party affiliation: Democratic
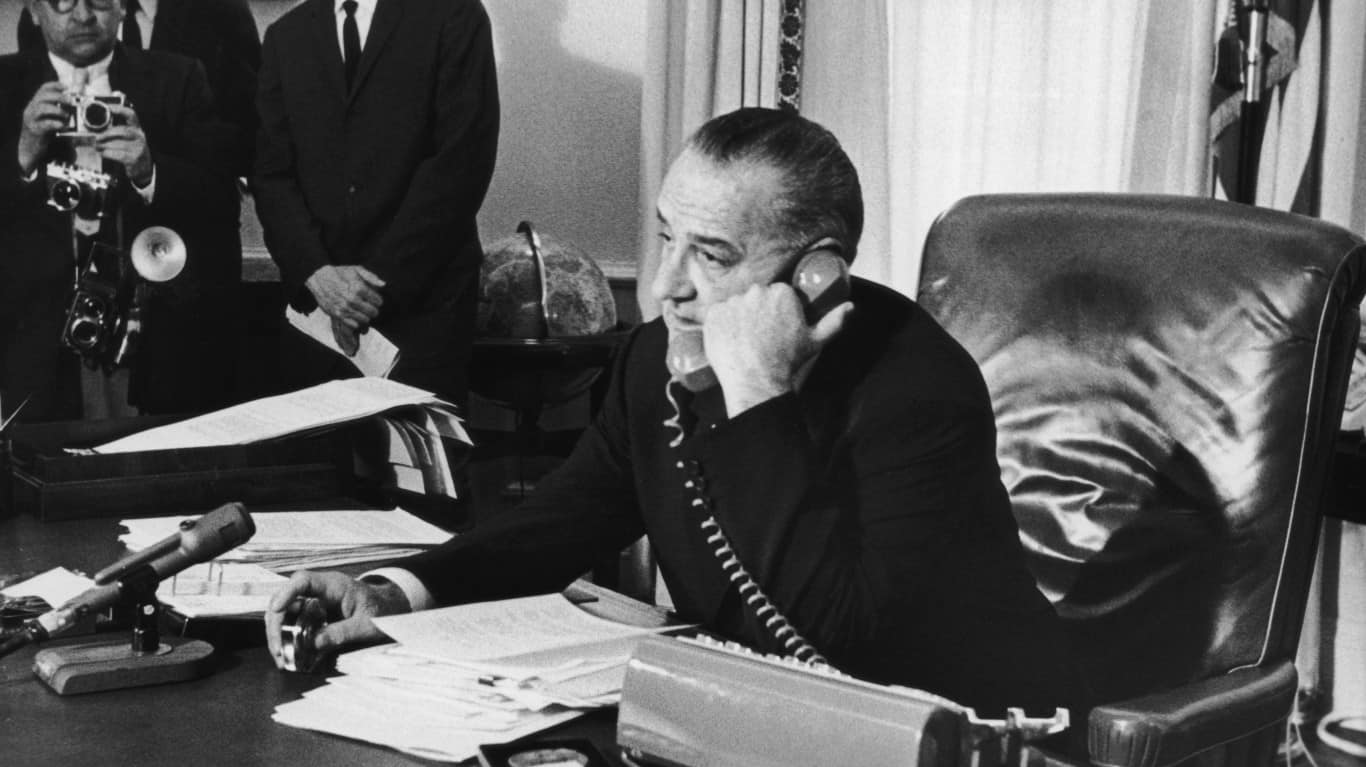
3. Lyndon B. Johnson
Source: Gene Forte / Hulton Archive via Getty Images
- Avg. annual change in GDP during presidency: +4.9%
- Total change in GDP, 1964-1969: +26.2% (+$1.1 trillion)
- GDP in 1969: $5.3 trillion
- GDP in 1964: $4.2 trillion
- Party affiliation: Democratic
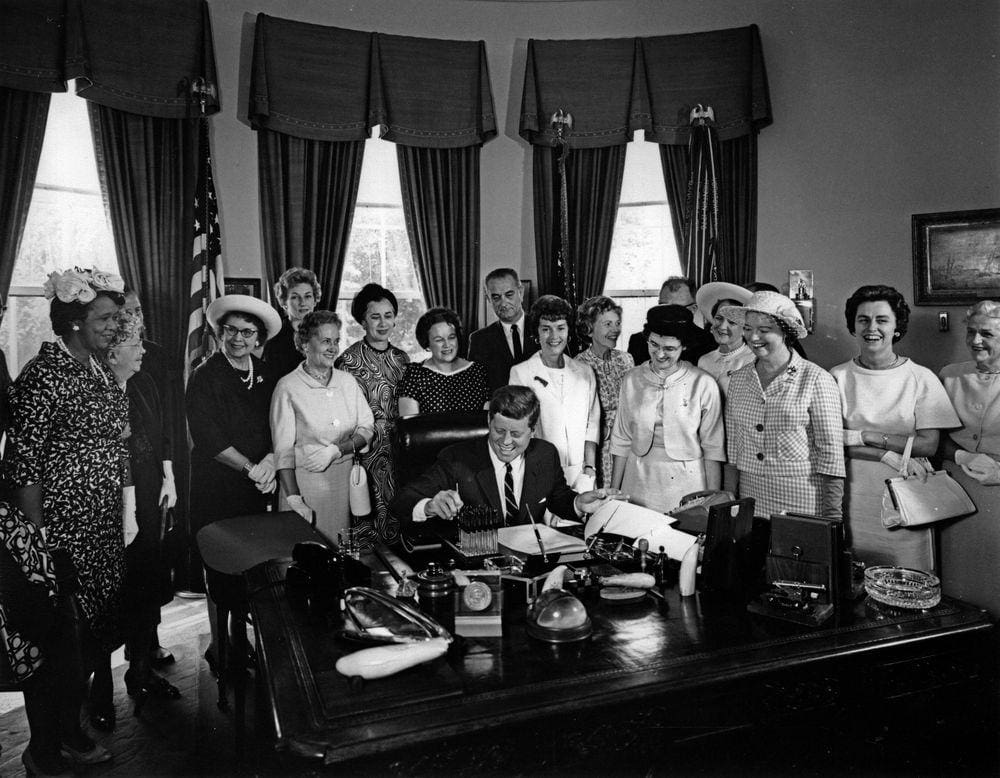
2. John F. Kennedy
Source: Public Domain / Wikimedia Commons
- Avg. annual change in GDP during presidency: +5.2%
- Total change in GDP, 1962-1963: +4.4% (+$166.0 billion)
- GDP in 1963: $4.0 trillion
- GDP in 1962: $3.8 trillion
- Party affiliation: Democratic
1. Franklin D. Roosevelt
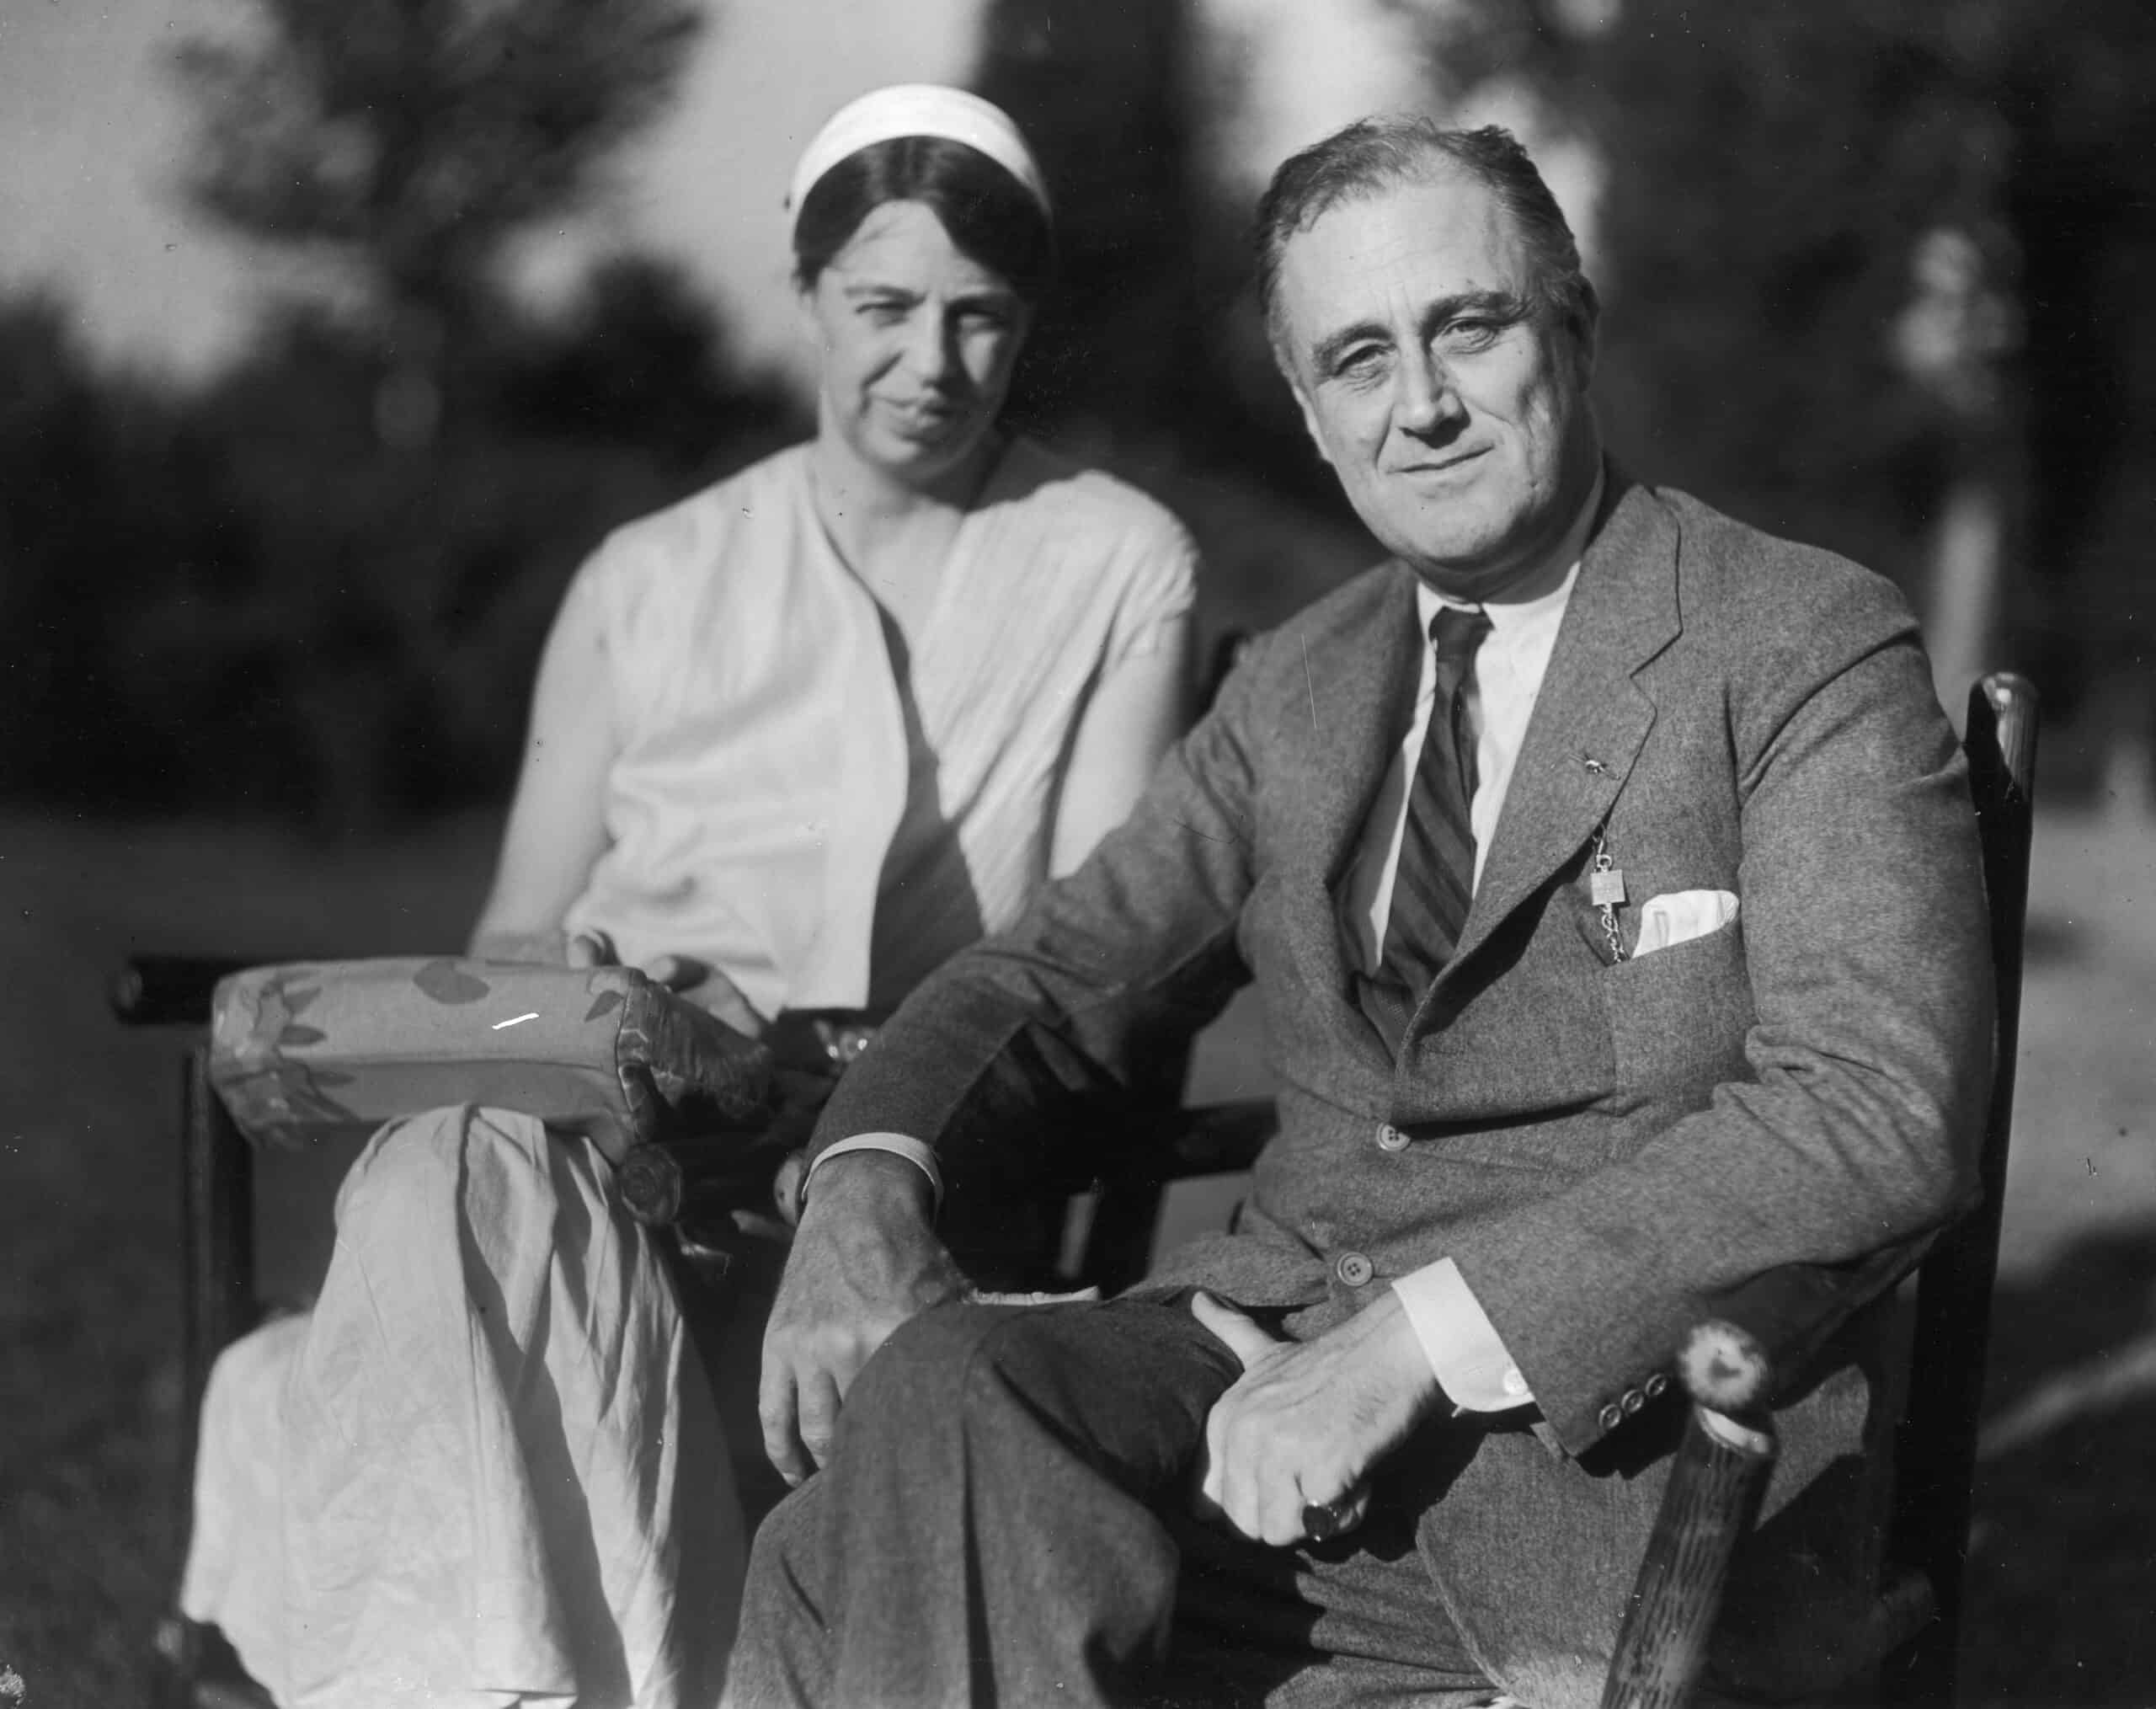
Source: Fotosearch / Archive Photos via Getty Images
- Avg. annual change in GDP during presidency: +9.3%
- Total change in GDP, 1934-1945: +157.2% (+$1.5 trillion)
- GDP in 1945: $2.5 trillion
- GDP in 1934: $972.0 billion
- Party affiliation: Democratic
Take This Retirement Quiz To Get Matched With An Advisor Now (Sponsored)
Are you ready for retirement? Planning for retirement can be overwhelming, that’s why it could be a good idea to speak to a fiduciary financial advisor about your goals today.
Start by taking this retirement quiz right here from SmartAsset that will match you with up to 3 financial advisors that serve your area and beyond in 5 minutes. Smart Asset is now matching over 50,000 people a month.
Click here now to get started.
Thank you for reading! Have some feedback for us?
Contact the 24/7 Wall St. editorial team.
Editors' Picks