
Several factors determine the attractiveness of a city, and when these factors turn negative, cities often lose residents. Some subjective factors include weather, community, and vibrancy. Other factors are more objective. Economic opportunity in the form of jobs or a robust economic climate is one such factor. Another is affordability, often measured by the cost of living and the cost of housing.
The U.S. population grew by 0.49% from July 2022 to July 2023, with natural change (births minus deaths) contributing 0.15% to growth and immigration contributing 0.34%. In cities across the nation, the population change during that time ranged from a decline of 1.2% to a growth of 4.7%. If we look specifically at how net migration (people coming in less people leaving) contributed to population change in U.S. cities, some gained over 6% from migration, while other lost nearly 1.4% of residents in the past year.
To determine the cities Americans are abandoning, 24/7 Wall St. reviewed data from the U.S. Census Bureau’s Population and Housing Unit Estimates program. Metropolitan statistical areas were ranked based on the percentage change in population due to net migration alone from July 1, 2022 to July 1, 2023, and we included the 36 cities where net migration contributed at least 0.4% to population decline (even if the overall population grew). Data on median home value came from the Census Bureau’s 2022 American Community and figures are one-year estimates. Unemployment rates for March 2024 came from the U.S. Bureau of Labor Statistics and are not seasonally adjusted.
The list includes several large metros, such as New York, Los Angeles, and Chicago, but also considerably smaller ones, such as Eagle Pass, Texas, and Minot, North Dakota. (Also see: States That Will Grow the Most by 2040.)
The West region has by far the most cities on the list, at 16, including 12 in California alone. In 15 of the cities on the list, including 10 in California, the median home value is higher than the national median of $320,900 in 2022.
The next regions with the most cities on the list are the Midwest, with nine, and the South, with eight. In many of these cities, the March 2024 unemployment rate is higher than the national rate of 3.8%. In all, this is true in 28 of the 36 cities on the list, including four cities in which the unemployment rate is in the double digits. In some cities, both the unemployment rate and the home value are higher than the national averages.
Though all cities on the list lost population due to net migration also in the longer term, since 2020, the trend is not necessarily worsening in all cities. For example, while San Francisco lost 4.5% of its population since April 2020, the trend seems to have slowed over the past year, as it lost 0.5% of its population. On the other hand, in Lawton, Oklahoma, the trend seems to be worsening.
Why Are We Covering This

Source: Mario Tama / Getty Images News via Getty Images
36. Chicago-Naperville-Elgin, IL-IN

Source: Gian Lorenzo Ferretti Photography / E+ via Getty Images
- Population change due to migration, 2022-2023: -0.40% (-36,706)
- Migration breakdown, 2022-2023: international: +34,604; domestic: -71,310
- Total population change, 2022-2023: -16,602 or -0.18% (#66 slowest growth)
- Population change due to migration, 2020-2023: -2.5% (#19 slowest growth)
- Unemployment rate, March 2024: 4.9%
- Median home value, 2022: $301,300
- Total population, 2023: 9,262,825
35. Memphis, TN-MS-AR

Source: Sean Pavone / iStock via Getty Images
- Population change due to migration, 2022-2023: -0.40% (-5,398)
- Migration breakdown, 2022-2023: international: +2,590; domestic: -7,988
- Total population change, 2022-2023: -2,993 or -0.22% (#58 slowest growth)
- Population change due to migration, 2020-2023: -1.1% (#57 slowest growth)
- Unemployment rate, March 2024: 3.7%
- Median home value, 2022: $244,100
- Total population, 2023: 1,335,674
34. Champaign-Urbana, IL

Source: leightrail / iStock Editorial via Getty Images
- Population change due to migration, 2022-2023: -0.42% (-1,000)
- Migration breakdown, 2022-2023: international: +2,178; domestic: -3,178
- Total population change, 2022-2023: -492 or -0.21% (#61 slowest growth)
- Population change due to migration, 2020-2023: -0.9% (#74 slowest growth)
- Unemployment rate, March 2024: 4.3%
- Median home value, 2022: $193,700
- Total population, 2023: 235,608
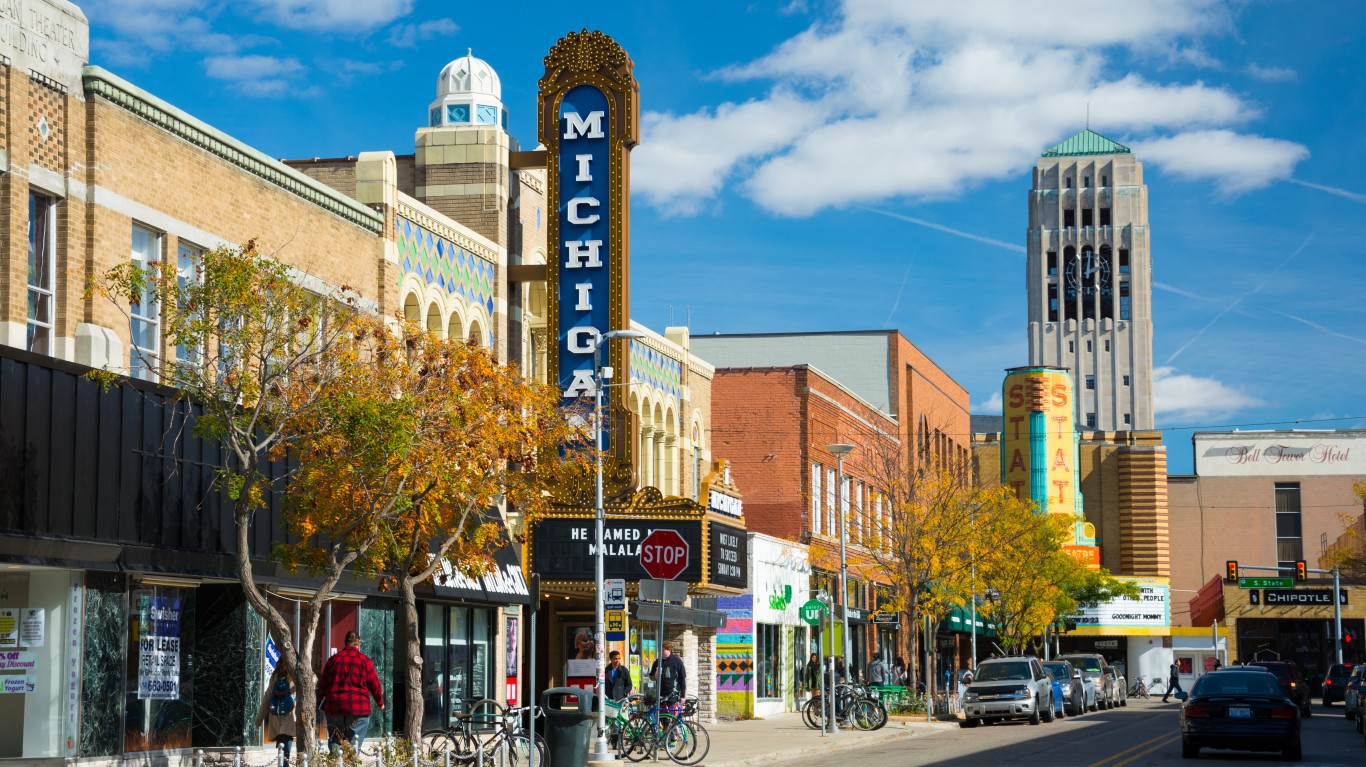
33. Ann Arbor, MI
Source: Davel5957 / iStock Unreleased via Getty Images
- Population change due to migration, 2022-2023: -0.43% (-1,568)
- Migration breakdown, 2022-2023: international: +2,074; domestic: -3,642
- Total population change, 2022-2023: -968 or -0.26% (#50 slowest growth)
- Population change due to migration, 2020-2023: -2.2% (#24 slowest growth)
- Unemployment rate, March 2024: 3.1%
- Median home value, 2022: $364,600
- Total population, 2023: 365,536
32. San Jose-Sunnyvale-Santa Clara, CA

Source: Bill_Dally / iStock via Getty Images
- Population change due to migration, 2022-2023: -0.44% (-8,529)
- Migration breakdown, 2022-2023: international: +20,422; domestic: -28,951
- Total population change, 2022-2023: -211 or -0.01% (#104 slowest growth)
- Population change due to migration, 2020-2023: -3.9% (#7 slowest growth)
- Unemployment rate, March 2024: 4.2%
- Median home value, 2022: $1,422,600
- Total population, 2023: 1,945,767
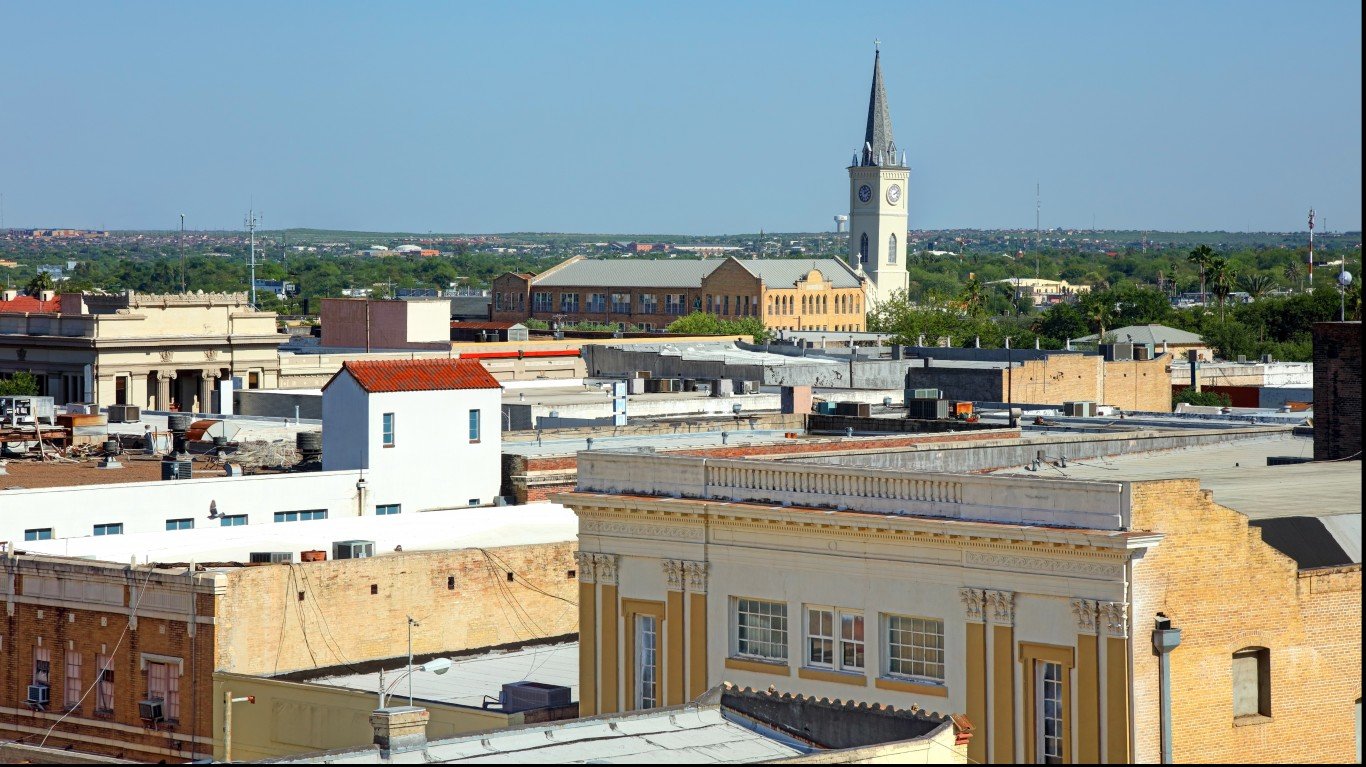
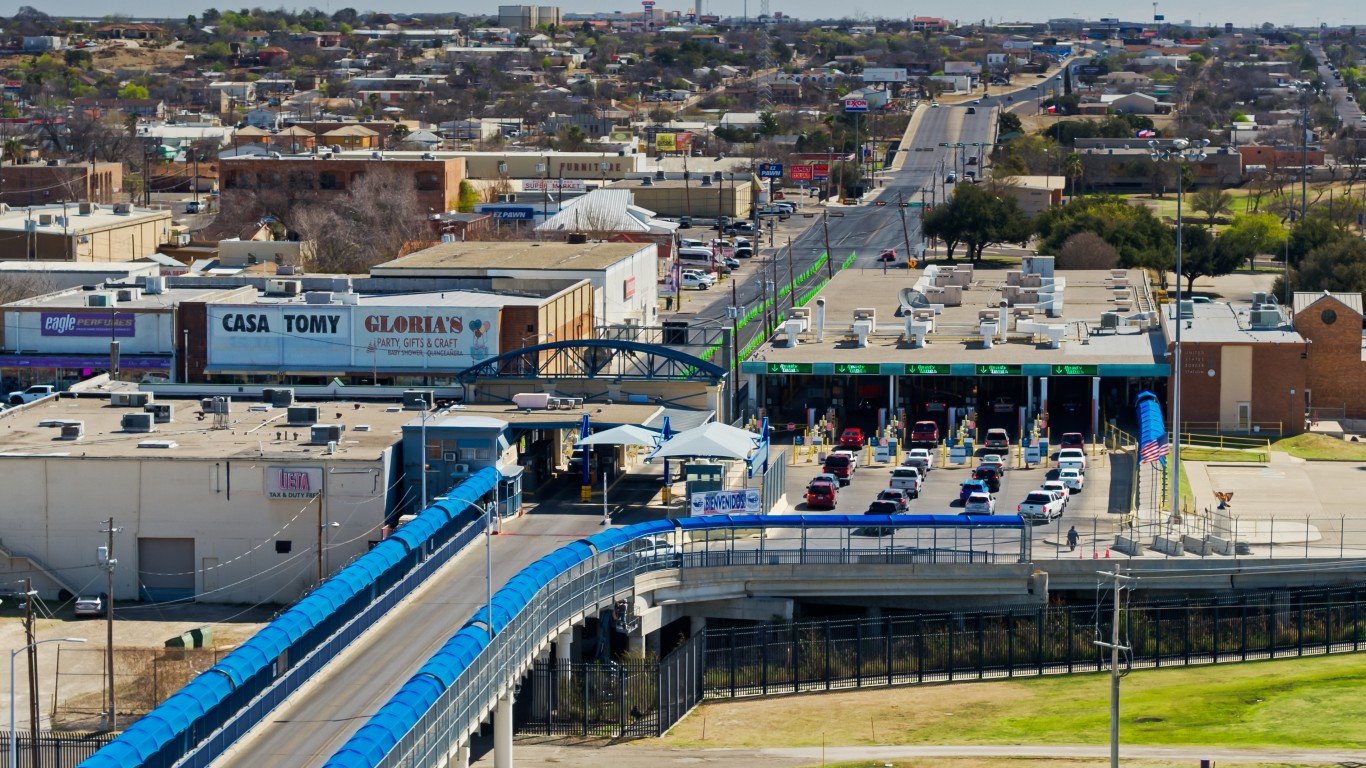
31. Laredo, TX
Source: DenisTangneyJr / iStock via Getty Images
- Population change due to migration, 2022-2023: -0.47% (-1,259)
- Migration breakdown, 2022-2023: international: +795; domestic: -2,054
- Total population change, 2022-2023: +1,529 or +0.57% (#153 fastest growth)
- Population change due to migration, 2020-2023: -2.2% (#25 slowest growth)
- Unemployment rate, March 2024: 4.3%
- Median home value, 2022: $171,200
- Total population, 2023: 269,148
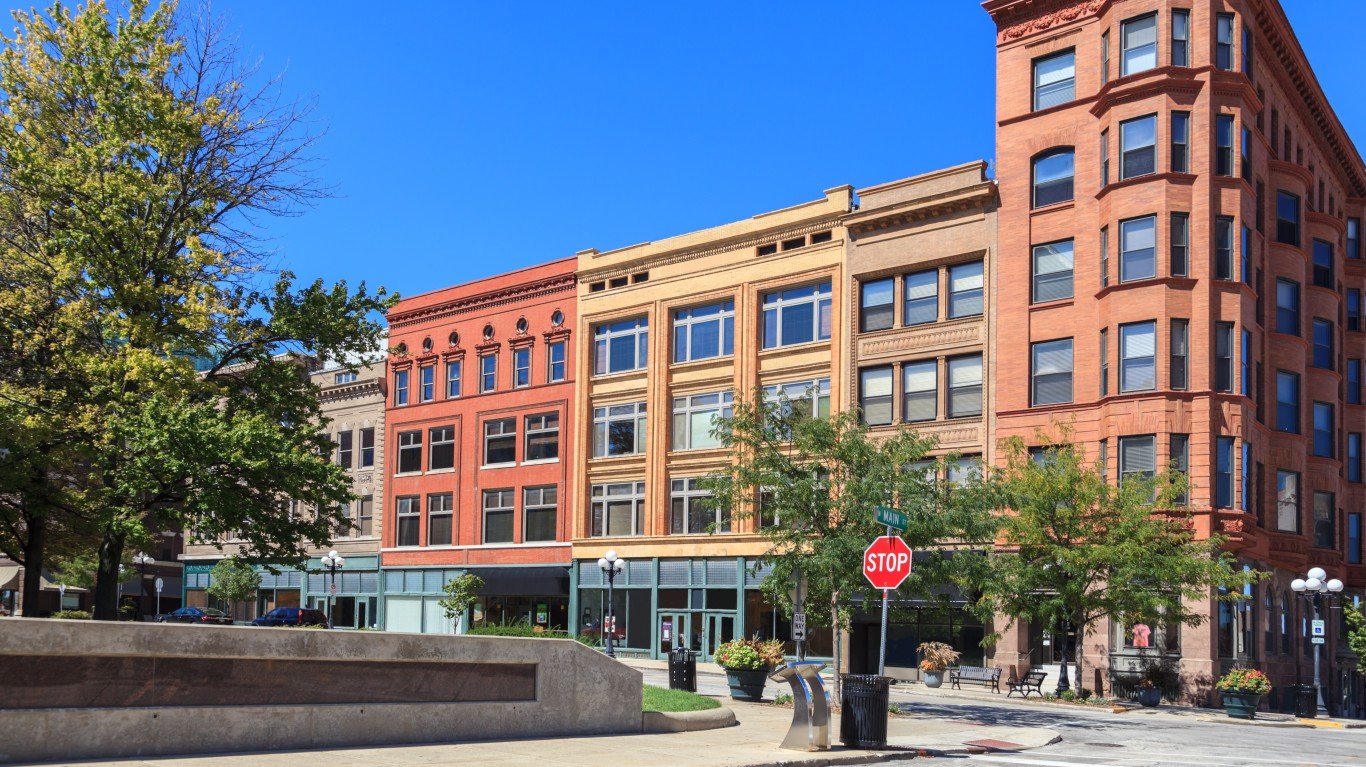
30. Bloomington, IL
Source: ghornephoto / iStock via Getty Images
- Population change due to migration, 2022-2023: -0.48% (-821)
- Migration breakdown, 2022-2023: international: +605; domestic: -1,426
- Total population change, 2022-2023: -477 or -0.28% (#48 slowest growth)
- Population change due to migration, 2020-2023: -0.9% (#73 slowest growth)
- Unemployment rate, March 2024: 4.2%
- Median home value, 2022: $190,900
- Total population, 2023: 170,441
29. Yakima, WA

- Population change due to migration, 2022-2023: -0.49% (-1,267)
- Migration breakdown, 2022-2023: international: +316; domestic: -1,583
- Total population change, 2022-2023: -376 or -0.15% (#73 slowest growth)
- Population change due to migration, 2020-2023: -1.2% (#46 slowest growth)
- Unemployment rate, March 2024: 8.1%
- Median home value, 2022: $300,000
- Total population, 2023: 256,643
28. Shreveport-Bossier City, LA

Source: SeanPavonePhoto / iStock Editorial via Getty Images
- Population change due to migration, 2022-2023: -0.50% (-1,908)
- Migration breakdown, 2022-2023: international: +441; domestic: -2,349
- Total population change, 2022-2023: -1,648 or -0.43% (#30 slowest growth)
- Population change due to migration, 2020-2023: -2.4% (#21 slowest growth)
- Unemployment rate, March 2024: 4.7%
- Median home value, 2022: $184,000
- Total population, 2023: 383,295
27. El Centro, CA

- Population change due to migration, 2022-2023: -0.51% (-917)
- Migration breakdown, 2022-2023: international: +493; domestic: -1,410
- Total population change, 2022-2023: +117 or +0.07% (#118 slowest growth)
- Population change due to migration, 2020-2023: -1.9% (#31 slowest growth)
- Unemployment rate, March 2024: 16.1%
- Median home value, 2022: $293,200
- Total population, 2023: 179,057
26. San Francisco-Oakland-Fremont, CA

Source: Sundry Photography / iStock via Getty Images
- Population change due to migration, 2022-2023: -0.52% (-23,654)
- Migration breakdown, 2022-2023: international: +30,506; domestic: -54,160
- Total population change, 2022-2023: -11,174 or -0.24% (#56 slowest growth)
- Population change due to migration, 2020-2023: -4.5% (#3 slowest growth)
- Unemployment rate, March 2024: 4.2% (San Francisco-Oakland-Hayward)
- Median home value, 2022: $1,135,500 (San Francisco-Oakland-Berkeley)
- Total population, 2023: 4,566,961
25. Salt Lake City-Murray, UT

Source: Sean Pavone / iStock via Getty Images
- Population change due to migration, 2022-2023: -0.52% (-6,599)
- Migration breakdown, 2022-2023: international: +6,007; domestic: -12,606
- Total population change, 2022-2023: +1,340 or +0.11% (#127 slowest growth)
- Population change due to migration, 2020-2023: -1.2% (#47 slowest growth)
- Unemployment rate, March 2024: 2.9% (Salt Lake City)
- Median home value, 2022: $528,100 (Salt Lake City)
- Total population, 2023: 1,267,864
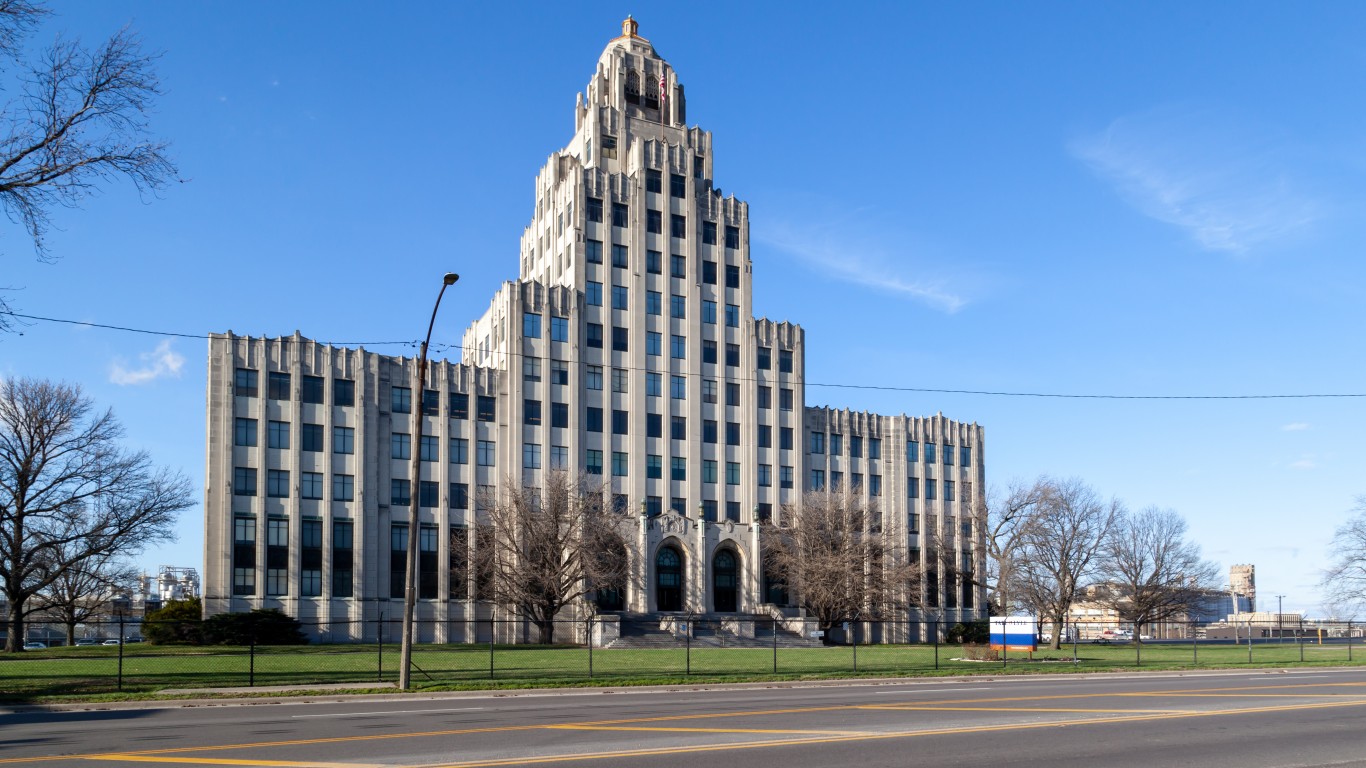
24. Decatur, IL
Source: JHVEPhoto / iStock Editorial via Getty Images
- Population change due to migration, 2022-2023: -0.54% (-545)
- Migration breakdown, 2022-2023: international: +170; domestic: -715
- Total population change, 2022-2023: -742 or -0.73% (#7 slowest growth)
- Population change due to migration, 2020-2023: -2.6% (#18 slowest growth)
- Unemployment rate, March 2024: 6.2%
- Median home value, 2022: $108,900
- Total population, 2023: 100,591
23. Eagle Pass, TX
Source: halbergman / iStock via Getty Images
- Population change due to migration, 2022-2023: -0.56% (-322)
- Migration breakdown, 2022-2023: international: +120; domestic: -442
- Total population change, 2022-2023: +134 or +0.23% (#158 slowest growth)
- Population change due to migration, 2020-2023: -2.1% (#26 slowest growth)
- Unemployment rate, March 2024: N/A
- Median home value, 2022: N/A
- Total population, 2023: 57,762
22. Alexandria, LA

Source: DenisTangneyJr / iStock via Getty Images
- Population change due to migration, 2022-2023: -0.58% (-864)
- Migration breakdown, 2022-2023: international: +91; domestic: -955
- Total population change, 2022-2023: -897 or -0.60% (#14 slowest growth)
- Population change due to migration, 2020-2023: -2.2% (#23 slowest growth)
- Unemployment rate, March 2024: 4.3%
- Median home value, 2022: $174,300
- Total population, 2023: 148,171
21. San Diego-Chula Vista-Carlsbad, CA

Source: SeanPavonePhoto / iStock via Getty Images
- Population change due to migration, 2022-2023: -0.61% (-19,978)
- Migration breakdown, 2022-2023: international: +10,767; domestic: -30,745
- Total population change, 2022-2023: -7,203 or -0.22% (#59 slowest growth)
- Population change due to migration, 2020-2023: -2.0% (#28 slowest growth)
- Unemployment rate, March 2024: 4.4% (San Diego-Carlsbad)
- Median home value, 2022: $846,600
- Total population, 2023: 3,269,973
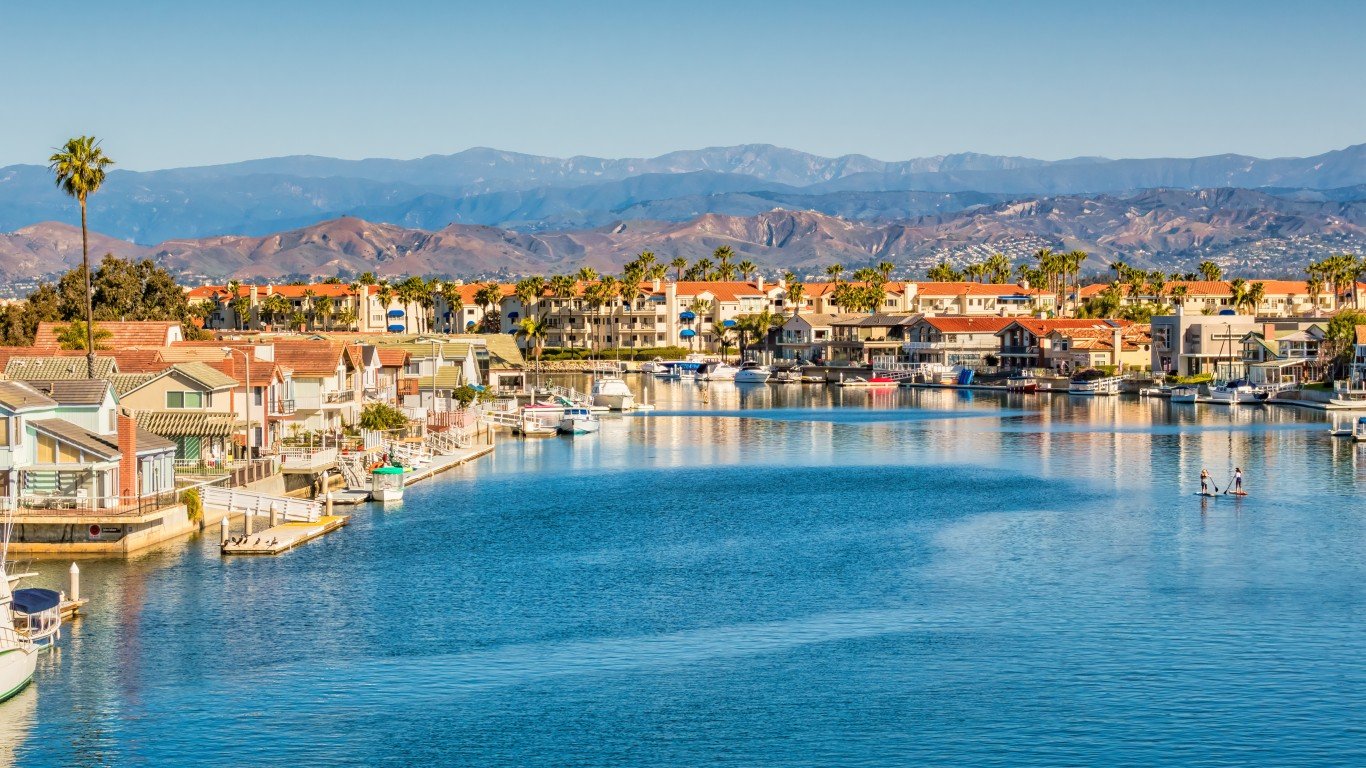
20. Oxnard-Thousand Oaks-Ventura, CA
Source: benedek / iStock via Getty Images
- Population change due to migration, 2022-2023: -0.64% (-5,364)
- Migration breakdown, 2022-2023: international: +1,390; domestic: -6,754
- Total population change, 2022-2023: -3,281 or -0.39% (#34 slowest growth)
- Population change due to migration, 2020-2023: -2.4% (#20 slowest growth)
- Unemployment rate, March 2024: 4.6%
- Median home value, 2022: $796,300
- Total population, 2023: 829,590
19. New York-Newark-Jersey City, NY-NJ

Source: GCShutter / E+ via Getty Images
- Population change due to migration, 2022-2023: -0.68% (-133,571)
- Migration breakdown, 2022-2023: international: +104,923; domestic: -238,494
- Total population change, 2022-2023: -65,549 or -0.34% (#41 slowest growth)
- Population change due to migration, 2020-2023: -3.7% (#10 slowest growth)
- Unemployment rate, March 2024: 4.3% (New York-Newark-Jersey City, NY-NJ-PA)
- Median home value, 2022: $578,800 (New York-Newark-Jersey City, NY-NJ-PA)
- Total population, 2023: 19,498,249
18. Lawton, OK

Source: DenisTangneyJr / iStock via Getty Images
- Population change due to migration, 2022-2023: -0.70% (-888)
- Migration breakdown, 2022-2023: international: +142; domestic: -1,030
- Total population change, 2022-2023: -673 or -0.53% (#23 slowest growth)
- Population change due to migration, 2020-2023: -0.2% (#108 slowest growth)
- Unemployment rate, March 2024: 3.6%
- Median home value, 2022: $143,000
- Total population, 2023: 127,001
17. Ithaca, NY

Source: benedek / iStock Unreleased via Getty Images
- Population change due to migration, 2022-2023: -0.70% (-731)
- Migration breakdown, 2022-2023: international: +532; domestic: -1,263
- Total population change, 2022-2023: -741 or -0.71% (#8 slowest growth)
- Population change due to migration, 2020-2023: -0.5% (#92 slowest growth)
- Unemployment rate, March 2024: 3.2%
- Median home value, 2022: $283,000
- Total population, 2023: 103,558
16. Elkhart-Goshen, IN

Source: Wirestock / iStock via Getty Images
- Population change due to migration, 2022-2023: -0.70% (-1,450)
- Migration breakdown, 2022-2023: international: +475; domestic: -1,925
- Total population change, 2022-2023: -464 or -0.22% (#57 slowest growth)
- Population change due to migration, 2020-2023: -1.7% (#37 slowest growth)
- Unemployment rate, March 2024: 4.4%
- Median home value, 2022: $200,400
- Total population, 2023: 206,409
15. Urban Honolulu, HI

Source: sorincolac / iStock via Getty Images
- Population change due to migration, 2022-2023: -0.74% (-7,395)
- Migration breakdown, 2022-2023: international: +3,399; domestic: -10,794
- Total population change, 2022-2023: -5,420 or -0.54% (#22 slowest growth)
- Population change due to migration, 2020-2023: -3.4% (#14 slowest growth)
- Unemployment rate, March 2024: 2.5%
- Median home value, 2022: $874,500
- Total population, 2023: 989,408
14. Los Angeles-Long Beach-Anaheim, CA

Source: shalunts / iStock via Getty Images
- Population change due to migration, 2022-2023: -0.79% (-101,387)
- Migration breakdown, 2022-2023: international: +53,247; domestic: -154,634
- Total population change, 2022-2023: -71,037 or -0.55% (#21 slowest growth)
- Population change due to migration, 2020-2023: -3.6% (#13 slowest growth)
- Unemployment rate, March 2024: 4.9%
- Median home value, 2022: $847,400
- Total population, 2023: 12,799,100
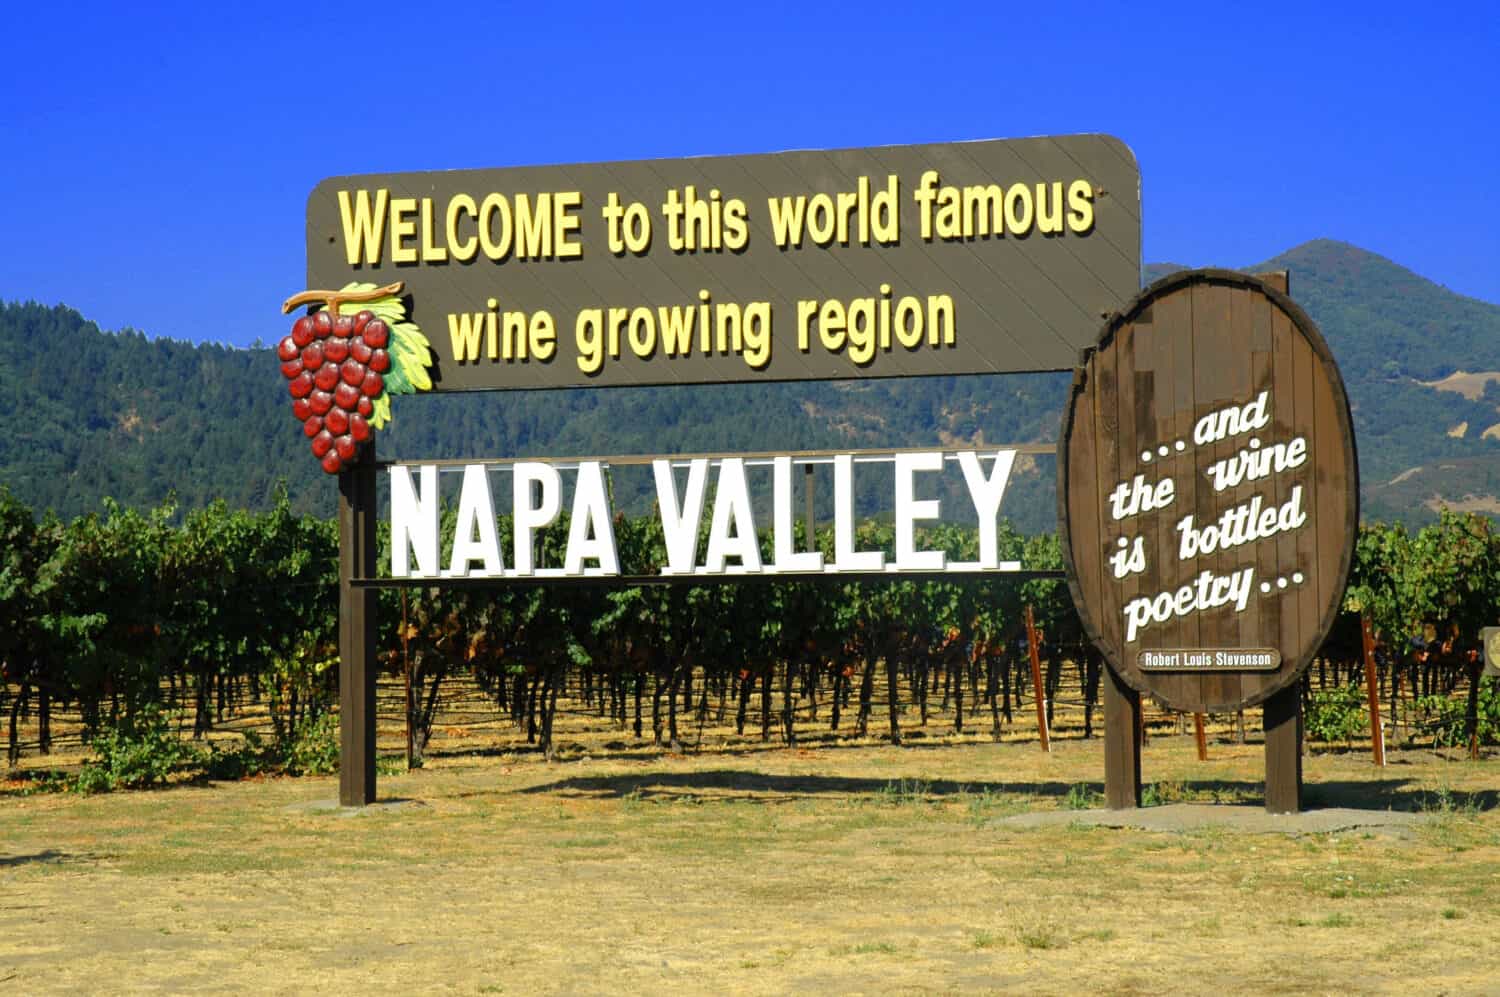
13. Napa, CA
Source: StacieStauffSmith Photos / Shutterstock.com
- Population change due to migration, 2022-2023: -0.79% (-1,060)
- Migration breakdown, 2022-2023: international: +279; domestic: -1,339
- Total population change, 2022-2023: -1,154 or -0.86% (#4 slowest growth)
- Population change due to migration, 2020-2023: -3.2% (#15 slowest growth)
- Unemployment rate, March 2024: 4.2%
- Median home value, 2022: $866,300
- Total population, 2023: 133,216
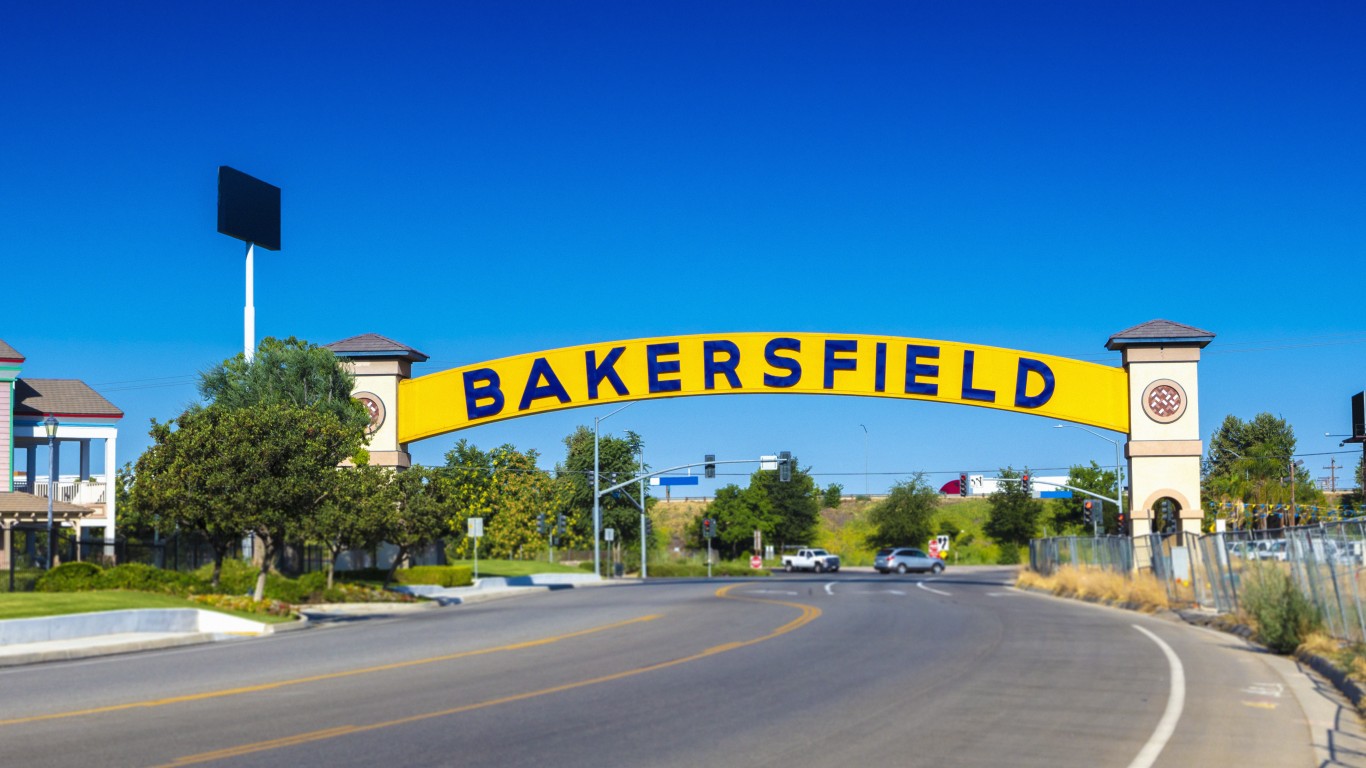
12. Bakersfield-Delano, CA
Source: LPETTET / iStock via Getty Images
- Population change due to migration, 2022-2023: -0.82% (-7,510)
- Migration breakdown, 2022-2023: international: +1,659; domestic: -9,169
- Total population change, 2022-2023: -2,931 or -0.32% (#42 slowest growth)
- Population change due to migration, 2020-2023: -1.0% (#58 slowest growth)
- Unemployment rate, March 2024: 10.1% (Bakersfield)
- Median home value, 2022: $330,000 (Bakersfield)
- Total population, 2023: 913,820
11. Hanford-Corcoran, CA
Source: springfieldhomer / Flickr
- Population change due to migration, 2022-2023: -0.83% (-1,277)
- Migration breakdown, 2022-2023: international: +188; domestic: -1,465
- Total population change, 2022-2023: -305 or -0.20% (#62 slowest growth)
- Population change due to migration, 2020-2023: -2.0% (#30 slowest growth)
- Unemployment rate, March 2024: 10.0%
- Median home value, 2022: $299,400
- Total population, 2023: 152,682
10. St. Joseph, MO-KS

Source: BOB WESTON / iStock via Getty Images
- Population change due to migration, 2022-2023: -0.93% (-1,116)
- Migration breakdown, 2022-2023: international: +151; domestic: -1,267
- Total population change, 2022-2023: -1,217 or -1.02% (#3 slowest growth)
- Population change due to migration, 2020-2023: -1.9% (#32 slowest growth)
- Unemployment rate, March 2024: 3.4%
- Median home value, 2022: $165,600
- Total population, 2023: 118,475
9. Houma-Bayou Cane-Thibodaux, LA
Source: saturne / Flickr
- Population change due to migration, 2022-2023: -0.94% (-1,892)
- Migration breakdown, 2022-2023: international: +152; domestic: -2,044
- Total population change, 2022-2023: -1,711 or -0.85% (#5 slowest growth)
- Population change due to migration, 2020-2023: -4.4% (#4 slowest growth)
- Unemployment rate, March 2024: 4.0% (Houma-Thibodaux)
- Median home value, 2022: $182,600 (Houma-Thibodaux)
- Total population, 2023: 198,672
8. Santa Maria-Santa Barbara, CA

Source: stellalevi / iStock via Getty Images
- Population change due to migration, 2022-2023: -1.09% (-4,822)
- Migration breakdown, 2022-2023: international: +1,424; domestic: -6,246
- Total population change, 2022-2023: -2,658 or -0.60% (#15 slowest growth)
- Population change due to migration, 2020-2023: -2.9% (#16 slowest growth)
- Unemployment rate, March 2024: 5.1%
- Median home value, 2022: $744,700
- Total population, 2023: 441,257
7. Salinas, CA

- Population change due to migration, 2022-2023: -1.12% (-4,850)
- Migration breakdown, 2022-2023: international: +1,340; domestic: -6,190
- Total population change, 2022-2023: -2,161 or -0.50% (#25 slowest growth)
- Population change due to migration, 2020-2023: -3.8% (#8 slowest growth)
- Unemployment rate, March 2024: 10.5%
- Median home value, 2022: $732,500
- Total population, 2023: 430,723
6. Santa Cruz-Watsonville, CA
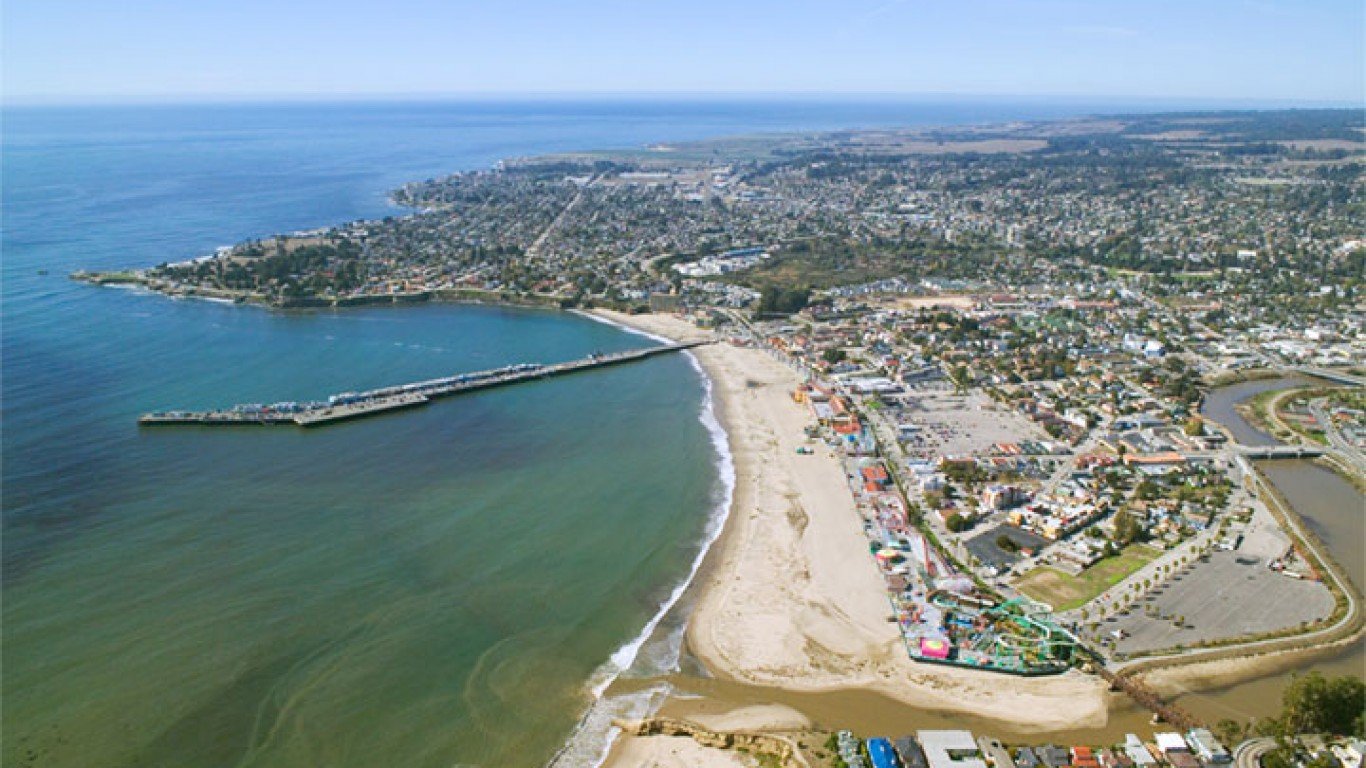
Source: Robert Campbell / Wikimedia Commons
- Population change due to migration, 2022-2023: -1.16% (-3,059)
- Migration breakdown, 2022-2023: international: +396; domestic: -3,455
- Total population change, 2022-2023: -2,693 or -1.02% (#2 slowest growth)
- Population change due to migration, 2020-2023: -3.6% (#11 slowest growth)
- Unemployment rate, March 2024: 7.4%
- Median home value, 2022: $1,013,900
- Total population, 2023: 261,547
5. Fairbanks-College, AK
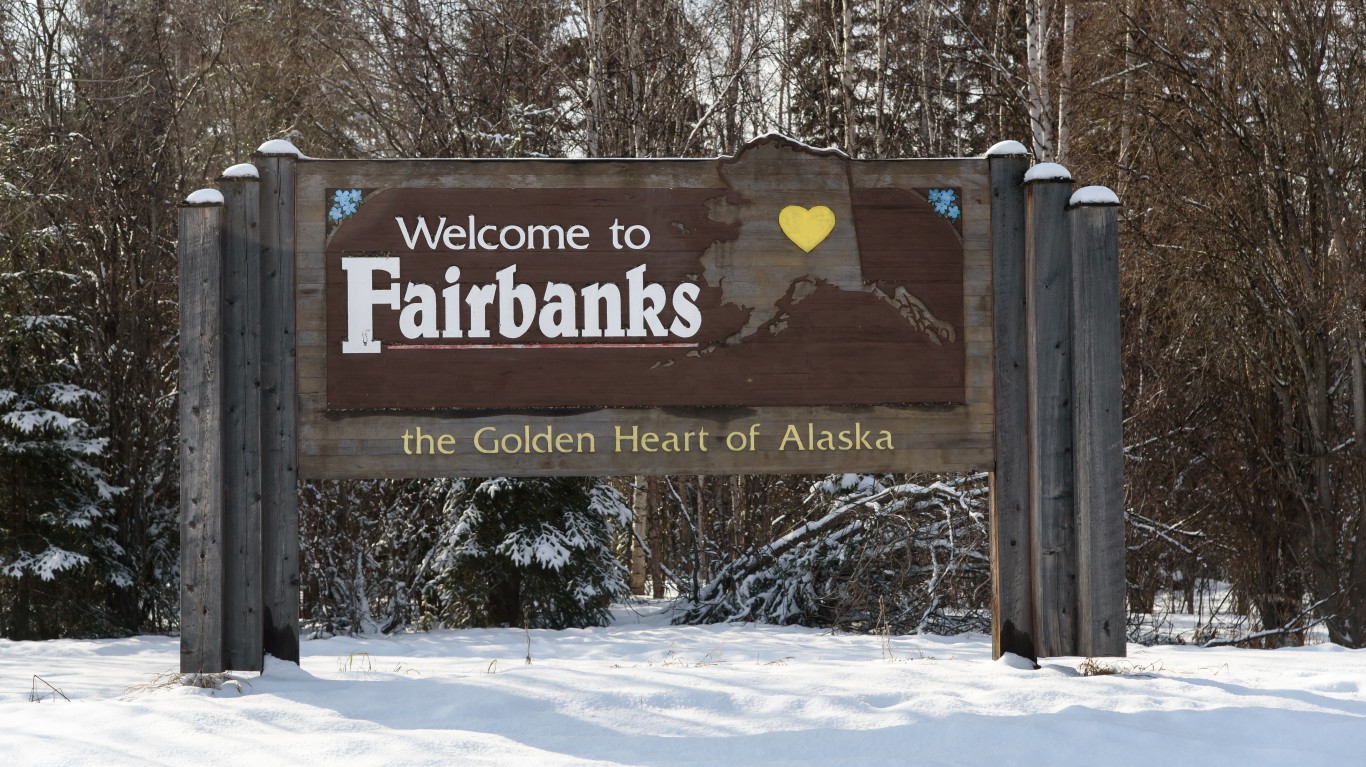
Source: sarkophoto / iStock via Getty Images
- Population change due to migration, 2022-2023: -1.24% (-1,177)
- Migration breakdown, 2022-2023: international: +214; domestic: -1,391
- Total population change, 2022-2023: -362 or -0.38% (#37 slowest growth)
- Population change due to migration, 2020-2023: -3.6% (#12 slowest growth)
- Unemployment rate, March 2024: 4.1% (Fairbanks)
- Median home value, 2022: $307,600 (Fairbanks)
- Total population, 2023: 94,840
4. Minot, ND

- Population change due to migration, 2022-2023: -1.24% (-947)
- Migration breakdown, 2022-2023: international: +175; domestic: -1,122
- Total population change, 2022-2023: -491 or -0.64% (#12 slowest growth)
- Population change due to migration, 2020-2023: -4.0% (#5 slowest growth)
- Unemployment rate, March 2024: N/A
- Median home value, 2022: $235,600
- Total population, 2023: 75,742
3. Manhattan, KS
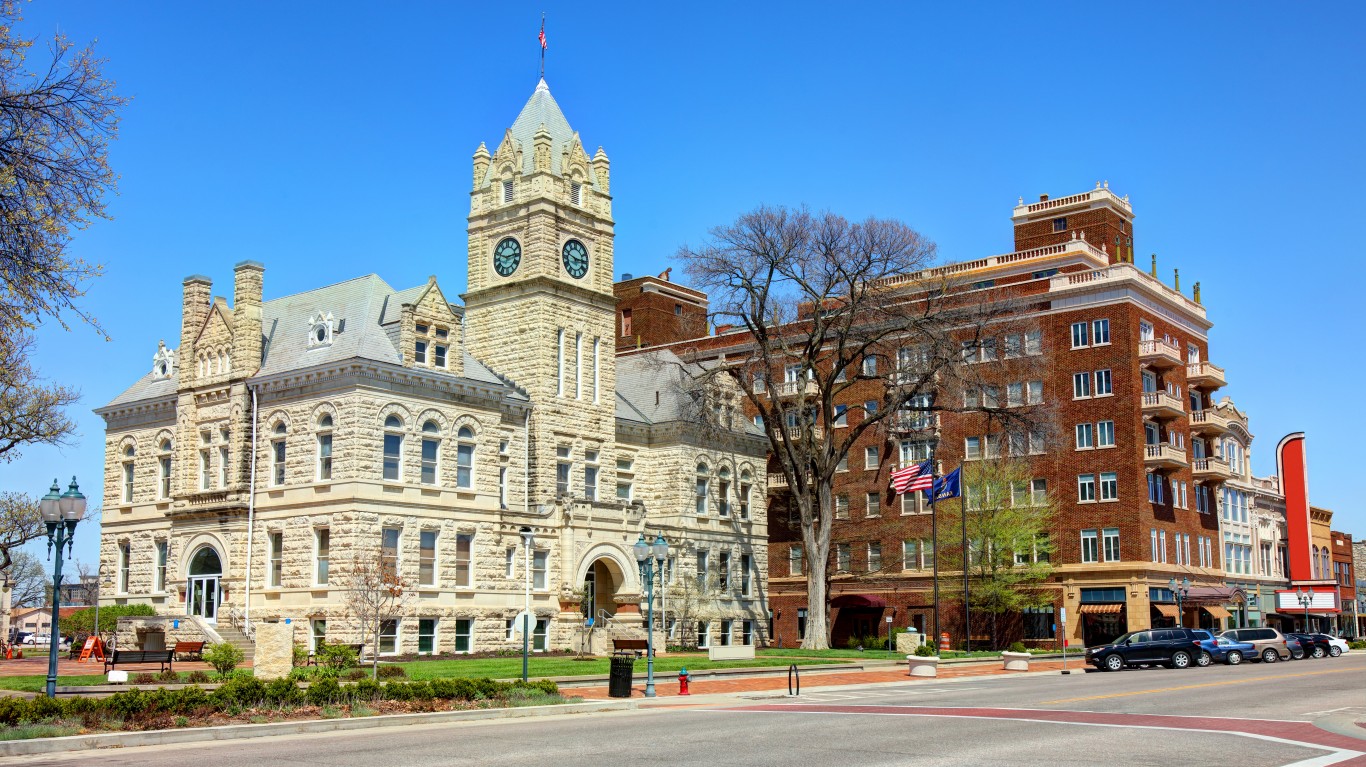
Source: DenisTangneyJr / iStock via Getty Images
- Population change due to migration, 2022-2023: -1.28% (-1,709)
- Migration breakdown, 2022-2023: international: +425; domestic: -2,134
- Total population change, 2022-2023: -553 or -0.41% (#31 slowest growth)
- Population change due to migration, 2020-2023: -3.7% (#9 slowest growth)
- Unemployment rate, March 2024: 2.7%
- Median home value, 2022: $214,000
- Total population, 2023: 132,831
2. Watertown-Fort Drum, NY
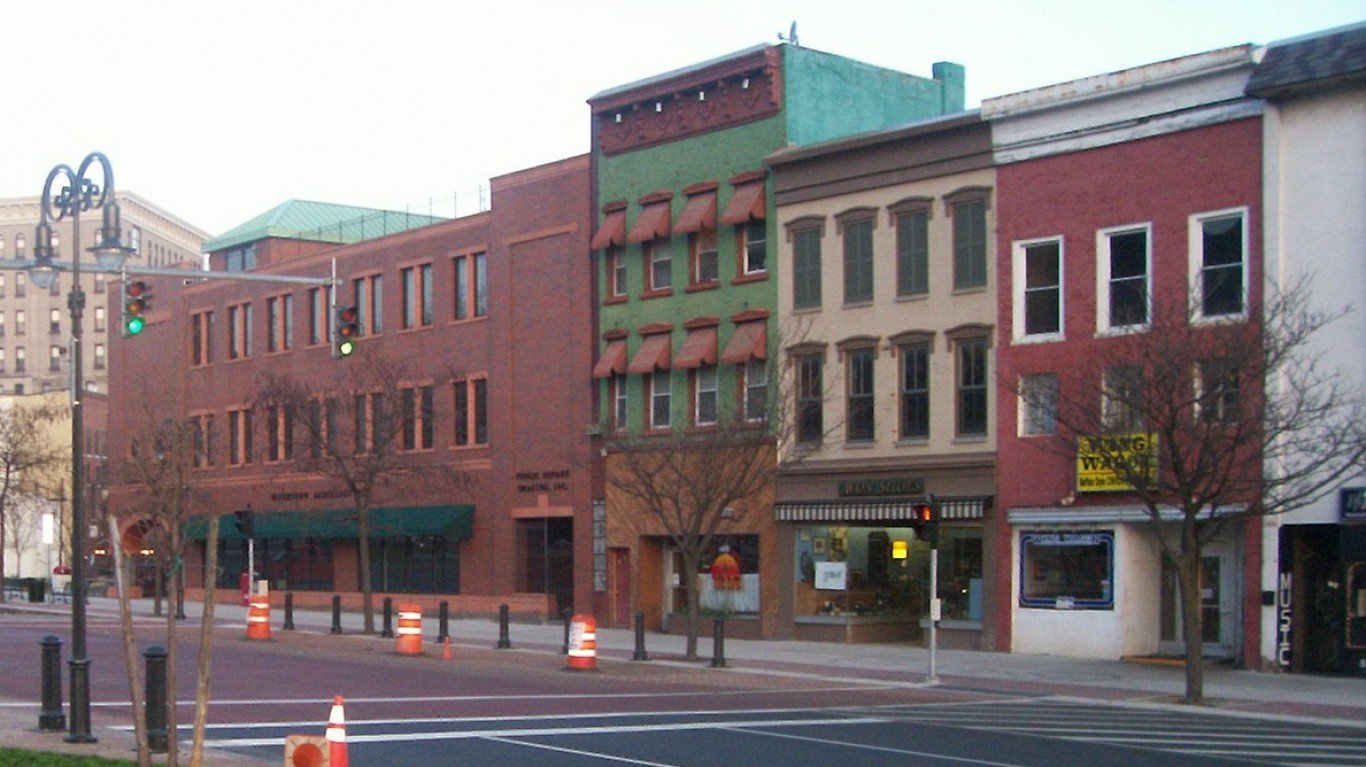
Source: Public Domain / Wikimedia Commons
- Population change due to migration, 2022-2023: -1.30% (-1,499)
- Migration breakdown, 2022-2023: international: +273; domestic: -1,772
- Total population change, 2022-2023: -674 or -0.58% (#17 slowest growth)
- Population change due to migration, 2020-2023: -3.9% (#6 slowest growth)
- Unemployment rate, March 2024: 5.6%
- Median home value, 2022: $177,700
- Total population, 2023: 114,787
1. New Orleans-Metairie, LA

Source: f11photo / iStock via Getty Images
- Population change due to migration, 2022-2023: -1.35% (-13,173)
- Migration breakdown, 2022-2023: international: +3,851; domestic: -17,024
- Total population change, 2022-2023: -11,220 or -1.15% (#1 slowest growth)
- Population change due to migration, 2020-2023: -4.8% (#2 slowest growth)
- Unemployment rate, March 2024: 4.5%
- Median home value, 2022: $265,800
- Total population, 2023: 962,165
Thank you for reading! Have some feedback for us?
Contact the 24/7 Wall St. editorial team.
Editors' Picks