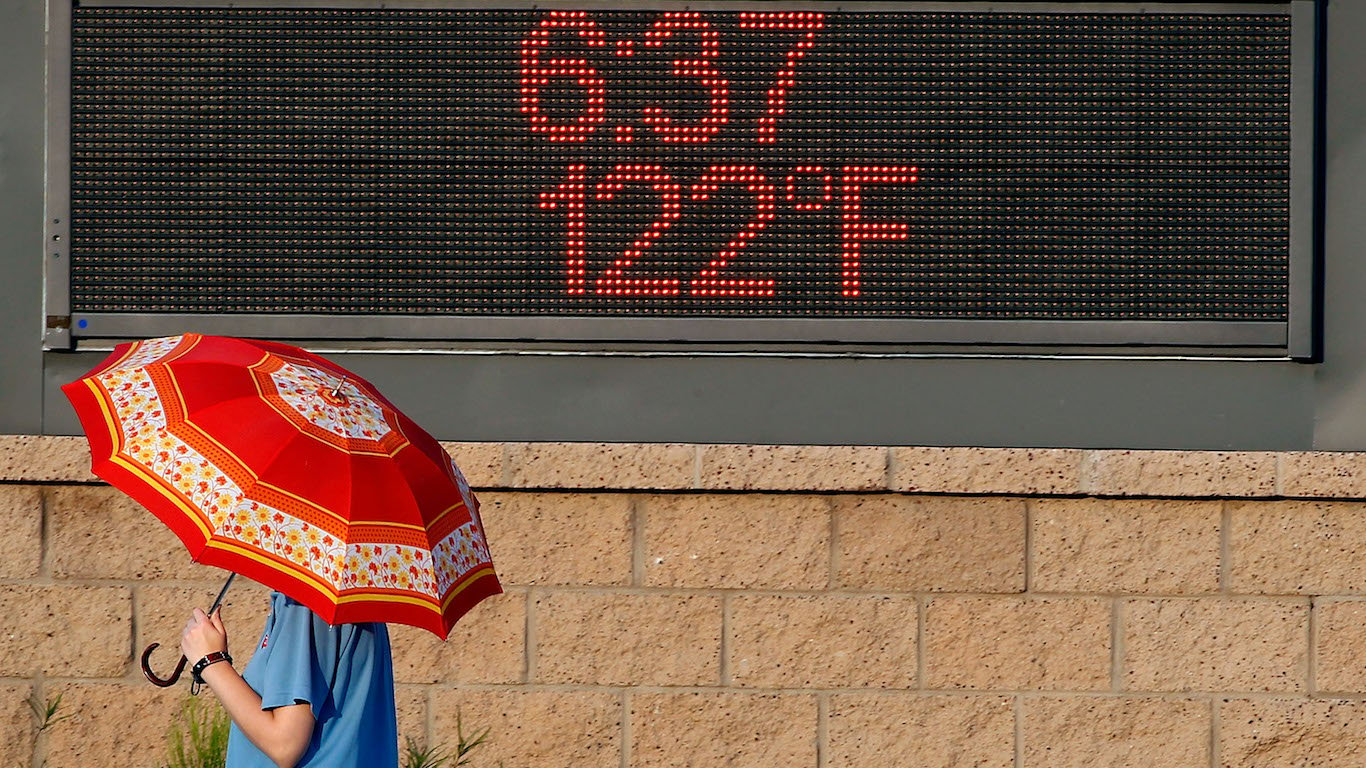
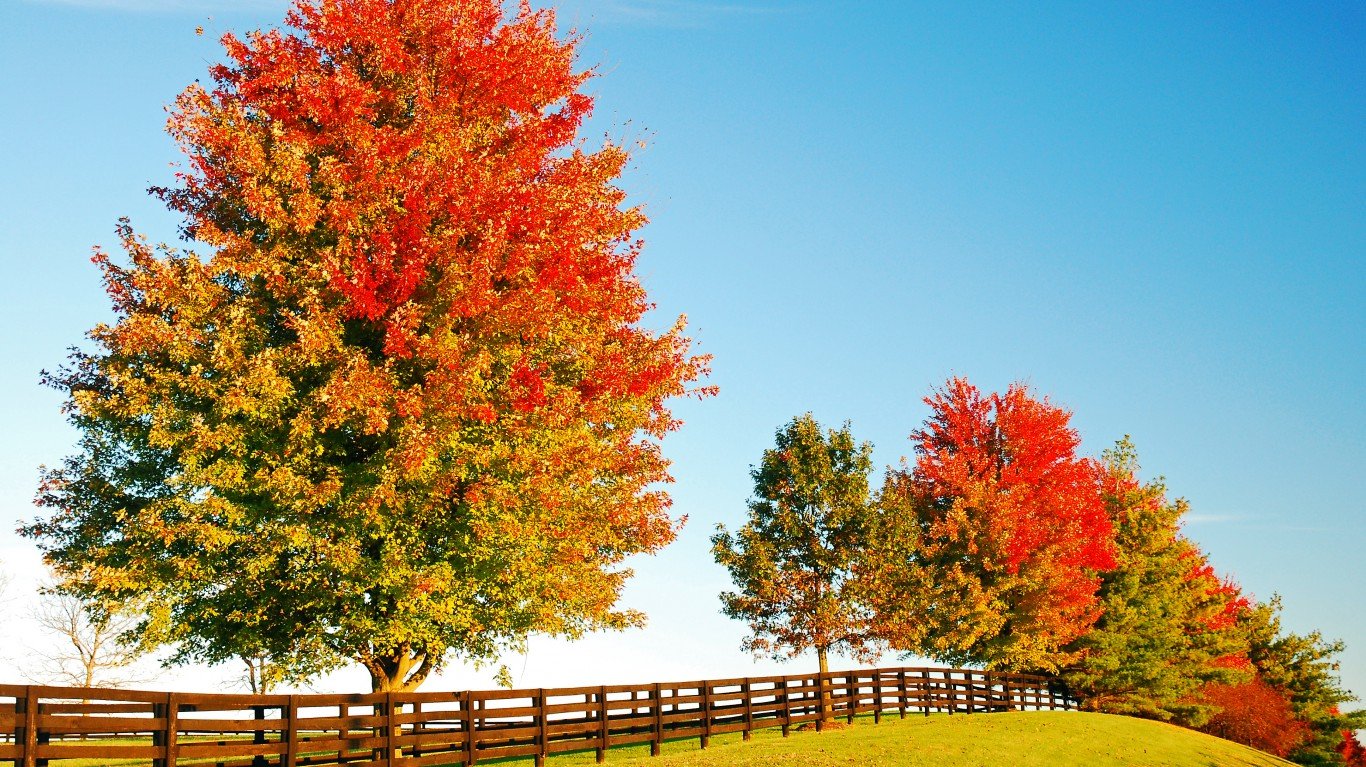
Preliminary data indicates that 2018 will be the fourth warmest year since record keeping began nearly a century and a half ago. If these projections prove accurate, this year would join the preceding three years as the four warmest on record.
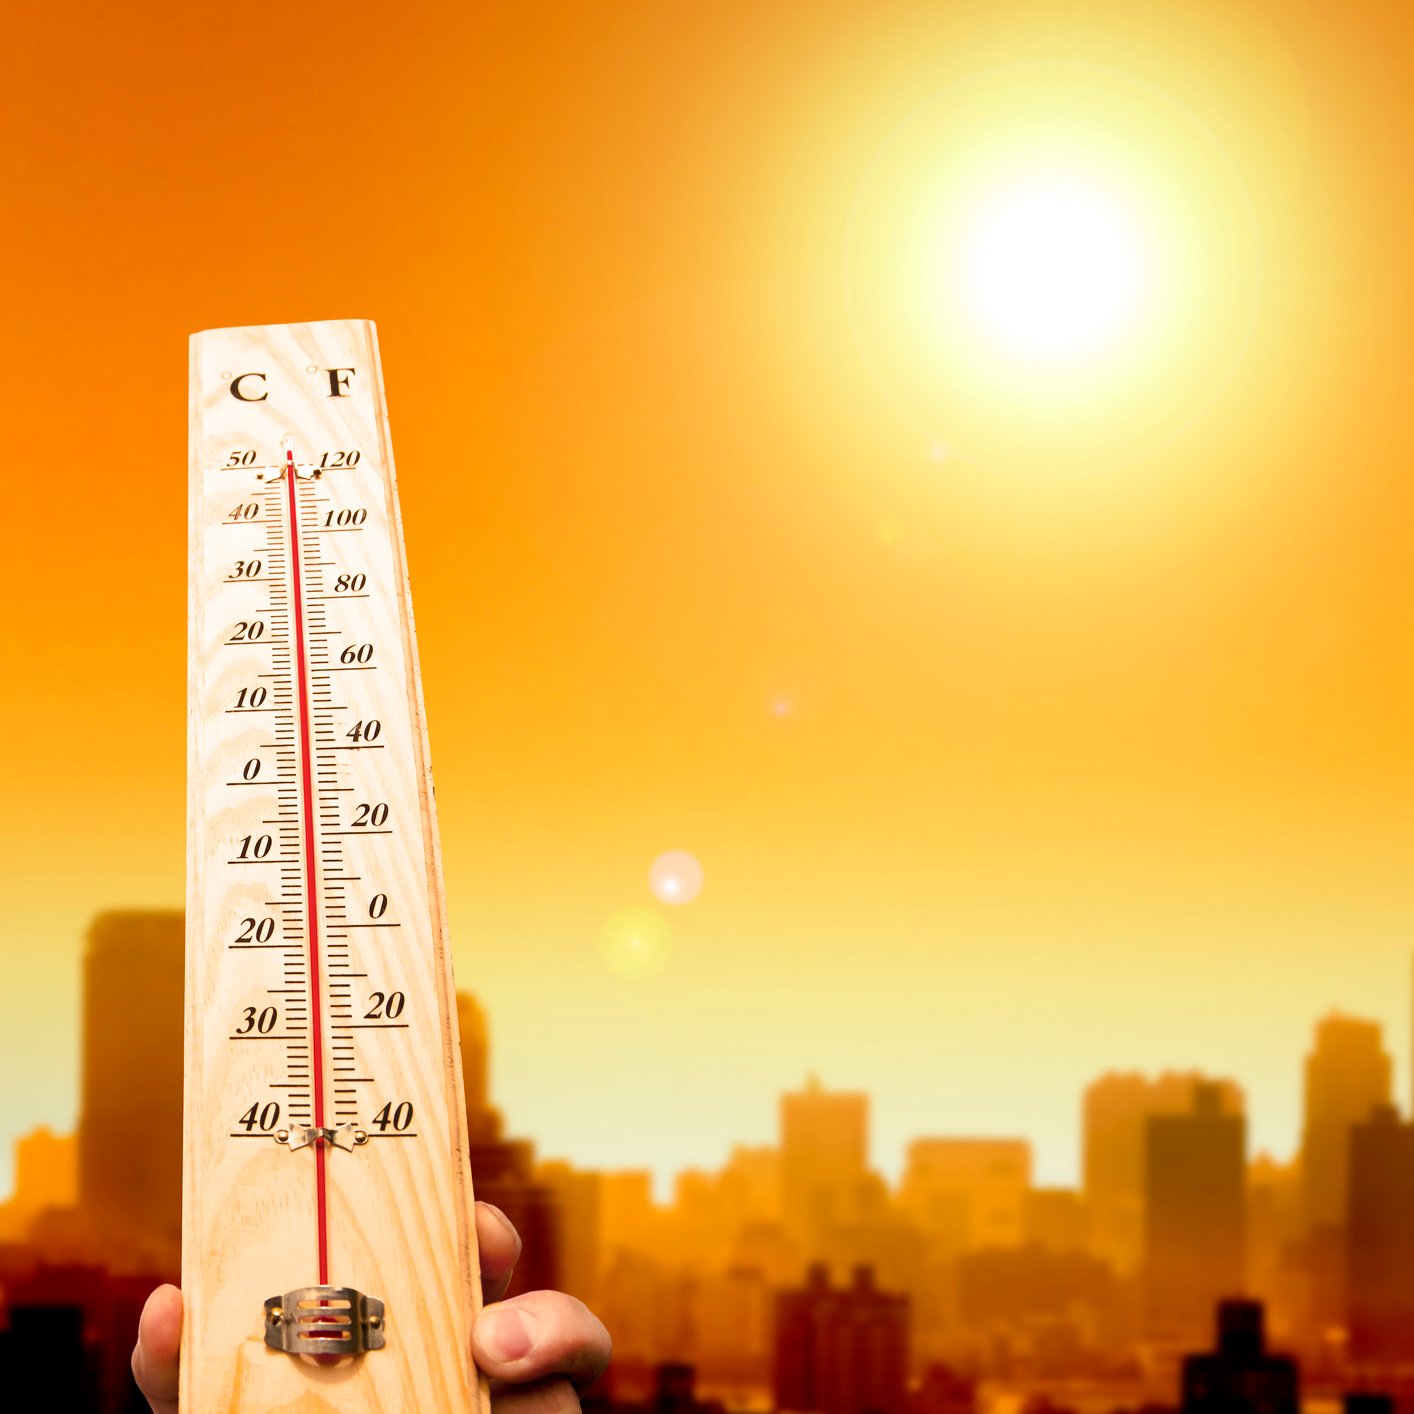
There is widespread consensus among scientists worldwide that our planet is getting warmer — and that human activity is to blame. For over a century, industrialization and the burning of fossil fuels have released certain gases, especially carbon dioxide, into the atmosphere. These gases prevent heat from escaping the atmosphere into space — a phenomenon commonly known as the greenhouse effect.
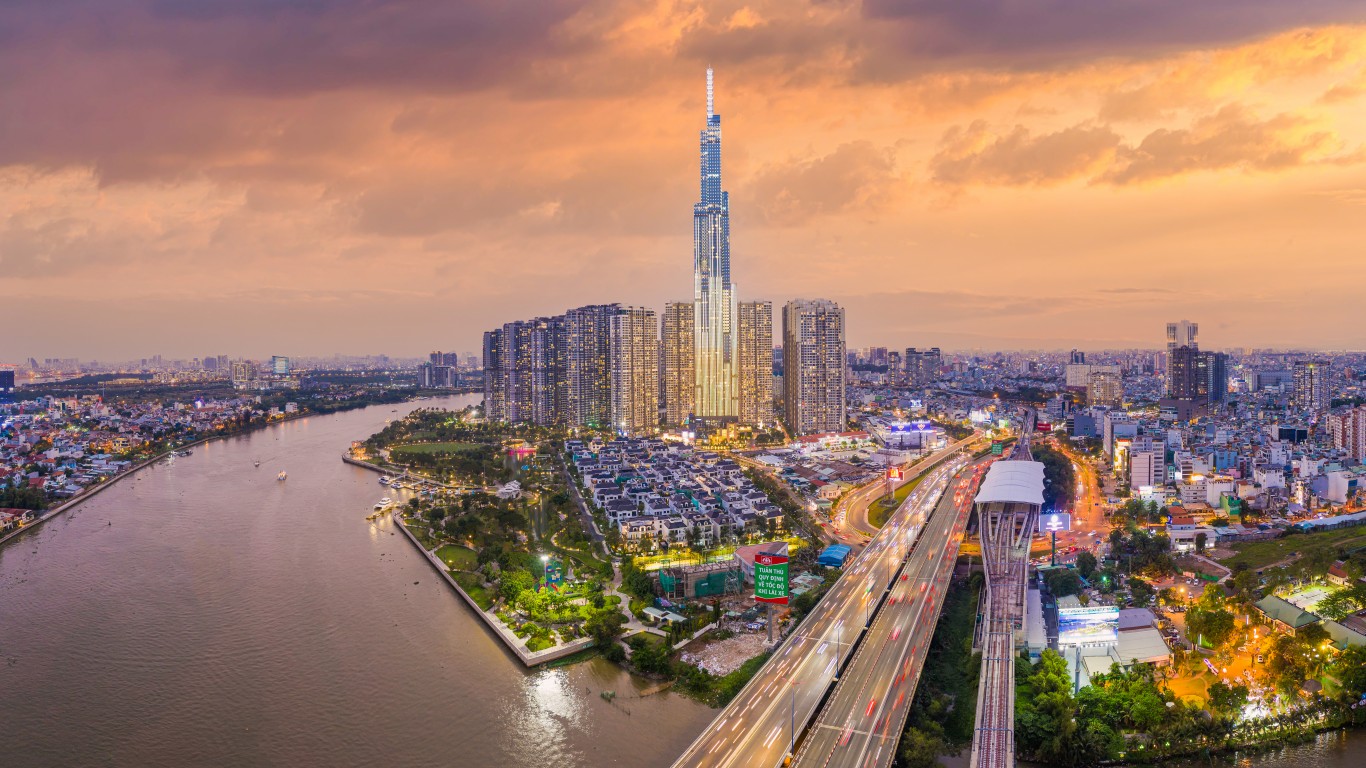
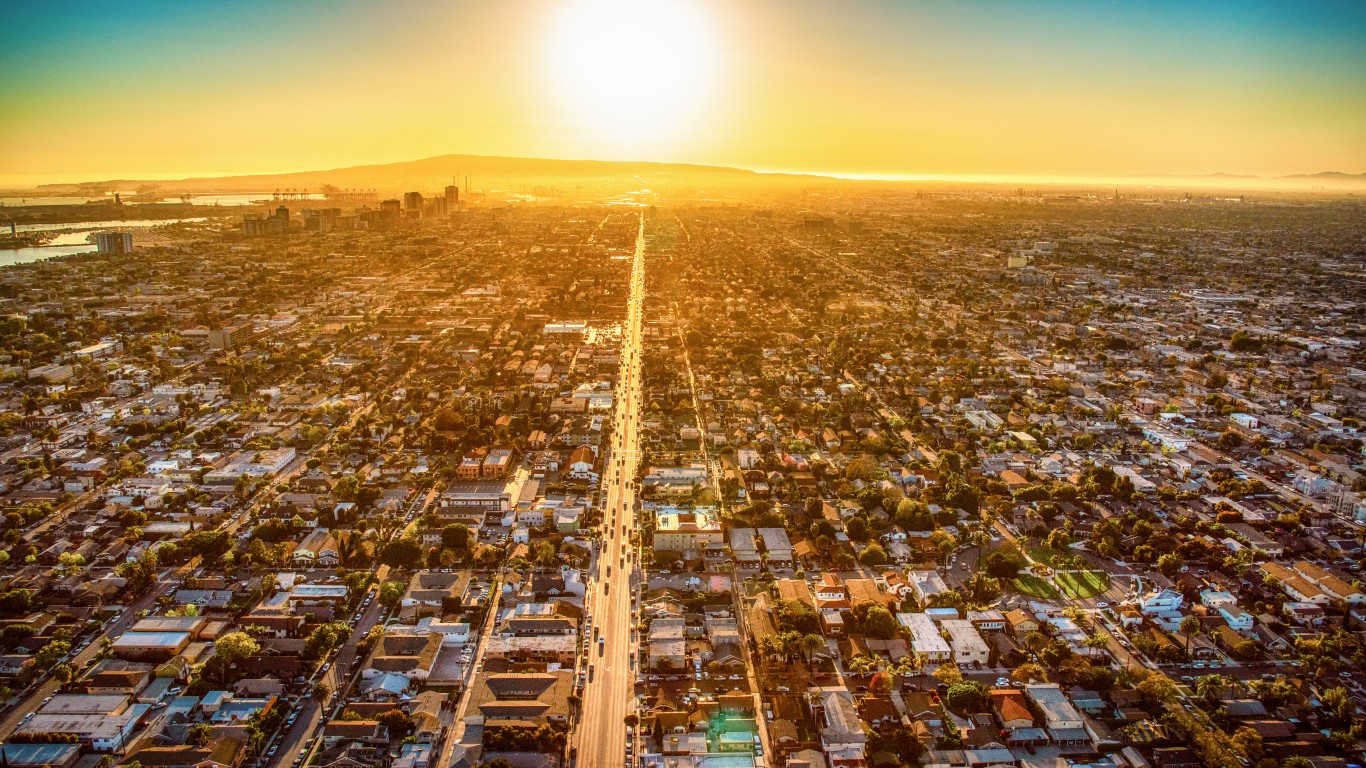
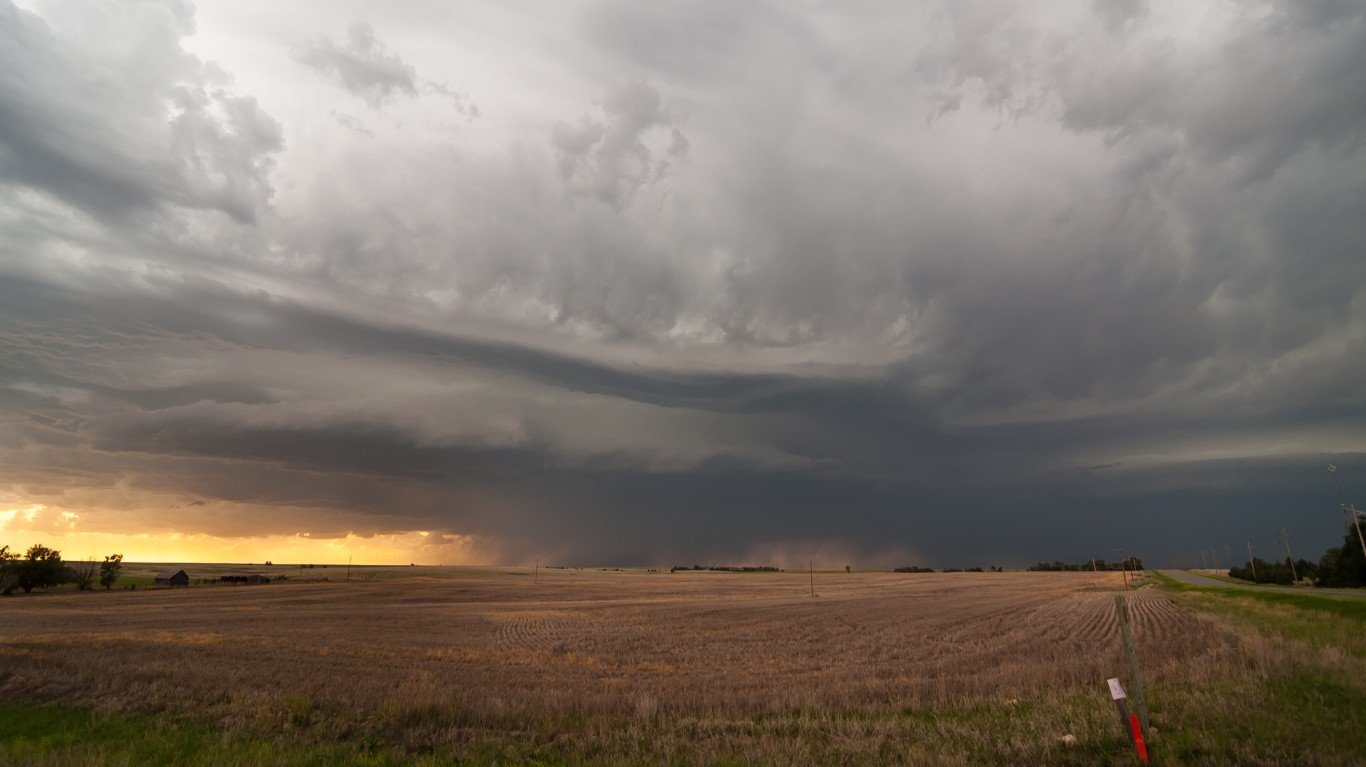
If drastic action is not soon taken to reduce carbon emissions, the effects of global warming will be devastating in many parts of the world. Here in the United States, rising temperatures will likely bring more extreme weather events, including heat waves, droughts, and severe rain storms. These, in turn, will strain infrastructure and industry.
Using a report recently released by Vox Media, 24/7 Wall St. ranked the U.S. cities where temperature changes will be the most dramatic in the coming years.
We ranked cities based on the projected change in the average summer high temperature from the year 2000 to 2050. Our list only includes cities with a projected change of at least 5 degrees Fahrenheit. We only considered the 100 largest cities by population in the continental United States. The U.S. cities with the largest projected summer temperature change are concentrated in the Midwest.
Vox’s report was put together with the assistance of NASA’s Jet Propulsion Laboratory and the Scripps Institution of Oceanography.
Click here to see the U.S. cities where the weather will be unrecognizable in 30 years.
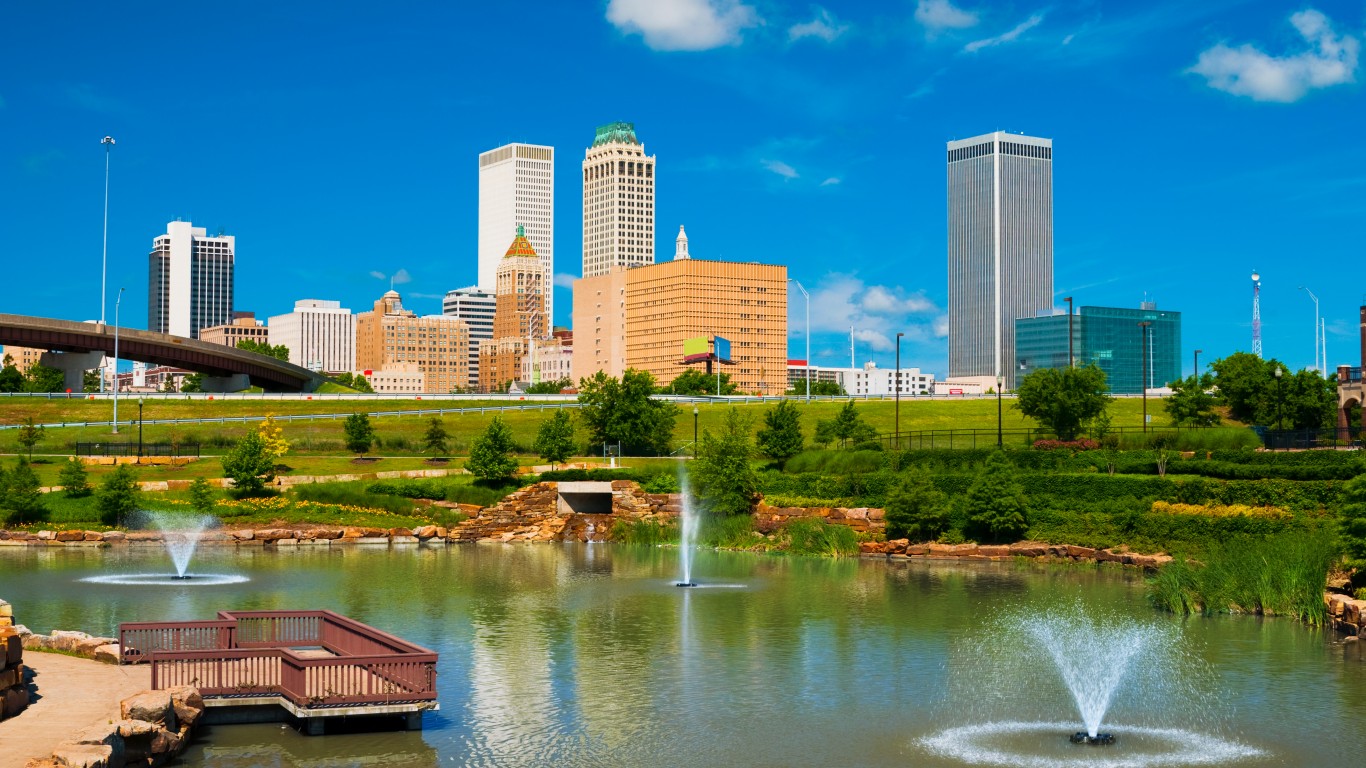
27. Tulsa, Oklahoma
> 50 yr. change in avg. summer high: +5.0 F
> 50 yr. change in avg. winter low: +3.9 F
> Avg. temp range in 2000: 28.6 F – 91.9 F
> Avg. temp range in 2050: 32.5 F – 96.9 F
> Current population: 402,227
[in-text-ad]
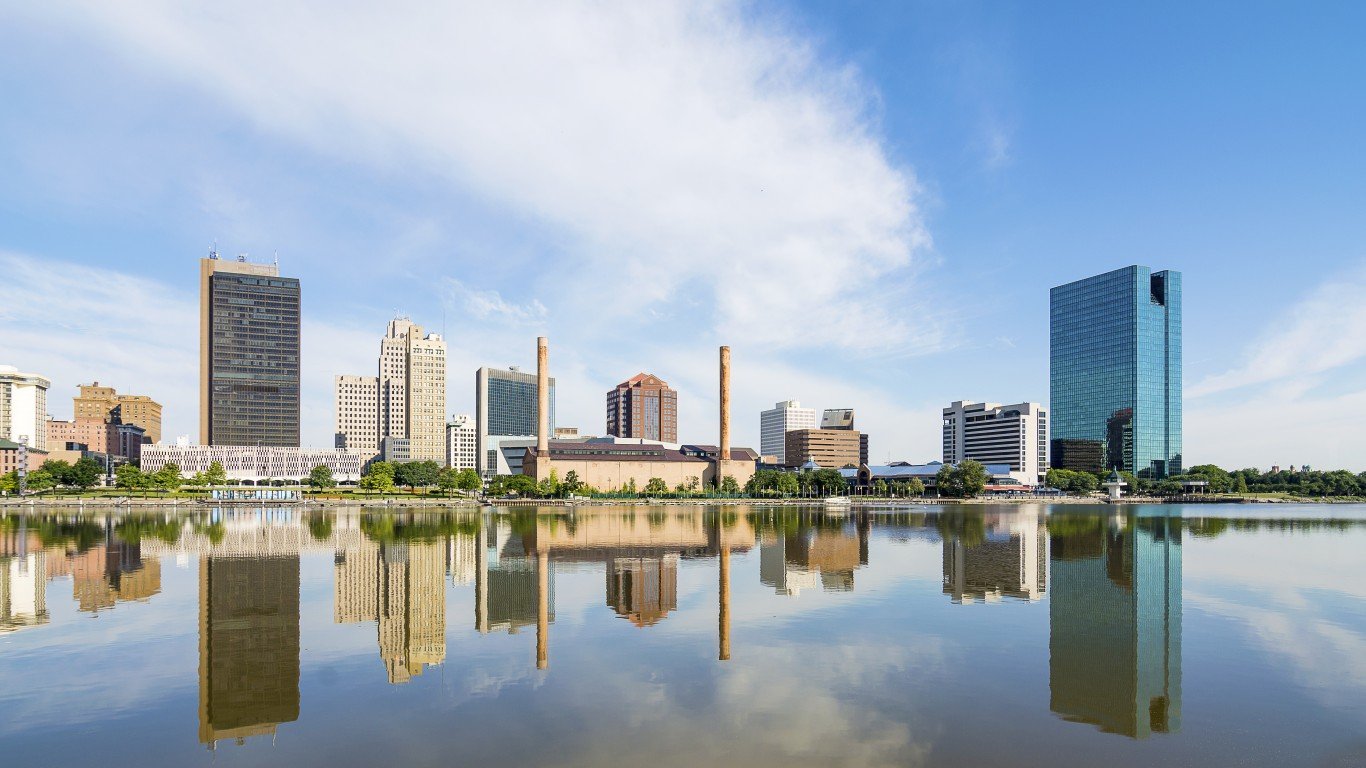
26. Toledo, Ohio
> 50 yr. change in avg. summer high: +5.0 F
> 50 yr. change in avg. winter low: +4.7 F
> Avg. temp range in 2000: 22.4 F – 85.2 F
> Avg. temp range in 2050: 27.0 F – 90.2 F
> Current population: 276,494
[recirclink id=488456]

25. Philadelphia, Pennsylvania
> 50 yr. change in avg. summer high: +5.0 F
> 50 yr. change in avg. winter low: +4.3 F
> Avg. temp range in 2000: 28.2 F – 86.0 F
> Avg. temp range in 2050: 32.6 F – 91.0 F
> Current population: 1,580,863
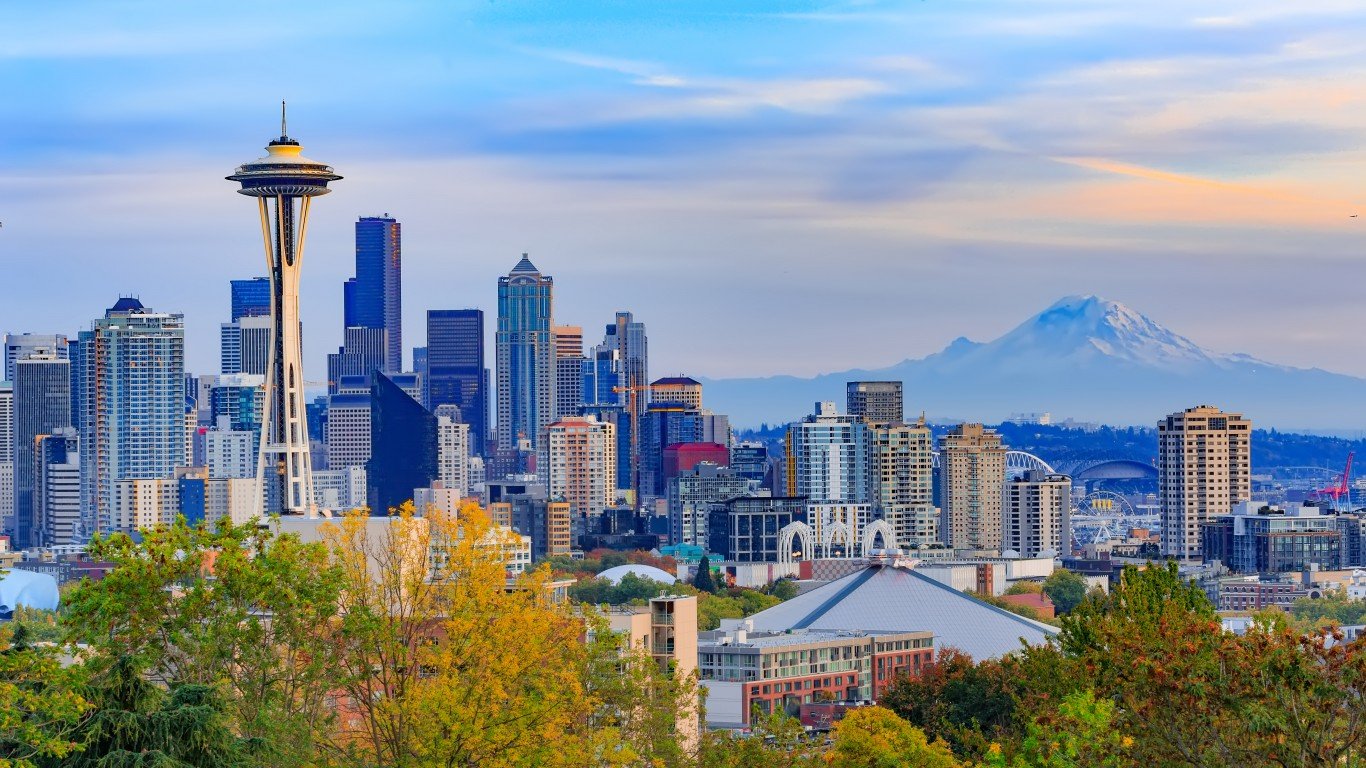
24. Seattle, Washington
> 50 yr. change in avg. summer high: +5.0 F
> 50 yr. change in avg. winter low: +3.9 F
> Avg. temp range in 2000: 37.9 F – 74.4 F
> Avg. temp range in 2050: 41.8 F – 79.4 F
> Current population: 724,764
[in-text-ad-2]
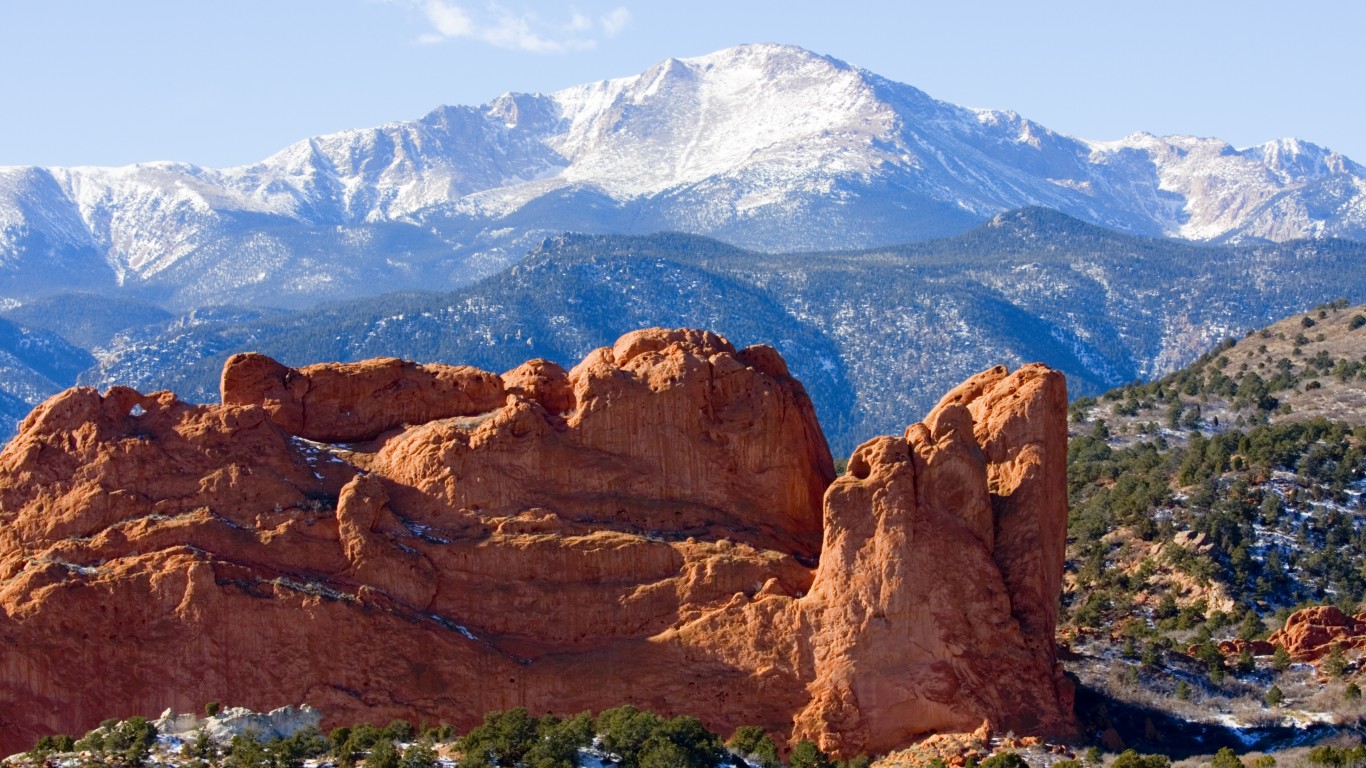
23. Colorado Springs, Colorado
> 50 yr. change in avg. summer high: +5.0 F
> 50 yr. change in avg. winter low: +4.6 F
> Avg. temp range in 2000: 19.0 F – 82.1 F
> Avg. temp range in 2050: 23.6 F – 87.2 F
> Current population: 464,470
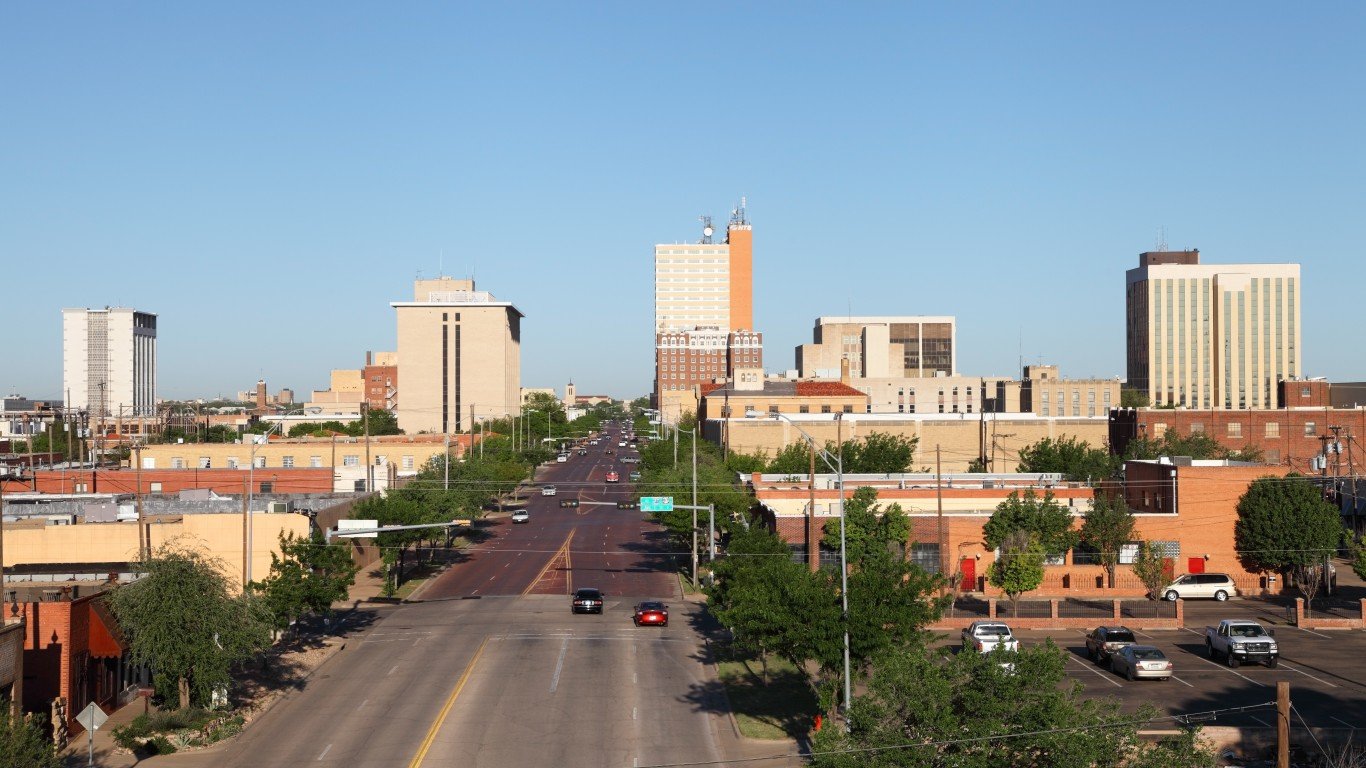
22. Lubbock, Texas
> 50 yr. change in avg. summer high: +5.1 F
> 50 yr. change in avg. winter low: +4.2 F
> Avg. temp range in 2000: 28.7 F – 92.7 F
> Avg. temp range in 2050: 32.9 F – 97.8 F
> Current population: 253,887
[in-text-ad]
21. Wichita, Kansas
> 50 yr. change in avg. summer high: +5.1 F
> 50 yr. change in avg. winter low: +4.2 F
> Avg. temp range in 2000: 23.9 F – 91.6 F
> Avg. temp range in 2050: 28.1 F – 96.8 F
> Current population: 390,599
[recirclink id=488594]
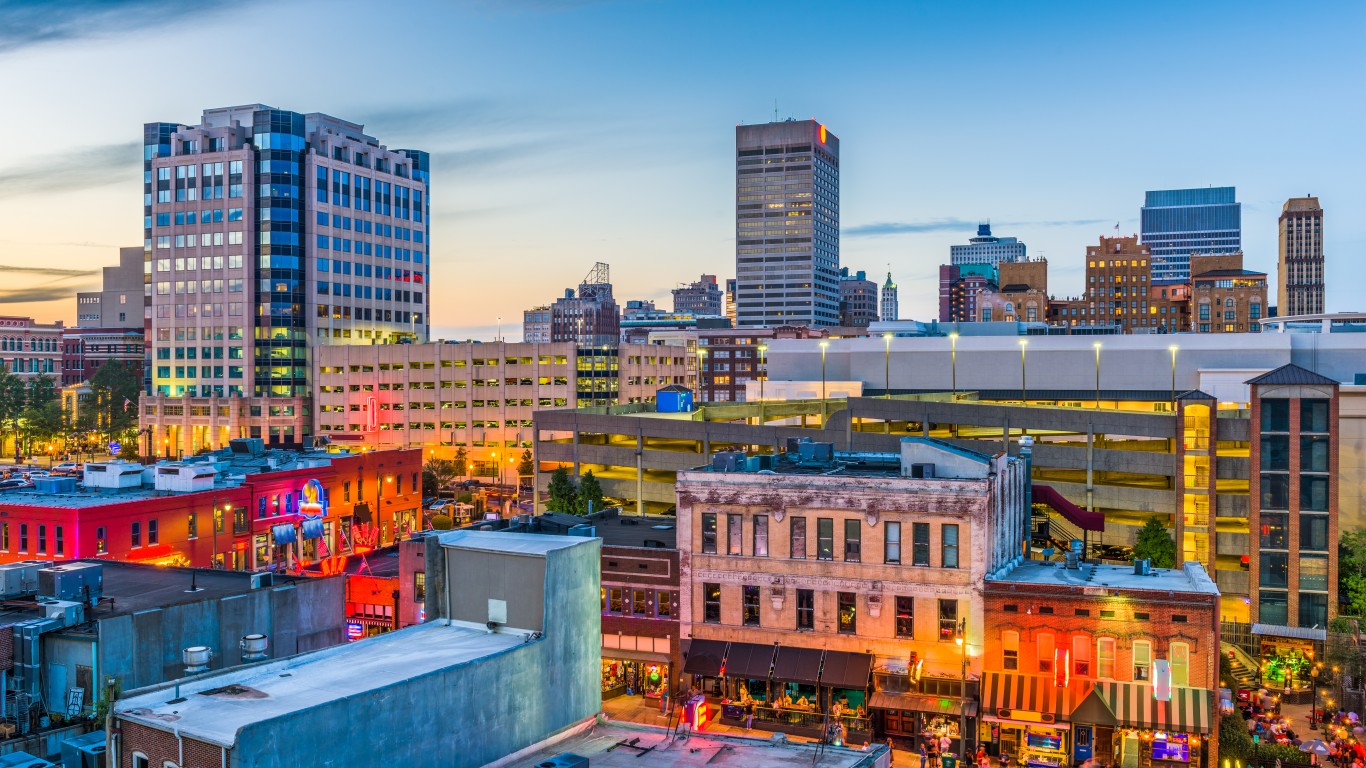
20. Memphis, Tennessee
> 50 yr. change in avg. summer high: +5.1 F
> 50 yr. change in avg. winter low: +3.5 F
> Avg. temp range in 2000: 33.8 F – 91.1 F
> Avg. temp range in 2050: 37.4 F – 96.2 F
> Current population: 652,231
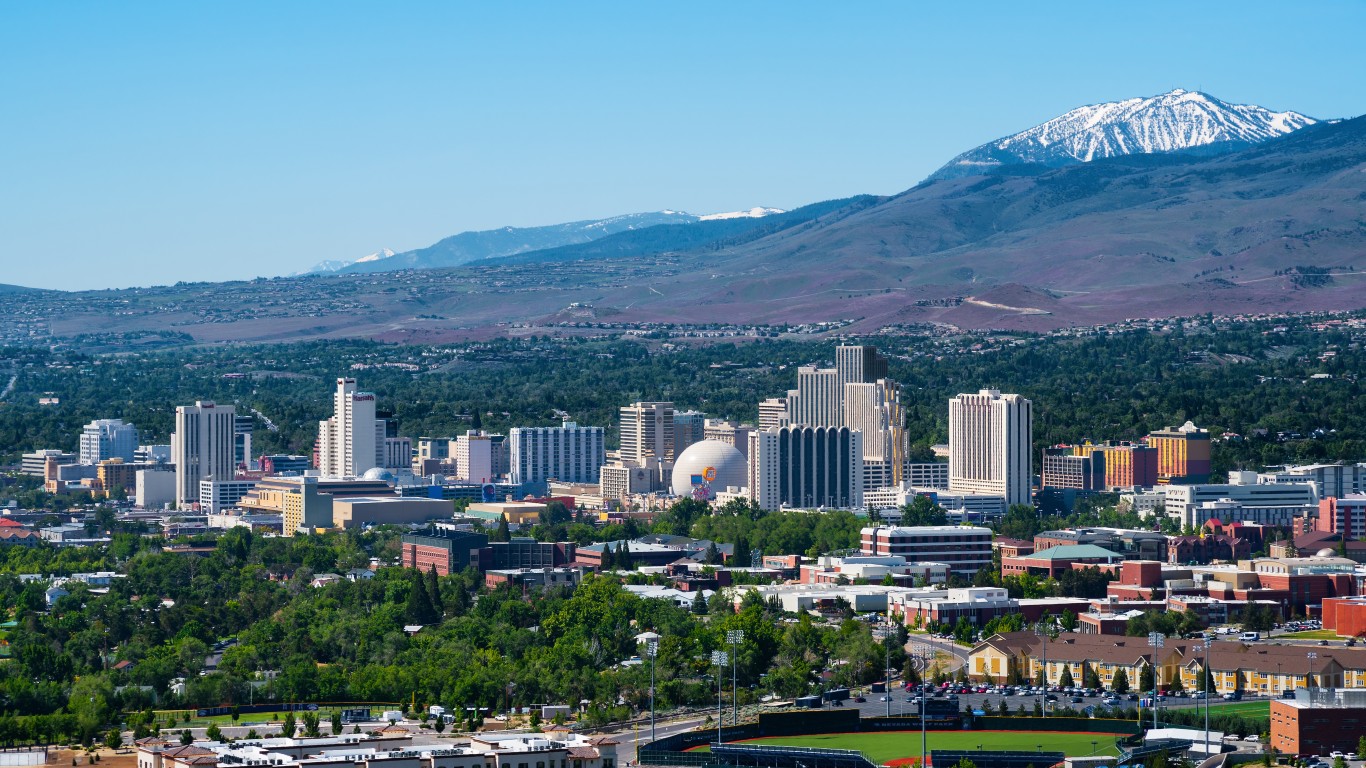
19. Reno, Nevada
> 50 yr. change in avg. summer high: +5.1 F
> 50 yr. change in avg. winter low: +4.3 F
> Avg. temp range in 2000: 21.9 F – 87.5 F
> Avg. temp range in 2050: 26.2 F – 92.6 F
> Current population: 248,860
[in-text-ad-2]
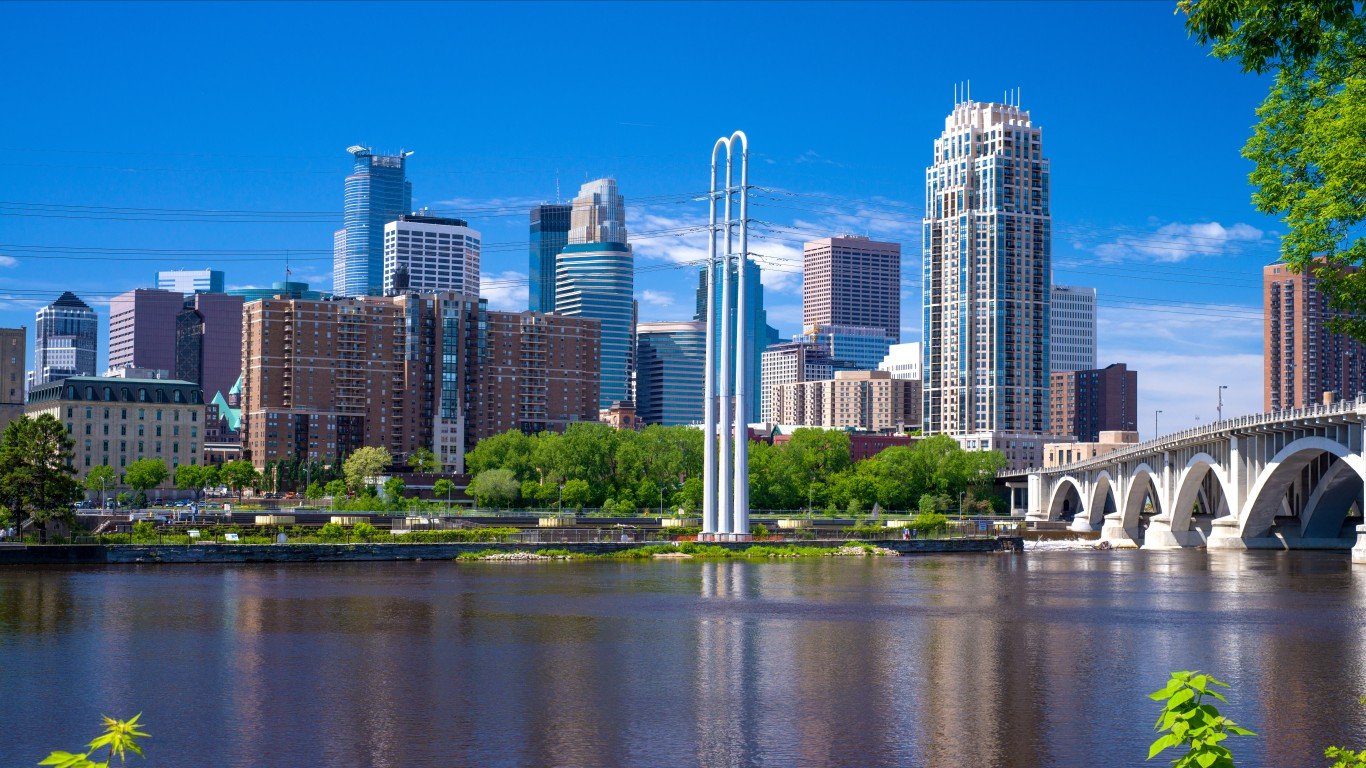
18. Minneapolis, Minnesota
> 50 yr. change in avg. summer high: +5.3 F
> 50 yr. change in avg. winter low: +7.0 F
> Avg. temp range in 2000: 9.8 F – 82.8 F
> Avg. temp range in 2050: 16.9 F – 88.1 F
> Current population: 422,326
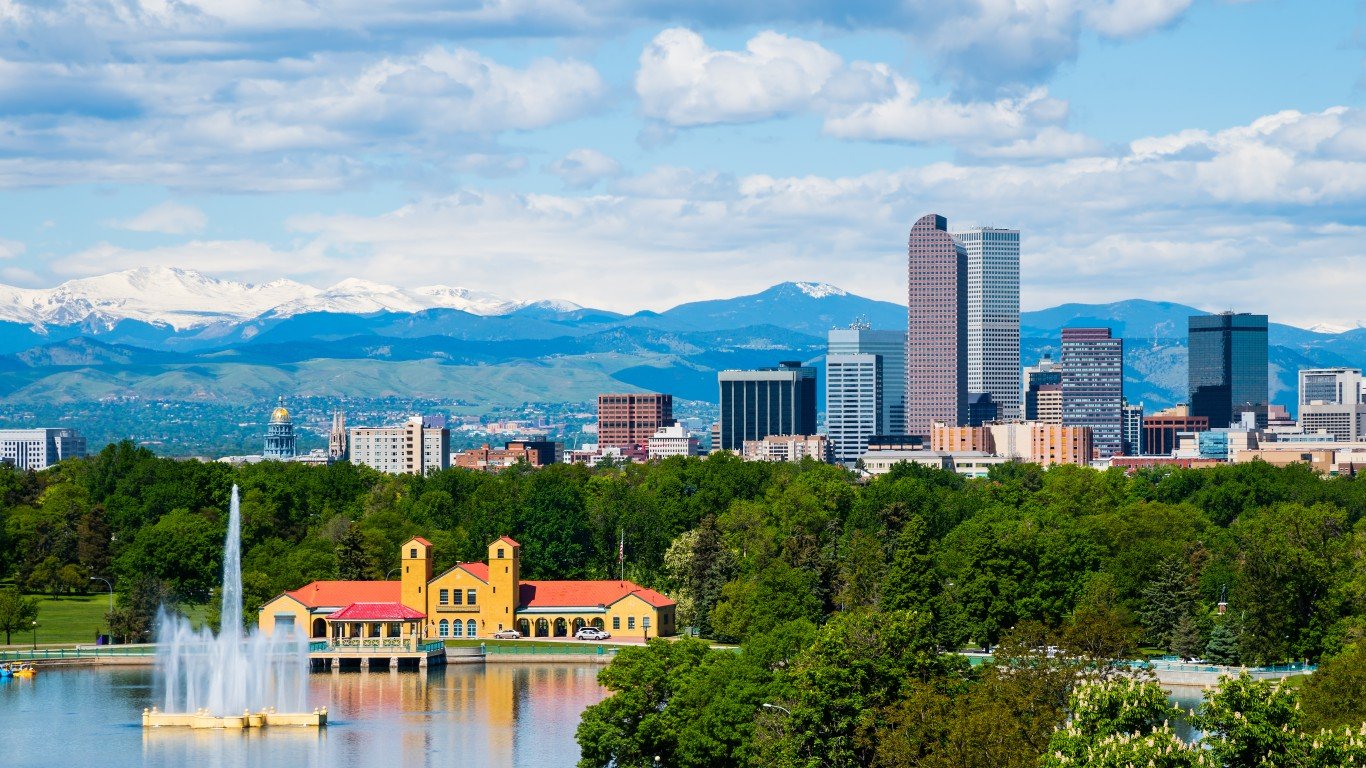
17. Denver, Colorado
> 50 yr. change in avg. summer high: +5.3 F
> 50 yr. change in avg. winter low: +5.0 F
> Avg. temp range in 2000: 21.5 F – 86.4 F
> Avg. temp range in 2050: 26.5 F – 91.7 F
> Current population: 704,621
[in-text-ad]
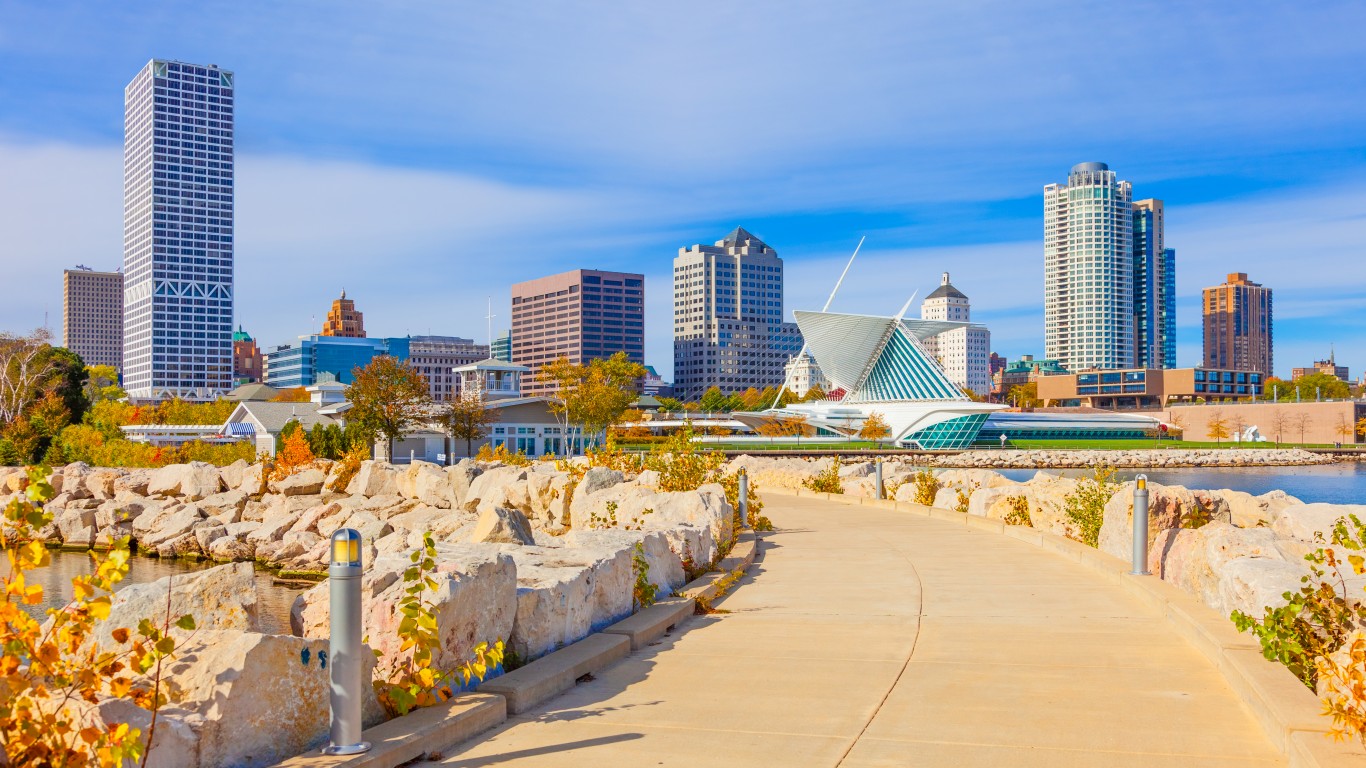
16. Milwaukee, Wisconsin
> 50 yr. change in avg. summer high: +5.4 F
> 50 yr. change in avg. winter low: +6.0 F
> Avg. temp range in 2000: 18.2 F – 81.8 F
> Avg. temp range in 2050: 24.1 F – 87.2 F
> Current population: 595,365
[recirclink id=488561]
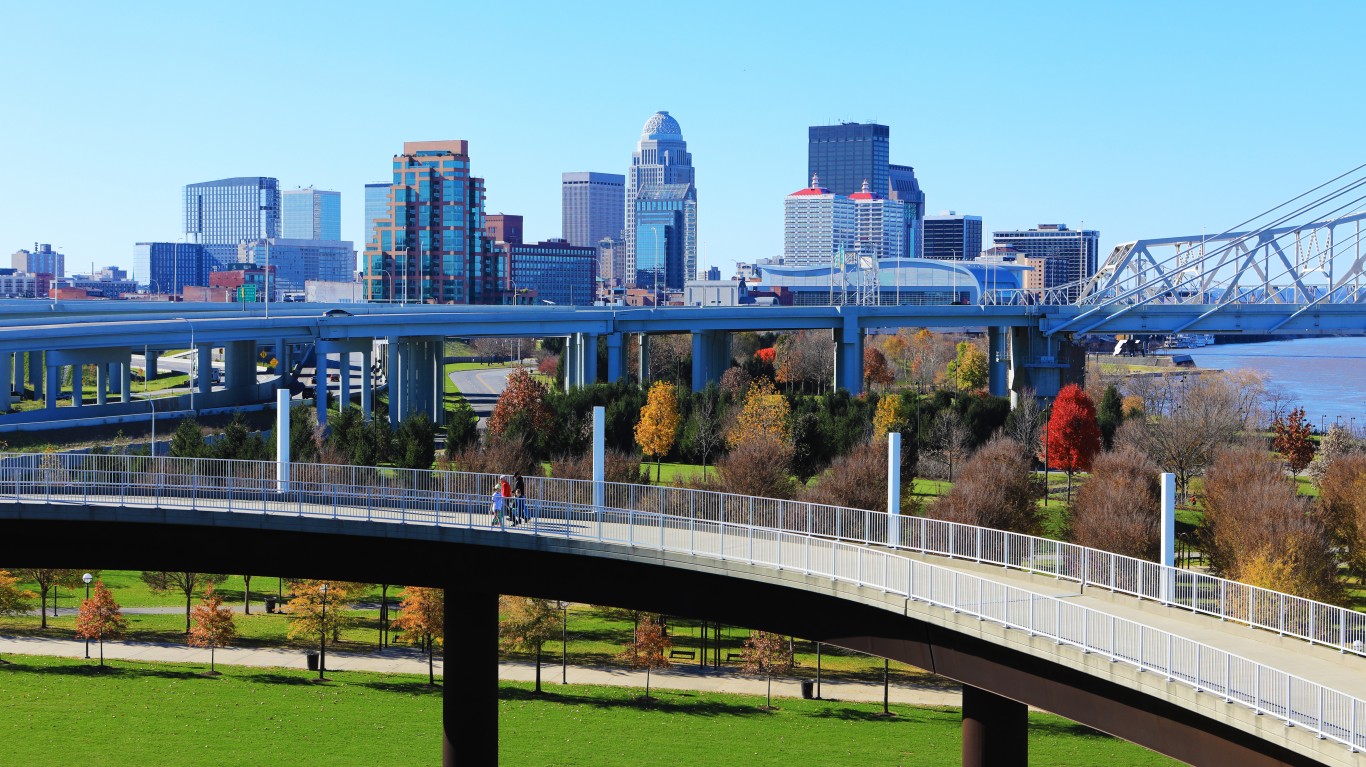
15. Louisville, Kentucky
> 50 yr. change in avg. summer high: +5.4 F
> 50 yr. change in avg. winter low: +4.0 F
> Avg. temp range in 2000: 28.9 F – 88.6 F
> Avg. temp range in 2050: 32.9 F – 94.0 F
> Current population: 621,337
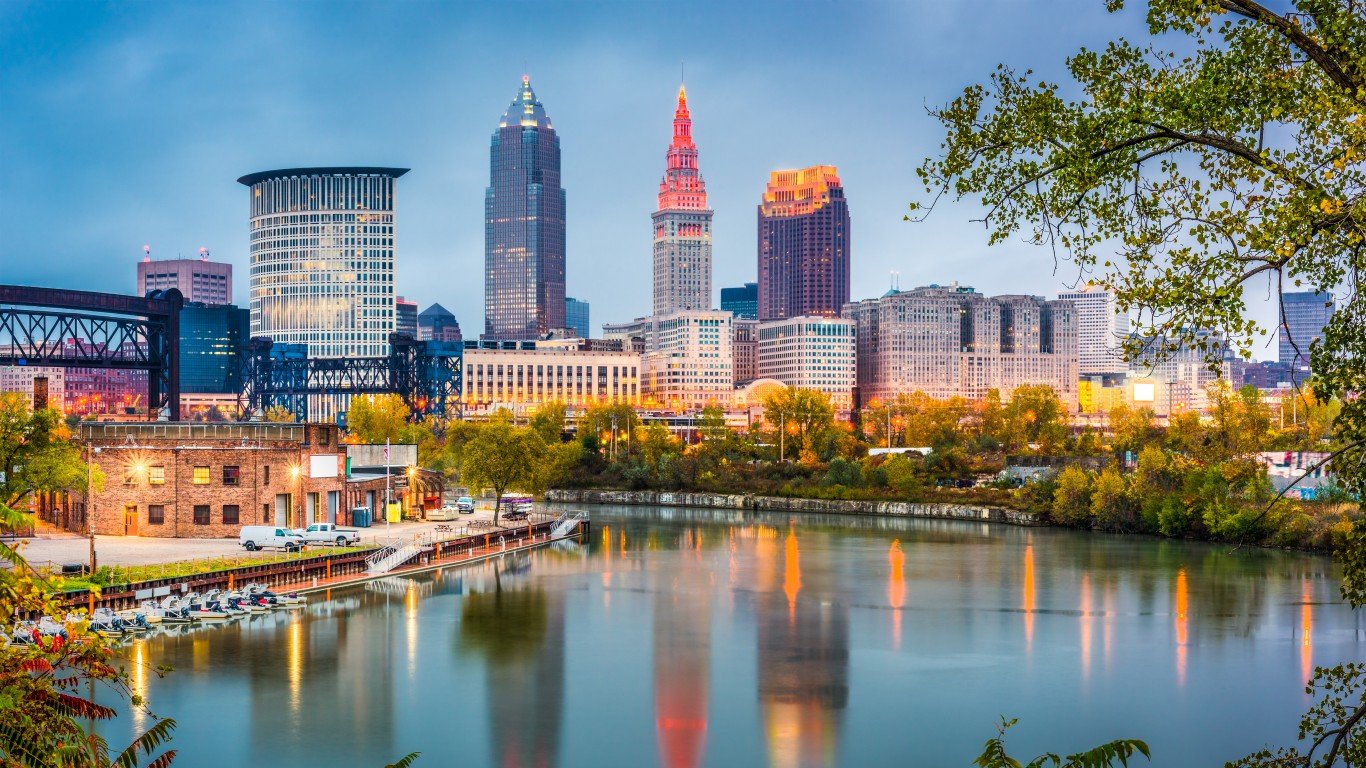
14. Cleveland, Ohio
> 50 yr. change in avg. summer high: +5.4 F
> 50 yr. change in avg. winter low: +5.3 F
> Avg. temp range in 2000: 23.0 F – 82.3 F
> Avg. temp range in 2050: 28.3 F – 87.7 F
> Current population: 385,552
[in-text-ad-2]
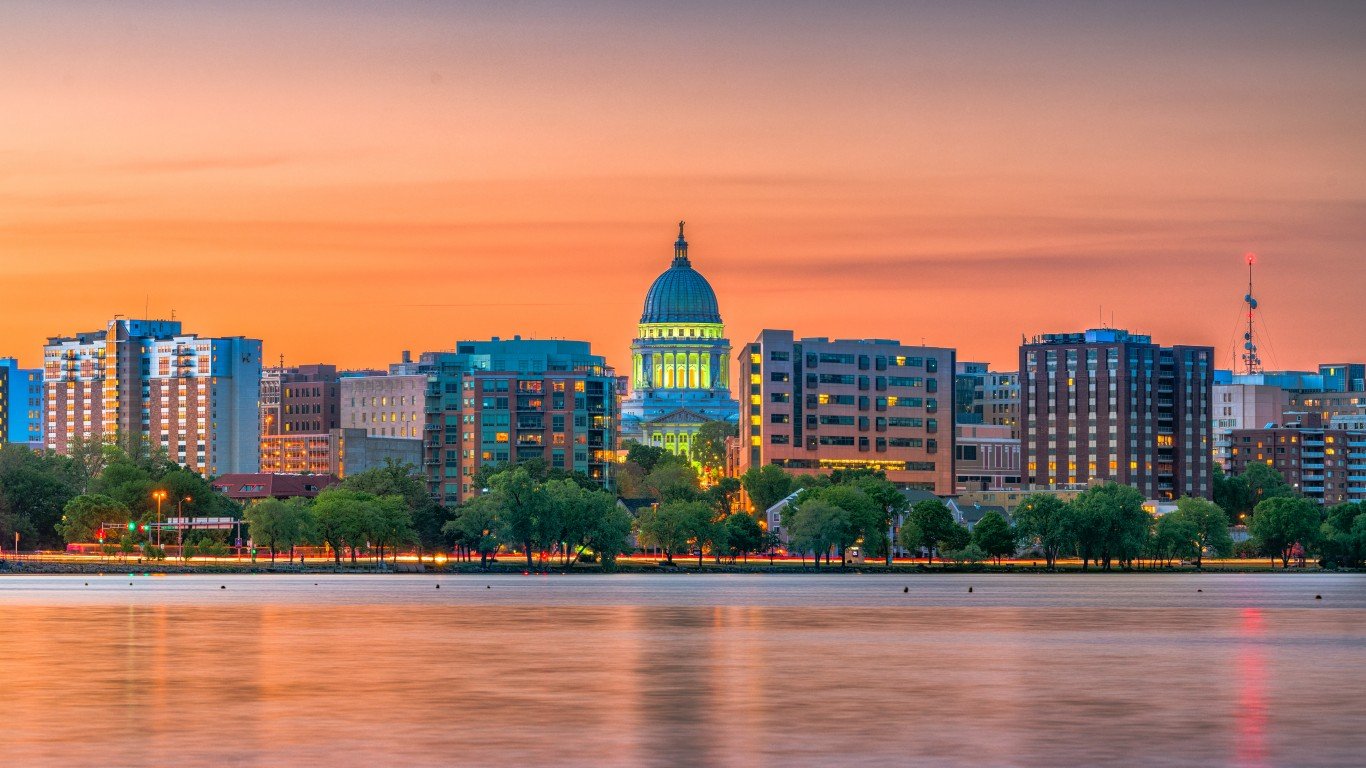
13. Madison, Wisconsin
> 50 yr. change in avg. summer high: +5.4 F
> 50 yr. change in avg. winter low: +6.6 F
> Avg. temp range in 2000: 13.3 F – 82.1 F
> Avg. temp range in 2050: 19.8 F – 87.5 F
> Current population: 255,239
12. Aurora, Colorado
> 50 yr. change in avg. summer high: +5.4 F
> 50 yr. change in avg. winter low: +4.7 F
> Avg. temp range in 2000: 19.2 F – 86.1 F
> Avg. temp range in 2050: 23.9 F – 91.6 F
> Current population: 367,250
[in-text-ad]
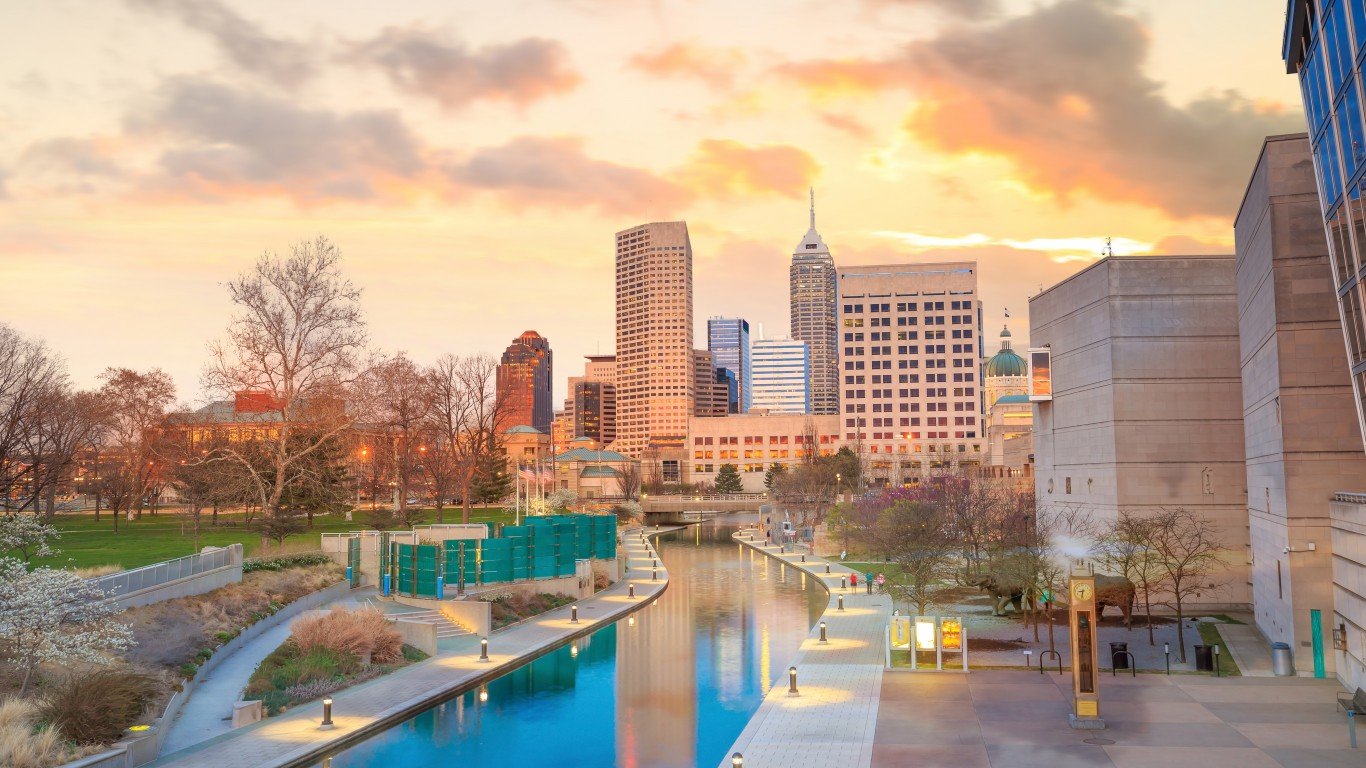
11. Indianapolis, Indiana
> 50 yr. change in avg. summer high: +5.4 F
> 50 yr. change in avg. winter low: +4.8 F
> Avg. temp range in 2000: 22.6 F – 85.2 F
> Avg. temp range in 2050: 27.4 F – 90.6 F
> Current population: 857,386
[recirclink id=488514]
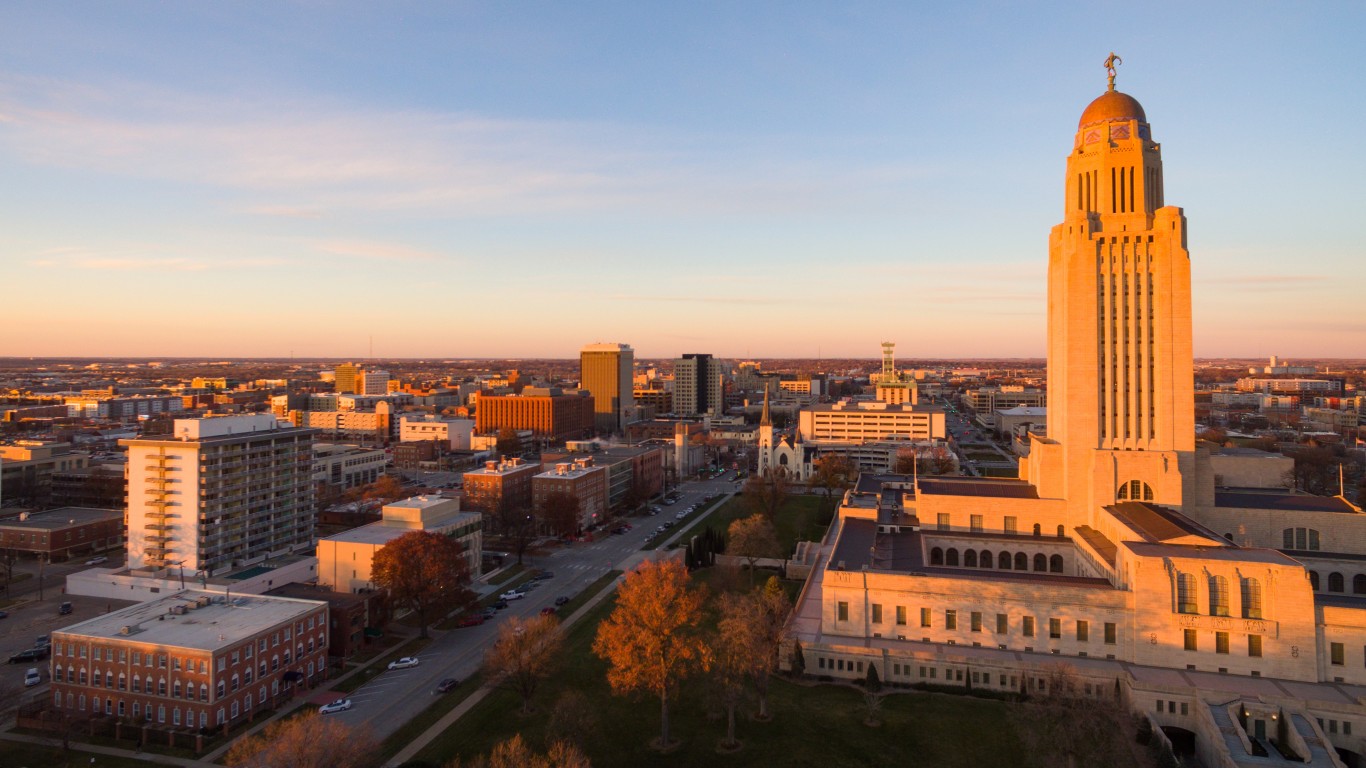
10. Lincoln, Nebraska
> 50 yr. change in avg. summer high: +5.5 F
> 50 yr. change in avg. winter low: +4.8 F
> Avg. temp range in 2000: 17.5 F – 87.8 F
> Avg. temp range in 2050: 22.2 F – 93.2 F
> Current population: 284,734
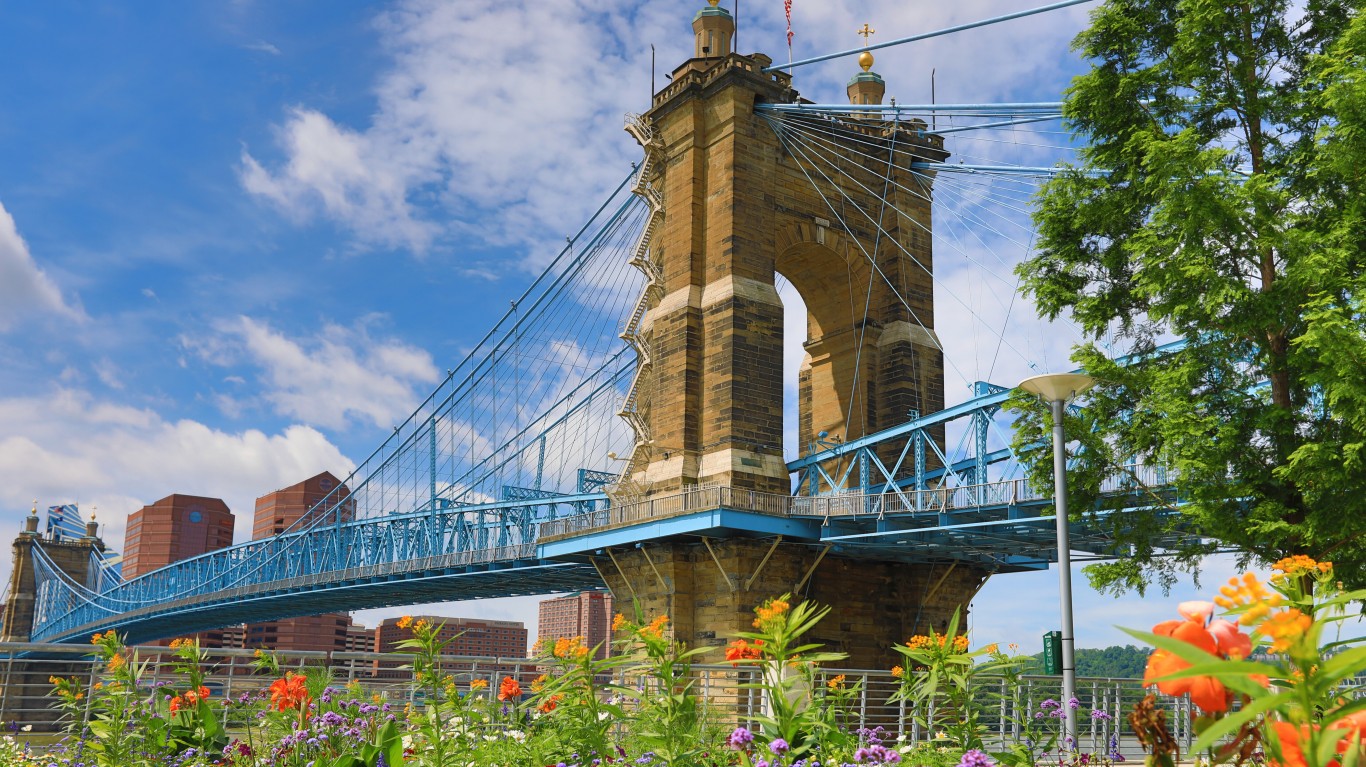
9. Cincinnati, Ohio
> 50 yr. change in avg. summer high: +5.5 F
> 50 yr. change in avg. winter low: +4.1 F
> Avg. temp range in 2000: 26.6 F – 86.9 F
> Avg. temp range in 2050: 30.7 F – 92.3 F
> Current population: 301,305
[in-text-ad-2]
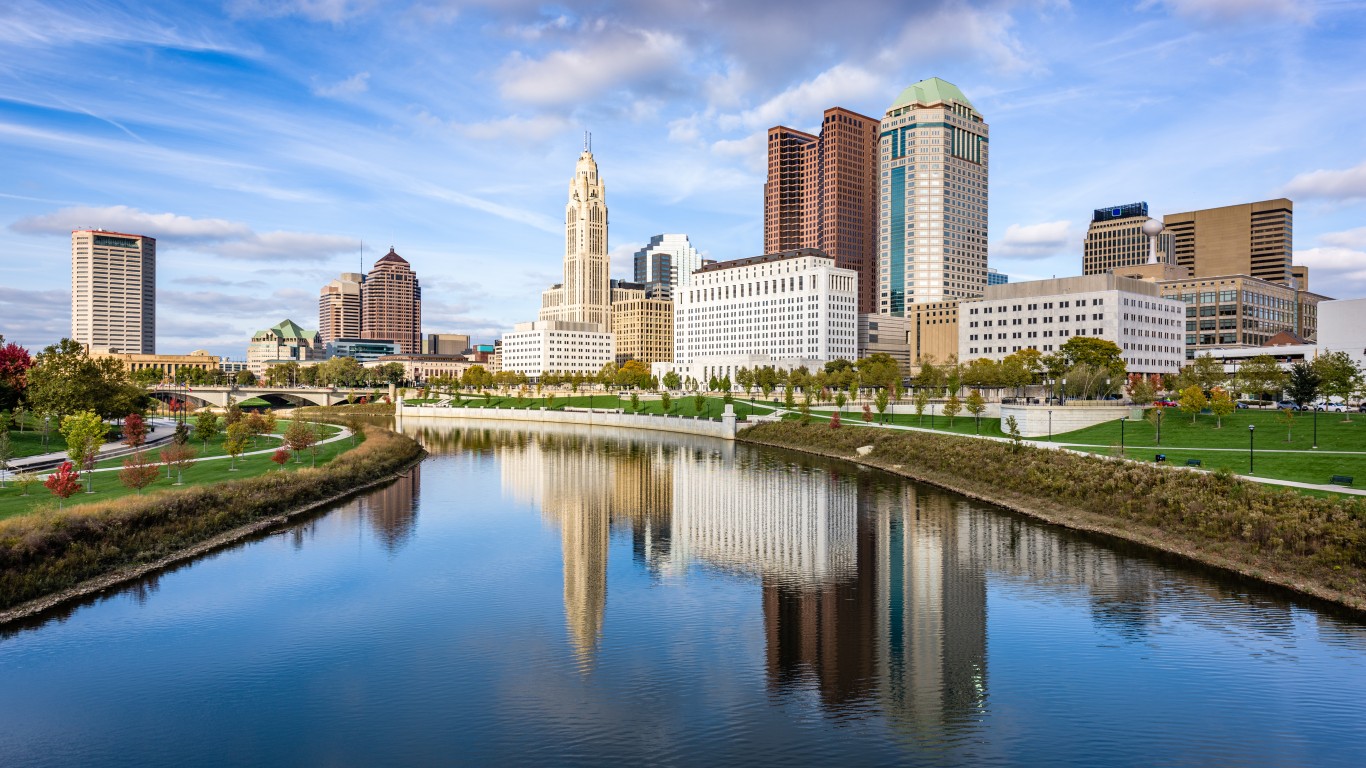
8. Columbus, Ohio
> 50 yr. change in avg. summer high: +5.5 F
> 50 yr. change in avg. winter low: +4.4 F
> Avg. temp range in 2000: 24.3 F – 84.8 F
> Avg. temp range in 2050: 28.8 F – 90.3 F
> Current population: 881,901
7. Lexington-Fayette, Kentucky
> 50 yr. change in avg. summer high: +5.6 F
> 50 yr. change in avg. winter low: +3.9 F
> Avg. temp range in 2000: 26.8 F – 85.9 F
> Avg. temp range in 2050: 30.7 F – 91.5 F
> Current population: 321,959
[in-text-ad]
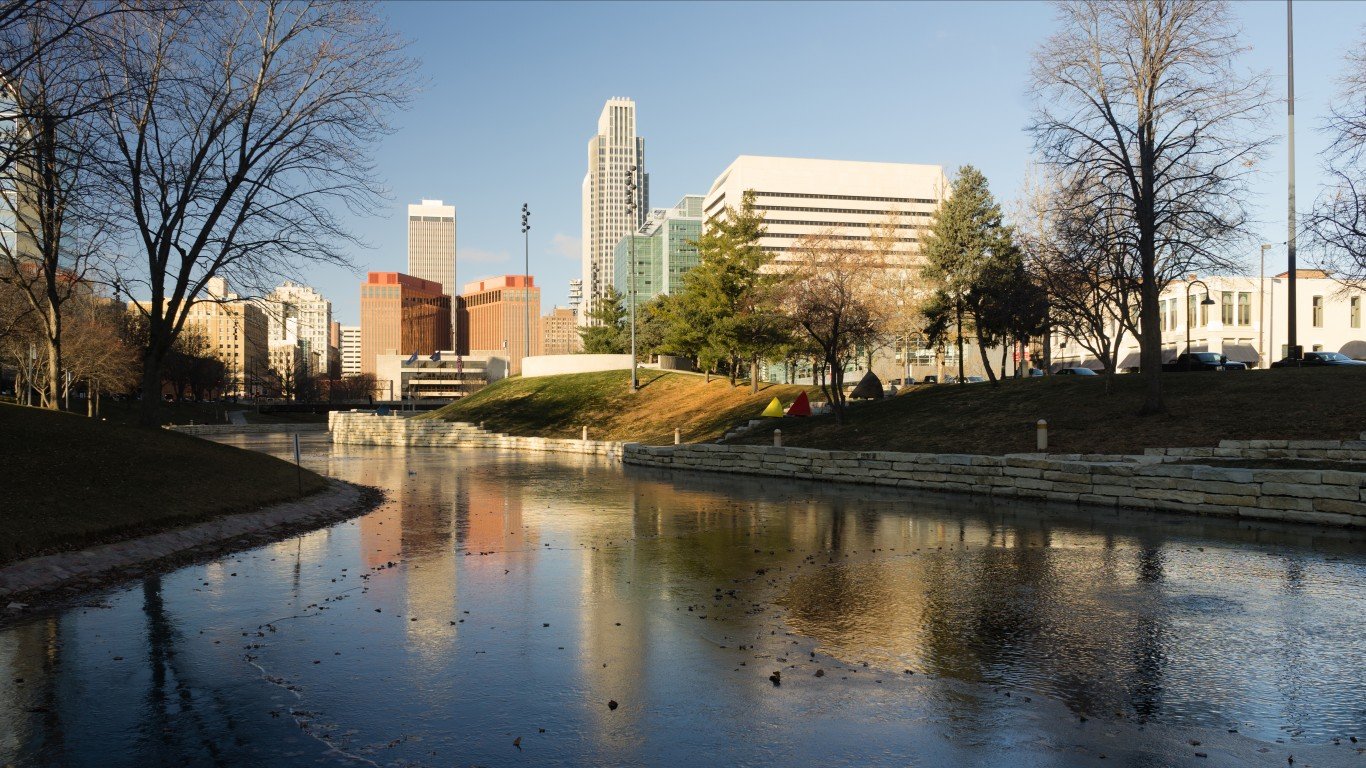
6. Omaha, Nebraska
> 50 yr. change in avg. summer high: +5.6 F
> 50 yr. change in avg. winter low: +5.2 F
> Avg. temp range in 2000: 16.4 F – 85.8 F
> Avg. temp range in 2050: 21.6 F – 91.4 F
> Current population: 466,903
[recirclink id=488498]
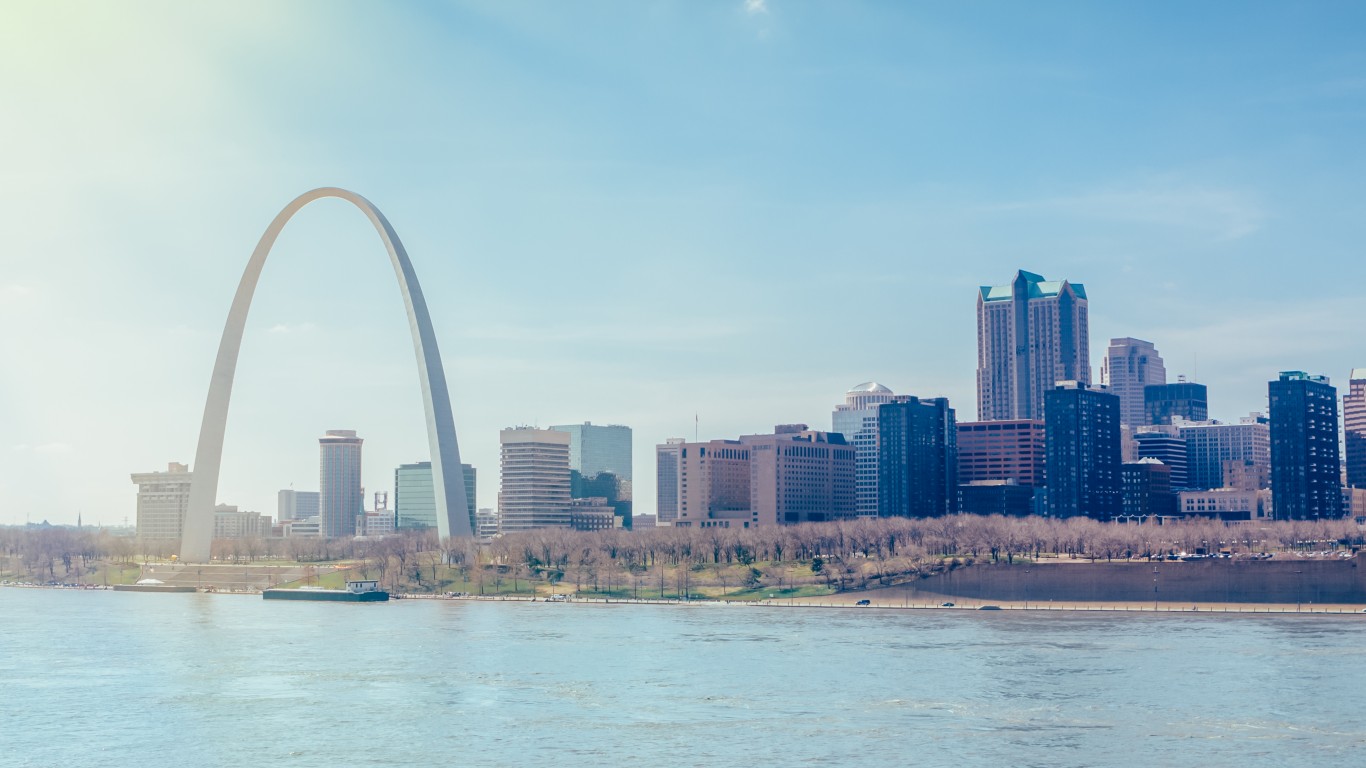
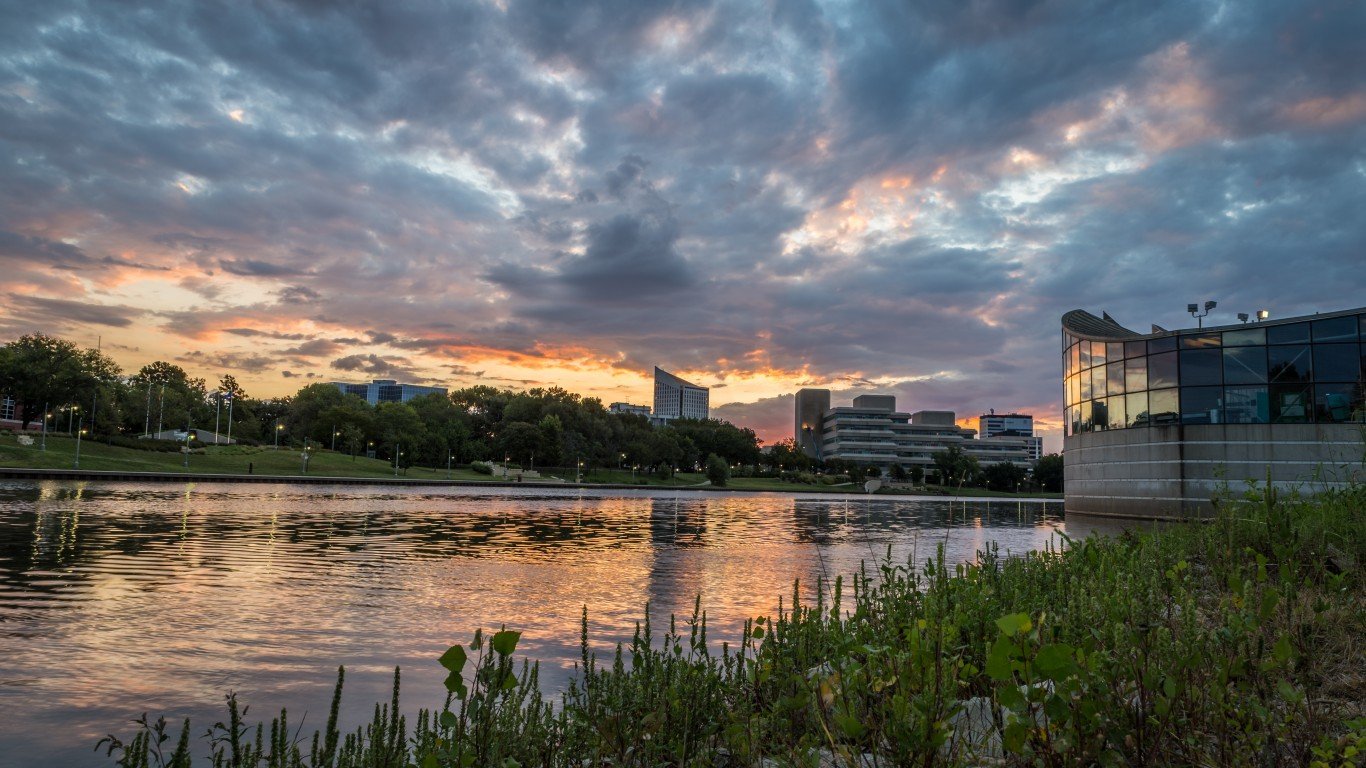
5. St. Louis, Missouri
> 50 yr. change in avg. summer high: +5.6 F
> 50 yr. change in avg. winter low: +4.5 F
> Avg. temp range in 2000: 25.2 F – 88.5 F
> Avg. temp range in 2050: 29.7 F – 94.2 F
> Current population: 308,626
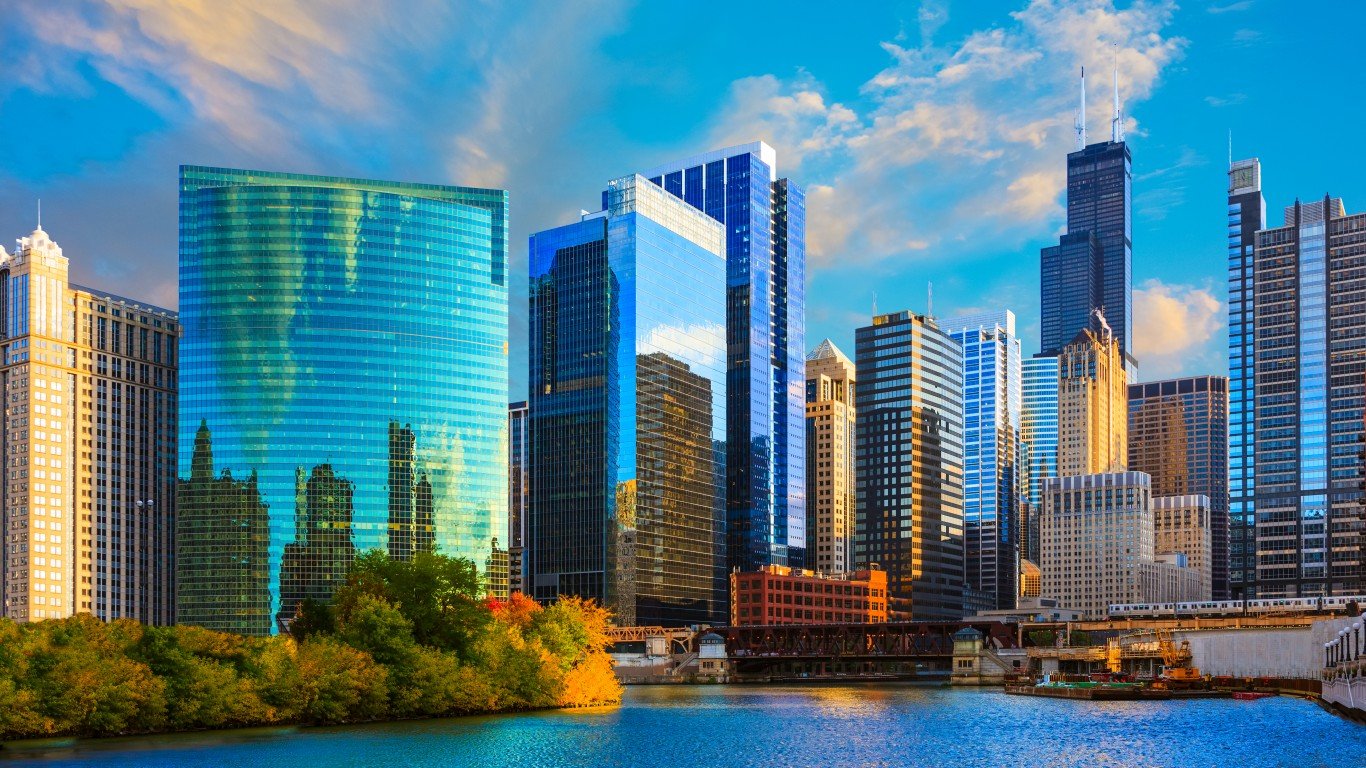
4. Chicago, Illinois
> 50 yr. change in avg. summer high: +5.6 F
> 50 yr. change in avg. winter low: +5.8 F
> Avg. temp range in 2000: 21.2 F – 83.5 F
> Avg. temp range in 2050: 27.0 F – 89.2 F
> Current population: 2,716,462
[in-text-ad-2]
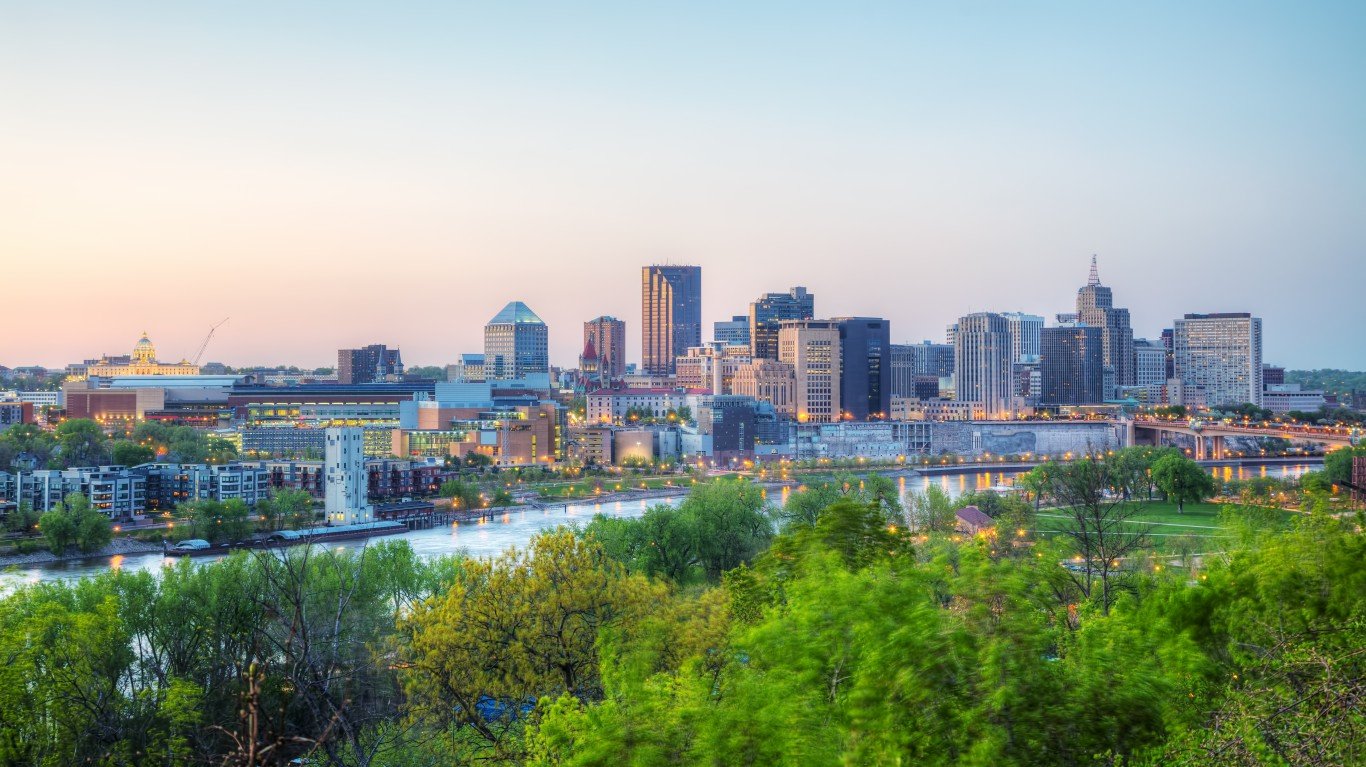
3. St. Paul, Minnesota
> 50 yr. change in avg. summer high: +5.7 F
> 50 yr. change in avg. winter low: +6.8 F
> Avg. temp range in 2000: 9.9 F – 82.7 F
> Avg. temp range in 2050: 16.7 F – 88.3 F
> Current population: 306,604
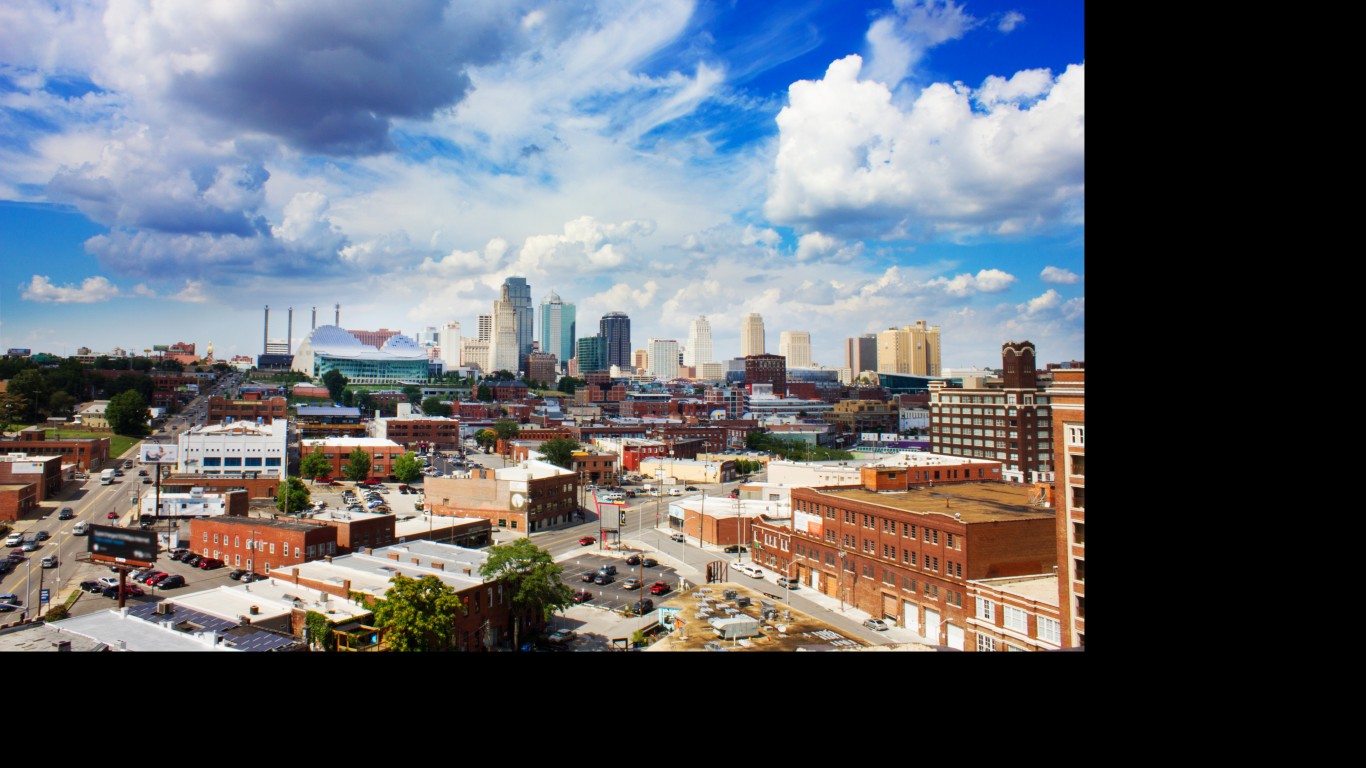
2. Kansas City, Missouri
> 50 yr. change in avg. summer high: +5.8 F
> 50 yr. change in avg. winter low: +4.9 F
> Avg. temp range in 2000: 24.1 F – 88.7 F
> Avg. temp range in 2050: 29.1 F – 94.5 F
> Current population: 488,825
[in-text-ad]
1. Fort Wayne, Indiana
> 50 yr. change in avg. summer high: +5.8 F
> 50 yr. change in avg. winter low: +5.3 F
> Avg. temp range in 2000: 20.4 F – 83.9 F
> Avg. temp range in 2050: 25.8 F – 89.7 F
> Current population: 254,796
Contact [email protected] for any questions or corrections.