With the exception of the small European country of Monaco, the United States has more cars per capita than every other country in the world. For better or worse, the United States is a country uniquely dependent on the personal automobile. Driving, while a practical necessity for millions of Americans, can also be a financial burden, a major cause of stress — and also a dangerous activity.
On every road in the country, driving comes with a set of inherent risks and costs. Congested roads, high gas prices, and fatal collisions caused by distracted or drunk drivers are but a few. While drivers accept these road conditions, potential hazards, and costs when they get behind the wheel, not all cities are equally safe or congested, and some are certainly more expensive for drivers than others.
24/7 Wall St. created an index composed of several driving-related measures to identify the worst metropolitan statistical area to drive in each state. The components of the index — which include average commute time, gas prices, and accident rates — were selected to capture an area’s safety, convenience, and cost of driving.
Just because a metro area ranks as the worst place to drive in a given state does not necessarily mean it compares poorly to the nation as a whole. For example, 21 cities on this list have a lower per capita roadway fatality rate than the national rate of 11.4 deaths per 100,000 Americans. The cities on this list in Delaware, New Hampshire, Rhode Island, and Vermont also rank as the worst by default as they are the only metro area in the state.
Click here to read about the worst cities to drive in every state.
To identify the worst cities to drive in every state, 24/7 Wall St. created an index based on measures of safety, cost, and the convenience of driving, normalized to be comparable with one another. Total fatalities and traffic fatalities involving drunk drivers per 100,000, is from the Fatality Analysis Reporting System (FARS) for 2017. Mean travel time to work and the percentage of the working-age population with a commute of 60 minutes or longer came from the American Community Survey (ACS) 2017 1-year estimates. The rate of car theft per 100,000 people is from the National Insurance Crime Bureau (NICB) Hot Spots report for the year 2017. The average price of gasoline from Q2 2017 to Q2 2018 is from the Council for Community and Economic Research’s (C2ER) cost of living index for metropolitan statistical areas.
Source: James-Allen / Getty Images
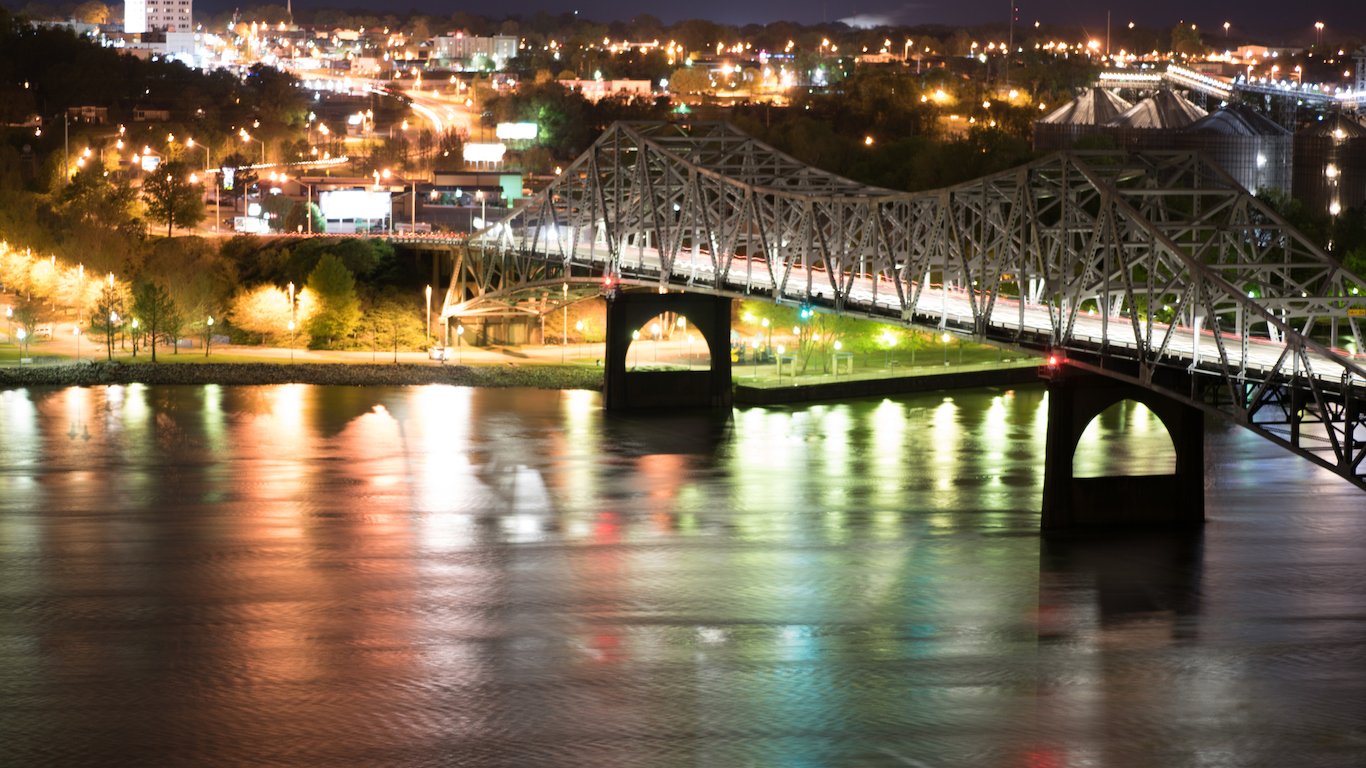
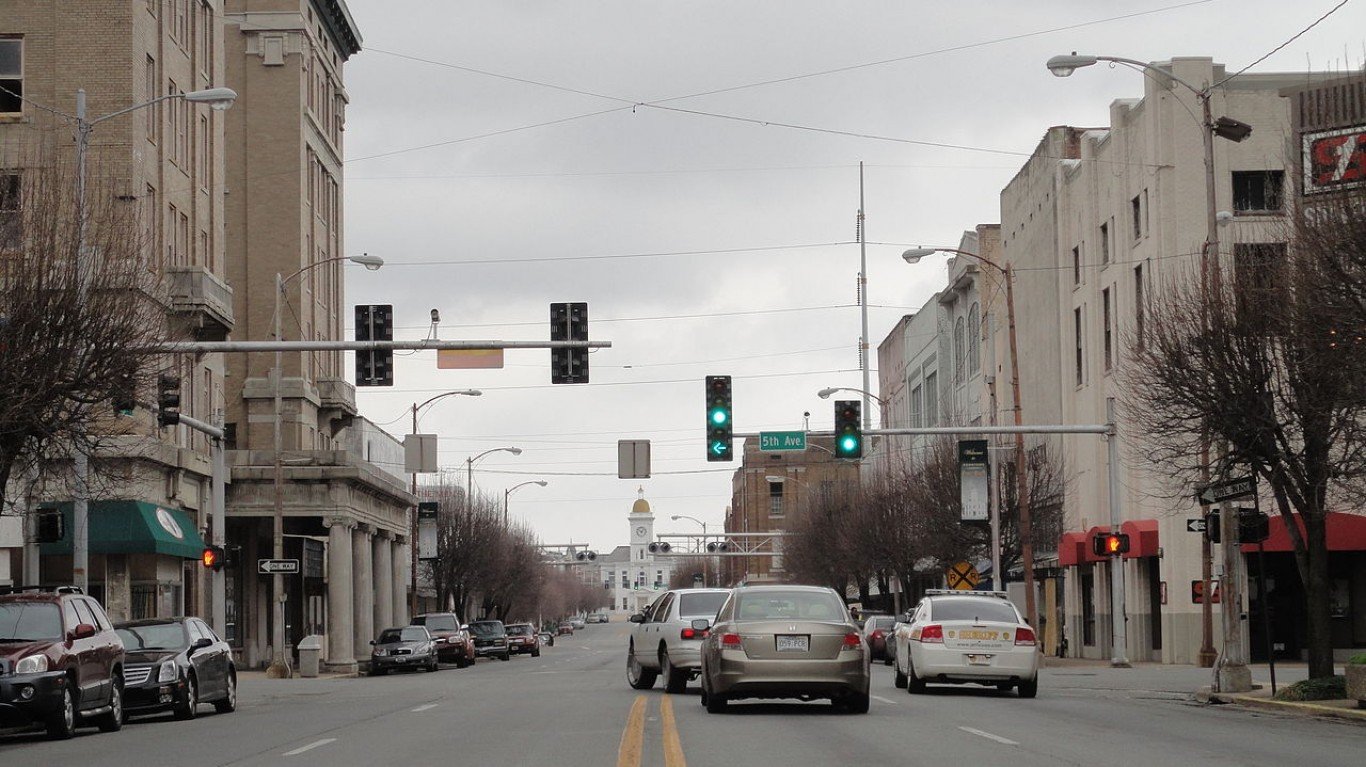
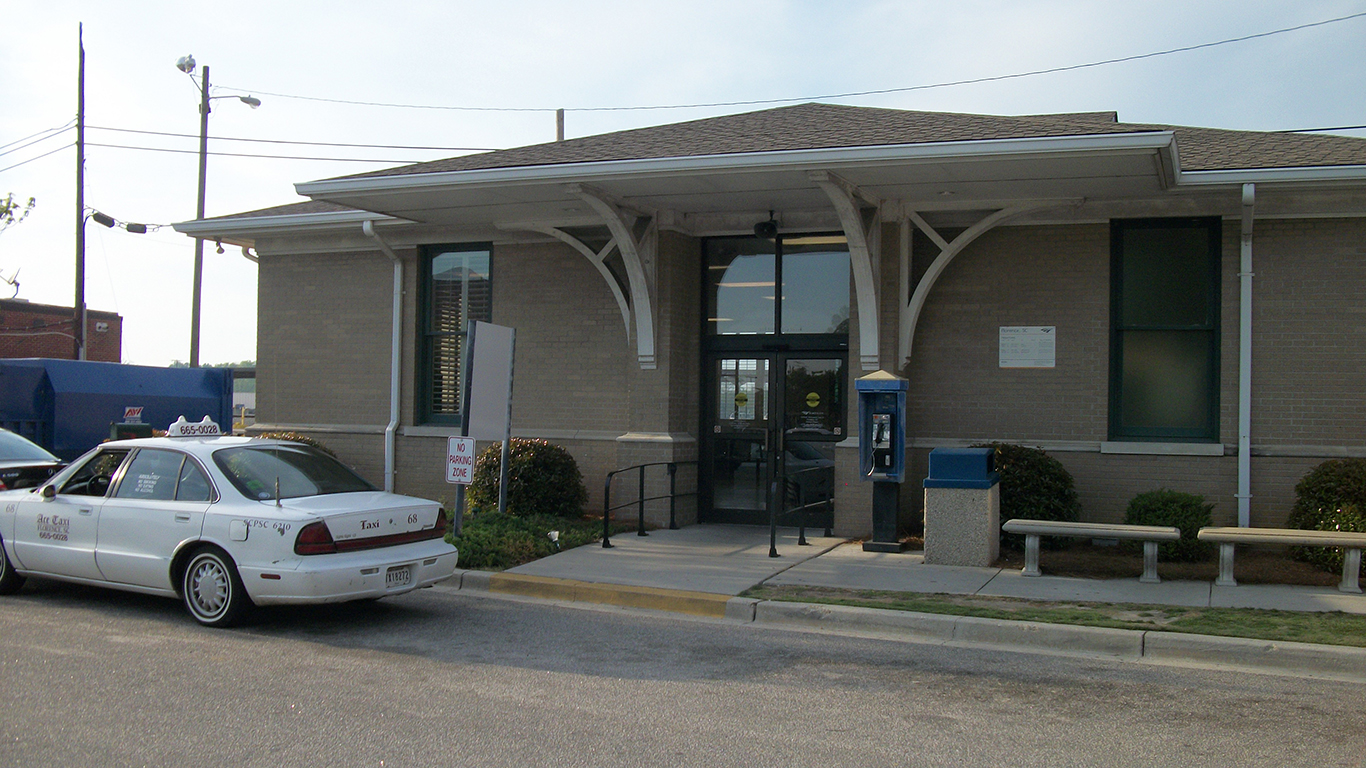
Alabama: Florence-Muscle Shoals
> Traffic fatalities per 100,000 people: 23.8 (state: 19.4)
> Avg. commute time: 23.7 min. (state: 24.6 min.)
> Commuters driving to work: 95.8% (state: 94.2%)
> 2017 car thefts per 100,000 people: 242.8
[in-text-ad]
Source: yenwen / Getty Images
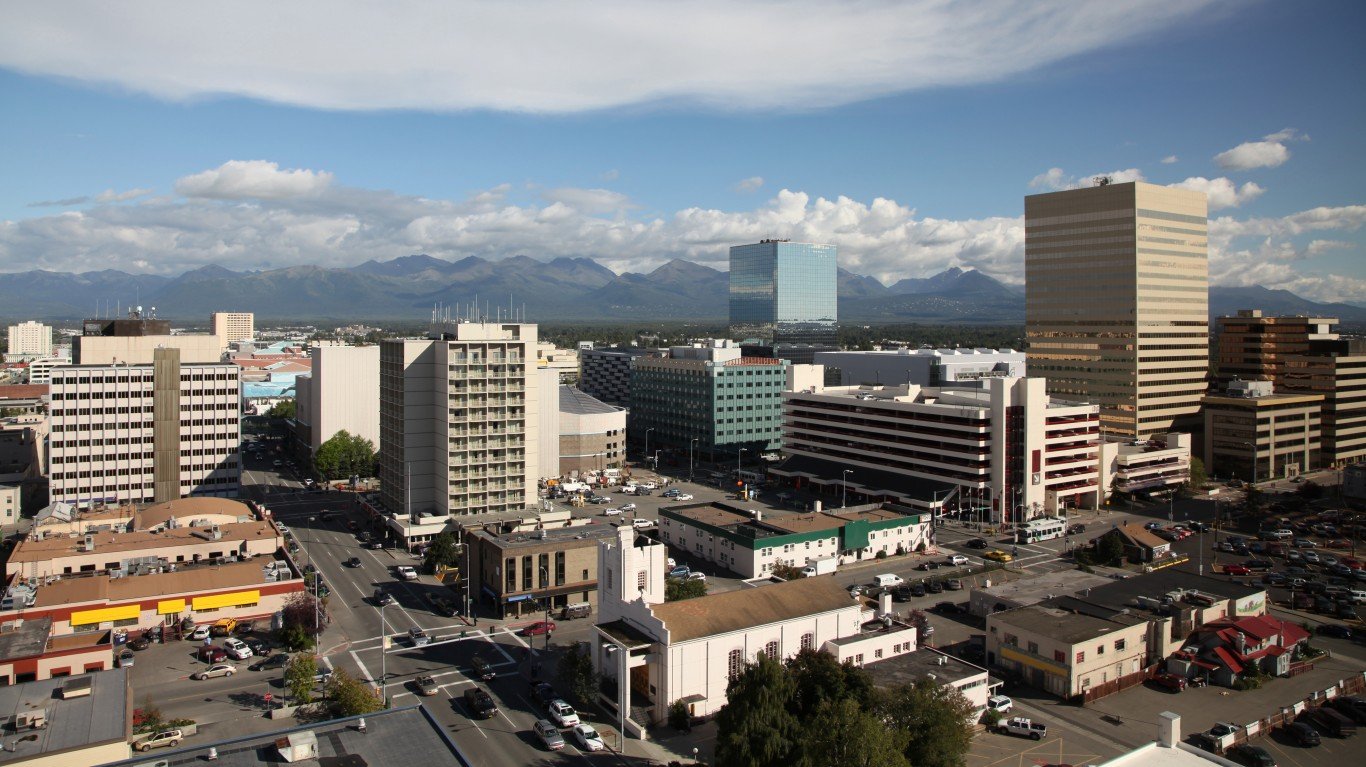
Alaska: Anchorage
> Traffic fatalities per 100,000 people: 9.7 (state: 10.7)
> Avg. commute time: 22.1 min. (state: 19.6 min.)
> Commuters driving to work: 87.0% (state: 81.1%)
> 2017 car thefts per 100,000 people: 816.7
 24/7 Wall St.
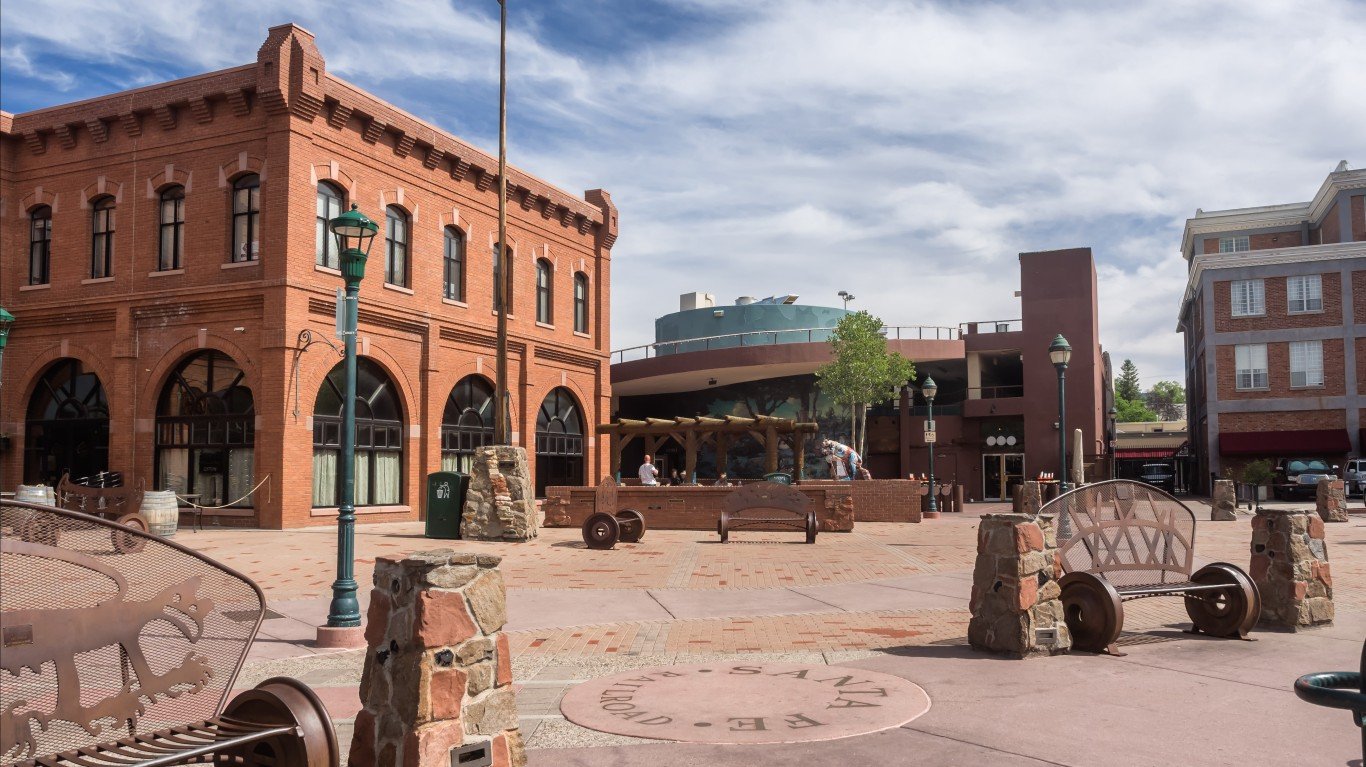
Source: frankix / Getty Images
Arizona: Flagstaff
> Traffic fatalities per 100,000 people: 33.4 (state: 14.3)
> Avg. commute time: 18.4 min. (state: 25.6 min.)
> Commuters driving to work: 81.5% (state: 87.5%)
> 2017 car thefts per 100,000 people: 142.1
Source: Paul Sableman (Flickr user: pasa47) / Wikimedia Commons
Arkansas: Pine Bluff
> Traffic fatalities per 100,000 people: 22.2 (state: 16.4)
> Avg. commute time: 22.2 min. (state: 21.6 min.)
> Commuters driving to work: N/A (state: 93.2%)
> 2017 car thefts per 100,000 people: 355.1
[in-text-ad-2]

Source: DenisTangneyJr / Getty Images
California: Stockton-Lodi
> Traffic fatalities per 100,000 people: 15.6 (state: 9.1)
> Avg. commute time: 32 min. (state: 29.8 min.)
> Commuters driving to work: 92.4% (state: 83.9%)
> 2017 car thefts per 100,000 people: 613.7
Source: Billy Hathorn / Wikimedia Commons
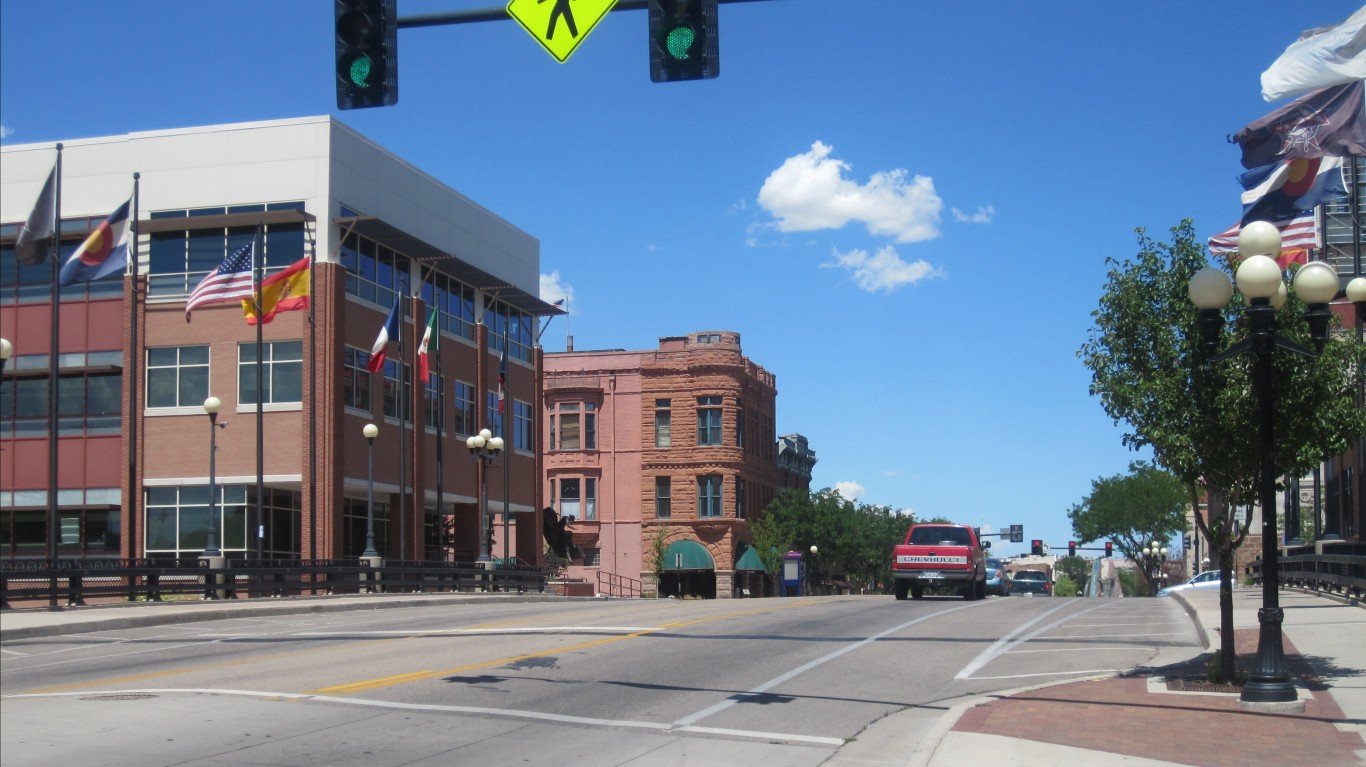
Colorado: Pueblo
> Traffic fatalities per 100,000 people: 20.4 (state: 11.6)
> Avg. commute time: 21.8 min. (state: 25.9 min.)
> Commuters driving to work: 94.1% (state: 83.4%)
> 2017 car thefts per 100,000 people: 812.7
[in-text-ad]
Source: Courtesy of JJBers via Flickr
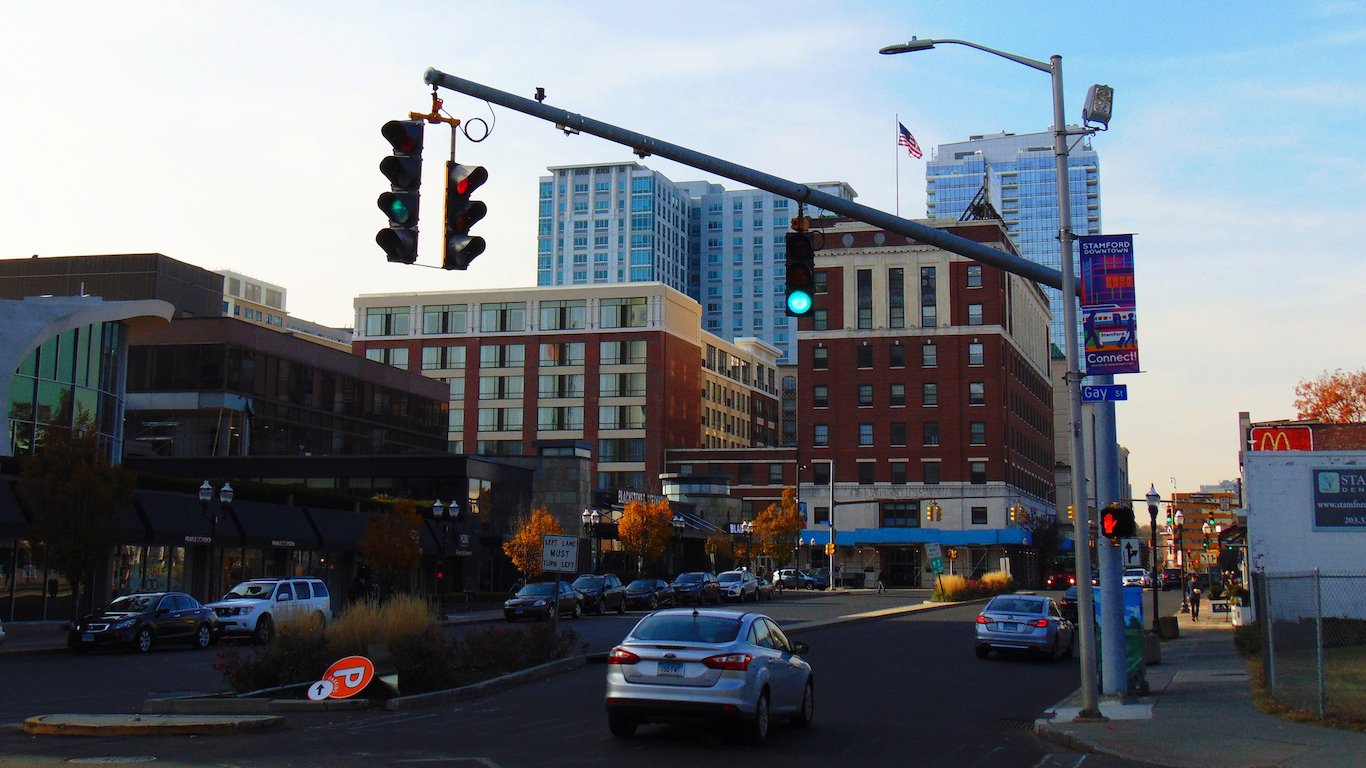
Connecticut: Bridgeport-Stamford-Norwalk
> Traffic fatalities per 100,000 people: 6.2 (state: 7.7)
> Avg. commute time: 30.4 min. (state: 26.4 min.)
> Commuters driving to work: 80.2% (state: 86.1%)
> 2017 car thefts per 100,000 people: 185.1
Source: traveler1116 / Getty Images
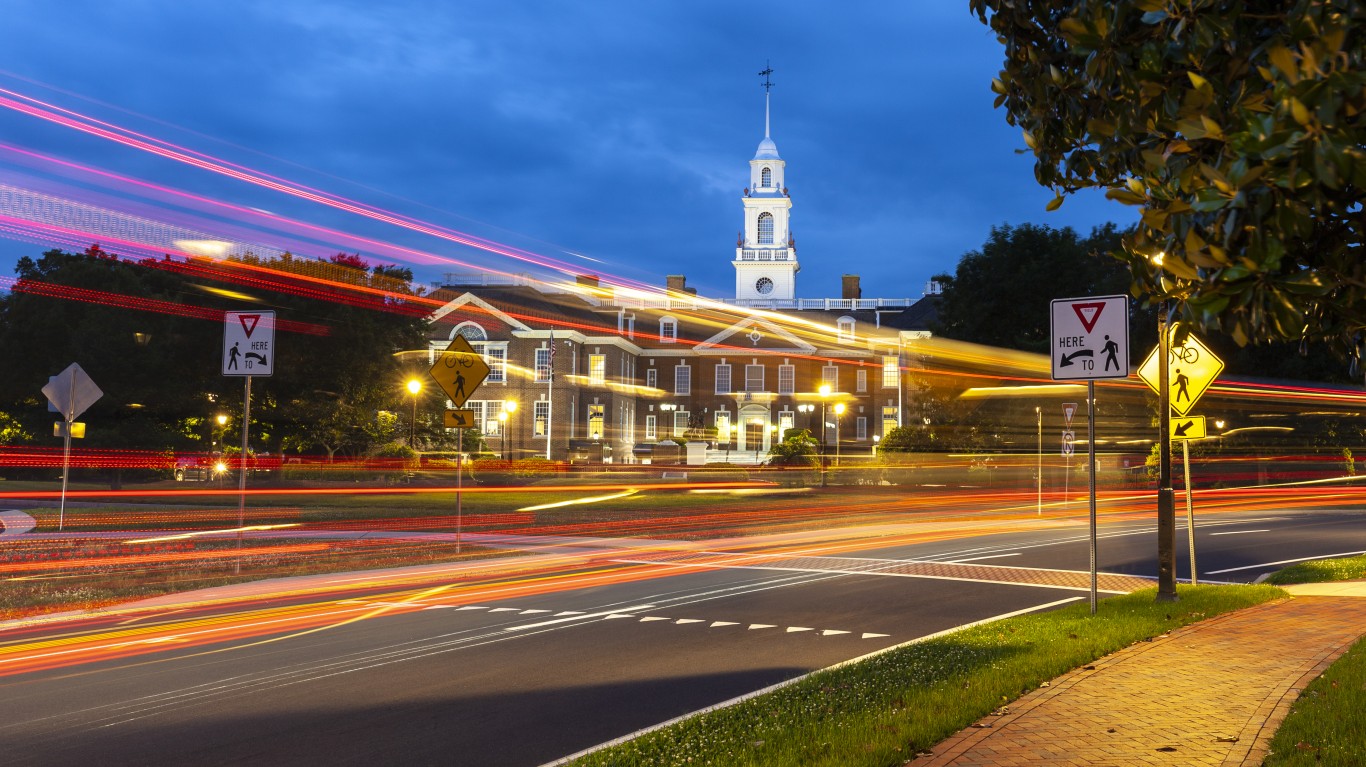
Delaware: Dover
> Traffic fatalities per 100,000 people: 11.9 (state: 12.4)
> Avg. commute time: 26.3 min. (state: 26.5 min.)
> Commuters driving to work: 90.2% (state: 89.2%)
> 2017 car thefts per 100,000 people: 100.1
Source: Michael Warren / Getty Images
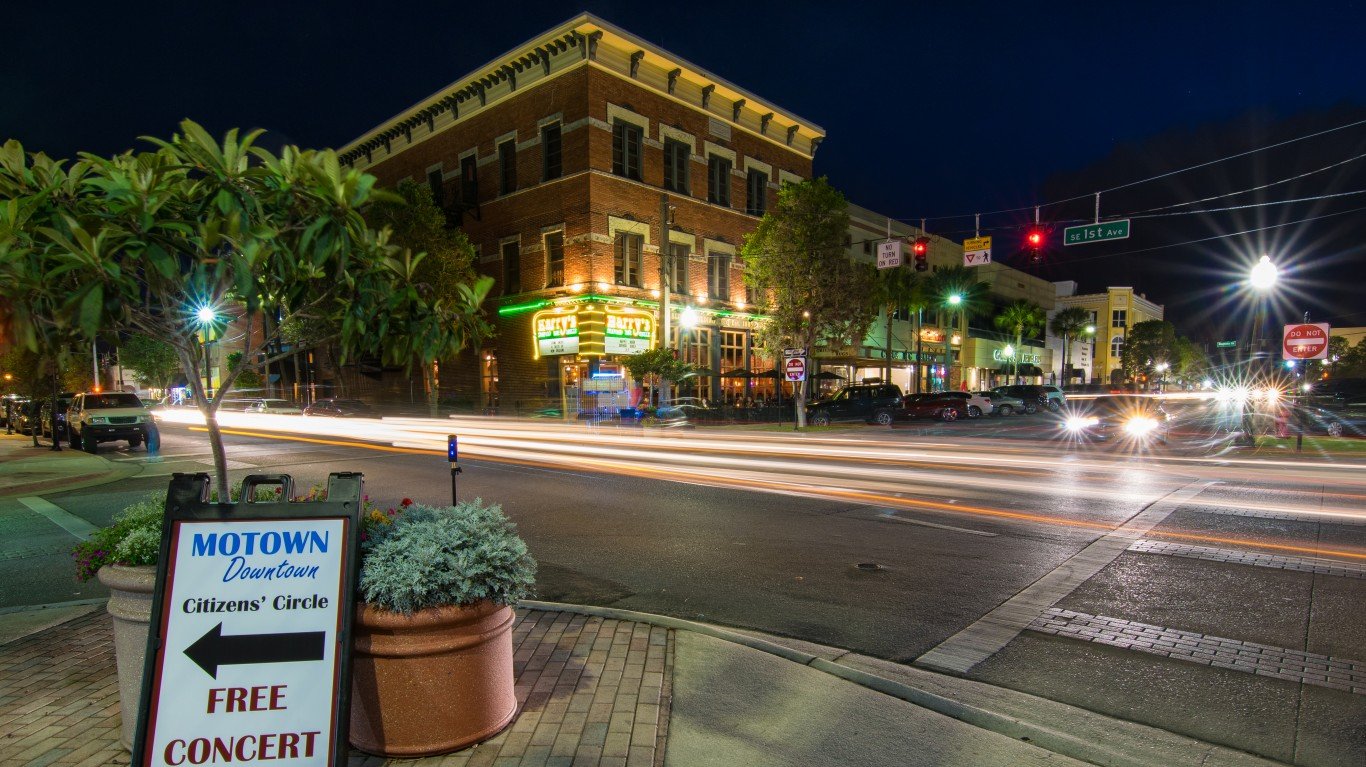
Florida: Ocala
> Traffic fatalities per 100,000 people: 25.4 (state: 14.8)
> Avg. commute time: 25.4 min. (state: 27.8 min.)
> Commuters driving to work: 90.0% (state: 88.4%)
> 2017 car thefts per 100,000 people: 224.6
[in-text-ad-2]
Source: SeanPavonePhoto / Getty Images
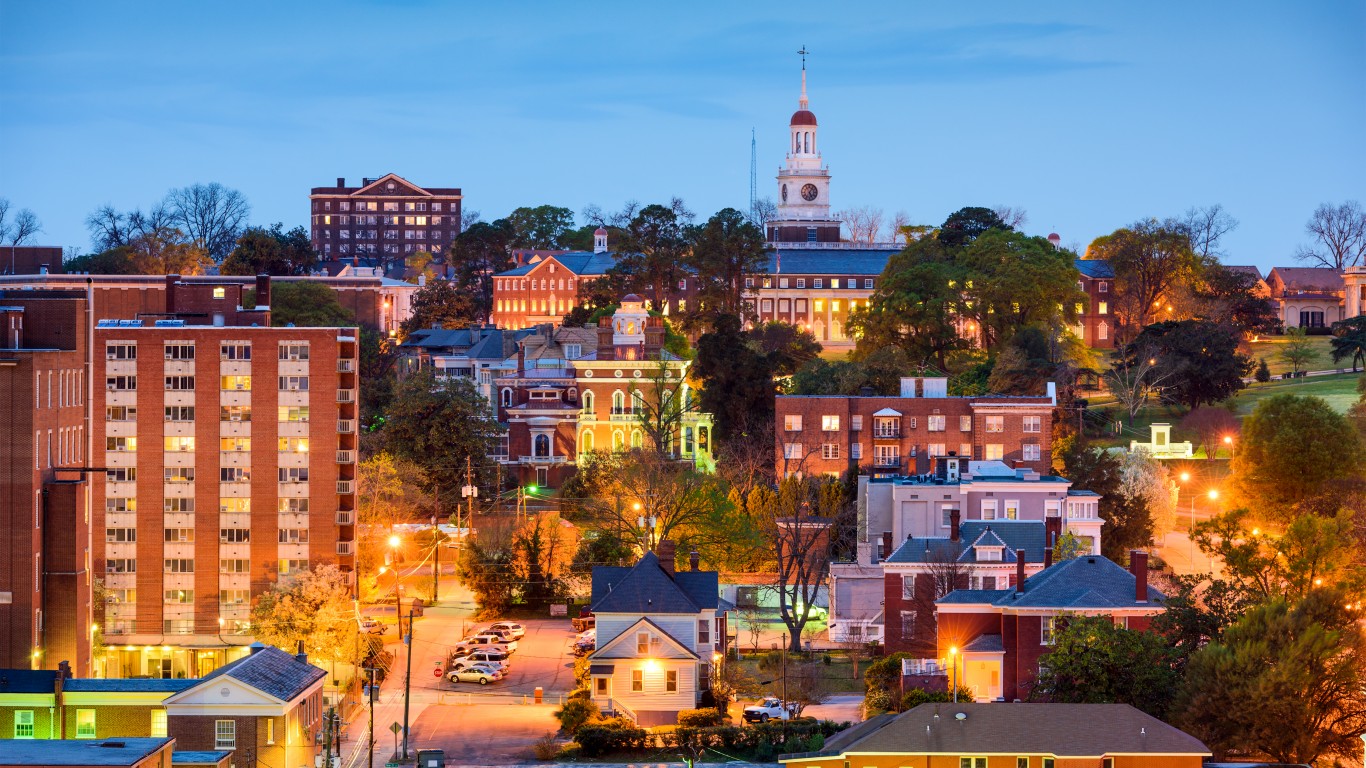
Georgia: Macon
> Traffic fatalities per 100,000 people: 28.4 (state: 14.8)
> Avg. commute time: 23.2 min. (state: 28.8 min.)
> Commuters driving to work: 93.8% (state: 88.6%)
> 2017 car thefts per 100,000 people: 318.9

Source: Mlenny / Getty Images
Hawaii: Urban Honolulu
> Traffic fatalities per 100,000 people: 5.0 (state: 7.5)
> Avg. commute time: 29.1 min. (state: 27 min.)
> Commuters driving to work: 78.0% (state: 80.8%)
> 2017 car thefts per 100,000 people: 272.8
[in-text-ad]
Source: jolevine / Flickr
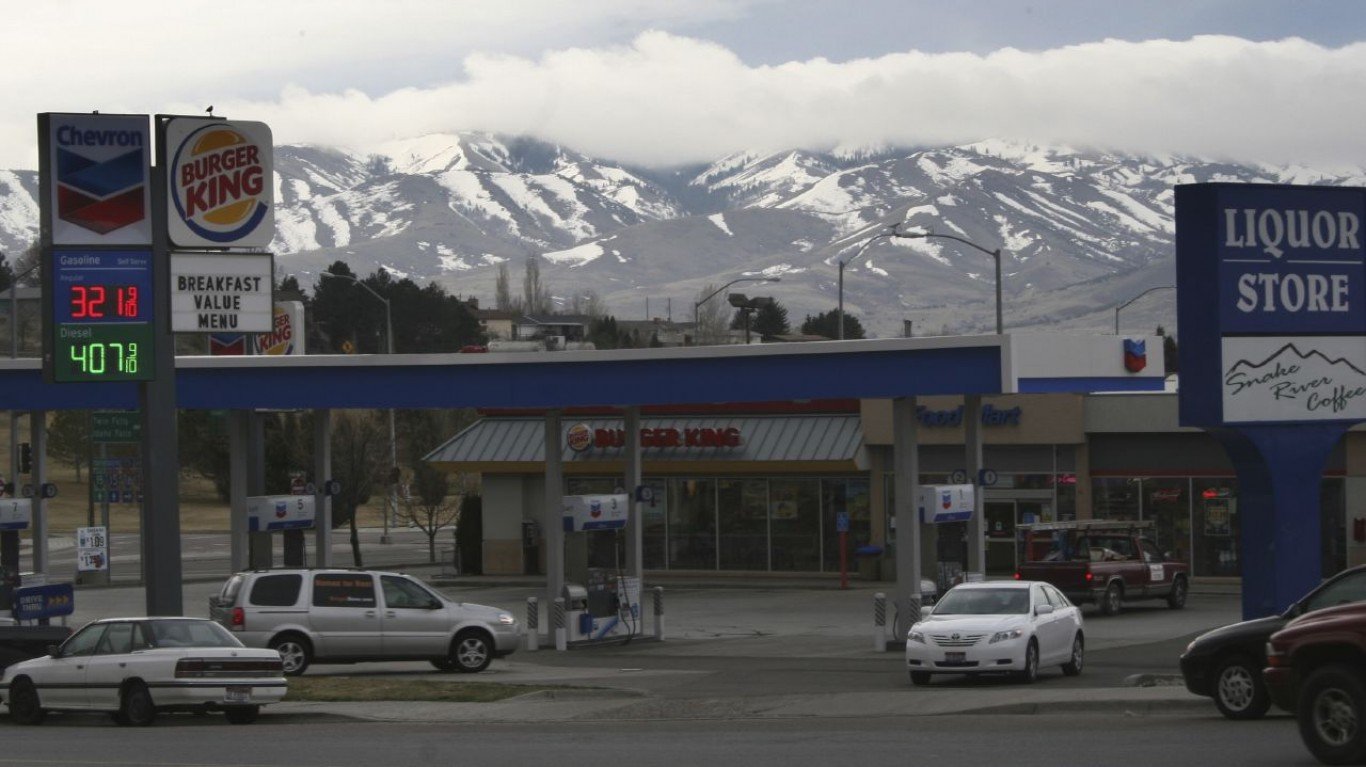
Idaho: Pocatello
> Traffic fatalities per 100,000 people: 15.2 (state: 14.2)
> Avg. commute time: 17.6 min. (state: 21 min.)
> Commuters driving to work: 87.0% (state: 89.3%)
> 2017 car thefts per 100,000 people: 174.7
Source: Scott Olson / Getty Images
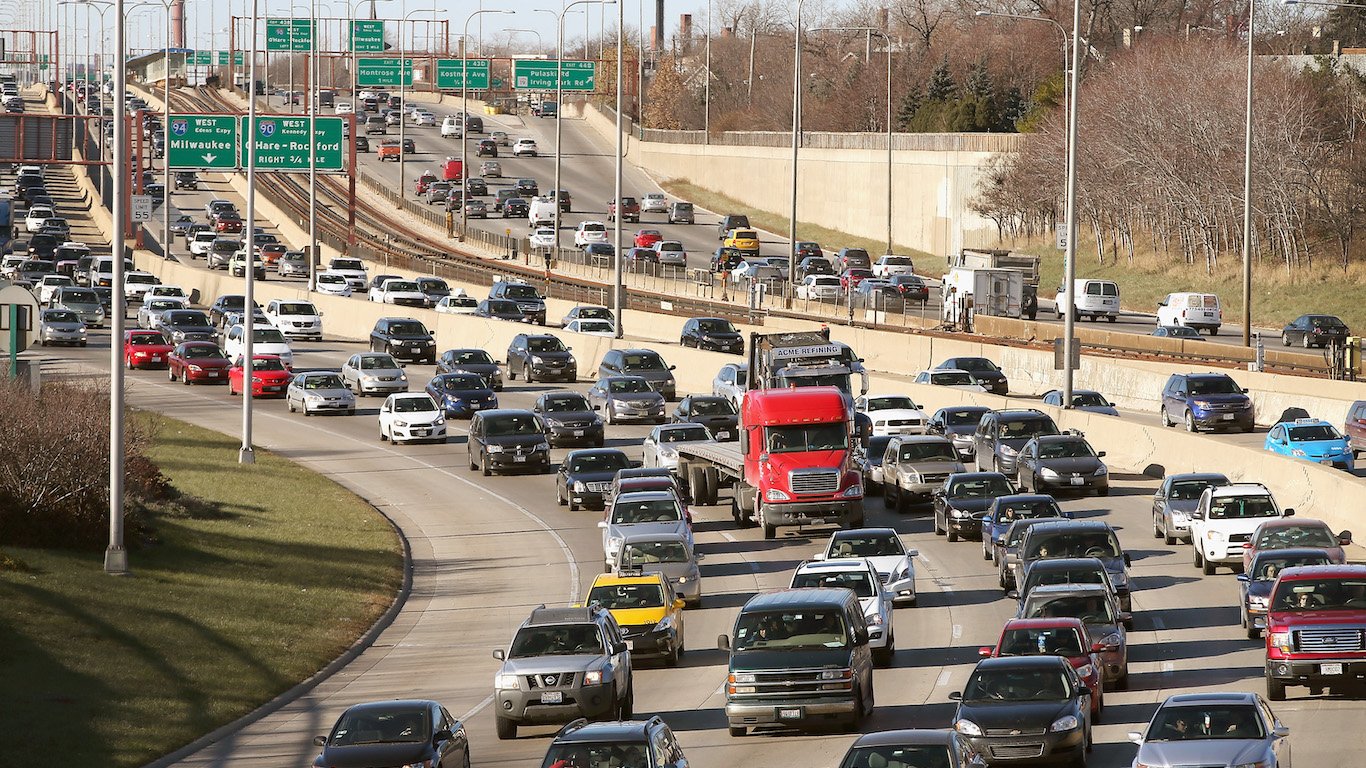
Illinois: Chicago-Naperville-Elgin
> Traffic fatalities per 100,000 people: 6.6 (state: 8.6)
> Avg. commute time: 31.6 min. (state: 29.1 min.)
> Commuters driving to work: 77.6% (state: 80.8%)
> 2017 car thefts per 100,000 people: 254.4
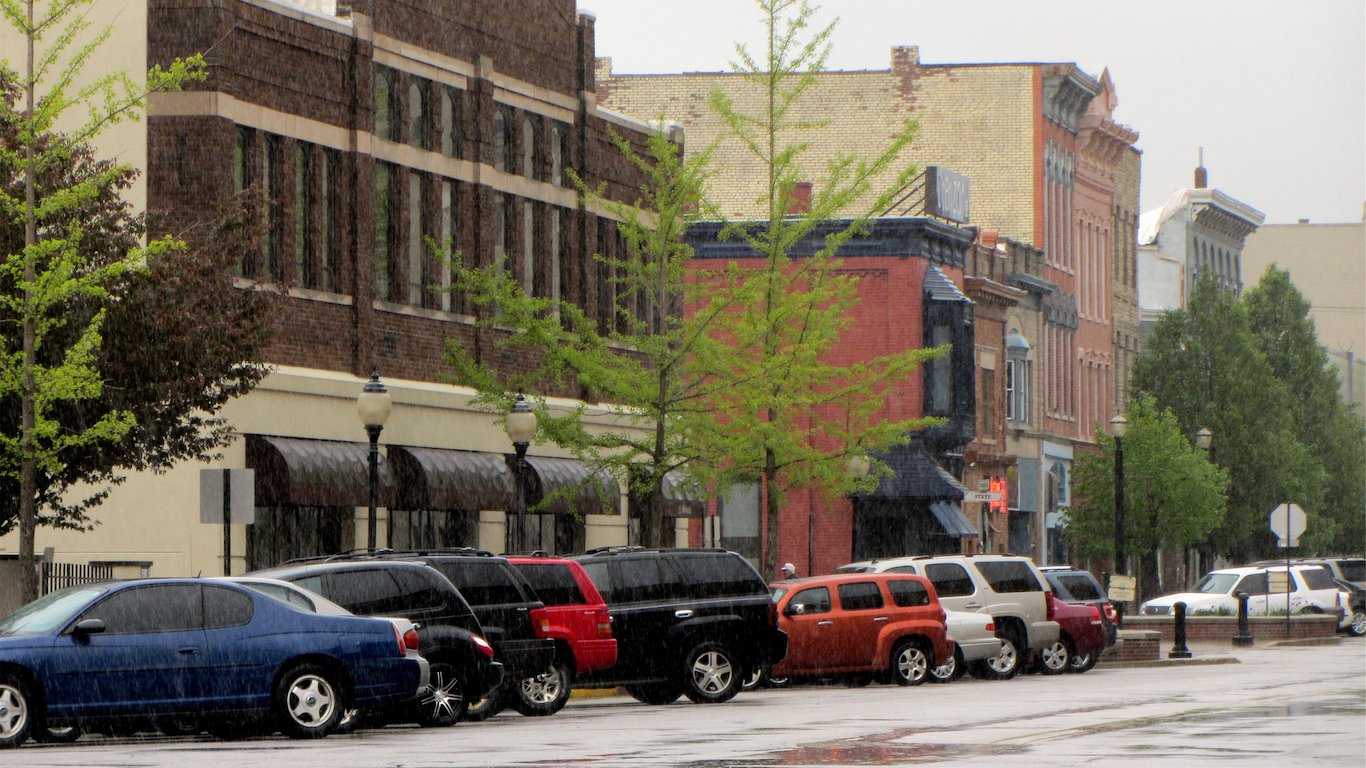
Source: Courtesy of David Wilson via Flickr
Indiana: Michigan City-La Porte
> Traffic fatalities per 100,000 people: 24.5 (state: 13.7)
> Avg. commute time: 22.1 min. (state: 23.6 min.)
> Commuters driving to work: 91.9% (state: 91.2%)
> 2017 car thefts per 100,000 people: 159.1
[in-text-ad-2]
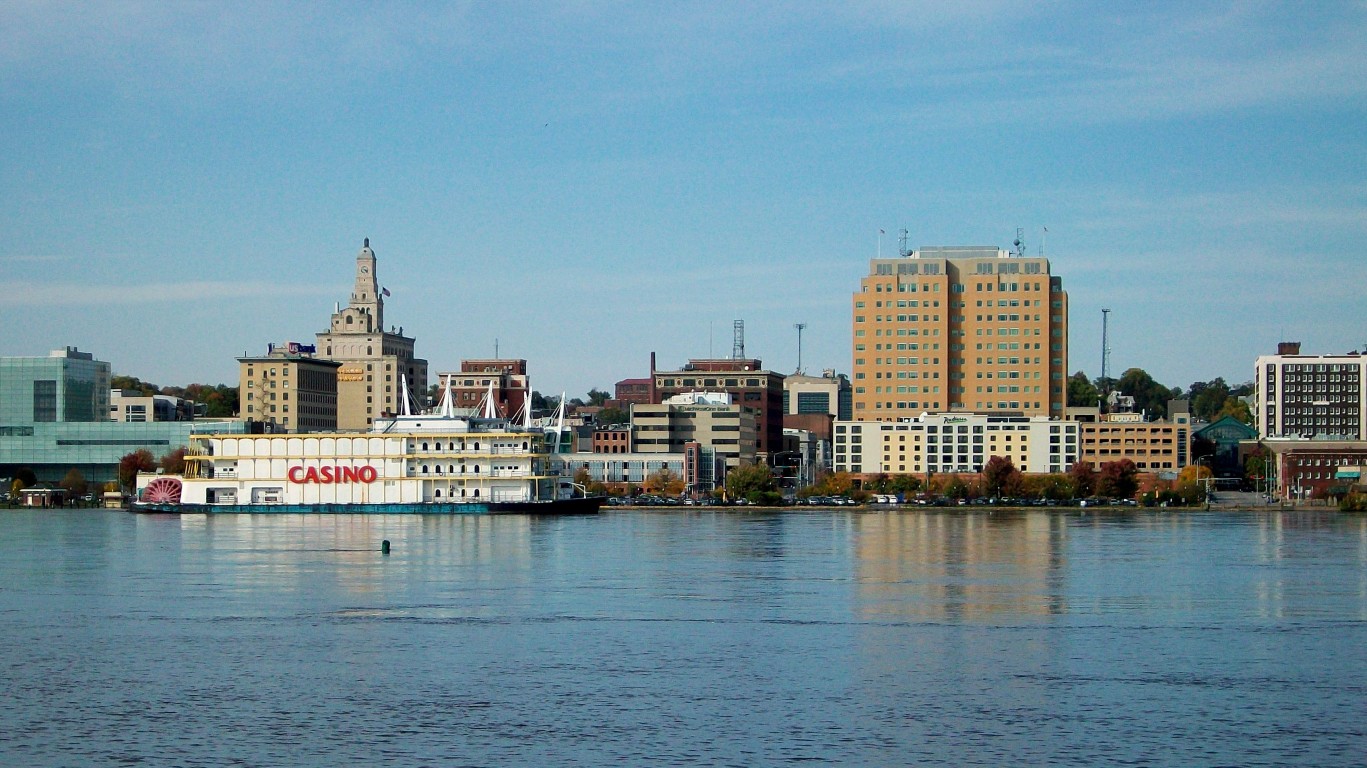
Source: Ctjf83 / Public Domain / Wikimedia Commons
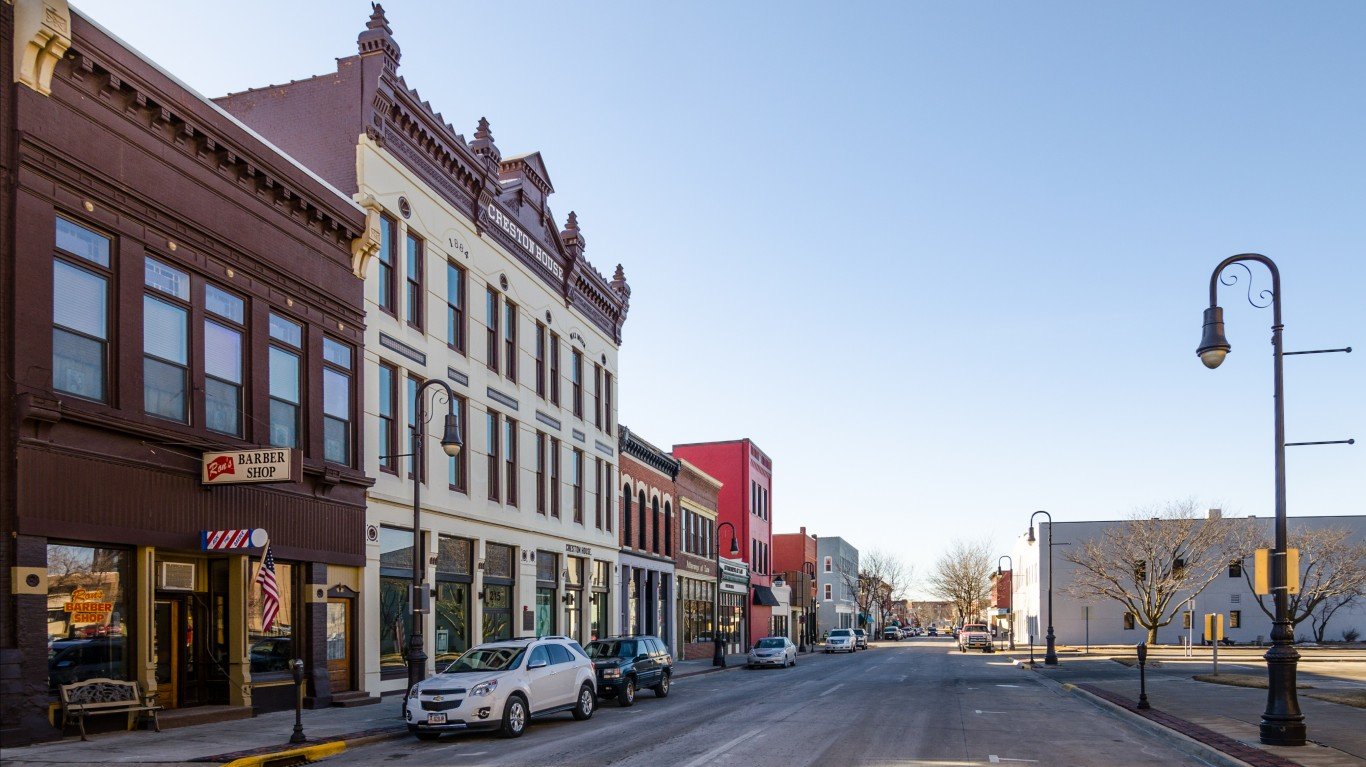
Iowa: Davenport-Moline-Rock Island
> Traffic fatalities per 100,000 people: 6.3 (state: 10.5)
> Avg. commute time: 19.8 min. (state: 19.4 min.)
> Commuters driving to work: 92.7% (state: 89.4%)
> 2017 car thefts per 100,000 people: 278.3
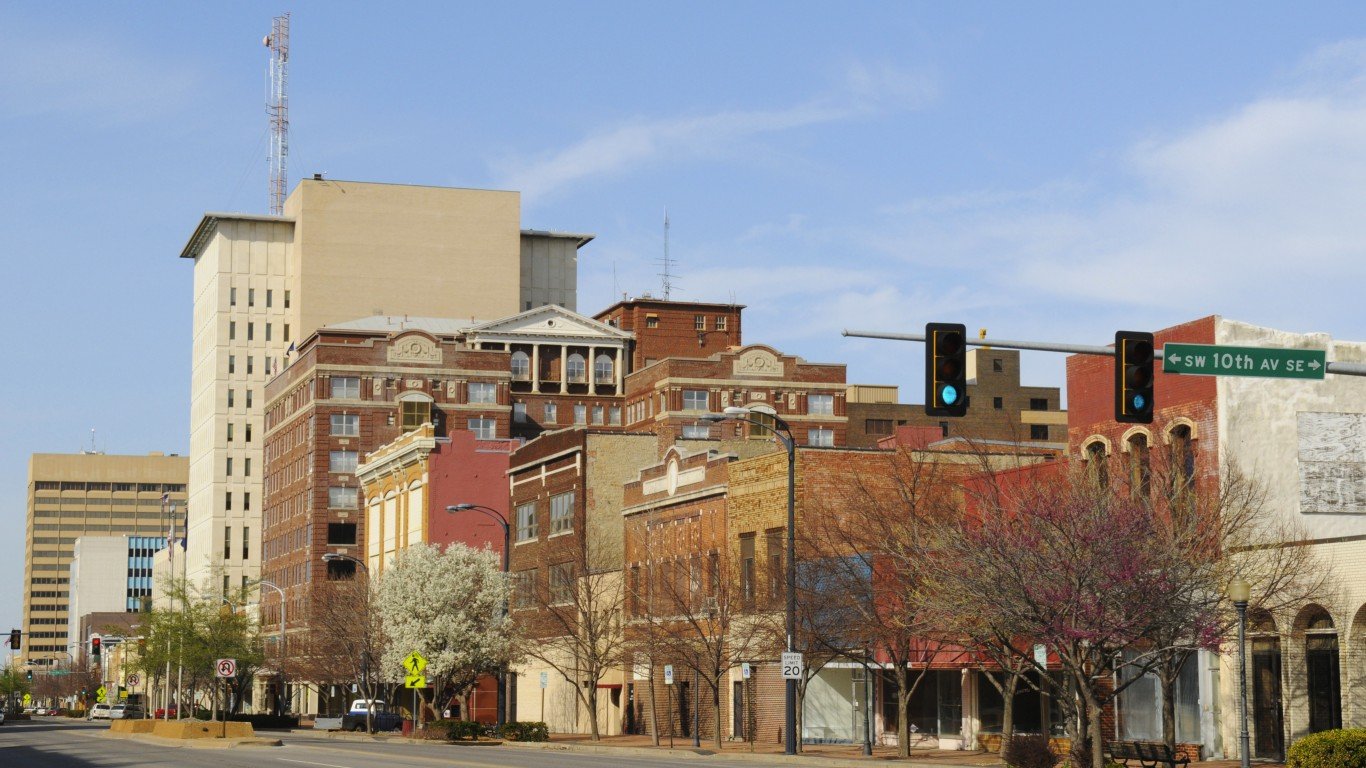
Source: LawrenceSawyer / Getty Images
Kansas: Topeka
> Traffic fatalities per 100,000 people: 14.6 (state: 15.8)
> Avg. commute time: 20.4 min. (state: 19.1 min.)
> Commuters driving to work: 93.2% (state: 91.2%)
> 2017 car thefts per 100,000 people: 450.4
[in-text-ad]
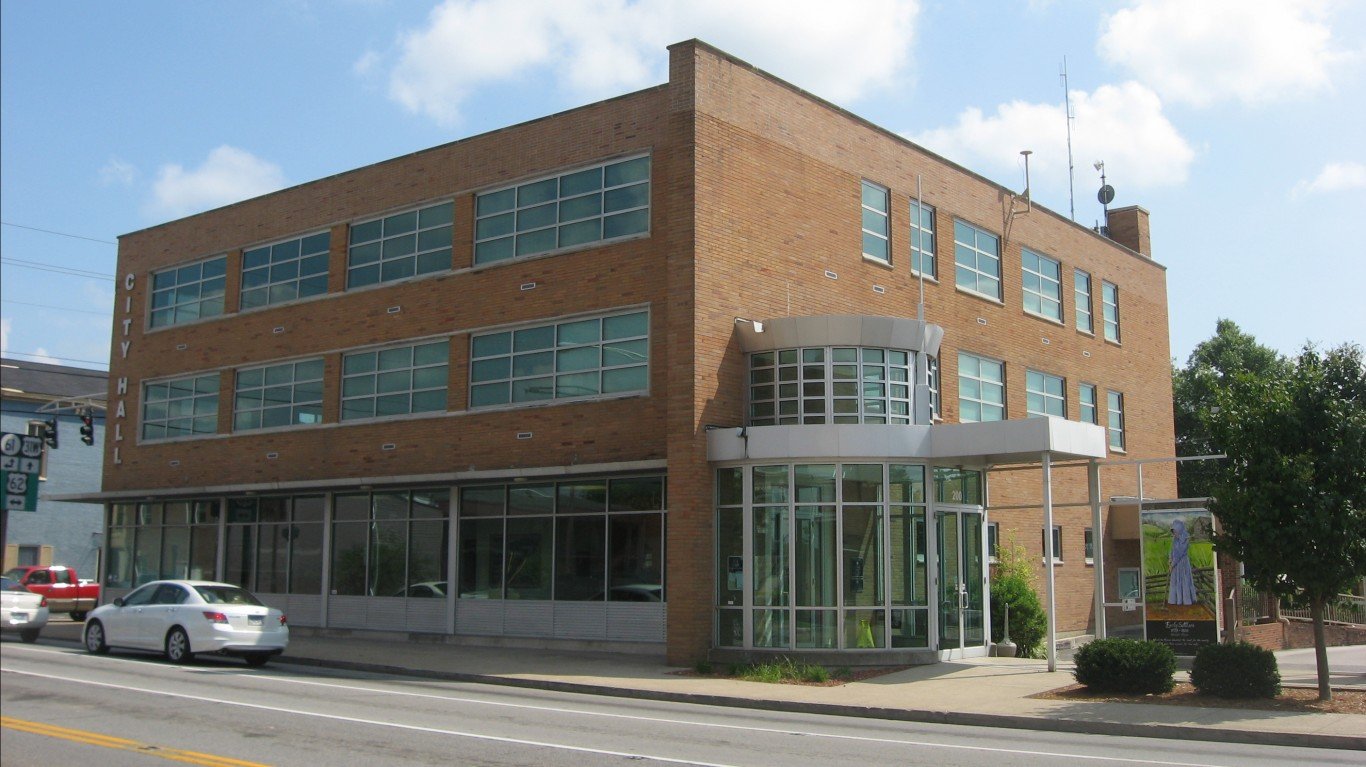
Source: Public Domain / Wikimedia Commons
Kentucky: Elizabethtown-Fort Knox
> Traffic fatalities per 100,000 people: 19.4 (state: 17.6)
> Avg. commute time: 24.1 min. (state: 23.3 min.)
> Commuters driving to work: 93.1% (state: 91.4%)
> 2017 car thefts per 100,000 people: 140.3
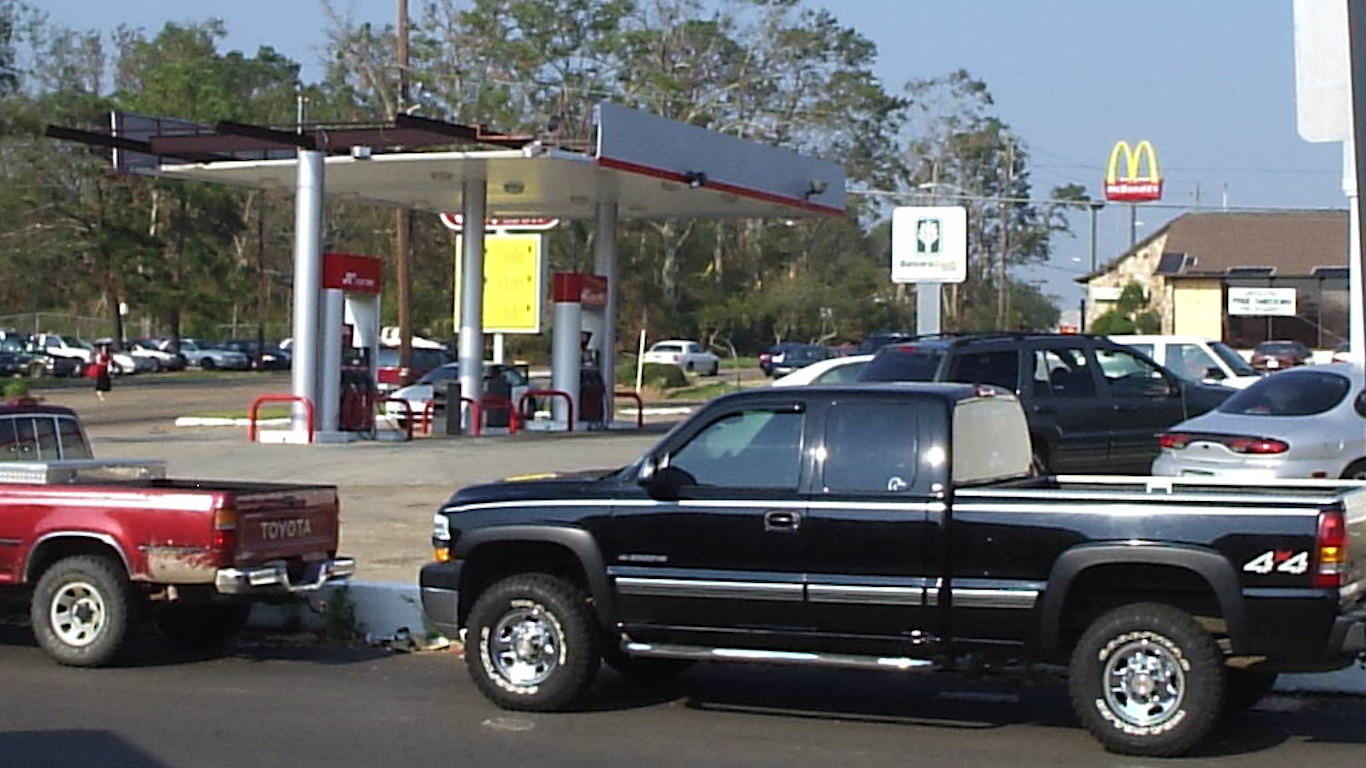
Source: Public Domain / Wikimedia Commons
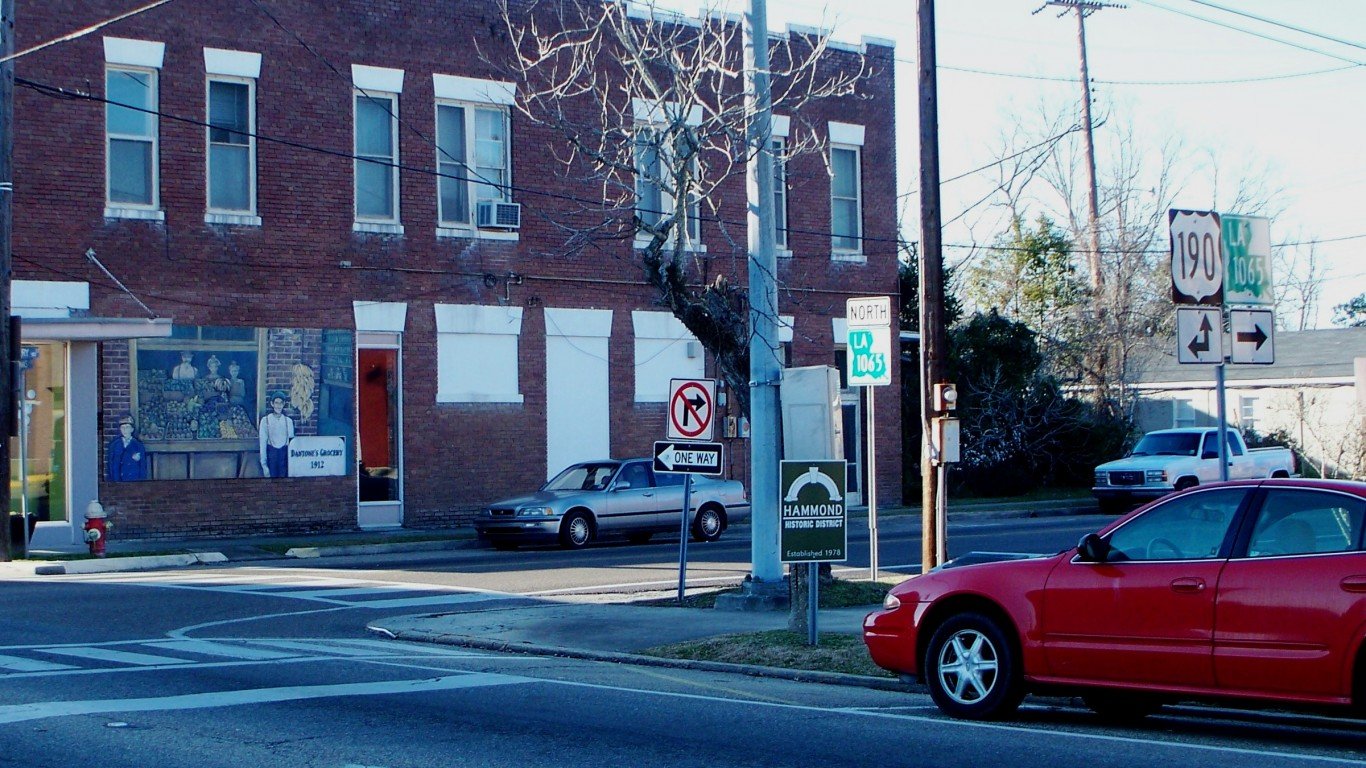
Louisiana: Hammond
> Traffic fatalities per 100,000 people: 23.4 (state: 16.2)
> Avg. commute time: 31.3 min. (state: 25.3 min.)
> Commuters driving to work: 92.8% (state: 91.9%)
> 2017 car thefts per 100,000 people: 247.6
Source: SeanPavonePhoto / Getty Images
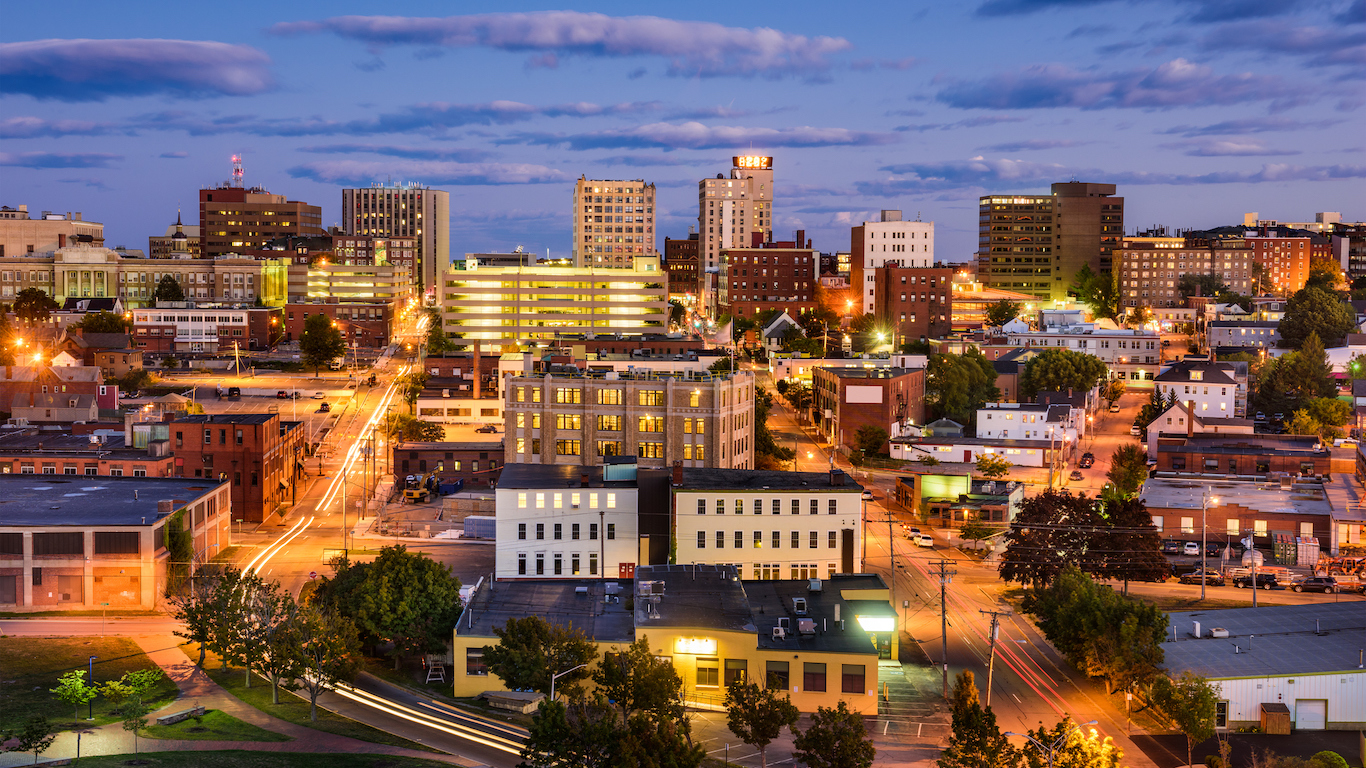
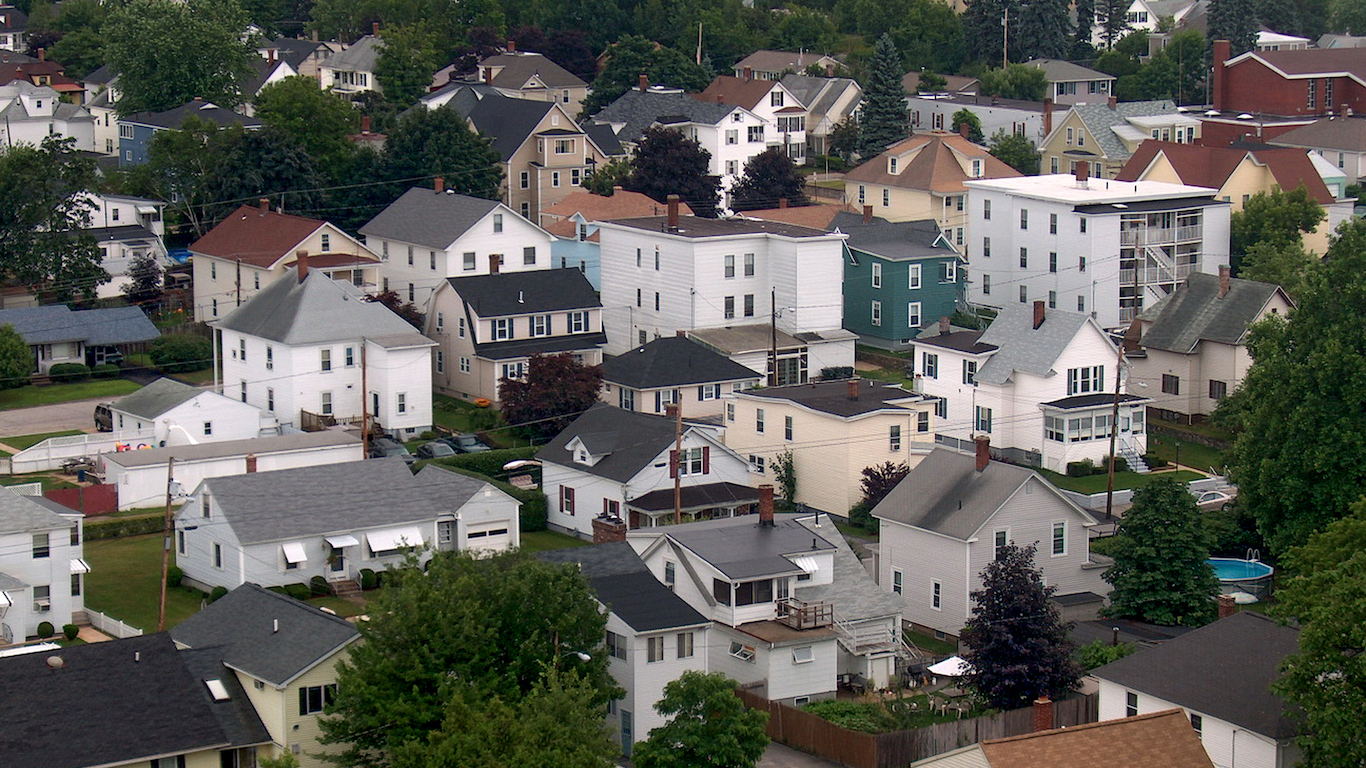
Maine: Portland-South Portland
> Traffic fatalities per 100,000 people: 9.4 (state: 12.9)
> Avg. commute time: 24.8 min. (state: 24 min.)
> Commuters driving to work: 86.5% (state: 87.9%)
> 2017 car thefts per 100,000 people: 49.2
[in-text-ad-2]
Source: Courtesy of Elvert Barnes via Flickr
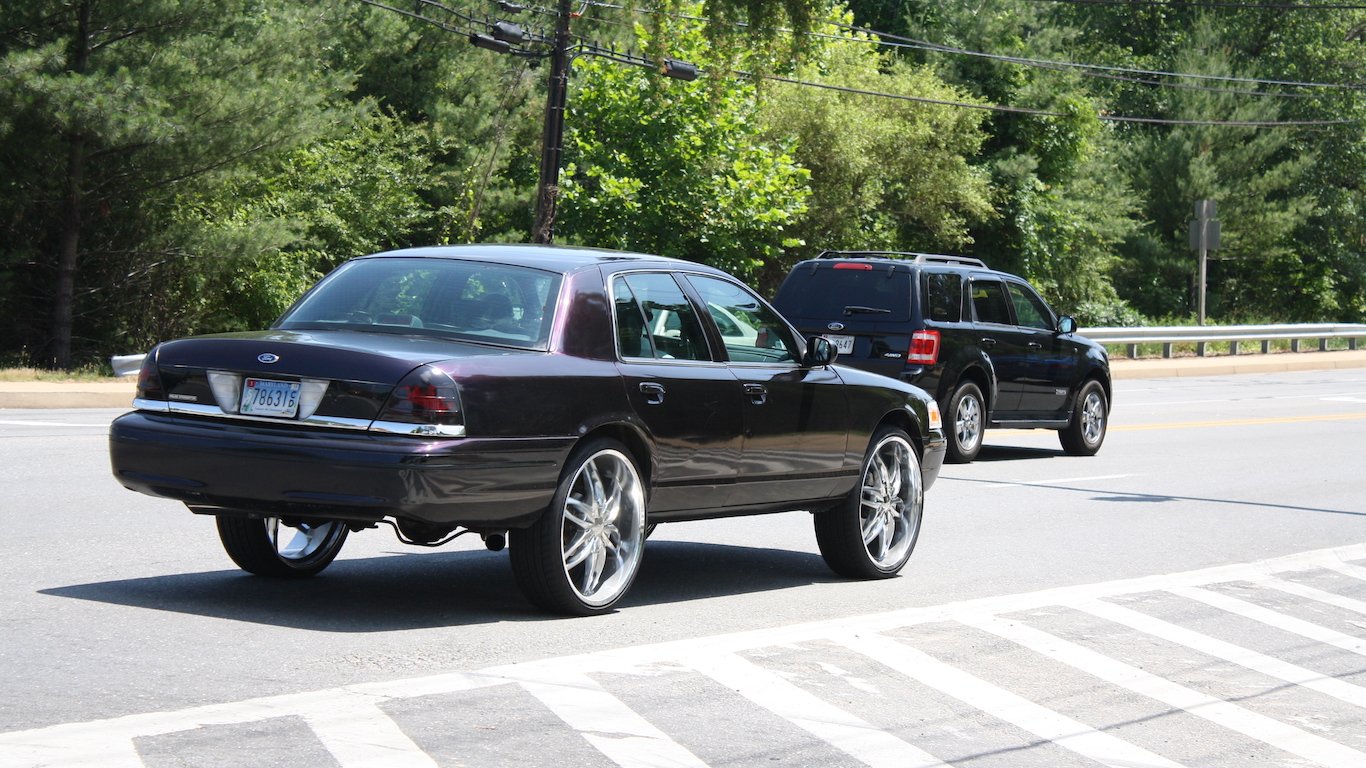
Maryland: California-Lexington Park
> Traffic fatalities per 100,000 people: 16.9 (state: 9.1)
> Avg. commute time: 30.9 min. (state: 33.3 min.)
> Commuters driving to work: 89.9% (state: 82.8%)
> 2017 car thefts per 100,000 people: 55.9
Source: ChandraDhas / Getty Images
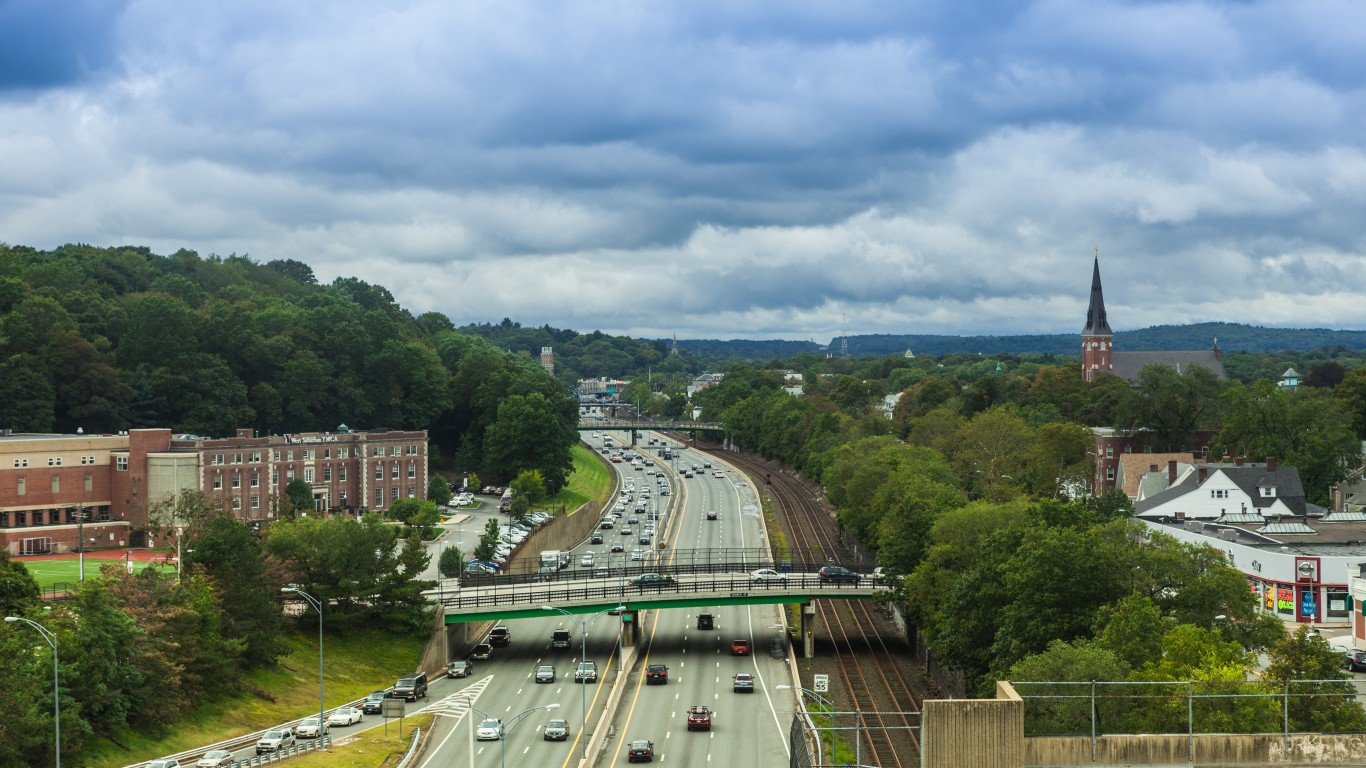
Massachusetts: Boston-Cambridge-Newton
> Traffic fatalities per 100,000 people: 4.2 (state: 5.1)
> Avg. commute time: 31 min. (state: 29.8 min.)
> Commuters driving to work: 73.6% (state: 77.3%)
> 2017 car thefts per 100,000 people: 105.4
[in-text-ad]
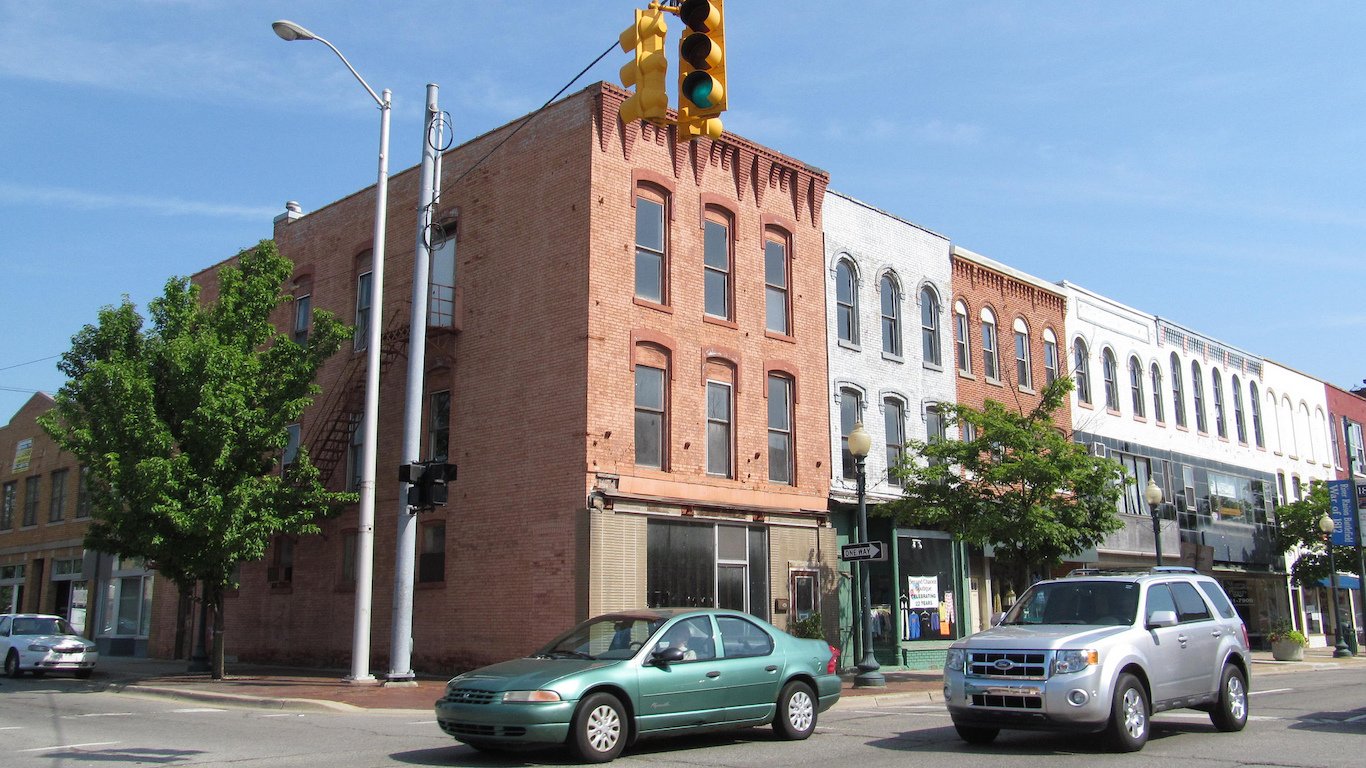
Source: Courtesy of Doug Kerr via Flickr
Michigan: Monroe
> Traffic fatalities per 100,000 people: 15.4 (state: 10.3)
> Avg. commute time: 24.5 min. (state: 24.3 min.)
> Commuters driving to work: 92.4% (state: 91.2%)
> 2017 car thefts per 100,000 people: 123.6
 24/7 Wall St.
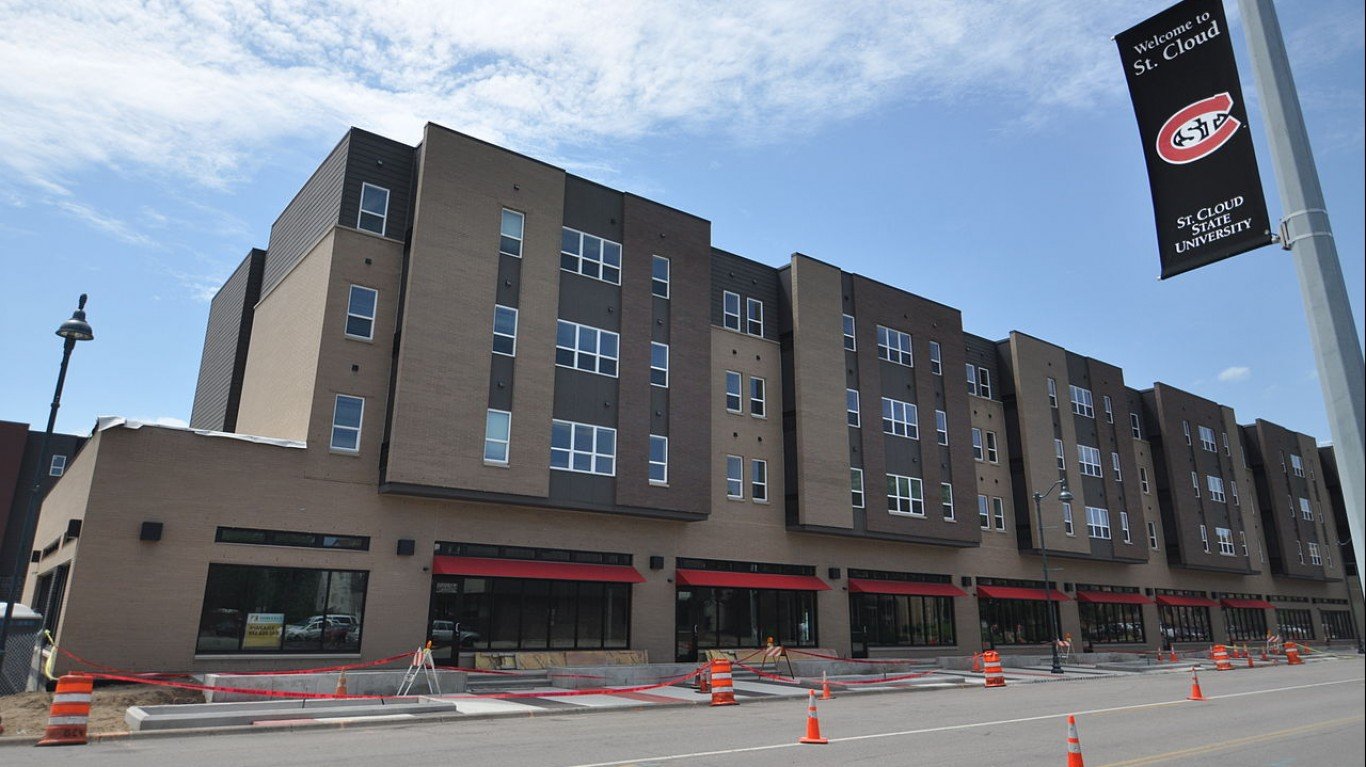
Source: Jeff Wood / Wikimedia Commons
Minnesota: St. Cloud
> Traffic fatalities per 100,000 people: 11.1 (state: 6.4)
> Avg. commute time: 20.9 min. (state: 23.8 min.)
> Commuters driving to work: 89.6% (state: 86.2%)
> 2017 car thefts per 100,000 people: 151.2
Source: Courtesy of WyldKyss via Flickr
Mississippi: Hattiesburg
> Traffic fatalities per 100,000 people: 21.8 (state: 23.1)
> Avg. commute time: 23.8 min. (state: 24.9 min.)
> Commuters driving to work: 87.6% (state: 94.6%)
> 2017 car thefts per 100,000 people: 216.3
[in-text-ad-2]
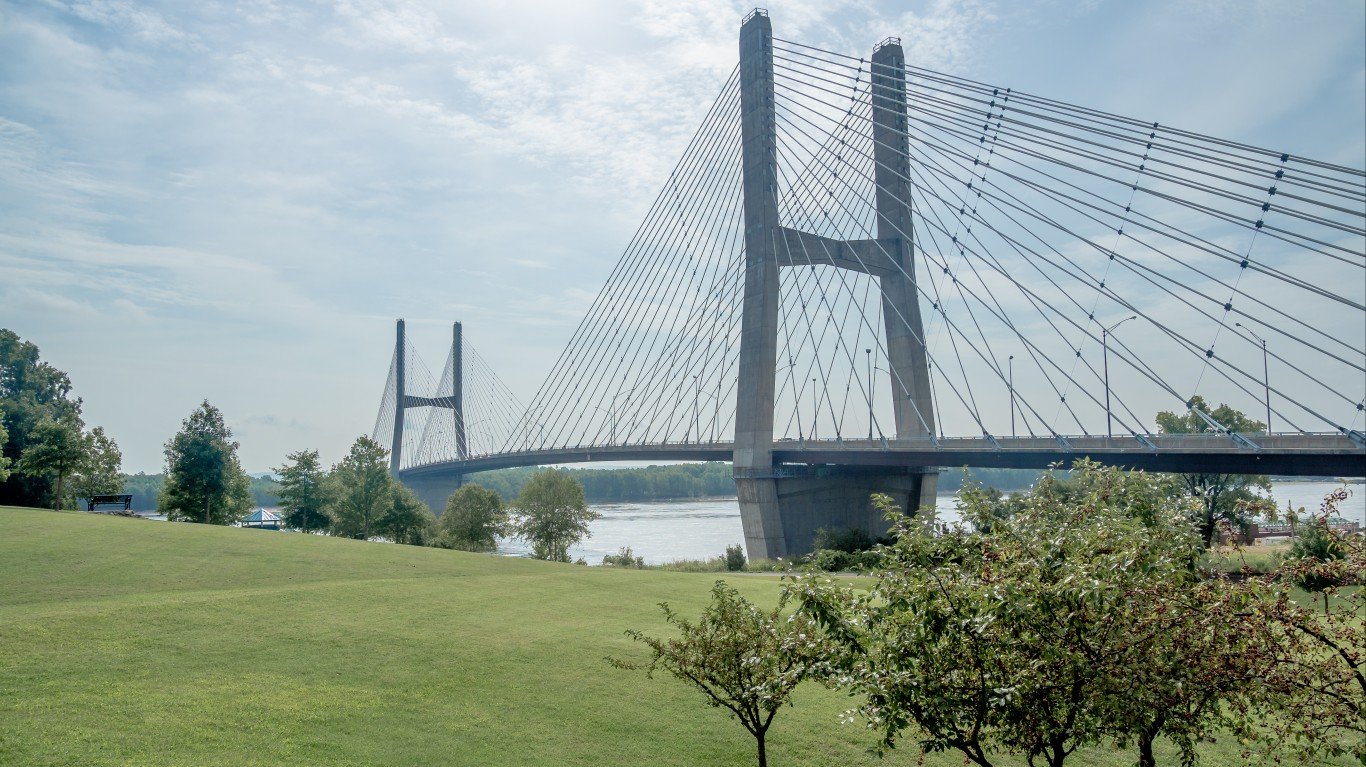
Source: Geoff Eccles / Getty Images
Missouri: Cape Girardeau
> Traffic fatalities per 100,000 people: 18.3 (state: 15.2)
> Avg. commute time: 21.4 min. (state: 23.7 min.)
> Commuters driving to work: 89.0% (state: 90.6%)
> 2017 car thefts per 100,000 people: 149.8
Source: harmantasdc / Getty Images
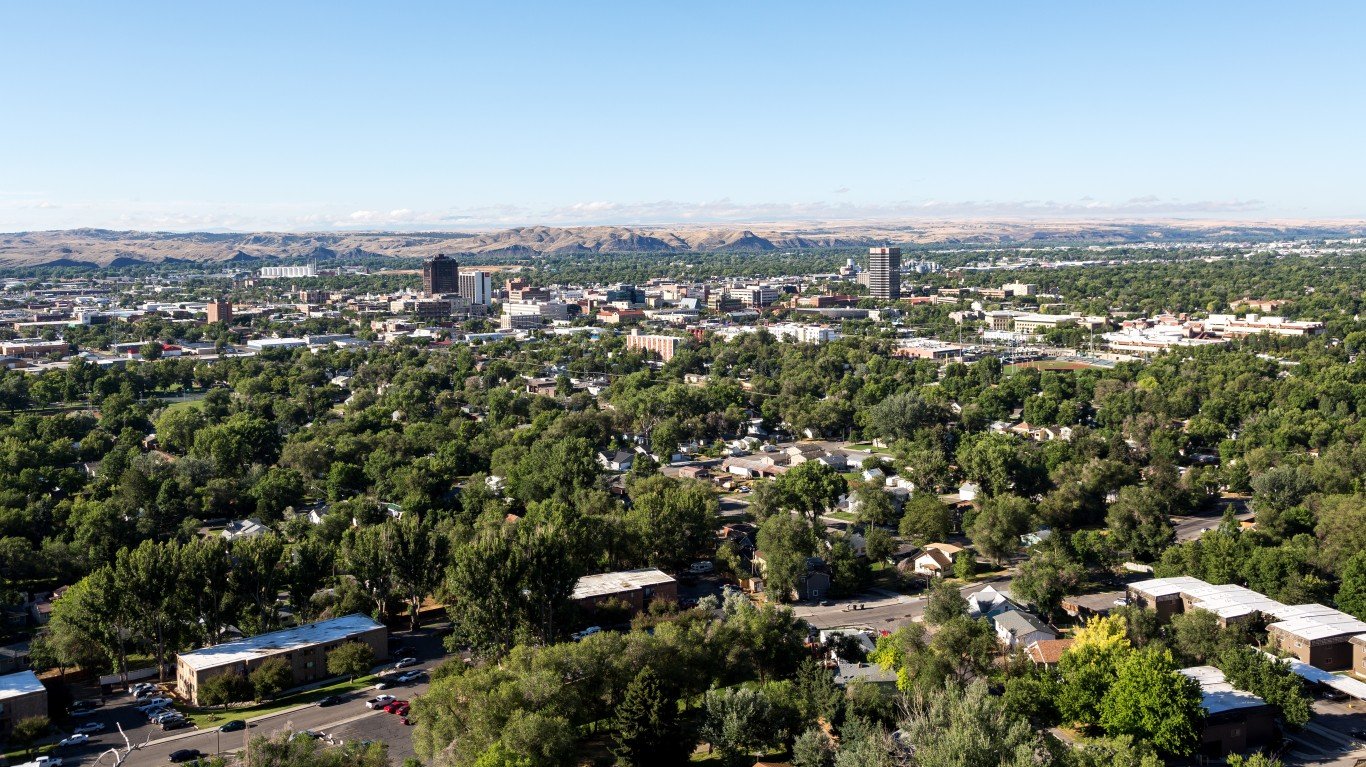
Montana: Billings
> Traffic fatalities per 100,000 people: 8.1 (state: 17.7)
> Avg. commute time: 18.9 min. (state: 18.1 min.)
> Commuters driving to work: 90.2% (state: 85.4%)
> 2017 car thefts per 100,000 people: 558.4
[in-text-ad]
Source: Jared Winkler / Wikimedia Commons
Nebraska: Omaha-Council Bluffs
> Traffic fatalities per 100,000 people: 9.2 (state: 11.9)
> Avg. commute time: 20.2 min. (state: 18.5 min.)
> Commuters driving to work: 91.7% (state: 90.8%)
> 2017 car thefts per 100,000 people: 429.3

Source: f11photo / Getty Images
Nevada: Las Vegas-Henderson-Paradise
> Traffic fatalities per 100,000 people: 9.4 (state: 10.3)
> Avg. commute time: 24.5 min. (state: 24.2 min.)
> Commuters driving to work: 88.1% (state: 88.3%)
> 2017 car thefts per 100,000 people: 482.0
Source: stockphoto52 / iStock
New Hampshire: Manchester-Nashua
> Traffic fatalities per 100,000 people: 4.9 (state: 7.6)
> Avg. commute time: 27.9 min. (state: 27.3 min.)
> Commuters driving to work: 89.6% (state: 89.2%)
> 2017 car thefts per 100,000 people: 62.7
[in-text-ad-2]
Source: Aneese / Getty Images
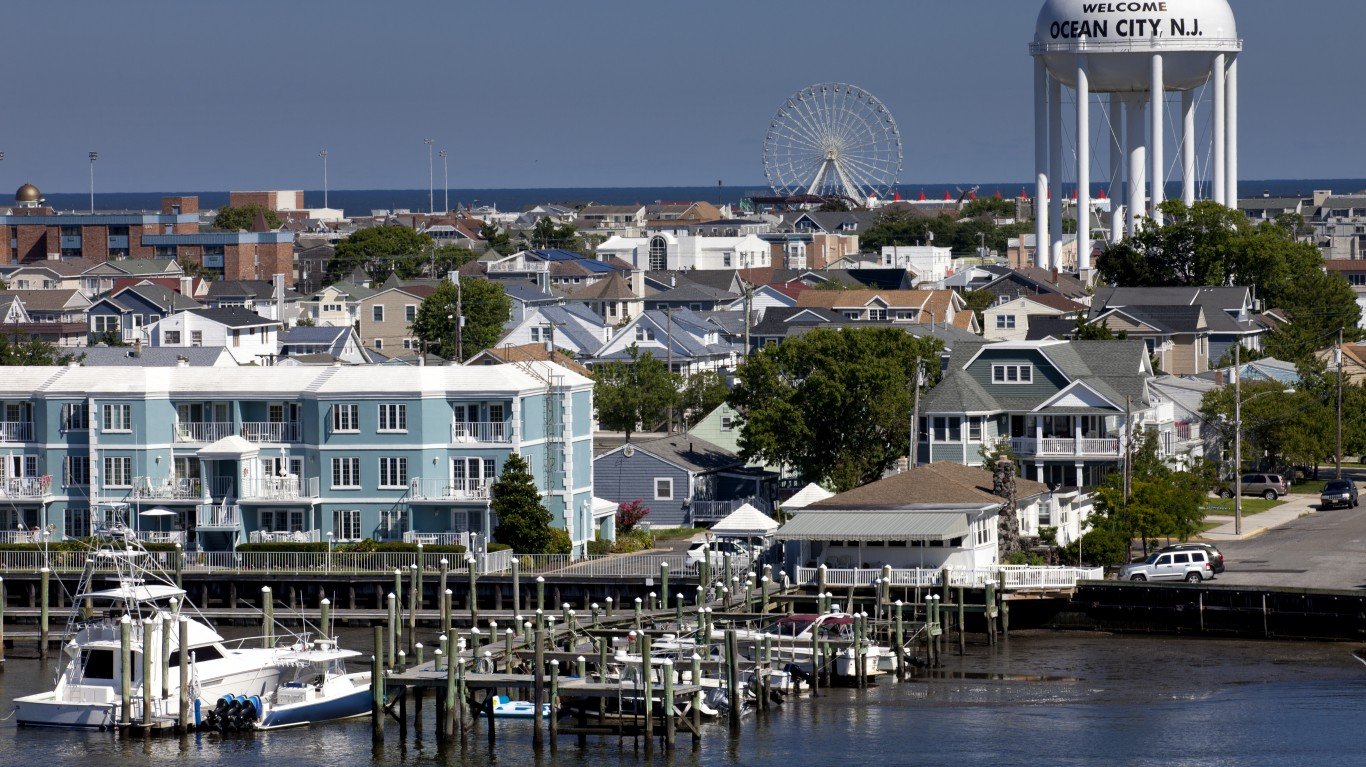
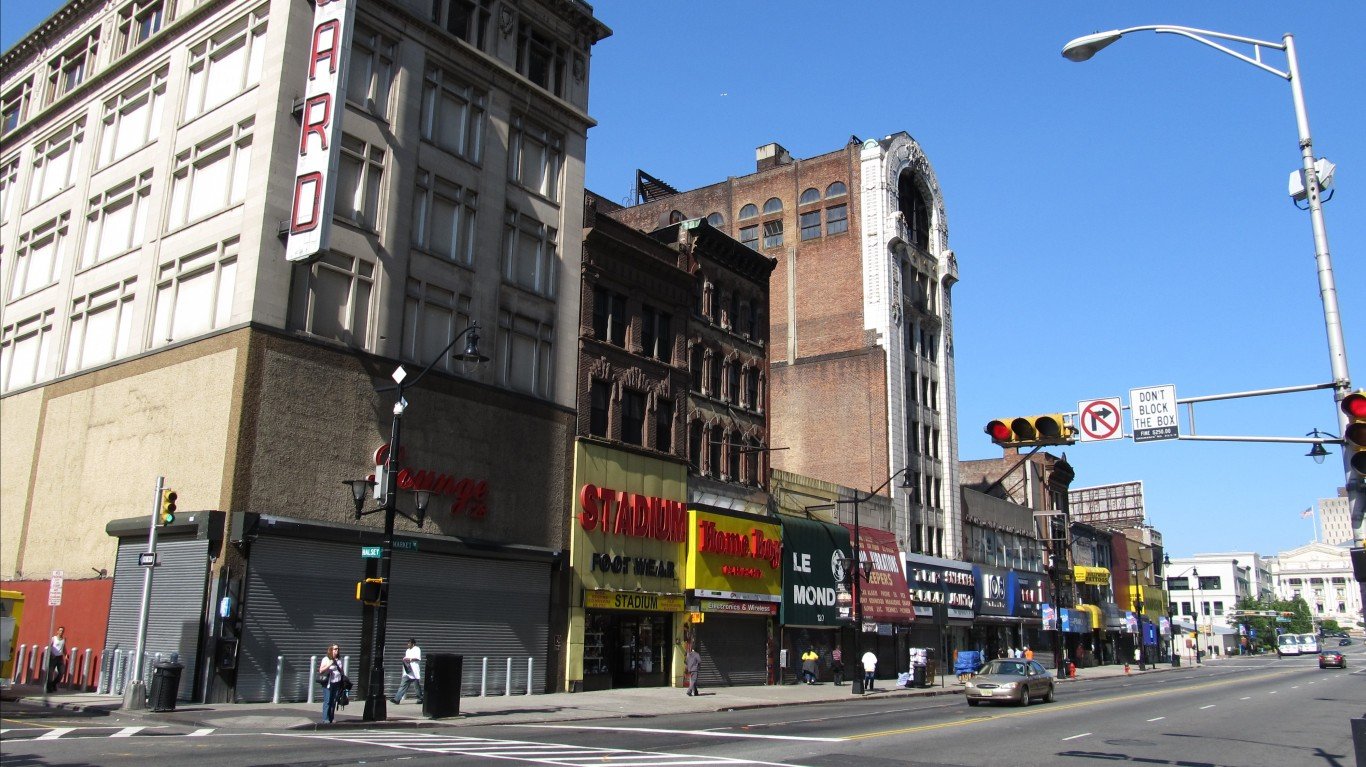
New Jersey: Ocean City
> Traffic fatalities per 100,000 people: 17.1 (state: 6.9)
> Avg. commute time: 22.9 min. (state: 32.1 min.)
> Commuters driving to work: 89.1% (state: 78.9%)
> 2017 car thefts per 100,000 people: 87.7
Source: Courtesy of John Terning via Flickr
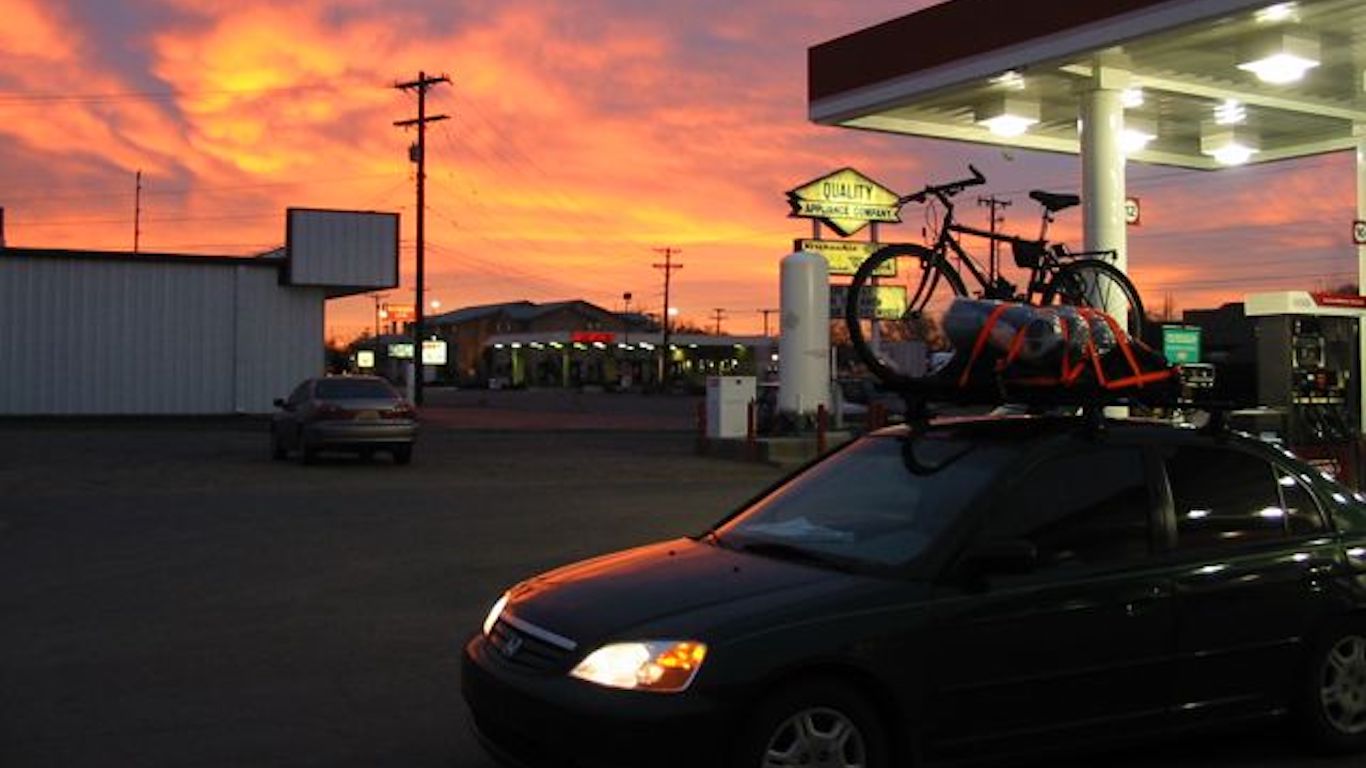
New Mexico: Farmington
> Traffic fatalities per 100,000 people: 26.8 (state: 18.2)
> Avg. commute time: 23.9 min. (state: 22.3 min.)
> Commuters driving to work: 95.2% (state: 90.0%)
> 2017 car thefts per 100,000 people: 215.1
[in-text-ad]
Source: kenlund / Flickr
New York: New York-Newark-Jersey City
> Traffic fatalities per 100,000 people: 4.3 (state: 5.0)
> Avg. commute time: 36.3 min. (state: 33.7 min.)
> Commuters driving to work: 56.4% (state: 59.4%)
> 2017 car thefts per 100,000 people: 104.7
Source: Courtesy of Adam Moss via Flickr
North Carolina: Rocky Mount
> Traffic fatalities per 100,000 people: 21.1 (state: 13.7)
> Avg. commute time: 21.9 min. (state: 24.9 min.)
> Commuters driving to work: 92.7% (state: 89.9%)
> 2017 car thefts per 100,000 people: 141.8
Source: Courtesy of Andrew Filer via Flickr
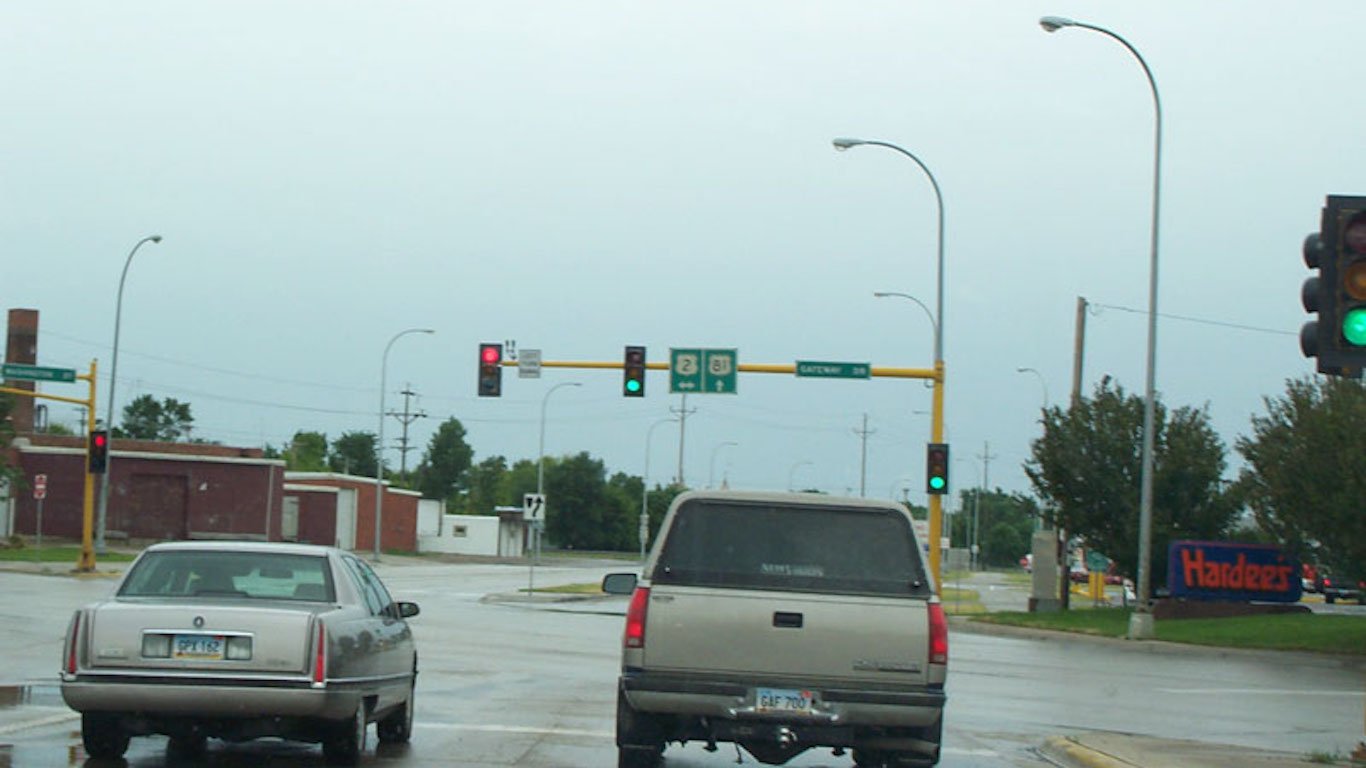
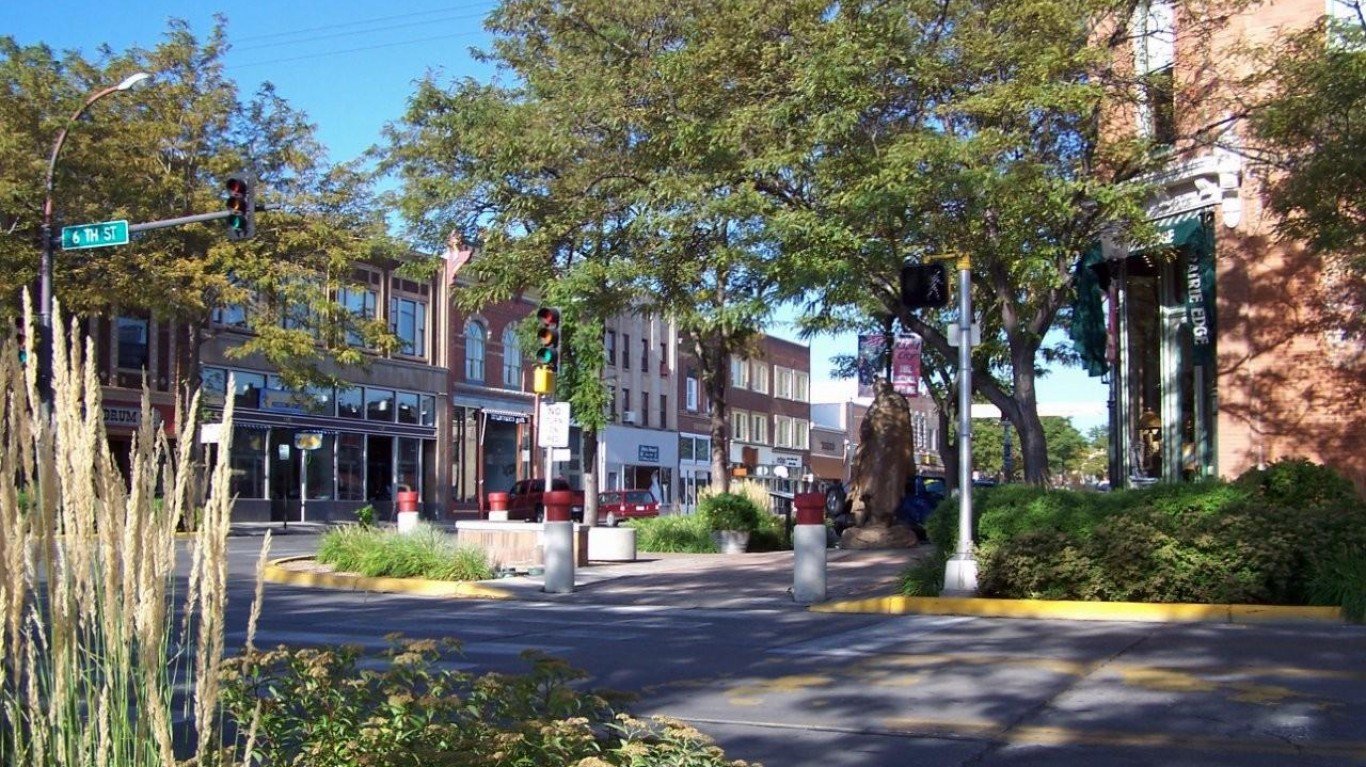
North Dakota: Grand Forks
> Traffic fatalities per 100,000 people: 10.7 (state: 15.2)
> Avg. commute time: 15.4 min. (state: 16.5 min.)
> Commuters driving to work: 88.8% (state: 89.8%)
> 2017 car thefts per 100,000 people: 141.6
[in-text-ad-2]
Source: PapaBear / Getty Images
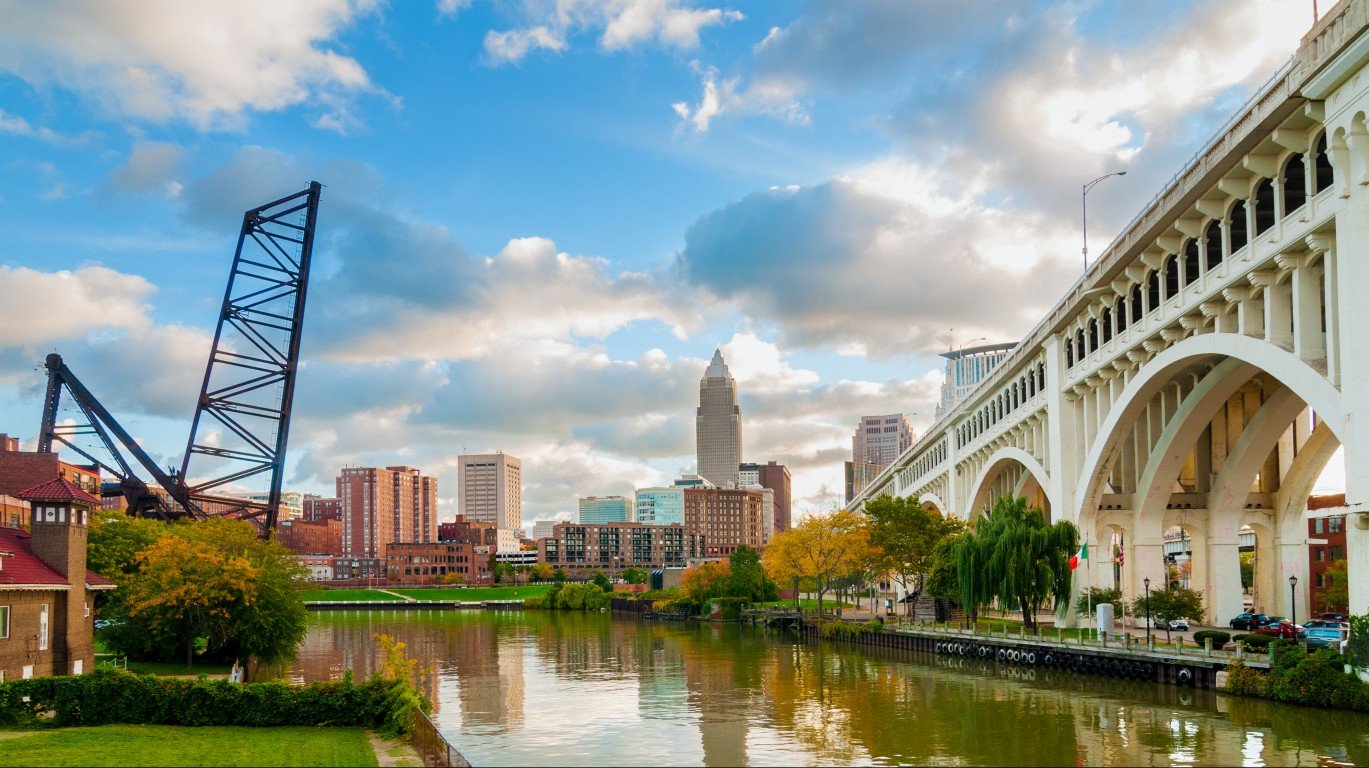
Ohio: Cleveland-Elyria
> Traffic fatalities per 100,000 people: 8.1 (state: 10.1)
> Avg. commute time: 24.6 min. (state: 23.6 min.)
> Commuters driving to work: 89.7% (state: 91.0%)
> 2017 car thefts per 100,000 people: 294.8

Source: Urbanative / Wikimedia Commons
Oklahoma: Oklahoma City
> Traffic fatalities per 100,000 people: 13.0 (state: 16.7)
> Avg. commute time: 22.7 min. (state: 21.9 min.)
> Commuters driving to work: 92.6% (state: 92.1%)
> 2017 car thefts per 100,000 people: 325.1
[in-text-ad]
Source: kenlund / Flickr
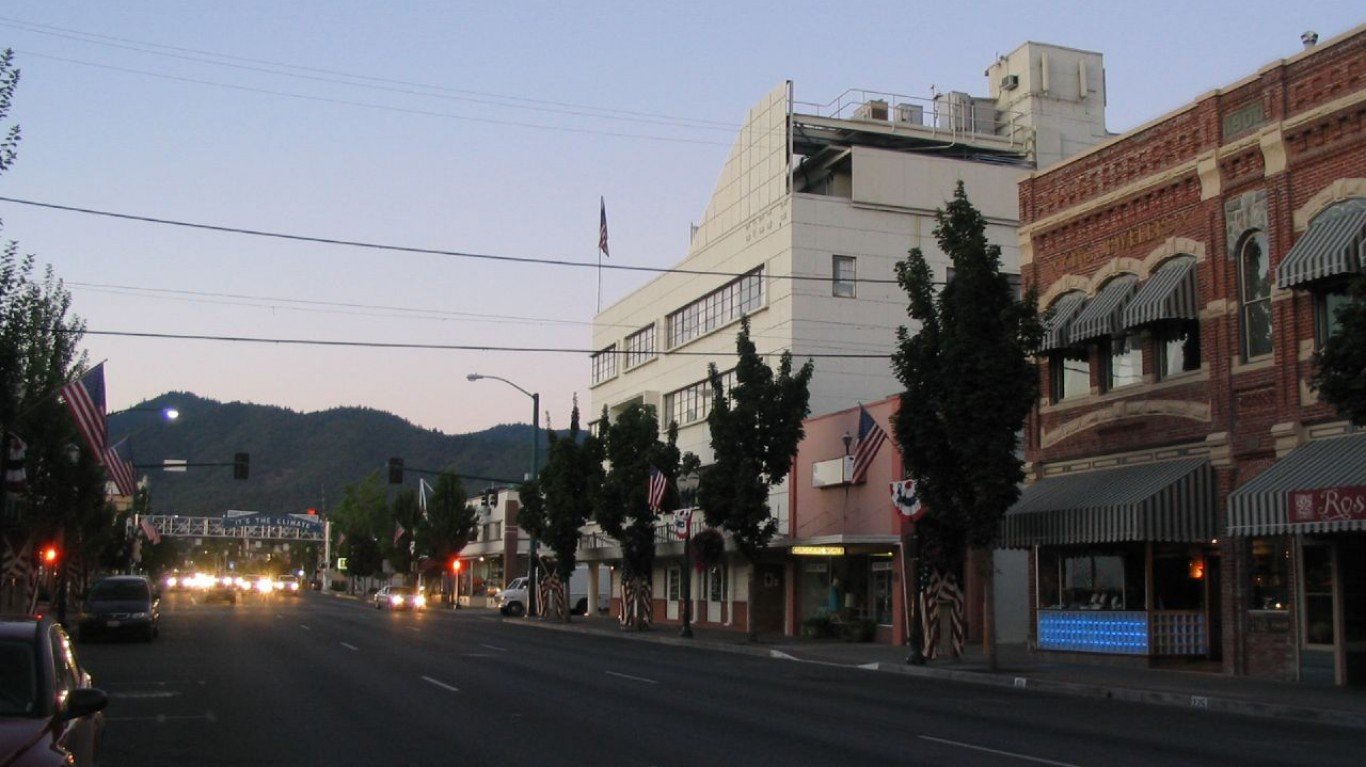
Oregon: Grants Pass
> Traffic fatalities per 100,000 people: 22.0 (state: 10.5)
> Avg. commute time: 20.1 min. (state: 24.3 min.)
> Commuters driving to work: 86.8% (state: 81.4%)
> 2017 car thefts per 100,000 people: 415.7
 24/7 Wall St.
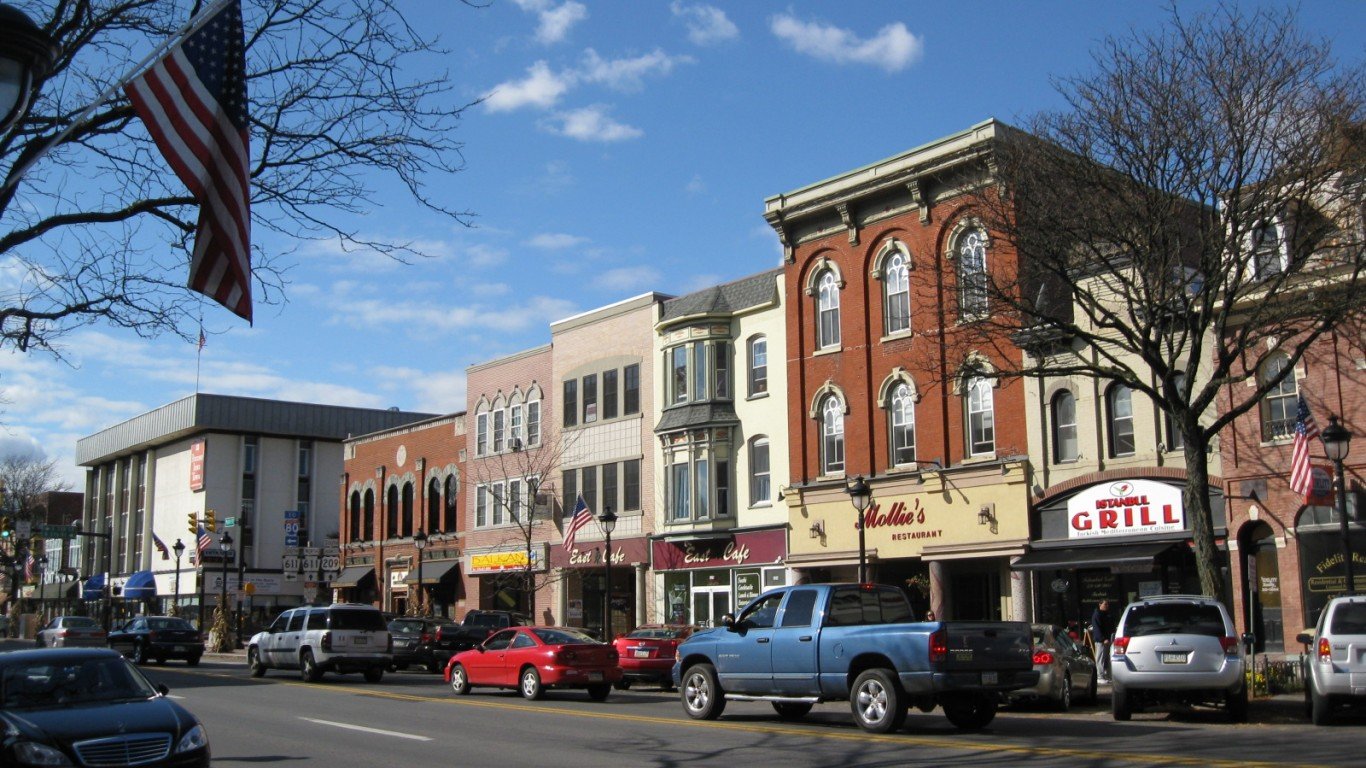
Source: Doug Kerr from Albany, NY, United States / Wikimedia Commons
Pennsylvania: East Stroudsburg
> Traffic fatalities per 100,000 people: 10.7 (state: 8.9)
> Avg. commute time: 38.6 min. (state: 27.1 min.)
> Commuters driving to work: 92.3% (state: 84.7%)
> 2017 car thefts per 100,000 people: 66.1
Source: SeanPavonePhoto / Getty Images
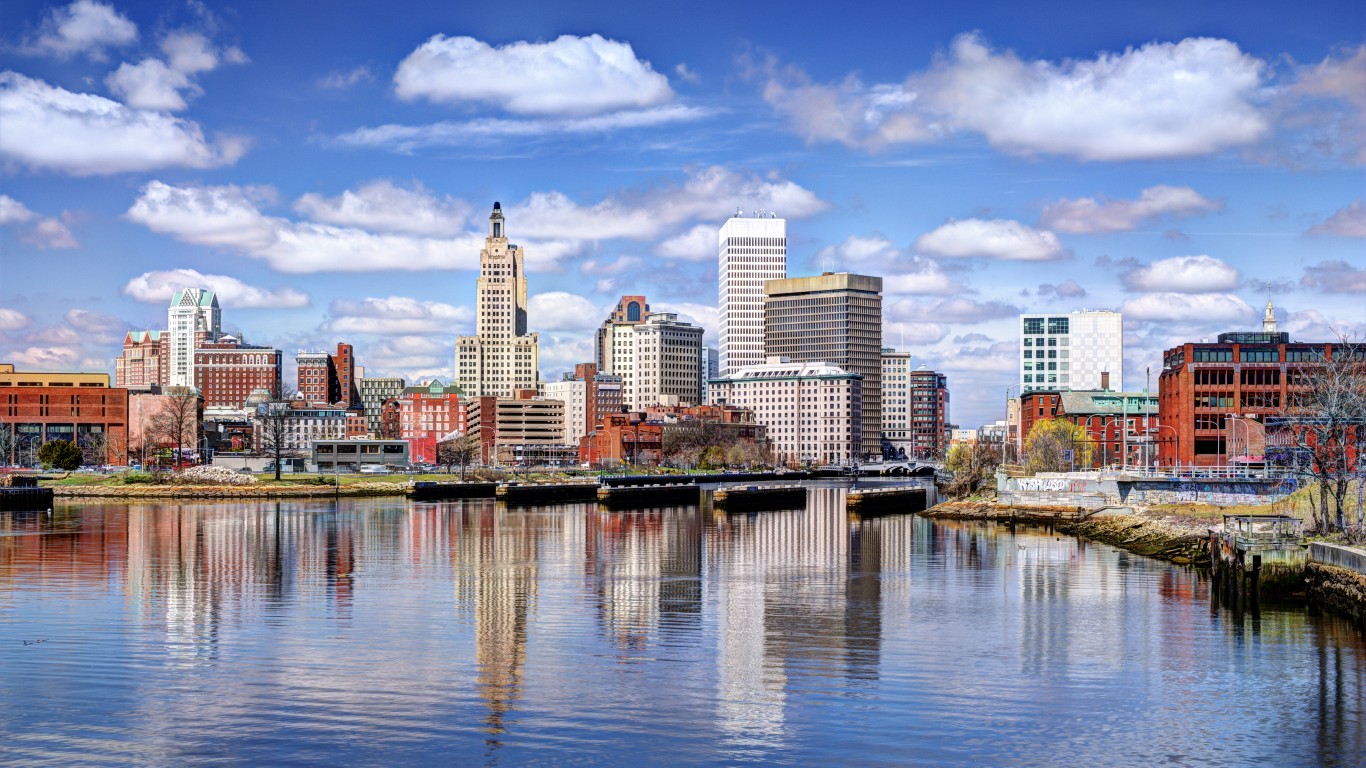
Rhode Island: Providence-Warwick
> Traffic fatalities per 100,000 people: 7.9 (state: 7.8)
> Avg. commute time: 25.8 min. (state: 25.1 min.)
> Commuters driving to work: 89.2% (state: 88.8%)
> 2017 car thefts per 100,000 people: 140.6
[in-text-ad-2]
Source: DanTD / Wikimedia Commons
South Carolina: Florence
> Traffic fatalities per 100,000 people: 22.8 (state: 19.7)
> Avg. commute time: 23.1 min. (state: 24.6 min.)
> Commuters driving to work: 92.1% (state: 91.3%)
> 2017 car thefts per 100,000 people: 275.5
Source: Public Domain / Wikimedia Commons
South Dakota: Rapid City
> Traffic fatalities per 100,000 people: 14.3 (state: 14.8)
> Avg. commute time: 18.4 min. (state: 17.3 min.)
> Commuters driving to work: 88.8% (state: 89.0%)
> 2017 car thefts per 100,000 people: 252.6
[in-text-ad]
Source: Home4tnindustry / Wikimedia Commons
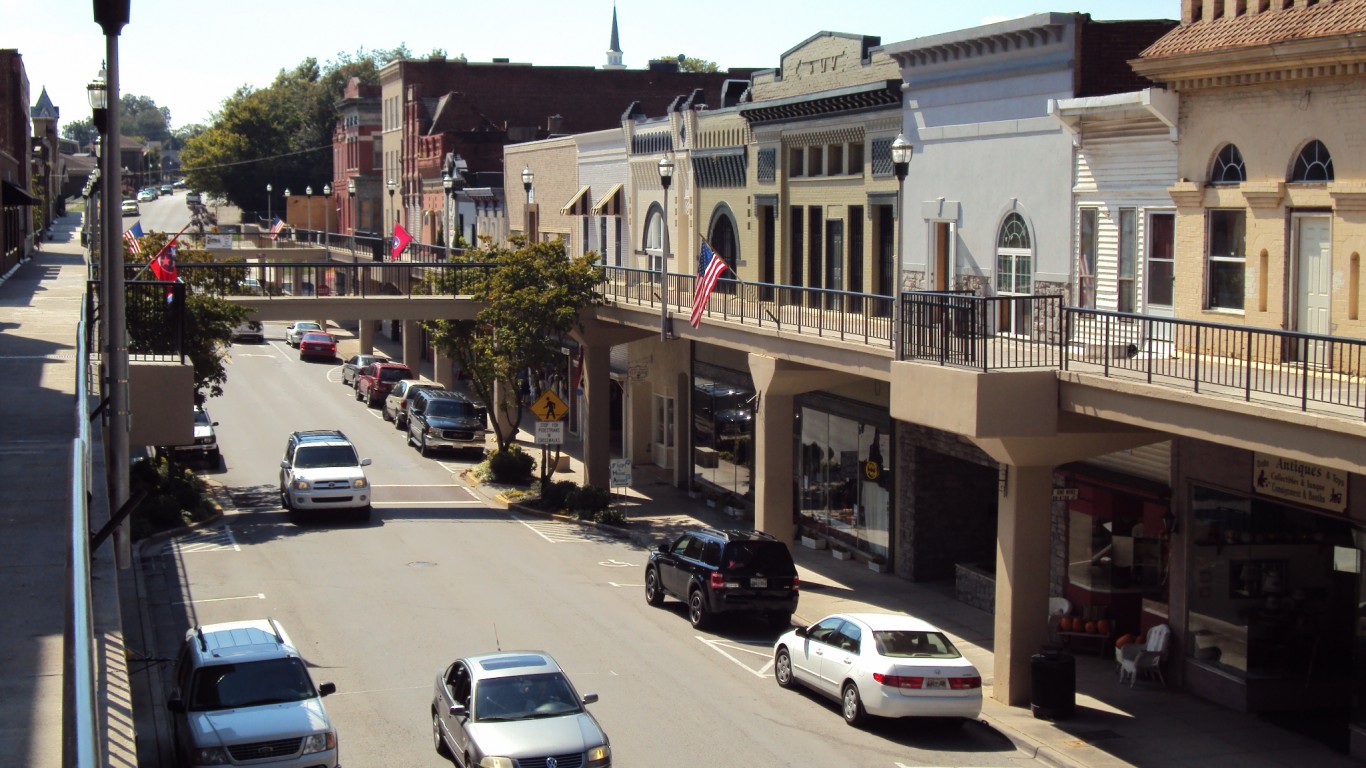
Tennessee: Morristown
> Traffic fatalities per 100,000 people: 16.9 (state: 15.5)
> Avg. commute time: 23.8 min. (state: 25.1 min.)
> Commuters driving to work: N/A (state: 92.0%)
> 2017 car thefts per 100,000 people: 260.0
Source: DenisTangneyJr / Getty Images
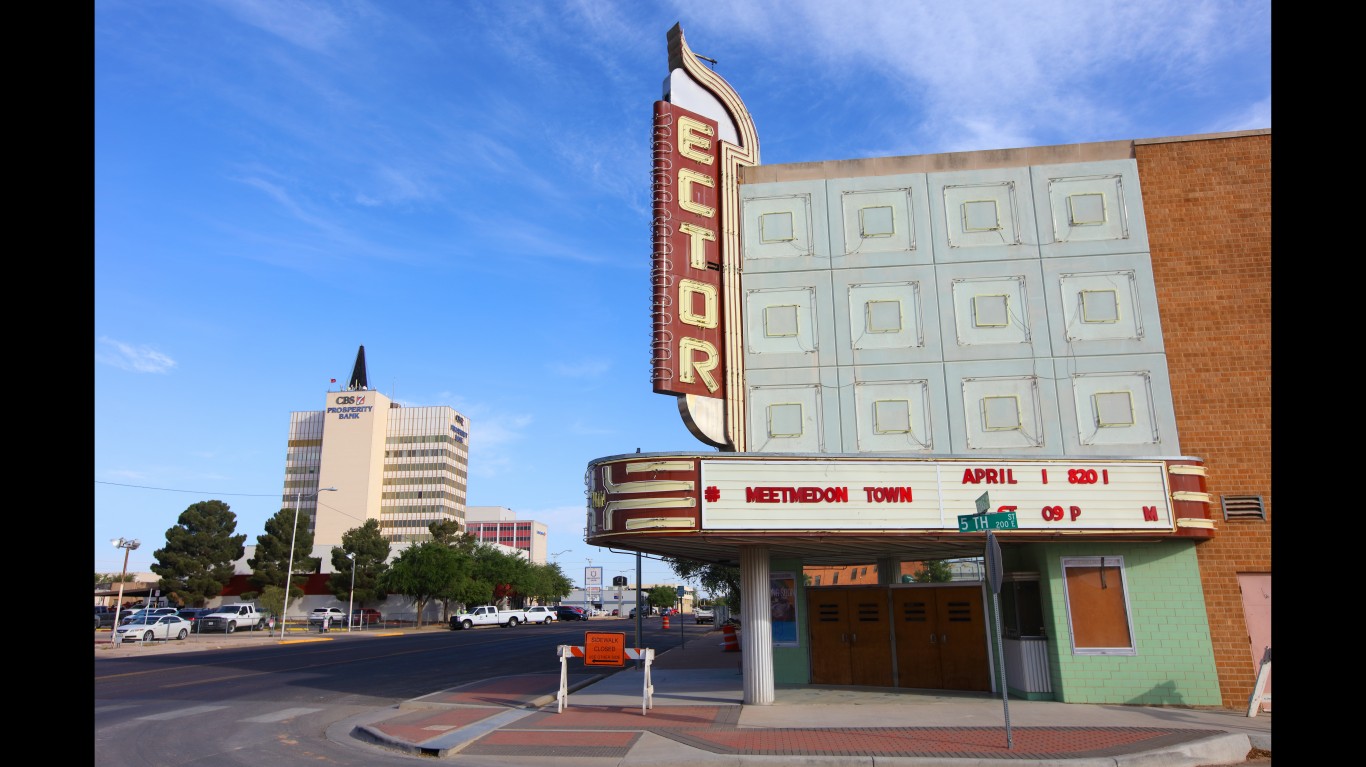
Texas: Odessa
> Traffic fatalities per 100,000 people: 30.6 (state: 13.1)
> Avg. commute time: 22 min. (state: 26.5 min.)
> Commuters driving to work: 91.7% (state: 90.4%)
> 2017 car thefts per 100,000 people: 336.1
Source: legacyimagesphotography / Getty Images
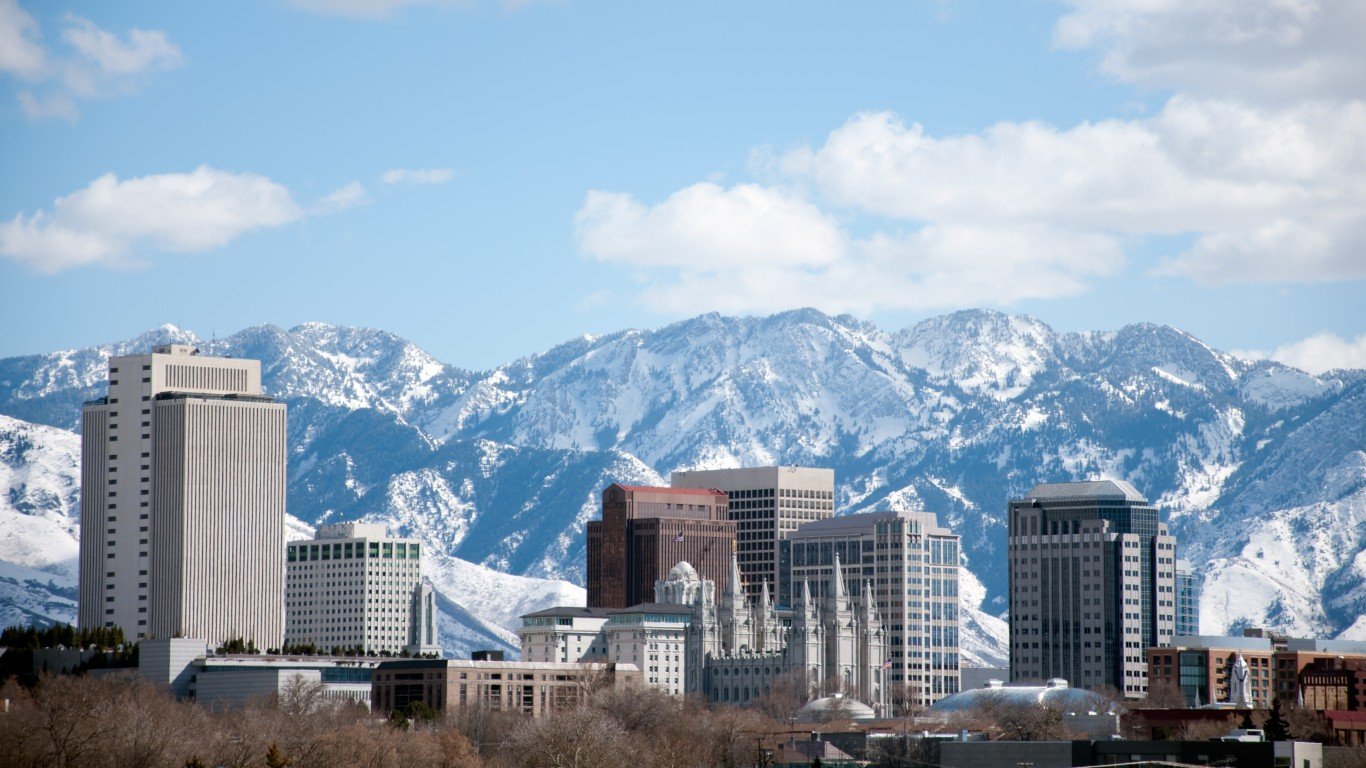
Utah: Salt Lake City
> Traffic fatalities per 100,000 people: 6.5 (state: 8.8)
> Avg. commute time: 22.4 min. (state: 22 min.)
> Commuters driving to work: 86.5% (state: 86.8%)
> 2017 car thefts per 100,000 people: 564.0
[in-text-ad-2]
Source: redjar / Flickr
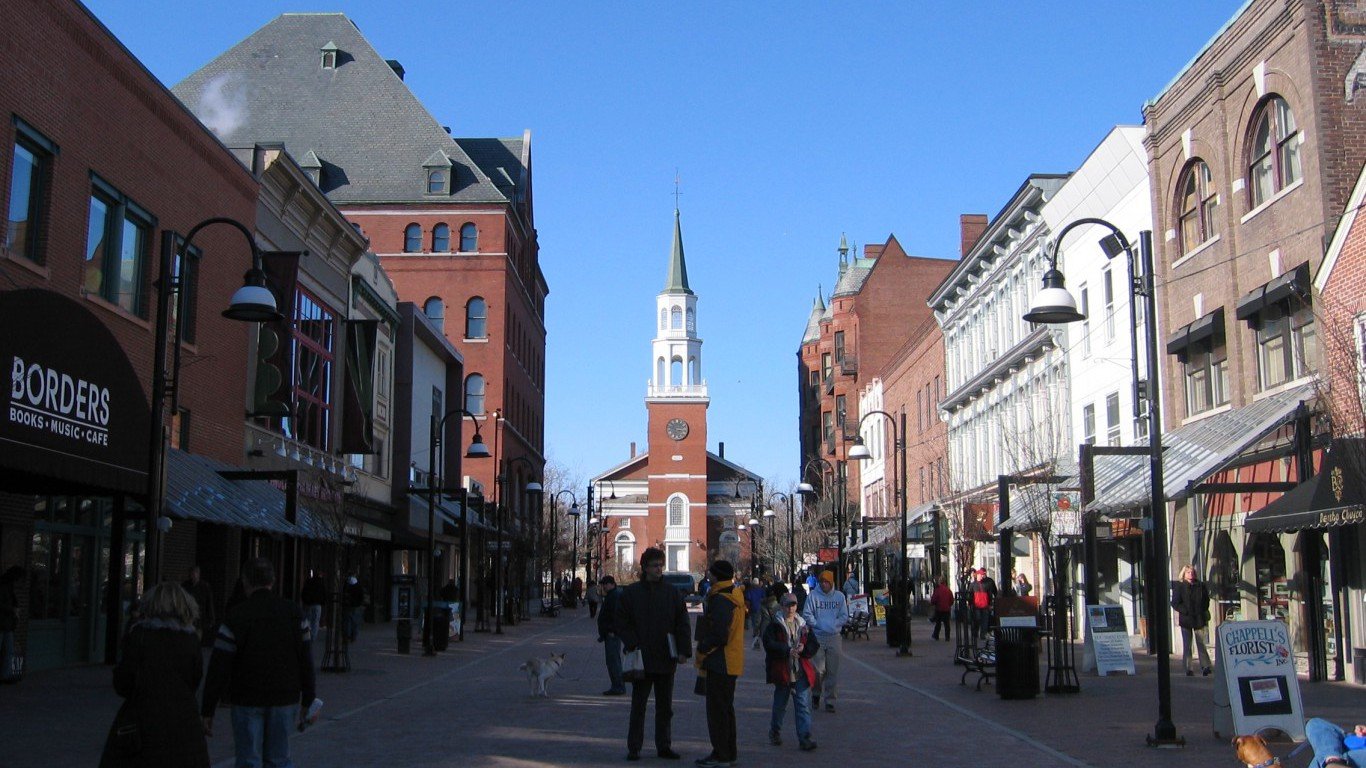
Vermont: Burlington-South Burlington
> Traffic fatalities per 100,000 people: 6.4 (state: 11.1)
> Avg. commute time: 22.4 min. (state: 23.2 min.)
> Commuters driving to work: 83.8% (state: 84.0%)
> 2017 car thefts per 100,000 people: 72.8
Source: Sarah Stierch / Wikimedia Commons
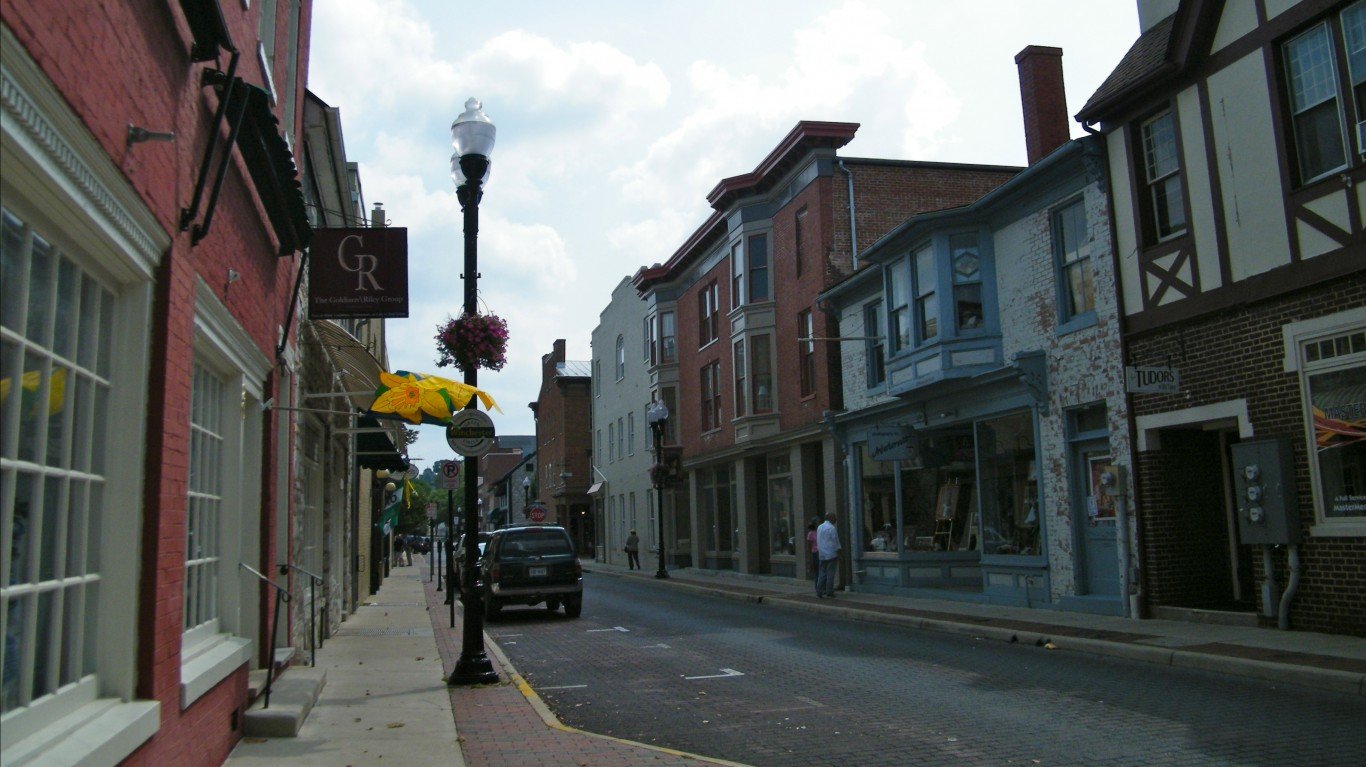
Virginia: Winchester
> Traffic fatalities per 100,000 people: 18.0 (state: 9.9)
> Avg. commute time: 30.7 min. (state: 28.6 min.)
> Commuters driving to work: 90.5% (state: 86.0%)
> 2017 car thefts per 100,000 people: 47.9
[in-text-ad]
Source: Craig Nagy from Vancouver, Canada / Wikimedia Commons
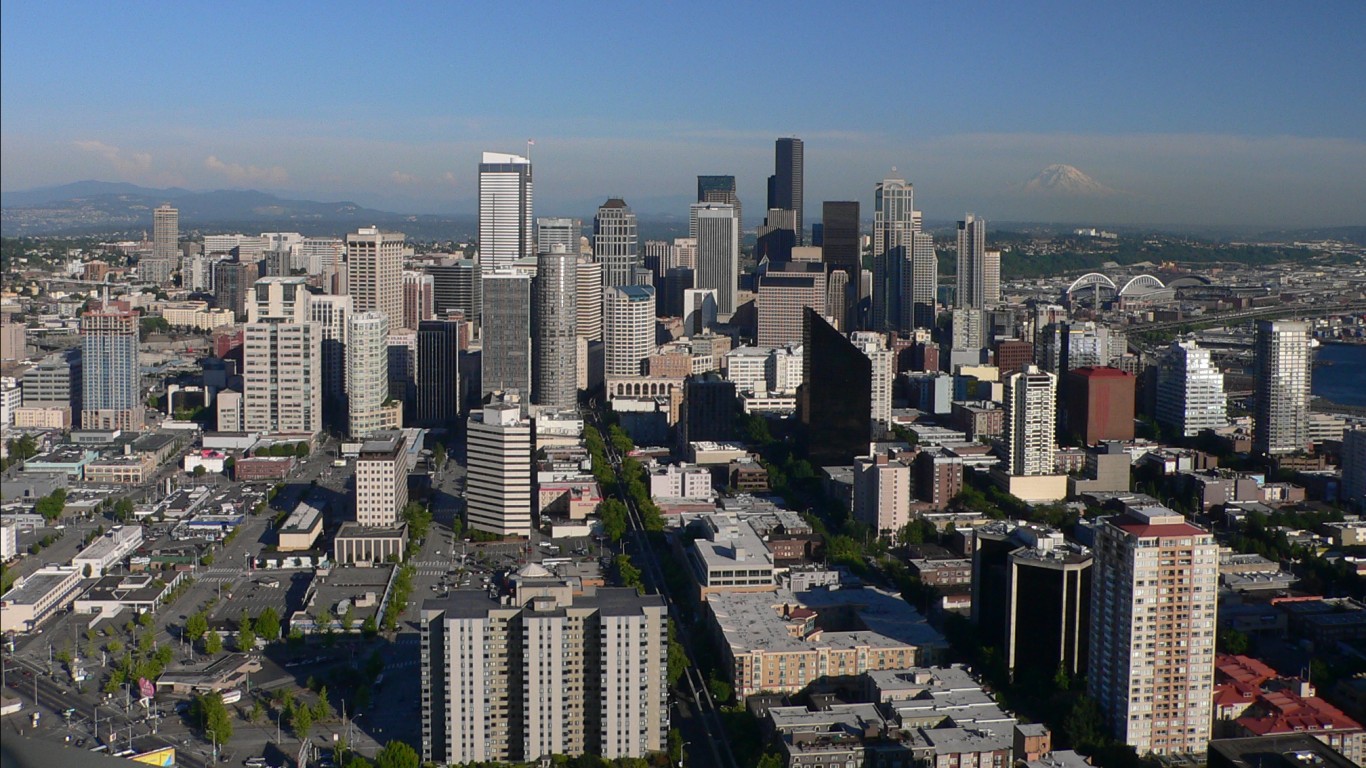
Washington: Seattle-Tacoma-Bellevue
> Traffic fatalities per 100,000 people: 5.4 (state: 7.6)
> Avg. commute time: 30.1 min. (state: 27.9 min.)
> Commuters driving to work: 78.1% (state: 81.9%)
> 2017 car thefts per 100,000 people: 494.9
 24/7 Wall St.
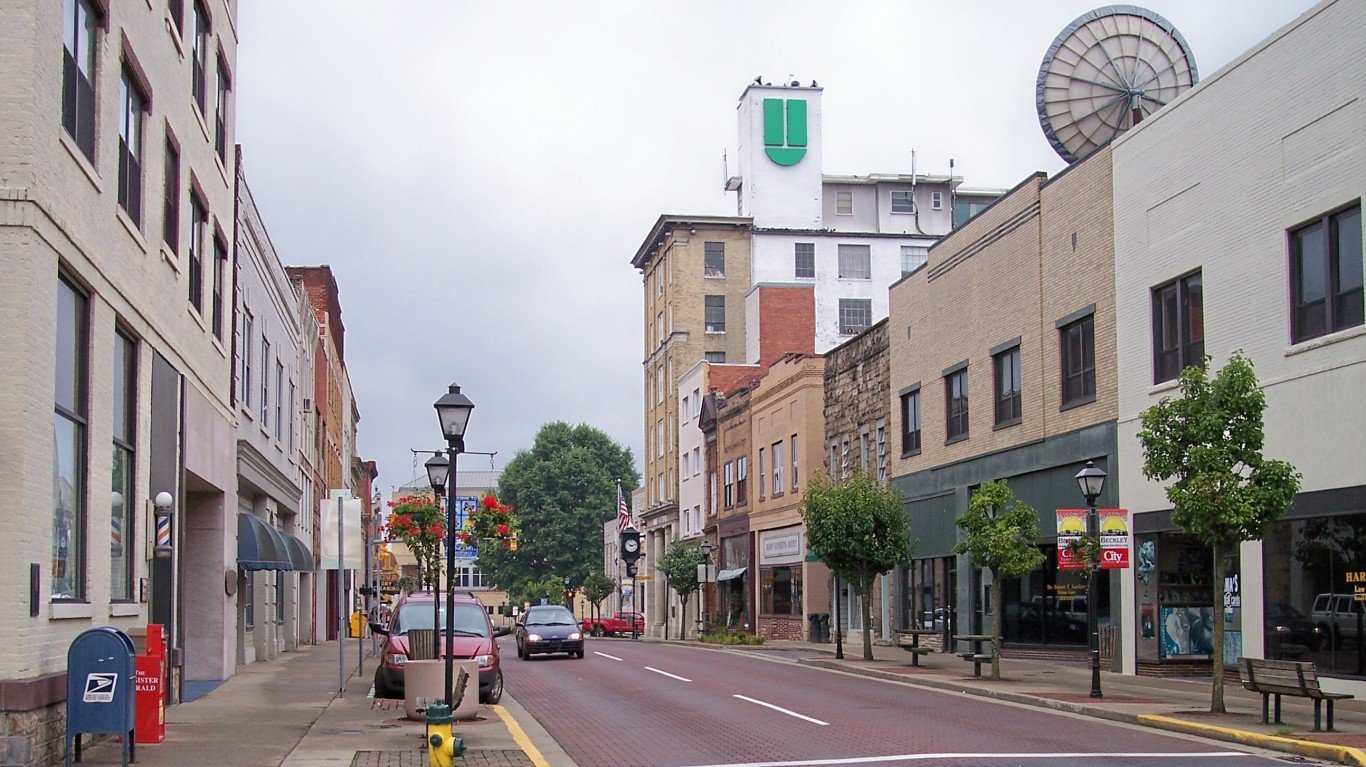
Source: Tim Kiser (w:User:Malepheasant) / Wikimedia Commons
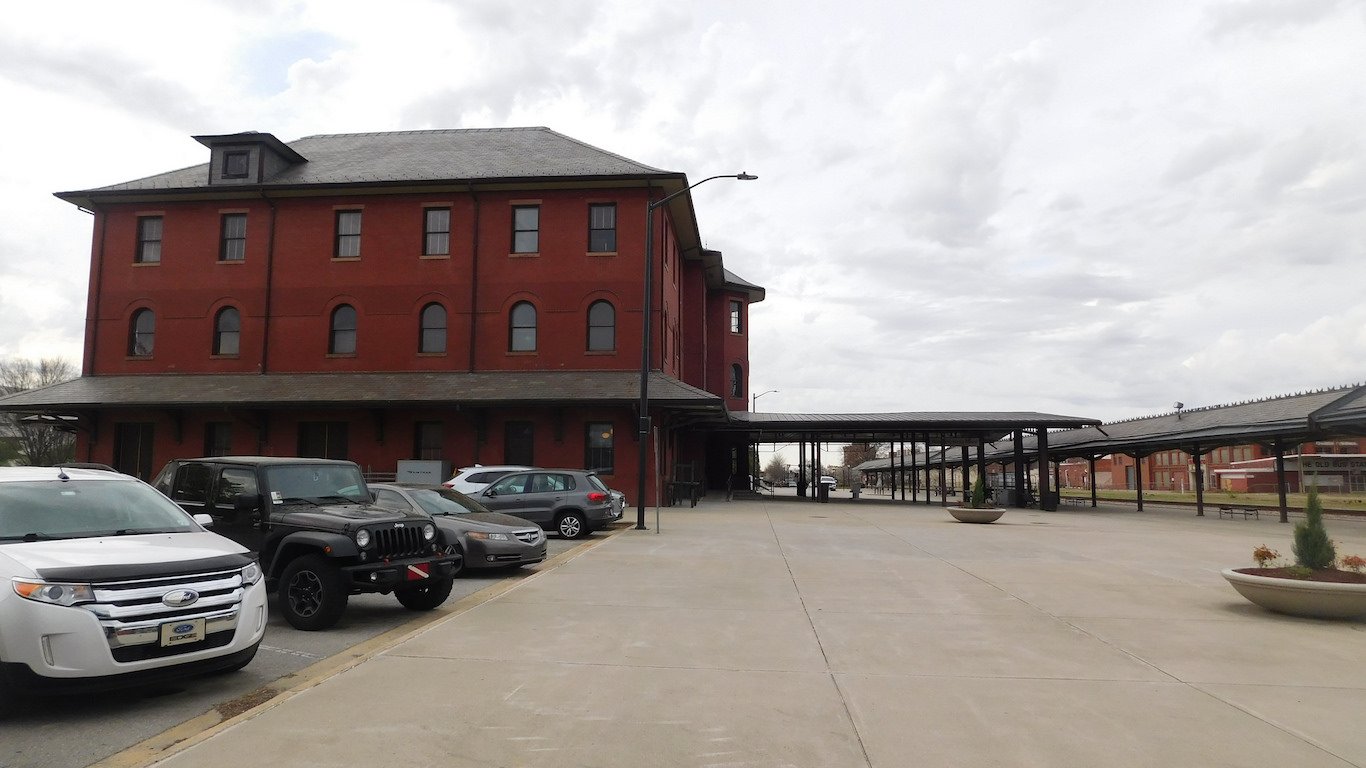
West Virginia: Beckley
> Traffic fatalities per 100,000 people: 17.7 (state: 16.7)
> Avg. commute time: 25.7 min. (state: 26 min.)
> Commuters driving to work: 93.5% (state: 91.8%)
> 2017 car thefts per 100,000 people: 90.3
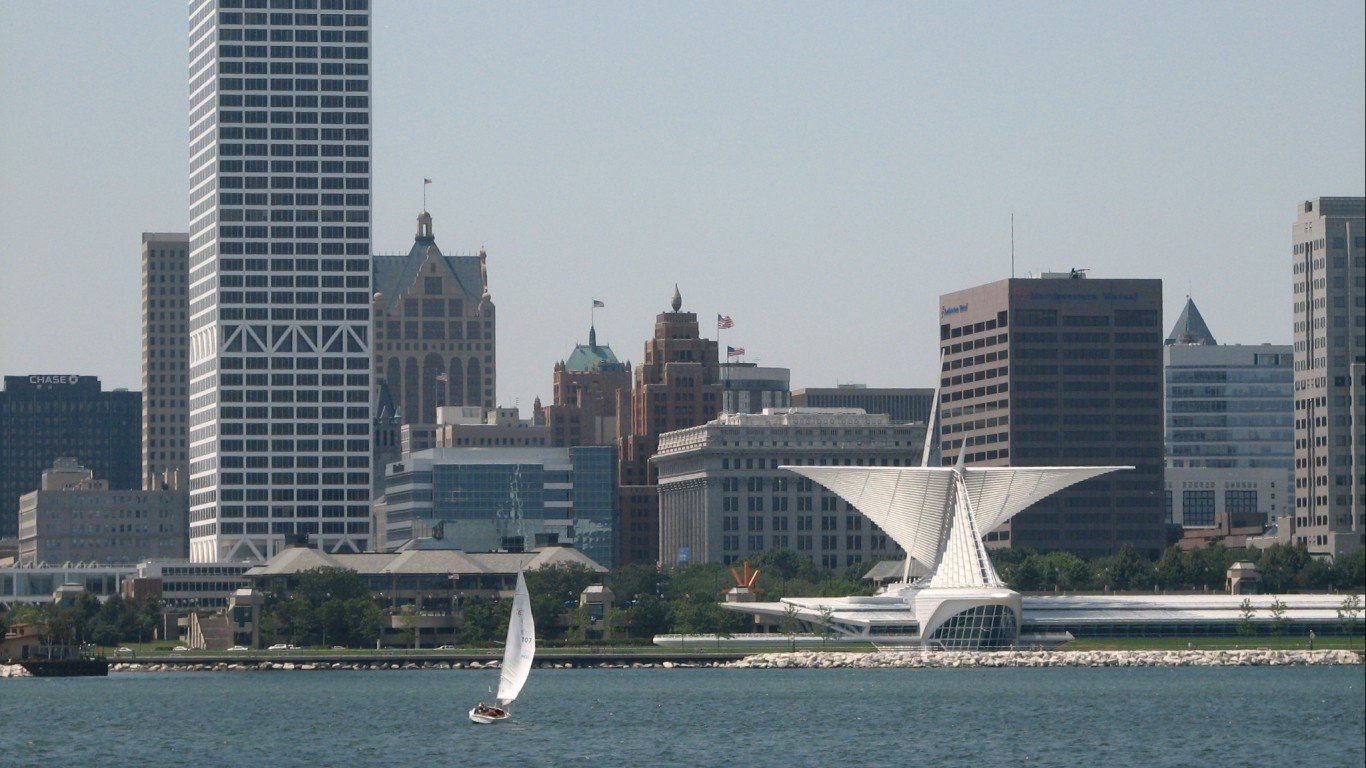
Source: Miwdke. / Wikimedia Commons
Wisconsin: Milwaukee-Waukesha-West Allis
> Traffic fatalities per 100,000 people: 7.9 (state: 10.6)
> Avg. commute time: 23.1 min. (state: 22.2 min.)
> Commuters driving to work: 88.4% (state: 88.8%)
> 2017 car thefts per 100,000 people: 413.4
[in-text-ad-2]
Source: Courtesy of J. Stephen Conn via Flickr
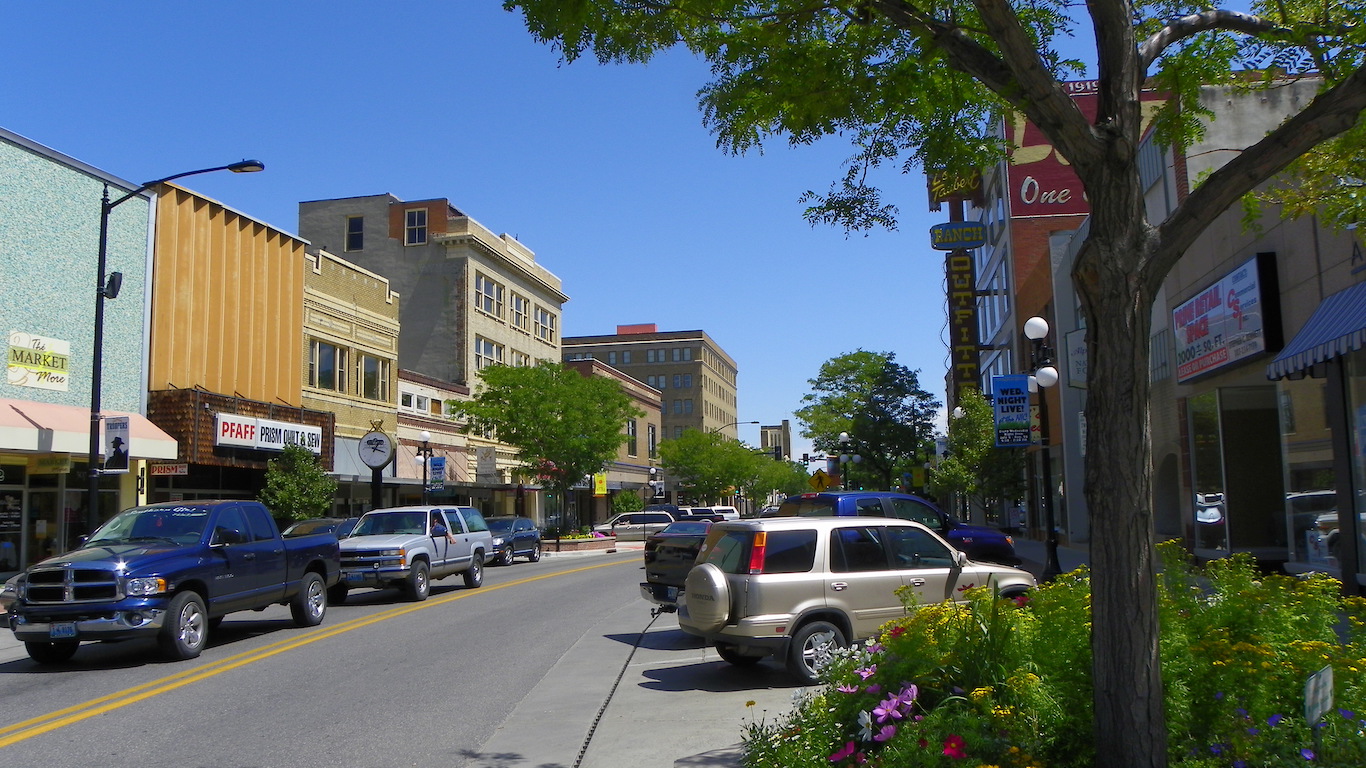
Wyoming: Casper
> Traffic fatalities per 100,000 people: 22.6 (state: 21.2)
> Avg. commute time: 17.2 min. (state: 17.6 min.)
> Commuters driving to work: N/A (state: 88.1%)
> 2017 car thefts per 100,000 people: 142.1
Sponsored: Want to Retire Early? Start Here
Want retirement to come a few years earlier than you’d planned? Orare you ready to retire now, but want an extra set of eyes on your finances?
Now you can speak with up to 3 financial experts in your area for FREE. By simply clicking here you can begin to match with financial professionals who can help you build your plan to retire early. And the best part? The first conversation with them is free.
Click here to match with up to 3 financial pros who would be excited to help you make financial decisions.
Thank you for reading! Have some feedback for us?
Contact the 24/7 Wall St. editorial team.
Editors' Picks

