The United States has long held the status as one of the most innovative countries in the world. This fact can be in part attributed to public funding of research and development projects. The U.S. federal government spends well over $100 billion on R&D, every year. Similarly, the private sector as well is a major engine for innovation, from companies on the Fortune 500 down to small start-ups. Amazon alone spent over $60 billion on R&D last fiscal year, a larger total than the GDPs of many small countries.
Many key indicators reveal that much of the innovation that takes place in the U.S. is concentrated in certain parts of the country. Using an innovation index created by personal finance website WalletHub in its report report Most & Least Innovative States, 24/7 Wall St. listed all 50 states in order from least innovative to most. The WalletHub index ranks states based on multiple measures indicative of innovation – including patents issued, venture capital funding, entrepreneurship, and employment in STEM, or science, technology, engineering, and math fields. We included some additional data, such as employment in STEM, venture capital investment, and patents issued, using different sources. (Here are 20 ancient inventions we still use today.)
Many of the most innovative states are coastal, located along both the Atlantic and Pacific coasts. These places are often notable for their high concentration of large research universities, in addition to being home to major employers in industries ranging from defense to information technology. (Here is a look at 30 inventions that shaped military history.)
Jobs in STEM fields in these states tend to be higher paying than STEM jobs in states that rank lower on this list. In each of the five least innovative states, for example, the average annual salary among STEM workers is less than $85,000, while in each of the five most innovative states, the average STEM salary exceeds $100,000.
Click here to see the best and worst states for science and tech.
Click here to see our detailed methodology.

50. Mississippi
> Innovation index score: 20.1 out of 100
> Employment in STEM fields: 3.3% of all workers – the lowest (36,840 people total)
> Avg. annual income in STEM jobs: $74,410 – 2nd lowest
> Venture capital investments; 2021: $11.3 million – the lowest (2 VC deals total)
> Patents issued in 2020: 6.9 per 100,000 people – the fewest (205 total)
[in-text-ad]
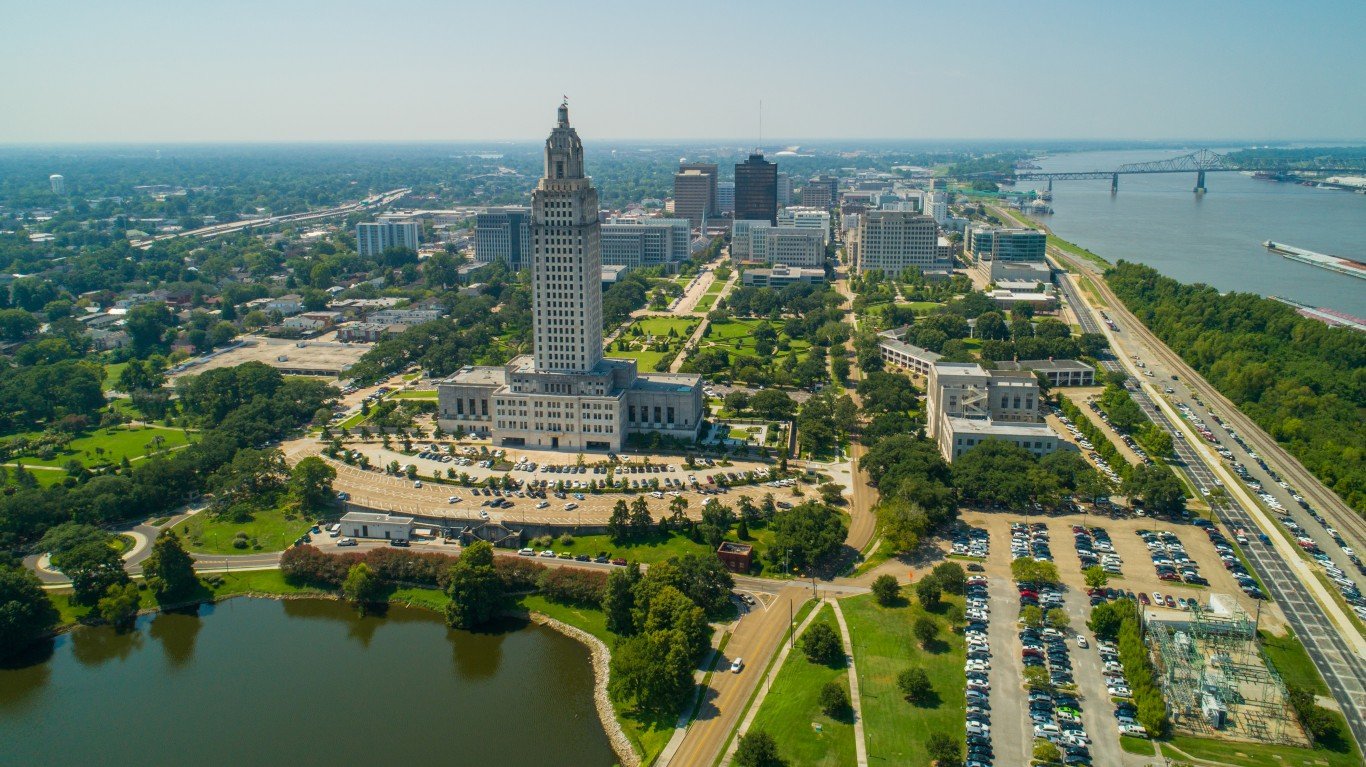
49. Louisiana
> Innovation index score: 21.3 out of 100
> Employment in STEM fields: 3.6% of all workers – 2nd lowest (64,200 people total)
> Avg. annual income in STEM jobs: $82,900 – 12th lowest
> Venture capital investments; 2021: $86.8 million – 6th lowest (27 VC deals total)
> Patents issued in 2020: 11.1 per 100,000 people – 4th fewest (512 total)
[recirclink id=1152823]

48. North Dakota
> Innovation index score: 28.6 out of 100
> Employment in STEM fields: 4.2% of all workers – 6th lowest (16,780 people total)
> Avg. annual income in STEM jobs: $78,620 – 7th lowest
> Venture capital investments; 2021: $47.7 million – 4th lowest (4 VC deals total)
> Patents issued in 2020: 17.8 per 100,000 people – 11th fewest (138 total)

47. West Virginia
> Innovation index score: 28.8 out of 100
> Employment in STEM fields: 4.1% of all workers – 5th lowest (27,280 people total)
> Avg. annual income in STEM jobs: $76,880 – 5th lowest
> Venture capital investments; 2021: $29.1 million – 2nd lowest (10 VC deals total)
> Patents issued in 2020: 7.5 per 100,000 people – 2nd fewest (134 total)
[in-text-ad-2]

46. Arkansas
> Innovation index score: 29.2 out of 100
> Employment in STEM fields: 3.9% of all workers – 4th lowest (47,020 people total)
> Avg. annual income in STEM jobs: $81,150 – 9th lowest
> Venture capital investments; 2021: $131.1 million – 12th lowest (33 VC deals total)
> Patents issued in 2020: 17.7 per 100,000 people – 10th fewest (535 total)

45. Nebraska
> Innovation index score: 29.9 out of 100
> Employment in STEM fields: 6.0% of all workers – 24th highest (57,400 people total)
> Avg. annual income in STEM jobs: $83,030 – 14th lowest
> Venture capital investments; 2021: $317.7 million – 20th lowest (43 VC deals total)
> Patents issued in 2020: 21.7 per 100,000 people – 15th fewest (427 total)
[in-text-ad]

44. South Dakota
> Innovation index score: 31.5 out of 100
> Employment in STEM fields: 4.8% of all workers – 9th lowest (20,330 people total)
> Avg. annual income in STEM jobs: $77,270 – 6th lowest
> Venture capital investments; 2021: $168.7 million – 13th lowest (10 VC deals total)
> Patents issued in 2020: 18.4 per 100,000 people – 12th fewest (165 total)
[recirclink id=853307]

43. Iowa
> Innovation index score: 32.2 out of 100
> Employment in STEM fields: 5.6% of all workers – 19th lowest (82,550 people total)
> Avg. annual income in STEM jobs: $86,610 – 23rd lowest
> Venture capital investments; 2021: $205.3 million – 16th lowest (42 VC deals total)
> Patents issued in 2020: 37.6 per 100,000 people – 22nd most (1,202 total)

42. Kentucky
> Innovation index score: 32.8 out of 100
> Employment in STEM fields: 4.3% of all workers – 7th lowest (79,320 people total)
> Avg. annual income in STEM jobs: $76,040 – 4th lowest
> Venture capital investments; 2021: $200.0 million – 15th lowest (50 VC deals total)
> Patents issued in 2020: 19.3 per 100,000 people – 13th fewest (869 total)
[in-text-ad-2]
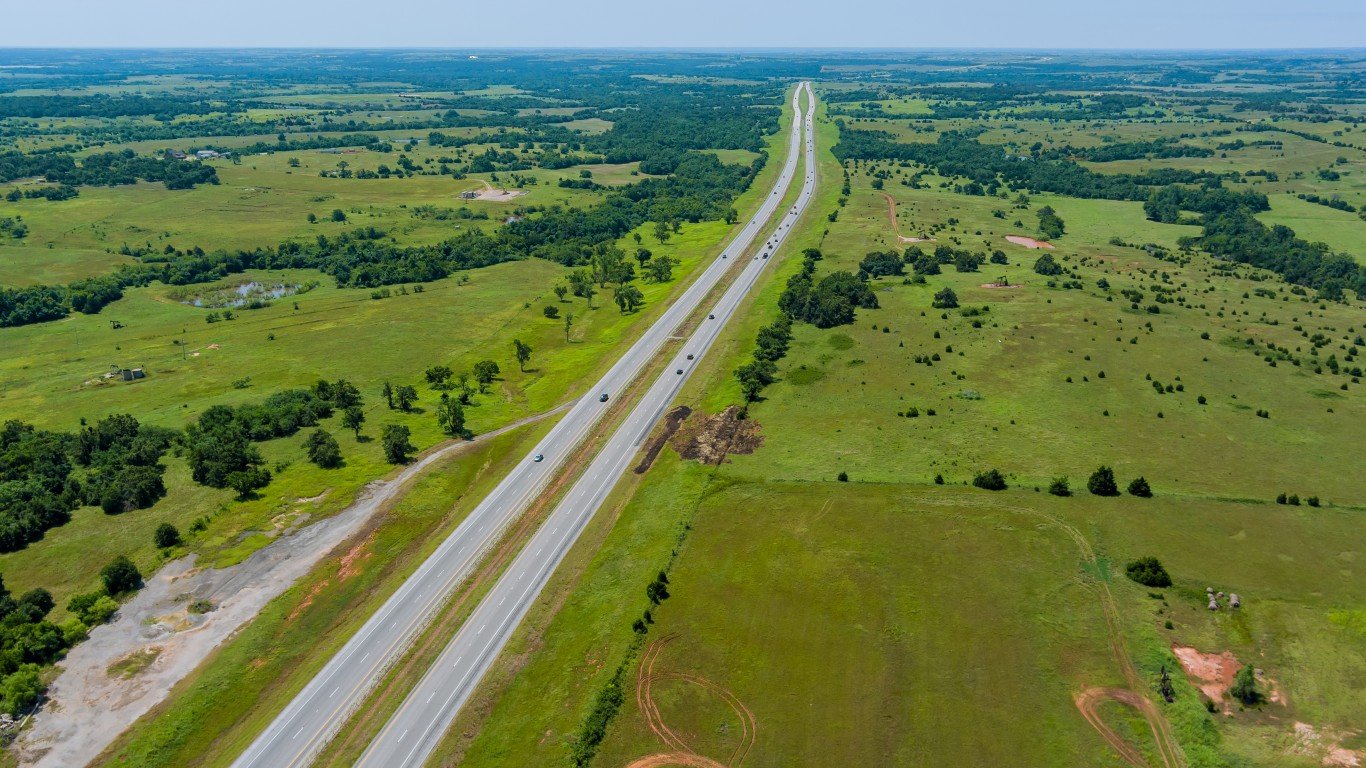
41. Oklahoma
> Innovation index score: 33.2 out of 100
> Employment in STEM fields: 5.1% of all workers – 16th lowest (79,710 people total)
> Avg. annual income in STEM jobs: $84,710 – 19th lowest
> Venture capital investments; 2021: $109.4 million – 9th lowest (17 VC deals total)
> Patents issued in 2020: 17.3 per 100,000 people – 9th fewest (689 total)

40. Tennessee
> Innovation index score: 33.3 out of 100
> Employment in STEM fields: 5.1% of all workers – 14th lowest (151,010 people total)
> Avg. annual income in STEM jobs: $82,960 – 13th lowest
> Venture capital investments; 2021: $1.0 billion – 25th highest (124 VC deals total)
> Patents issued in 2020: 21.4 per 100,000 people – 14th fewest (1,494 total)
[in-text-ad]

39. Hawaii
> Innovation index score: 34.2 out of 100
> Employment in STEM fields: 5.1% of all workers – 15th lowest (28,010 people total)
> Avg. annual income in STEM jobs: $89,180 – 25th highest
> Venture capital investments; 2021: $63.1 million – 5th lowest (12 VC deals total)
> Patents issued in 2020: 11.2 per 100,000 people – 5th fewest (161 total)
[recirclink id=1149610]

38. Maine
> Innovation index score: 34.5 out of 100
> Employment in STEM fields: 5.0% of all workers – 12th lowest (29,820 people total)
> Avg. annual income in STEM jobs: $85,750 – 21st lowest
> Venture capital investments; 2021: $115.3 million – 10th lowest (32 VC deals total)
> Patents issued in 2020: 16.6 per 100,000 people – 8th fewest (228 total)

37. Kansas
> Innovation index score: 34.8 out of 100
> Employment in STEM fields: 5.7% of all workers – 22nd lowest (76,500 people total)
> Avg. annual income in STEM jobs: $83,470 – 17th lowest
> Venture capital investments; 2021: $283.9 million – 19th lowest (32 VC deals total)
> Patents issued in 2020: 30.8 per 100,000 people – 21st fewest (905 total)
[in-text-ad-2]

36. Nevada
> Innovation index score: 34.8 out of 100
> Employment in STEM fields: 3.9% of all workers – 3rd lowest (49,740 people total)
> Avg. annual income in STEM jobs: $81,680 – 10th lowest
> Venture capital investments; 2021: $1.7 billion – 19th highest (111 VC deals total)
> Patents issued in 2020: 33.2 per 100,000 people – 23rd fewest (1,045 total)

35. Montana
> Innovation index score: 35.6 out of 100
> Employment in STEM fields: 5.7% of all workers – 21st lowest (26,850 people total)
> Avg. annual income in STEM jobs: $71,740 – the lowest
> Venture capital investments; 2021: $510.0 million – 23rd lowest (34 VC deals total)
> Patents issued in 2020: 16.3 per 100,000 people – 7th fewest (180 total)
[in-text-ad]

34. Alabama
> Innovation index score: 35.7 out of 100
> Employment in STEM fields: 5.9% of all workers – 25th highest (114,200 people total)
> Avg. annual income in STEM jobs: $92,290 – 22nd highest
> Venture capital investments; 2021: $245.9 million – 17th lowest (57 VC deals total)
> Patents issued in 2020: 12.0 per 100,000 people – 6th fewest (607 total)
[recirclink id=1140381]

33. Missouri
> Innovation index score: 36.5 out of 100
> Employment in STEM fields: 5.6% of all workers – 17th lowest (151,620 people total)
> Avg. annual income in STEM jobs: $85,080 – 20th lowest
> Venture capital investments; 2021: $1.2 billion – 24th highest (103 VC deals total)
> Patents issued in 2020: 26.9 per 100,000 people – 19th fewest (1,657 total)

32. Alaska
> Innovation index score: 36.8 out of 100
> Employment in STEM fields: 6.5% of all workers – 18th highest (19,330 people total)
> Avg. annual income in STEM jobs: $92,340 – 21st highest
> Venture capital investments; 2021: $32.5 million – 3rd lowest (11 VC deals total)
> Patents issued in 2020: 9.1 per 100,000 people – 3rd fewest (67 total)
[in-text-ad-2]
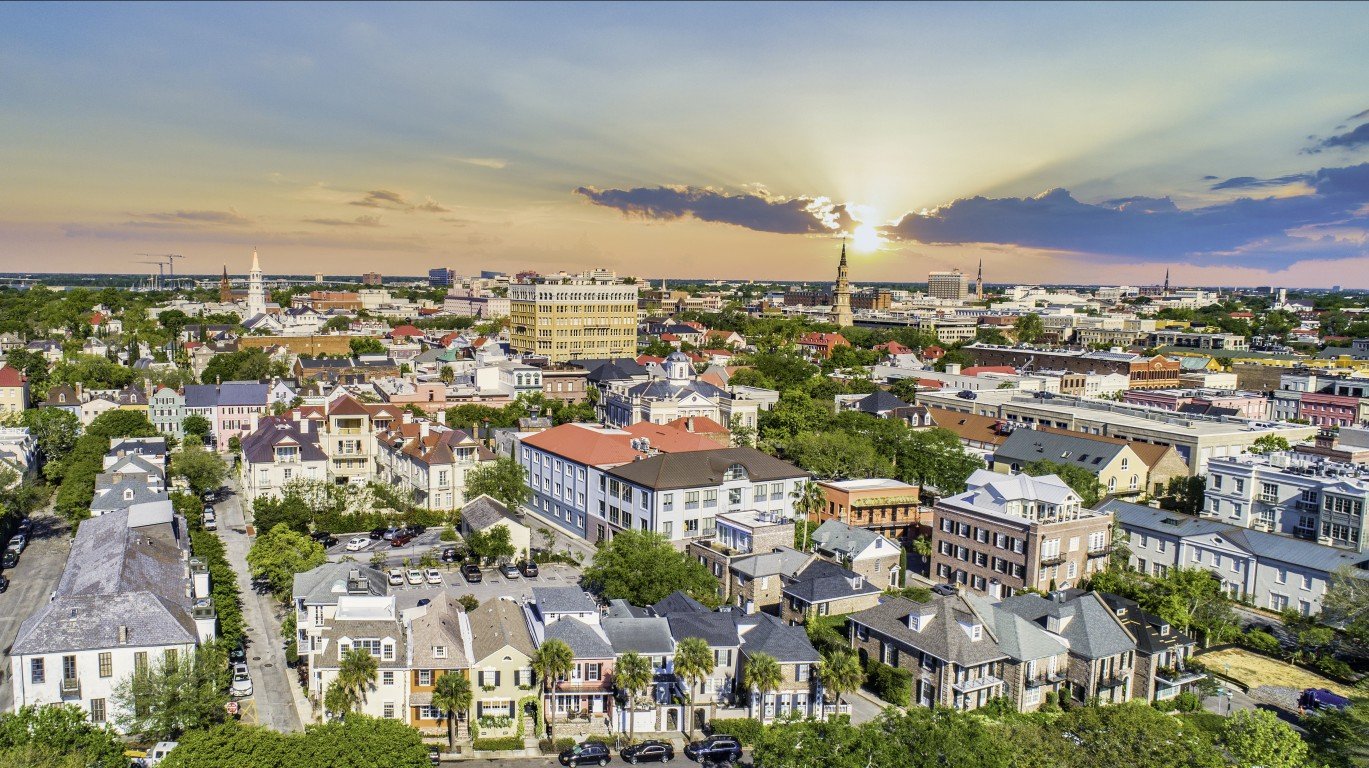
31. South Carolina
> Innovation index score: 37.1 out of 100
> Employment in STEM fields: 4.8% of all workers – 10th lowest (99,820 people total)
> Avg. annual income in STEM jobs: $83,320 – 15th lowest
> Venture capital investments; 2021: $252.3 million – 18th lowest (52 VC deals total)
> Patents issued in 2020: 26.6 per 100,000 people – 18th fewest (1,382 total)

30. Ohio
> Innovation index score: 37.7 out of 100
> Employment in STEM fields: 5.9% of all workers – 25th lowest (304,580 people total)
> Avg. annual income in STEM jobs: $88,620 – 25th lowest
> Venture capital investments; 2021: $2.4 billion – 15th highest (179 VC deals total)
> Patents issued in 2020: 45.7 per 100,000 people – 18th most (5,386 total)
[in-text-ad]

29. Indiana
> Innovation index score: 38.7 out of 100
> Employment in STEM fields: 4.9% of all workers – 11th lowest (146,350 people total)
> Avg. annual income in STEM jobs: $82,710 – 11th lowest
> Venture capital investments; 2021: $490.5 million – 22nd lowest (143 VC deals total)
> Patents issued in 2020: 37.2 per 100,000 people – 23rd most (2,529 total)
[recirclink id=1102620]

28. Wisconsin
> Innovation index score: 39.2 out of 100
> Employment in STEM fields: 6.1% of all workers – 22nd highest (168,090 people total)
> Avg. annual income in STEM jobs: $83,430 – 16th lowest
> Venture capital investments; 2021: $541.5 million – 24th lowest (86 VC deals total)
> Patents issued in 2020: 49.8 per 100,000 people – 15th most (2,939 total)

27. Illinois
> Innovation index score: 40.1 out of 100
> Employment in STEM fields: 5.7% of all workers – 20th lowest (319,900 people total)
> Avg. annual income in STEM jobs: $96,950 – 18th highest
> Venture capital investments; 2021: $7.3 billion – 6th highest (412 VC deals total)
> Patents issued in 2020: 48.7 per 100,000 people – 16th most (6,175 total)
[in-text-ad-2]

26. Wyoming
> Innovation index score: 40.8 out of 100
> Employment in STEM fields: 4.4% of all workers – 8th lowest (11,570 people total)
> Avg. annual income in STEM jobs: $75,620 – 3rd lowest
> Venture capital investments; 2021: $119.5 million – 11th lowest (28 VC deals total)
> Patents issued in 2020: 27.5 per 100,000 people – 20th fewest (159 total)

25. Georgia
> Innovation index score: 41.3 out of 100
> Employment in STEM fields: 6.0% of all workers – 23rd highest (262,590 people total)
> Avg. annual income in STEM jobs: $96,130 – 19th highest
> Venture capital investments; 2021: $4.2 billion – 11th highest (261 VC deals total)
> Patents issued in 2020: 31.2 per 100,000 people – 22nd fewest (3,365 total)
[in-text-ad]

24. Vermont
> Innovation index score: 41.7 out of 100
> Employment in STEM fields: 5.8% of all workers – 23rd lowest (16,540 people total)
> Avg. annual income in STEM jobs: $84,640 – 18th lowest
> Venture capital investments; 2021: $657.9 million – 25th lowest (35 VC deals total)
> Patents issued in 2020: 55.6 per 100,000 people – 12th most (359 total)
[recirclink id=1152823]

23. Rhode Island
> Innovation index score: 42.0 out of 100
> Employment in STEM fields: 6.3% of all workers – 20th highest (28,820 people total)
> Avg. annual income in STEM jobs: $101,890 – 11th highest
> Venture capital investments; 2021: $89.8 million – 7th lowest (27 VC deals total)
> Patents issued in 2020: 45.9 per 100,000 people – 17th most (503 total)

22. Pennsylvania
> Innovation index score: 42.0 out of 100
> Employment in STEM fields: 6.3% of all workers – 21st highest (349,380 people total)
> Avg. annual income in STEM jobs: $90,730 – 23rd highest
> Venture capital investments; 2021: $6.7 billion – 8th highest (384 VC deals total)
> Patents issued in 2020: 36.5 per 100,000 people – 25th most (4,737 total)
[in-text-ad-2]

21. New York
> Innovation index score: 42.0 out of 100
> Employment in STEM fields: 5.6% of all workers – 18th lowest (481,860 people total)
> Avg. annual income in STEM jobs: $109,870 – 6th highest
> Venture capital investments; 2021: $49.6 billion – 2nd highest (2,140 VC deals total)
> Patents issued in 2020: 53.1 per 100,000 people – 14th most (10,540 total)

20. Minnesota
> Innovation index score: 43.2 out of 100
> Employment in STEM fields: 7.2% of all workers – 11th highest (197,520 people total)
> Avg. annual income in STEM jobs: $97,140 – 17th highest
> Venture capital investments; 2021: $1.3 billion – 23rd highest (173 VC deals total)
> Patents issued in 2020: 82.9 per 100,000 people – 6th most (4,734 total)
[in-text-ad]

19. Arizona
> Innovation index score: 43.5 out of 100
> Employment in STEM fields: 6.5% of all workers – 19th highest (188,040 people total)
> Avg. annual income in STEM jobs: $95,180 – 20th highest
> Venture capital investments; 2021: $2.0 billion – 17th highest (167 VC deals total)
> Patents issued in 2020: 43.2 per 100,000 people – 20th most (3,140 total)
[recirclink id=853307]

18. North Carolina
> Innovation index score: 44.4 out of 100
> Employment in STEM fields: 6.8% of all workers – 16th highest (300,820 people total)
> Avg. annual income in STEM jobs: $97,830 – 13th highest
> Venture capital investments; 2021: $3.5 billion – 13th highest (329 VC deals total)
> Patents issued in 2020: 37.1 per 100,000 people – 24th most (3,917 total)

17. Florida
> Innovation index score: 45.8 out of 100
> Employment in STEM fields: 5.1% of all workers – 13th lowest (434,920 people total)
> Avg. annual income in STEM jobs: $87,090 – 24th lowest
> Venture capital investments; 2021: $6.0 billion – 9th highest (500 VC deals total)
> Patents issued in 2020: 25.3 per 100,000 people – 17th fewest (5,513 total)
[in-text-ad-2]

16. Idaho
> Innovation index score: 46.5 out of 100
> Employment in STEM fields: 5.8% of all workers – 24th lowest (44,160 people total)
> Avg. annual income in STEM jobs: $80,060 – 8th lowest
> Venture capital investments; 2021: $370.3 million – 21st lowest (40 VC deals total)
> Patents issued in 2020: 63.8 per 100,000 people – 10th most (1,213 total)

15. Texas
> Innovation index score: 46.8 out of 100
> Employment in STEM fields: 6.6% of all workers – 17th highest (811,790 people total)
> Avg. annual income in STEM jobs: $97,680 – 14th highest
> Venture capital investments; 2021: $9.0 billion – 4th highest (794 VC deals total)
> Patents issued in 2020: 44.7 per 100,000 people – 19th most (13,192 total)
[in-text-ad]

14. Connecticut
> Innovation index score: 47.1 out of 100
> Employment in STEM fields: 7.0% of all workers – 14th highest (109,580 people total)
> Avg. annual income in STEM jobs: $104,020 – 10th highest
> Venture capital investments; 2021: $1.7 billion – 20th highest (176 VC deals total)
> Patents issued in 2020: 96.5 per 100,000 people – 4th most (3,478 total)
[recirclink id=1149610]
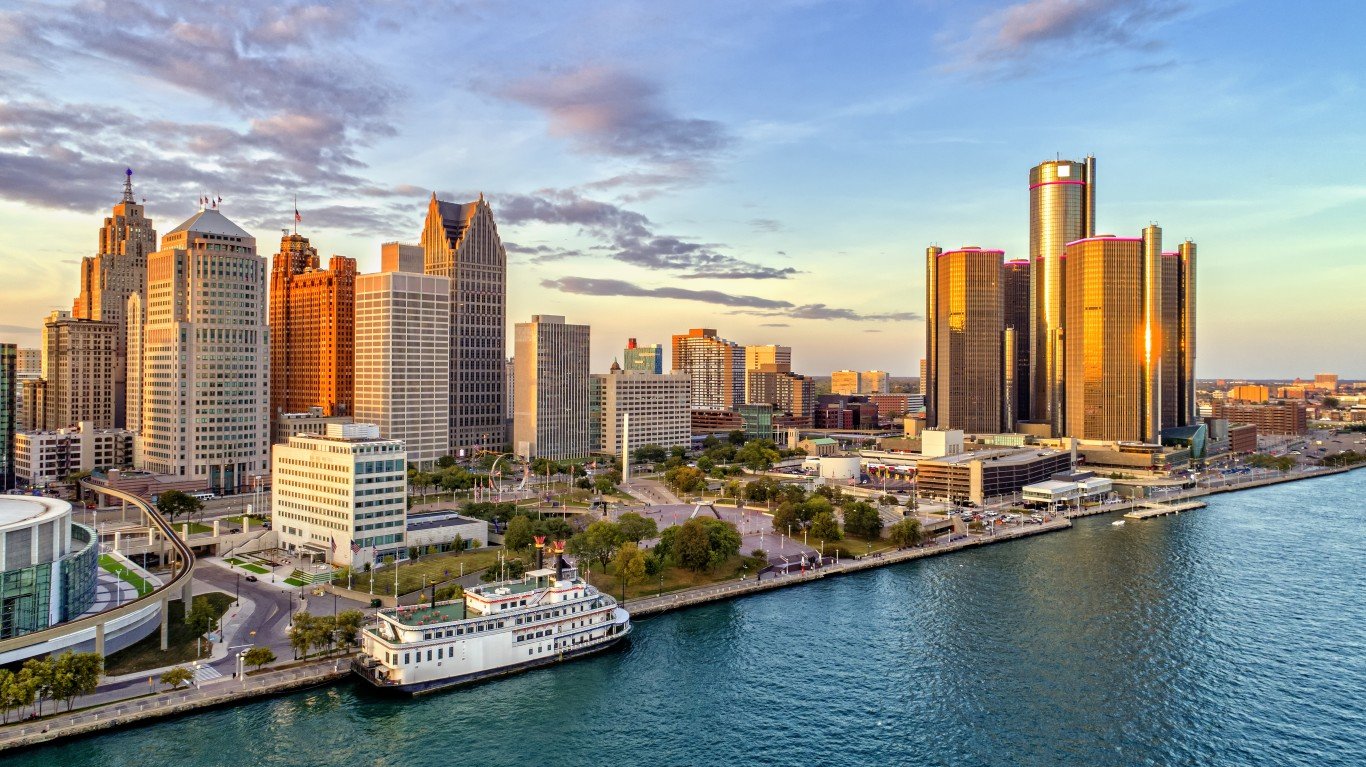
13. Michigan
> Innovation index score: 47.4 out of 100
> Employment in STEM fields: 7.2% of all workers – 10th highest (293,880 people total)
> Avg. annual income in STEM jobs: $90,070 – 24th highest
> Venture capital investments; 2021: $1.4 billion – 22nd highest (162 VC deals total)
> Patents issued in 2020: 74.4 per 100,000 people – 8th most (7,478 total)
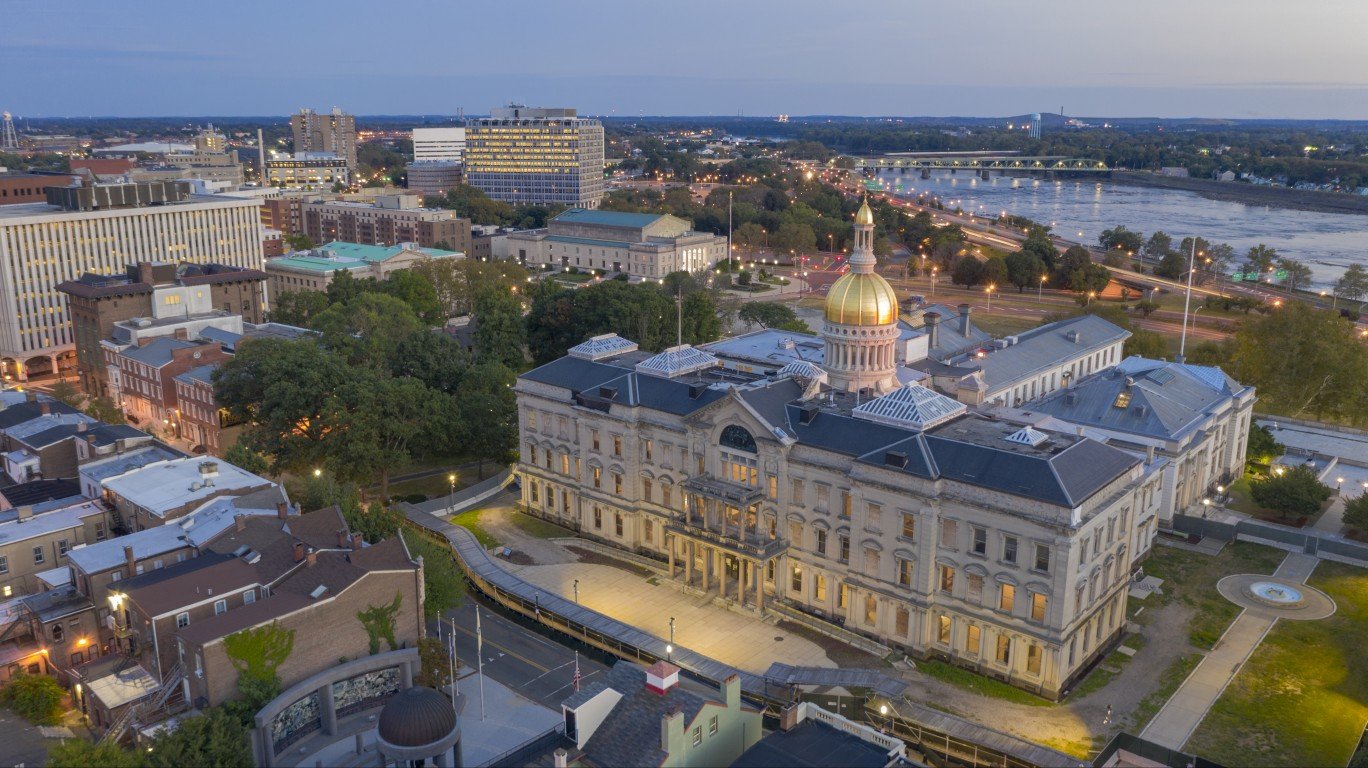
12. New Jersey
> Innovation index score: 50.4 out of 100
> Employment in STEM fields: 7.2% of all workers – 12th highest (276,770 people total)
> Avg. annual income in STEM jobs: $115,110 – 3rd highest
> Venture capital investments; 2021: $5.6 billion – 10th highest (226 VC deals total)
> Patents issued in 2020: 54.2 per 100,000 people – 13th most (5,027 total)
[in-text-ad-2]

11. New Mexico
> Innovation index score: 50.5 out of 100
> Employment in STEM fields: 6.9% of all workers – 15th highest (53,280 people total)
> Avg. annual income in STEM jobs: $97,390 – 16th highest
> Venture capital investments; 2021: $169.3 million – 14th lowest (41 VC deals total)
> Patents issued in 2020: 24.1 per 100,000 people – 16th fewest (509 total)

10. Oregon
> Innovation index score: 51.8 out of 100
> Employment in STEM fields: 7.5% of all workers – 8th highest (136,860 people total)
> Avg. annual income in STEM jobs: $97,560 – 15th highest
> Venture capital investments; 2021: $1.6 billion – 21st highest (160 VC deals total)
> Patents issued in 2020: 96.4 per 100,000 people – 5th most (4,093 total)
[in-text-ad]

9. Utah
> Innovation index score: 52.5 out of 100
> Employment in STEM fields: 7.6% of all workers – 7th highest (117,790 people total)
> Avg. annual income in STEM jobs: $86,430 – 22nd lowest
> Venture capital investments; 2021: $4.2 billion – 12th highest (209 VC deals total)
> Patents issued in 2020: 61.0 per 100,000 people – 11th most (2,036 total)
[recirclink id=1140381]

8. New Hampshire
> Innovation index score: 54.7 out of 100
> Employment in STEM fields: 7.3% of all workers – 9th highest (46,060 people total)
> Avg. annual income in STEM jobs: $100,760 – 12th highest
> Venture capital investments; 2021: $102.4 million – 8th lowest (38 VC deals total)
> Patents issued in 2020: 79.4 per 100,000 people – 7th most (1,103 total)

7. Delaware
> Innovation index score: 55.4 out of 100
> Employment in STEM fields: 7.2% of all workers – 13th highest (31,210 people total)
> Avg. annual income in STEM jobs: $105,100 – 8th highest
> Venture capital investments; 2021: $1.9 billion – 18th highest (275 VC deals total)
> Patents issued in 2020: 35.7 per 100,000 people – 25th fewest (358 total)
[in-text-ad-2]

6. California
> Innovation index score: 61.5 out of 100
> Employment in STEM fields: 7.9% of all workers – 6th highest (1,309,560 people total)
> Avg. annual income in STEM jobs: $123,210 – the highest
> Venture capital investments; 2021: $157.5 billion – the highest (5,342 VC deals total)
> Patents issued in 2020: 128.7 per 100,000 people – the most (50,496 total)

5. Virginia
> Innovation index score: 63.1 out of 100
> Employment in STEM fields: 9.3% of all workers – 3rd highest (349,310 people total)
> Avg. annual income in STEM jobs: $109,370 – 7th highest
> Venture capital investments; 2021: $2.6 billion – 14th highest (257 VC deals total)
> Patents issued in 2020: 34.7 per 100,000 people – 24th fewest (3,002 total)
[in-text-ad]

4. Colorado
> Innovation index score: 64.2 out of 100
> Employment in STEM fields: 9.2% of all workers – 4th highest (242,380 people total)
> Avg. annual income in STEM jobs: $104,420 – 9th highest
> Venture capital investments; 2021: $6.8 billion – 7th highest (459 VC deals total)
> Patents issued in 2020: 64.3 per 100,000 people – 9th most (3,740 total)
[recirclink id=1102620]

3. Maryland
> Innovation index score: 65.0 out of 100
> Employment in STEM fields: 10.1% of all workers – 2nd highest (258,230 people total)
> Avg. annual income in STEM jobs: $110,690 – 5th highest
> Venture capital investments; 2021: $2.2 billion – 16th highest (176 VC deals total)
> Patents issued in 2020: 40.3 per 100,000 people – 21st most (2,482 total)

2. Washington
> Innovation index score: 68.9 out of 100
> Employment in STEM fields: 10.2% of all workers – the highest (326,530 people total)
> Avg. annual income in STEM jobs: $117,950 – 2nd highest
> Venture capital investments; 2021: $8.6 billion – 5th highest (549 VC deals total)
> Patents issued in 2020: 117.7 per 100,000 people – 3rd most (9,112 total)
[in-text-ad-2]

1. Massachusetts
> Innovation index score: 73.7 out of 100
> Employment in STEM fields: 9.1% of all workers – 5th highest (310,450 people total)
> Avg. annual income in STEM jobs: $115,060 – 4th highest
> Venture capital investments; 2021: $35.5 billion – 3rd highest (1,096 VC deals total)
> Patents issued in 2020: 125.8 per 100,000 people – 2nd most (8,790 total)
Methodology
To identify the most and least innovative states, 24/7 Wall St. reviewed a weighted index of 22 measures, indicative of innovative capacity, created by personal finance website, WalletHub, which published a report, Most & Least Innovative States. A full description of each measure and its weighting is available here.
We also considered a number of supplementary measures. Employment in STEM fields, both overall and as a percentage of overall employment as well as the average annual wage in STEM fields are from the Bureau of Labor Statistics and are current as of May 2021, the most recent period of available data.
We also considered total venture capital investment and the total number of venture capital deals by state in 2021 from the National Venture Capital Association.
Data on total patent issues in 2020 is from the U.S. Patent and Trade Office. Per capita patent figures were adjusted using one-year population estimates from the U.S. Census Bureau’s 2021 American Community Survey.
Contact [email protected] for any questions or corrections.