The middle class is a pillar of economic and social stability in the United States. Not only a reliable market for goods and services, the American middle class is also an engine of entrepreneurship and innovation, and their tax dollars help sustain investment in quality public services.
Despite the importance of the middle class, there is no universally accepted definition of what exactly it means to be middle class. Falling between the working and upper classes on the income spectrum, the middle class is generally understood as having disposable income for luxuries such as vacations and eating at restaurants. Typically, middle class households are able to put money away for savings and retirement, but they cannot afford big-ticket items – such as a house, car, or college education – without taking out a loan.
These indicators of middle class status are not hard and fast rules, however, and are somewhat abstract. However, household income, while perhaps less comprehensive, serves as a quantifiable gauge of middle class status.
Using household income data from the U.S. Census Bureau’s 2021 American Community Survey, 24/7 Wall St. identified the income it takes to be considered middle class in each of America’s 50 most populous metro areas by looking at the income range of the middle 20% of households by earnings. The 50 metropolitan areas on this list are ordered by population, from smallest to largest.
It is important to note that many members of the middle class, more broadly defined, may have incomes that fall outside of the ranges presented on this list. Still, most households with incomes within these ranges comprise the core of the middle class in each city.
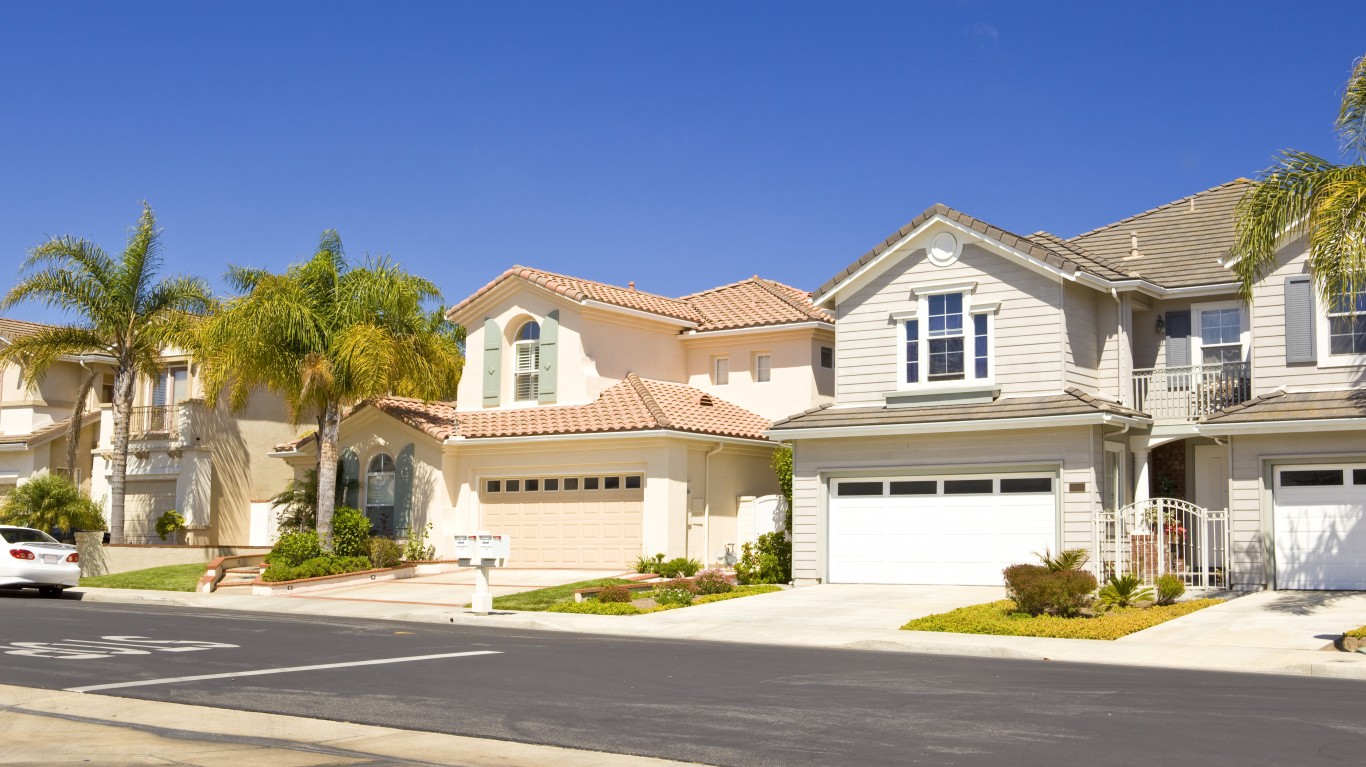
Among the cities on this list, exactly how much the typical middle class household earns varies considerably. Poorer cities, including those in the Rust Belt region, tend to have lower incomes overall, partially due to the decline of America’s manufacturing sector. Meanwhile, in cities along the West Coast with booming tech industries, most households earn well over $100,000 a year. In these places, the income necessary to be considered middle class is higher than typical. (Here is a look at America’s richest cities.)
In San Jose, California, home to Silicon Valley, households making between $108,000 and $177,000 per year fall in the middle 20% of households and are considered middle class by this definition. In Cleveland, meanwhile, households that earn between $48,000 and $78,000 annually are considered middle class. (These are the 30 American cities with the most foreclosures.)
Click here to see the income it takes to be middle class in America’s 50 largest cities.
Click here to see our detailed methodology.

50. Birmingham-Hoover, AL
> Middle-income range: $48,446 – $76,284
> Median household income: $60,725 (221st highest of 384 U.S. metro areas)
> Share of income earned by middle class: 14.2% (333rd highest of 384 U.S. metro areas)
> Share of income earned by wealthiest 5% of households: 23.2% (84th highest of 384 U.S. metro areas)
> Adults with a bachelor’s degree or higher: 34.4% (131st highest of 384 U.S. metro areas)
> Total population: 1,114,262
[in-text-ad]
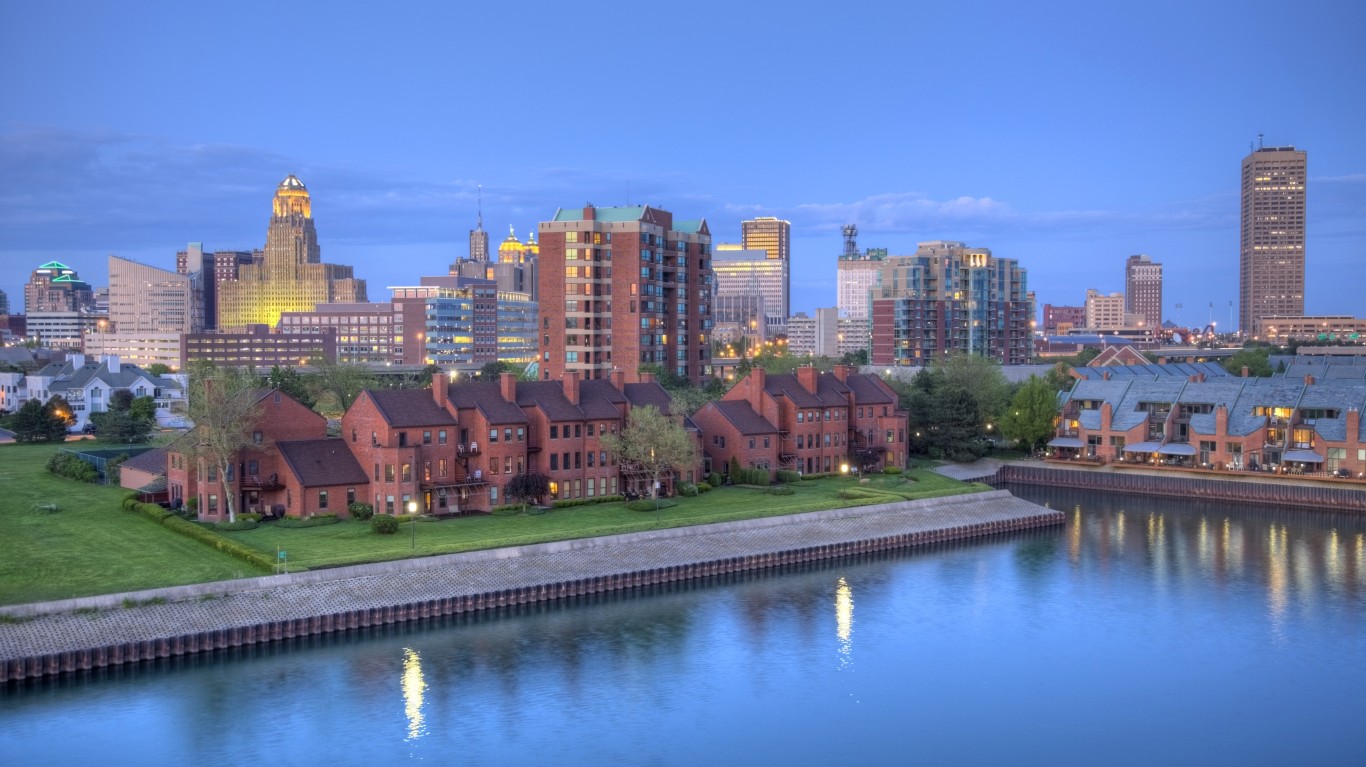
49. Buffalo-Cheektowaga, NY
> Middle-income range: $49,104 – $78,330
> Median household income: $62,794 (188th highest of 384 U.S. metro areas)
> Share of income earned by middle class: 15.3% (130th highest of 384 U.S. metro areas)
> Share of income earned by wealthiest 5% of households: 19.5% (314th highest of 384 U.S. metro areas)
> Adults with a bachelor’s degree or higher: 36.9% (96th highest of 384 U.S. metro areas)
> Total population: 1,162,336
[recirclink id=1052847]

48. Hartford-East Hartford-Middletown, CT
> Middle-income range: $65,060 – $103,562
> Median household income: $82,258 (35th highest of 384 U.S. metro areas)
> Share of income earned by middle class: 15.3% (142nd highest of 384 U.S. metro areas)
> Share of income earned by wealthiest 5% of households: 20.8% (234th highest of 384 U.S. metro areas)
> Adults with a bachelor’s degree or higher: 41.4% (48th highest of 384 U.S. metro areas)
> Total population: 1,211,906

47. New Orleans-Metairie, LA
> Middle-income range: $44,240 – $71,351
> Median household income: $56,837 (287th highest of 384 U.S. metro areas)
> Share of income earned by middle class: 13.8% (360th highest of 384 U.S. metro areas)
> Share of income earned by wealthiest 5% of households: 24.2% (47th highest of 384 U.S. metro areas)
> Adults with a bachelor’s degree or higher: 33.6% (144th highest of 384 U.S. metro areas)
> Total population: 1,261,726
[in-text-ad-2]

46. Salt Lake City, UT
> Middle-income range: $67,259 – $98,079
> Median household income: $81,307 (40th highest of 384 U.S. metro areas)
> Share of income earned by middle class: 15.5% (105th highest of 384 U.S. metro areas)
> Share of income earned by wealthiest 5% of households: 20.9% (229th highest of 384 U.S. metro areas)
> Adults with a bachelor’s degree or higher: 36.2% (105th highest of 384 U.S. metro areas)
> Total population: 1,263,061

45. Louisville/Jefferson County, KY-IN
> Middle-income range: $49,766 – $78,855
> Median household income: $64,029 (170th highest of 384 U.S. metro areas)
> Share of income earned by middle class: 14.7% (249th highest of 384 U.S. metro areas)
> Share of income earned by wealthiest 5% of households: 22.1% (146th highest of 384 U.S. metro areas)
> Adults with a bachelor’s degree or higher: 32.8% (156th highest of 384 U.S. metro areas)
> Total population: 1,284,826
[in-text-ad]

44. Richmond, VA
> Middle-income range: $58,355 – $92,154
> Median household income: $74,151 (74th highest of 384 U.S. metro areas)
> Share of income earned by middle class: 14.8% (223rd highest of 384 U.S. metro areas)
> Share of income earned by wealthiest 5% of households: 21.7% (170th highest of 384 U.S. metro areas)
> Adults with a bachelor’s degree or higher: 40.2% (60th highest of 384 U.S. metro areas)
> Total population: 1,317,525
[recirclink id=1044401]

43. Memphis, TN-MS-AR
> Middle-income range: $43,443 – $71,304
> Median household income: $55,840 (298th highest of 384 U.S. metro areas)
> Share of income earned by middle class: 13.7% (366th highest of 384 U.S. metro areas)
> Share of income earned by wealthiest 5% of households: 24.7% (32nd highest of 384 U.S. metro areas)
> Adults with a bachelor’s degree or higher: 31.0% (177th highest of 384 U.S. metro areas)
> Total population: 1,336,438

42. Oklahoma City, OK
> Middle-income range: $49,518 – $76,541
> Median household income: $61,815 (202nd highest of 384 U.S. metro areas)
> Share of income earned by middle class: 15.1% (165th highest of 384 U.S. metro areas)
> Share of income earned by wealthiest 5% of households: 20.9% (231st highest of 384 U.S. metro areas)
> Adults with a bachelor’s degree or higher: 33.2% (149th highest of 384 U.S. metro areas)
> Total population: 1,441,647
[in-text-ad-2]

41. Raleigh-Cary, NC
> Middle-income range: $67,045 – $104,142
> Median household income: $85,303 (25th highest of 384 U.S. metro areas)
> Share of income earned by middle class: 15.3% (139th highest of 384 U.S. metro areas)
> Share of income earned by wealthiest 5% of households: 20.5% (258th highest of 384 U.S. metro areas)
> Adults with a bachelor’s degree or higher: 50.7% (13th highest of 384 U.S. metro areas)
> Total population: 1,448,411

40. Milwaukee-Waukesha, WI
> Middle-income range: $53,736 – $85,513
> Median household income: $68,449 (116th highest of 384 U.S. metro areas)
> Share of income earned by middle class: 14.6% (278th highest of 384 U.S. metro areas)
> Share of income earned by wealthiest 5% of households: 22.9% (95th highest of 384 U.S. metro areas)
> Adults with a bachelor’s degree or higher: 39.2% (71st highest of 384 U.S. metro areas)
> Total population: 1,566,487
[in-text-ad]

39. Jacksonville, FL
> Middle-income range: $54,036 – $84,069
> Median household income: $68,394 (117th highest of 384 U.S. metro areas)
> Share of income earned by middle class: 14.7% (242nd highest of 384 U.S. metro areas)
> Share of income earned by wealthiest 5% of households: 22.4% (127th highest of 384 U.S. metro areas)
> Adults with a bachelor’s degree or higher: 35.3% (114th highest of 384 U.S. metro areas)
> Total population: 1,637,666
[recirclink id=1174206]

38. Providence-Warwick, RI-MA
> Middle-income range: $57,443 – $93,753
> Median household income: $73,788 (77th highest of 384 U.S. metro areas)
> Share of income earned by middle class: 15.2% (156th highest of 384 U.S. metro areas)
> Share of income earned by wealthiest 5% of households: 20.6% (252nd highest of 384 U.S. metro areas)
> Adults with a bachelor’s degree or higher: 34.1% (139th highest of 384 U.S. metro areas)
> Total population: 1,675,774

37. Virginia Beach-Norfolk-Newport News, VA-NC
> Middle-income range: $58,428 – $89,981
> Median household income: $72,686 (88th highest of 384 U.S. metro areas)
> Share of income earned by middle class: 15.4% (122nd highest of 384 U.S. metro areas)
> Share of income earned by wealthiest 5% of households: 20.6% (253rd highest of 384 U.S. metro areas)
> Adults with a bachelor’s degree or higher: 36.1% (106th highest of 384 U.S. metro areas)
> Total population: 1,806,423
[in-text-ad-2]
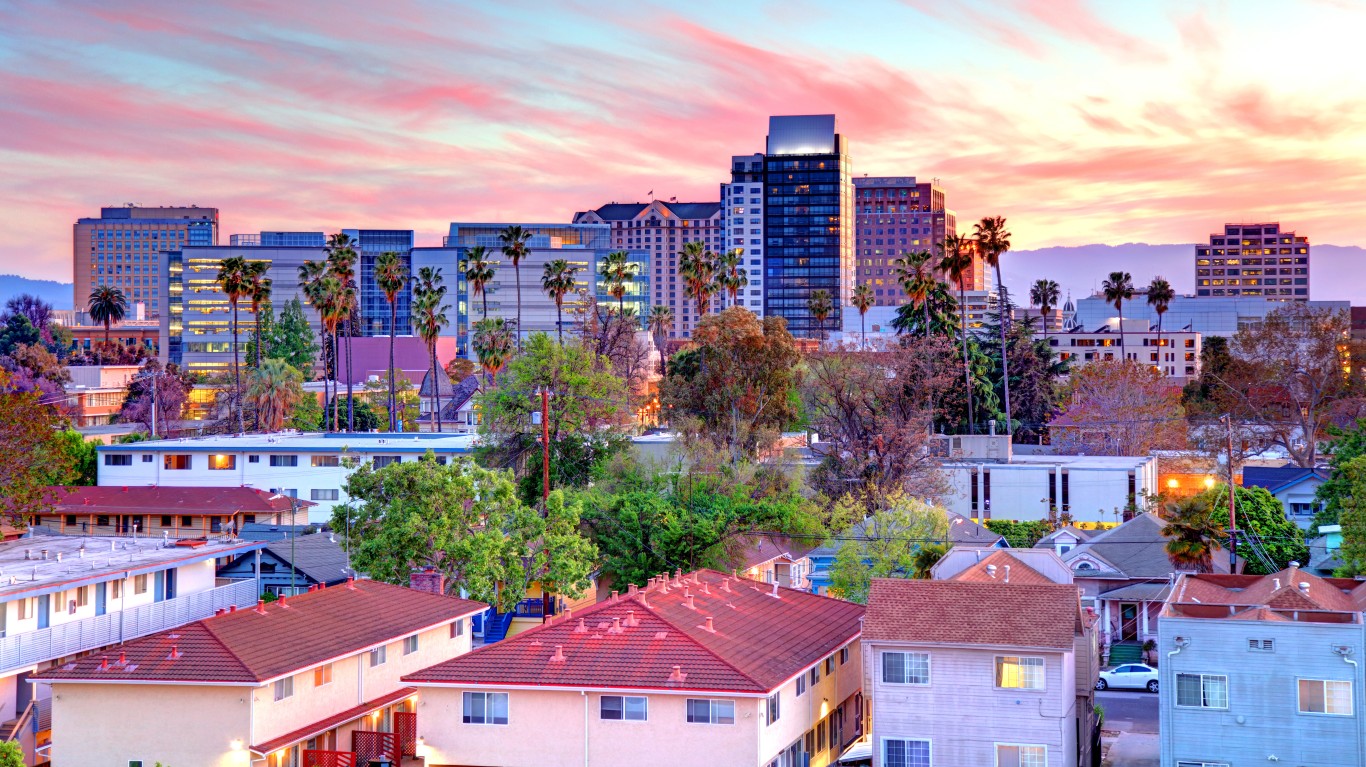
36. San Jose-Sunnyvale-Santa Clara, CA
> Middle-income range: $107,949 – $176,806
> Median household income: $139,892 (highest of 384 U.S. metro areas)
> Share of income earned by middle class: 14.4% (306th highest of 384 U.S. metro areas)
> Share of income earned by wealthiest 5% of households: 21.4% (187th highest of 384 U.S. metro areas)
> Adults with a bachelor’s degree or higher: 54.0% (5th highest of 384 U.S. metro areas)
> Total population: 1,952,185

35. Nashville-Davidson–Murfreesboro–Franklin, TN
> Middle-income range: $58,925 – $90,095
> Median household income: $72,725 (86th highest of 384 U.S. metro areas)
> Share of income earned by middle class: 14.4% (316th highest of 384 U.S. metro areas)
> Share of income earned by wealthiest 5% of households: 23.6% (71st highest of 384 U.S. metro areas)
> Adults with a bachelor’s degree or higher: 40.2% (61st highest of 384 U.S. metro areas)
> Total population: 2,013,506
[in-text-ad]

34. Cleveland-Elyria, OH
> Middle-income range: $48,487 – $77,975
> Median household income: $62,315 (193rd highest of 384 U.S. metro areas)
> Share of income earned by middle class: 14.4% (303rd highest of 384 U.S. metro areas)
> Share of income earned by wealthiest 5% of households: 23.1% (85th highest of 384 U.S. metro areas)
> Adults with a bachelor’s degree or higher: 34.1% (140th highest of 384 U.S. metro areas)
> Total population: 2,075,662
[recirclink id=1167510]

33. Indianapolis-Carmel-Anderson, IN
> Middle-income range: $56,757 – $85,158
> Median household income: $70,224 (104th highest of 384 U.S. metro areas)
> Share of income earned by middle class: 14.9% (210th highest of 384 U.S. metro areas)
> Share of income earned by wealthiest 5% of households: 21.6% (176th highest of 384 U.S. metro areas)
> Adults with a bachelor’s degree or higher: 37.8% (85th highest of 384 U.S. metro areas)
> Total population: 2,129,479

32. Columbus, OH
> Middle-income range: $57,296 – $89,383
> Median household income: $71,839 (94th highest of 384 U.S. metro areas)
> Share of income earned by middle class: 15.0% (179th highest of 384 U.S. metro areas)
> Share of income earned by wealthiest 5% of households: 21.9% (158th highest of 384 U.S. metro areas)
> Adults with a bachelor’s degree or higher: 39.0% (72nd highest of 384 U.S. metro areas)
> Total population: 2,151,017
[in-text-ad-2]

31. Kansas City, MO-KS
> Middle-income range: $59,319 – $90,657
> Median household income: $73,900 (76th highest of 384 U.S. metro areas)
> Share of income earned by middle class: 15.1% (166th highest of 384 U.S. metro areas)
> Share of income earned by wealthiest 5% of households: 21.9% (160th highest of 384 U.S. metro areas)
> Adults with a bachelor’s degree or higher: 39.5% (68th highest of 384 U.S. metro areas)
> Total population: 2,199,544

30. Cincinnati, OH-KY-IN
> Middle-income range: $55,792 – $87,820
> Median household income: $70,818 (101st highest of 384 U.S. metro areas)
> Share of income earned by middle class: 14.8% (221st highest of 384 U.S. metro areas)
> Share of income earned by wealthiest 5% of households: 22.6% (114th highest of 384 U.S. metro areas)
> Adults with a bachelor’s degree or higher: 36.5% (98th highest of 384 U.S. metro areas)
> Total population: 2,261,665
[in-text-ad]

29. Las Vegas-Henderson-Paradise, NV
> Middle-income range: $50,199 – $78,898
> Median household income: $63,677 (177th highest of 384 U.S. metro areas)
> Share of income earned by middle class: 14.7% (257th highest of 384 U.S. metro areas)
> Share of income earned by wealthiest 5% of households: 22.2% (139th highest of 384 U.S. metro areas)
> Adults with a bachelor’s degree or higher: 27.3% (240th highest of 384 U.S. metro areas)
> Total population: 2,292,476
[recirclink id=1175995]

28. Austin-Round Rock-Georgetown, TX
> Middle-income range: $68,737 – $105,556
> Median household income: $86,530 (23rd highest of 384 U.S. metro areas)
> Share of income earned by middle class: 15.0% (187th highest of 384 U.S. metro areas)
> Share of income earned by wealthiest 5% of households: 21.9% (155th highest of 384 U.S. metro areas)
> Adults with a bachelor’s degree or higher: 50.0% (15th highest of 384 U.S. metro areas)
> Total population: 2,352,426

27. Pittsburgh, PA
> Middle-income range: $51,584 – $84,215
> Median household income: $66,609 (134th highest of 384 U.S. metro areas)
> Share of income earned by middle class: 14.6% (267th highest of 384 U.S. metro areas)
> Share of income earned by wealthiest 5% of households: 22.5% (120th highest of 384 U.S. metro areas)
> Adults with a bachelor’s degree or higher: 38.1% (82nd highest of 384 U.S. metro areas)
> Total population: 2,353,538
[in-text-ad-2]

26. Sacramento-Roseville-Folsom, CA
> Middle-income range: $66,516 – $103,890
> Median household income: $84,421 (29th highest of 384 U.S. metro areas)
> Share of income earned by middle class: 15.3% (134th highest of 384 U.S. metro areas)
> Share of income earned by wealthiest 5% of households: 20.9% (226th highest of 384 U.S. metro areas)
> Adults with a bachelor’s degree or higher: 36.4% (101st highest of 384 U.S. metro areas)
> Total population: 2,411,428

25. Portland-Vancouver-Hillsboro, OR-WA
> Middle-income range: $67,202 – $102,601
> Median household income: $83,943 (31st highest of 384 U.S. metro areas)
> Share of income earned by middle class: 15.4% (118th highest of 384 U.S. metro areas)
> Share of income earned by wealthiest 5% of households: 20.8% (241st highest of 384 U.S. metro areas)
> Adults with a bachelor’s degree or higher: 42.2% (42nd highest of 384 U.S. metro areas)
> Total population: 2,510,696
[in-text-ad]

24. San Antonio-New Braunfels, TX
> Middle-income range: $52,435 – $82,610
> Median household income: $66,775 (130th highest of 384 U.S. metro areas)
> Share of income earned by middle class: 15.0% (185th highest of 384 U.S. metro areas)
> Share of income earned by wealthiest 5% of households: 21.3% (201st highest of 384 U.S. metro areas)
> Adults with a bachelor’s degree or higher: 31.4% (171st highest of 384 U.S. metro areas)
> Total population: 2,601,788
[recirclink id=1052847]

23. Orlando-Kissimmee-Sanford, FL
> Middle-income range: $51,935 – $79,953
> Median household income: $64,936 (157th highest of 384 U.S. metro areas)
> Share of income earned by middle class: 14.6% (269th highest of 384 U.S. metro areas)
> Share of income earned by wealthiest 5% of households: 22.2% (140th highest of 384 U.S. metro areas)
> Adults with a bachelor’s degree or higher: 35.2% (116th highest of 384 U.S. metro areas)
> Total population: 2,691,925

22. Charlotte-Concord-Gastonia, NC-SC
> Middle-income range: $57,364 – $88,607
> Median household income: $71,041 (99th highest of 384 U.S. metro areas)
> Share of income earned by middle class: 14.4% (310th highest of 384 U.S. metro areas)
> Share of income earned by wealthiest 5% of households: 22.7% (104th highest of 384 U.S. metro areas)
> Adults with a bachelor’s degree or higher: 39.3% (70th highest of 384 U.S. metro areas)
> Total population: 2,701,046
[in-text-ad-2]

21. St. Louis, MO-IL
> Middle-income range: $55,050 – $86,265
> Median household income: $70,189 (105th highest of 384 U.S. metro areas)
> Share of income earned by middle class: 14.6% (282nd highest of 384 U.S. metro areas)
> Share of income earned by wealthiest 5% of households: 22.9% (95th highest of 384 U.S. metro areas)
> Adults with a bachelor’s degree or higher: 37.1% (92nd highest of 384 U.S. metro areas)
> Total population: 2,806,615

20. Baltimore-Columbia-Towson, MD
> Middle-income range: $67,942 – $106,794
> Median household income: $86,302 (24th highest of 384 U.S. metro areas)
> Share of income earned by middle class: 15.0% (186th highest of 384 U.S. metro areas)
> Share of income earned by wealthiest 5% of households: 21.0% (216th highest of 384 U.S. metro areas)
> Adults with a bachelor’s degree or higher: 42.9% (37th highest of 384 U.S. metro areas)
> Total population: 2,838,327
[in-text-ad]

19. Denver-Aurora-Lakewood, CO
> Middle-income range: $72,213 – $111,148
> Median household income: $90,716 (14th highest of 384 U.S. metro areas)
> Share of income earned by middle class: 15.2% (156th highest of 384 U.S. metro areas)
> Share of income earned by wealthiest 5% of households: 21.4% (191st highest of 384 U.S. metro areas)
> Adults with a bachelor’s degree or higher: 47.8% (18th highest of 384 U.S. metro areas)
> Total population: 2,972,567
[recirclink id=1044401]

18. Tampa-St. Petersburg-Clearwater, FL
> Middle-income range: $50,495 – $78,768
> Median household income: $62,951 (186th highest of 384 U.S. metro areas)
> Share of income earned by middle class: 14.3% (325th highest of 384 U.S. metro areas)
> Share of income earned by wealthiest 5% of households: 23.7% (68th highest of 384 U.S. metro areas)
> Adults with a bachelor’s degree or higher: 34.5% (130th highest of 384 U.S. metro areas)
> Total population: 3,219,514

17. San Diego-Chula Vista-Carlsbad, CA
> Middle-income range: $71,297 – $111,560
> Median household income: $91,003 (13th highest of 384 U.S. metro areas)
> Share of income earned by middle class: 15.0% (189th highest of 384 U.S. metro areas)
> Share of income earned by wealthiest 5% of households: 21.9% (155th highest of 384 U.S. metro areas)
> Adults with a bachelor’s degree or higher: 42.0% (44th highest of 384 U.S. metro areas)
> Total population: 3,286,069
[in-text-ad-2]
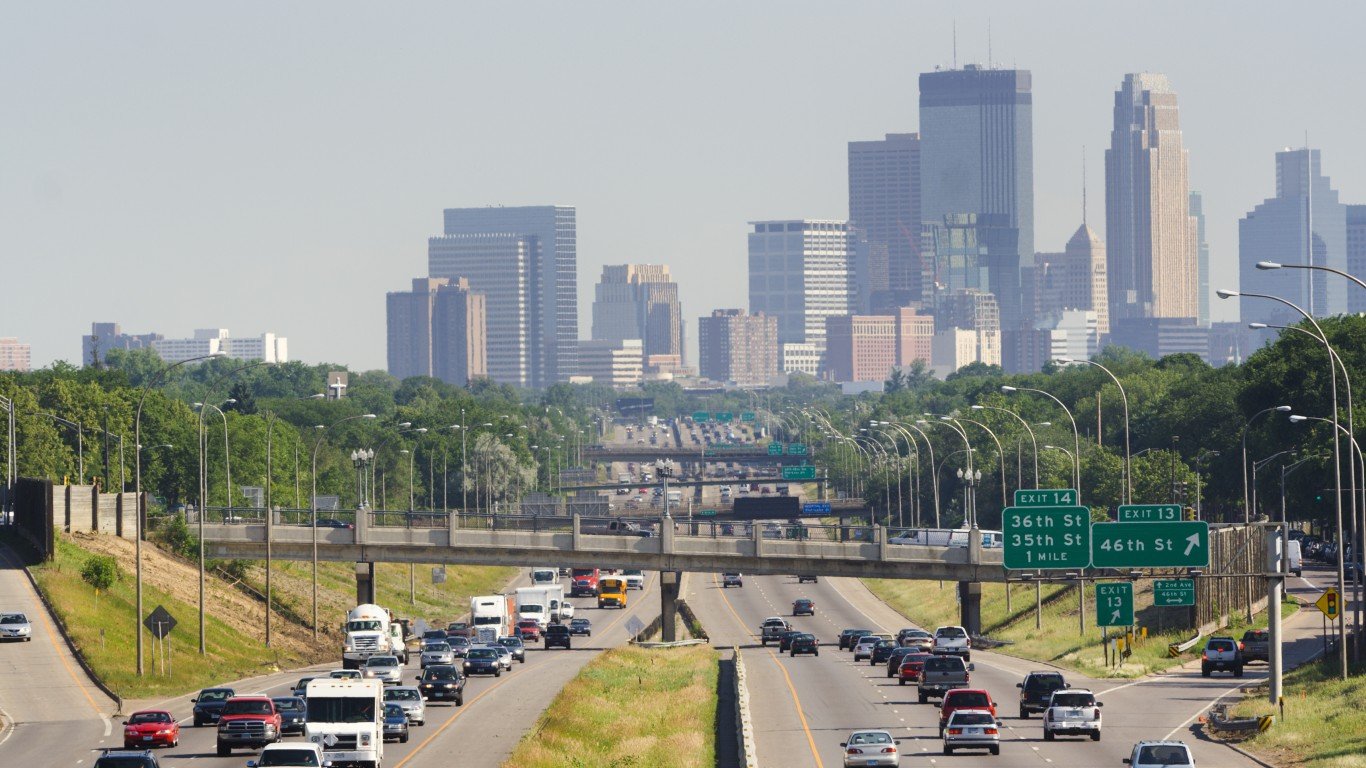
16. Minneapolis-St. Paul-Bloomington, MN-WI
> Middle-income range: $69,840 – $106,711
> Median household income: $87,433 (20th highest of 384 U.S. metro areas)
> Share of income earned by middle class: 15.3% (136th highest of 384 U.S. metro areas)
> Share of income earned by wealthiest 5% of households: 20.8% (240th highest of 384 U.S. metro areas)
> Adults with a bachelor’s degree or higher: 44.7% (31st highest of 384 U.S. metro areas)
> Total population: 3,690,512

15. Seattle-Tacoma-Bellevue, WA
> Middle-income range: $80,316 – $124,685
> Median household income: $101,721 (5th highest of 384 U.S. metro areas)
> Share of income earned by middle class: 14.8% (229th highest of 384 U.S. metro areas)
> Share of income earned by wealthiest 5% of households: 22.1% (147th highest of 384 U.S. metro areas)
> Adults with a bachelor’s degree or higher: 46.8% (20th highest of 384 U.S. metro areas)
> Total population: 4,011,553
[in-text-ad]
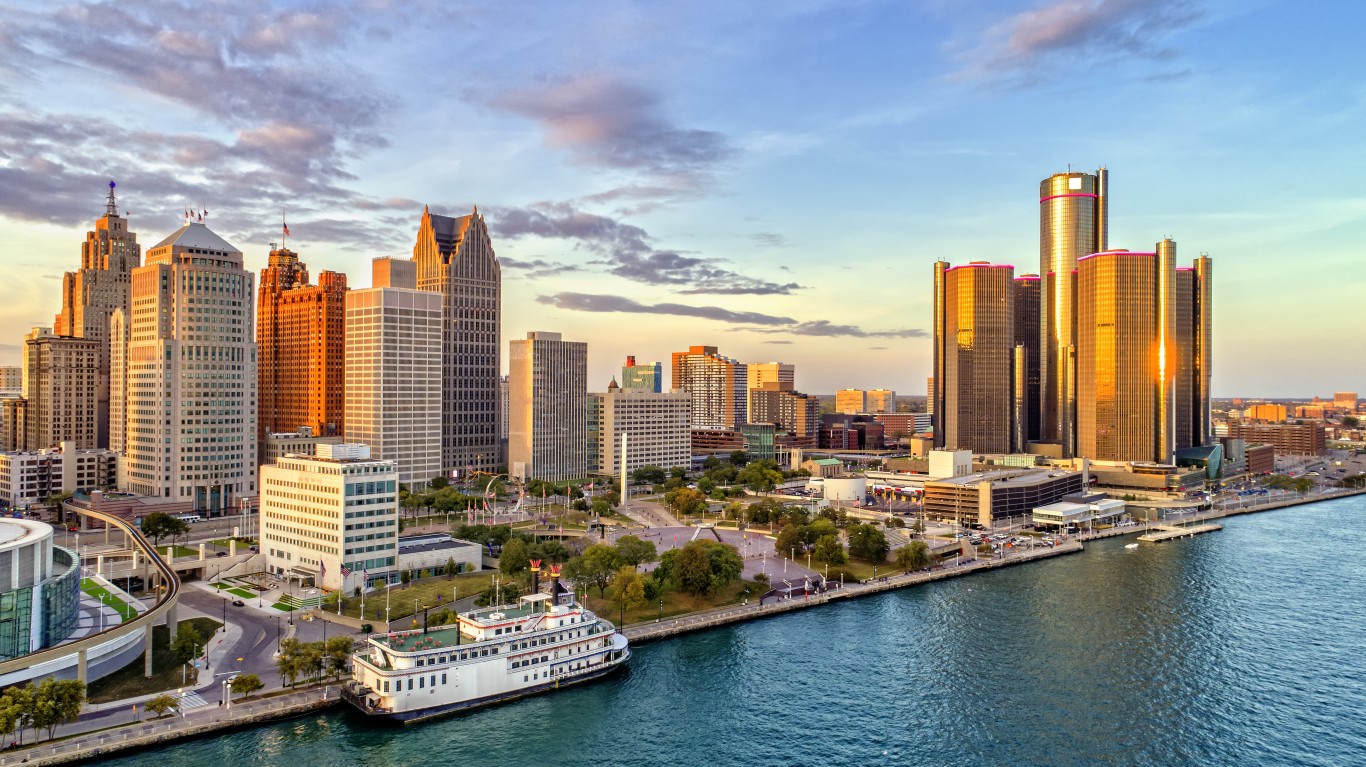
14. Detroit-Warren-Dearborn, MI
> Middle-income range: $52,150 – $84,354
> Median household income: $67,153 (124th highest of 384 U.S. metro areas)
> Share of income earned by middle class: 14.6% (273rd highest of 384 U.S. metro areas)
> Share of income earned by wealthiest 5% of households: 22.3% (137th highest of 384 U.S. metro areas)
> Adults with a bachelor’s degree or higher: 34.2% (136th highest of 384 U.S. metro areas)
> Total population: 4,365,205
[recirclink id=1174206]

13. San Francisco-Oakland-Berkeley, CA
> Middle-income range: $89,757 – $149,120
> Median household income: $116,005 (2nd highest of 384 U.S. metro areas)
> Share of income earned by middle class: 14.0% (348th highest of 384 U.S. metro areas)
> Share of income earned by wealthiest 5% of households: 23.2% (81st highest of 384 U.S. metro areas)
> Adults with a bachelor’s degree or higher: 51.8% (7th highest of 384 U.S. metro areas)
> Total population: 4,623,264
12. Riverside-San Bernardino-Ontario, CA
> Middle-income range: $61,555 – $94,455
> Median household income: $77,018 (59th highest of 384 U.S. metro areas)
> Share of income earned by middle class: 15.6% (79th highest of 384 U.S. metro areas)
> Share of income earned by wealthiest 5% of households: 20.6% (256th highest of 384 U.S. metro areas)
> Adults with a bachelor’s degree or higher: 23.7% (303rd highest of 384 U.S. metro areas)
> Total population: 4,653,105
[in-text-ad-2]

11. Boston-Cambridge-Newton, MA-NH
> Middle-income range: $77,961 – $125,760
> Median household income: $100,750 (7th highest of 384 U.S. metro areas)
> Share of income earned by middle class: 14.6% (263rd highest of 384 U.S. metro areas)
> Share of income earned by wealthiest 5% of households: 22.5% (117th highest of 384 U.S. metro areas)
> Adults with a bachelor’s degree or higher: 51.1% (9th highest of 384 U.S. metro areas)
> Total population: 4,899,932

10. Phoenix-Mesa-Chandler, AZ
> Middle-income range: $60,980 – $92,683
> Median household income: $75,731 (67th highest of 384 U.S. metro areas)
> Share of income earned by middle class: 14.9% (202nd highest of 384 U.S. metro areas)
> Share of income earned by wealthiest 5% of households: 22.4% (126th highest of 384 U.S. metro areas)
> Adults with a bachelor’s degree or higher: 34.6% (125th highest of 384 U.S. metro areas)
> Total population: 4,946,145
[in-text-ad]
9. Miami-Fort Lauderdale-Pompano Beach, FL
> Middle-income range: $50,055 – $80,577
> Median household income: $63,814 (173rd highest of 384 U.S. metro areas)
> Share of income earned by middle class: 13.5% (376th highest of 384 U.S. metro areas)
> Share of income earned by wealthiest 5% of households: 26.0% (14th highest of 384 U.S. metro areas)
> Adults with a bachelor’s degree or higher: 35.3% (113th highest of 384 U.S. metro areas)
> Total population: 6,091,747
[recirclink id=1167510]

8. Atlanta-Sandy Springs-Alpharetta, GA
> Middle-income range: $61,941 – $95,704
> Median household income: $77,589 (58th highest of 384 U.S. metro areas)
> Share of income earned by middle class: 14.7% (255th highest of 384 U.S. metro areas)
> Share of income earned by wealthiest 5% of households: 22.5% (122nd highest of 384 U.S. metro areas)
> Adults with a bachelor’s degree or higher: 42.2% (41st highest of 384 U.S. metro areas)
> Total population: 6,144,970

7. Philadelphia-Camden-Wilmington, PA-NJ-DE-MD
> Middle-income range: $61,768 – $100,947
> Median household income: $80,007 (45th highest of 384 U.S. metro areas)
> Share of income earned by middle class: 14.7% (261st highest of 384 U.S. metro areas)
> Share of income earned by wealthiest 5% of households: 22.2% (141st highest of 384 U.S. metro areas)
> Adults with a bachelor’s degree or higher: 41.9% (45th highest of 384 U.S. metro areas)
> Total population: 6,228,601
[in-text-ad-2]

6. Washington-Arlington-Alexandria, DC-VA-MD-WV
> Middle-income range: $88,547 – $136,095
> Median household income: $110,355 (3rd highest of 384 U.S. metro areas)
> Share of income earned by middle class: 15.4% (128th highest of 384 U.S. metro areas)
> Share of income earned by wealthiest 5% of households: 21.0% (218th highest of 384 U.S. metro areas)
> Adults with a bachelor’s degree or higher: 53.4% (6th highest of 384 U.S. metro areas)
> Total population: 6,358,652

5. Houston-The Woodlands-Sugar Land, TX
> Middle-income range: $55,701 – $89,195
> Median household income: $70,893 (100th highest of 384 U.S. metro areas)
> Share of income earned by middle class: 14.2% (333rd highest of 384 U.S. metro areas)
> Share of income earned by wealthiest 5% of households: 23.2% (83rd highest of 384 U.S. metro areas)
> Adults with a bachelor’s degree or higher: 35.8% (109th highest of 384 U.S. metro areas)
> Total population: 7,206,841
[in-text-ad]

4. Dallas-Fort Worth-Arlington, TX
> Middle-income range: $60,932 – $94,730
> Median household income: $75,975 (65th highest of 384 U.S. metro areas)
> Share of income earned by middle class: 14.5% (297th highest of 384 U.S. metro areas)
> Share of income earned by wealthiest 5% of households: 22.4% (125th highest of 384 U.S. metro areas)
> Adults with a bachelor’s degree or higher: 38.3% (77th highest of 384 U.S. metro areas)
> Total population: 7,759,615
[recirclink id=1175995]

3. Chicago-Naperville-Elgin, IL-IN-WI
> Middle-income range: $61,683 – $97,911
> Median household income: $78,166 (56th highest of 384 U.S. metro areas)
> Share of income earned by middle class: 14.5% (300th highest of 384 U.S. metro areas)
> Share of income earned by wealthiest 5% of households: 23.3% (79th highest of 384 U.S. metro areas)
> Adults with a bachelor’s degree or higher: 40.6% (52nd highest of 384 U.S. metro areas)
> Total population: 9,510,390

2. Los Angeles-Long Beach-Anaheim, CA
> Middle-income range: $63,982 – $102,927
> Median household income: $82,503 (34th highest of 384 U.S. metro areas)
> Share of income earned by middle class: 14.3% (320th highest of 384 U.S. metro areas)
> Share of income earned by wealthiest 5% of households: 23.5% (73rd highest of 384 U.S. metro areas)
> Adults with a bachelor’s degree or higher: 37.1% (93rd highest of 384 U.S. metro areas)
> Total population: 12,997,353
[in-text-ad-2]

1. New York-Newark-Jersey City, NY-NJ-PA
> Middle-income range: $64,626 – $107,889
> Median household income: $84,409 (30th highest of 384 U.S. metro areas)
> Share of income earned by middle class: 13.6% (372nd highest of 384 U.S. metro areas)
> Share of income earned by wealthiest 5% of households: 24.8% (28th highest of 384 U.S. metro areas)
> Adults with a bachelor’s degree or higher: 43.6% (35th highest of 384 U.S. metro areas)
> Total population: 19,768,458
Methodology
To identify the income it takes to be in the middle class in America’s 50 largest cities, 24/7 Wall St. reviewed metro area level data from the U.S. Census Bureau’s 2021 American Community Survey. We reviewed the upper and lower income limits of the middle 20% of earners. The 50 most populous metro areas are ordered by population, from smallest to largest.
Population figures, as well as data on the share of income earned by the middle 20% of households by earnings, the share of income earned by the highest earning 5% of households, median household income, and adults with a bachelor’s degree or higher are also from the 2021 ACS.
Contact [email protected] for any questions or corrections.