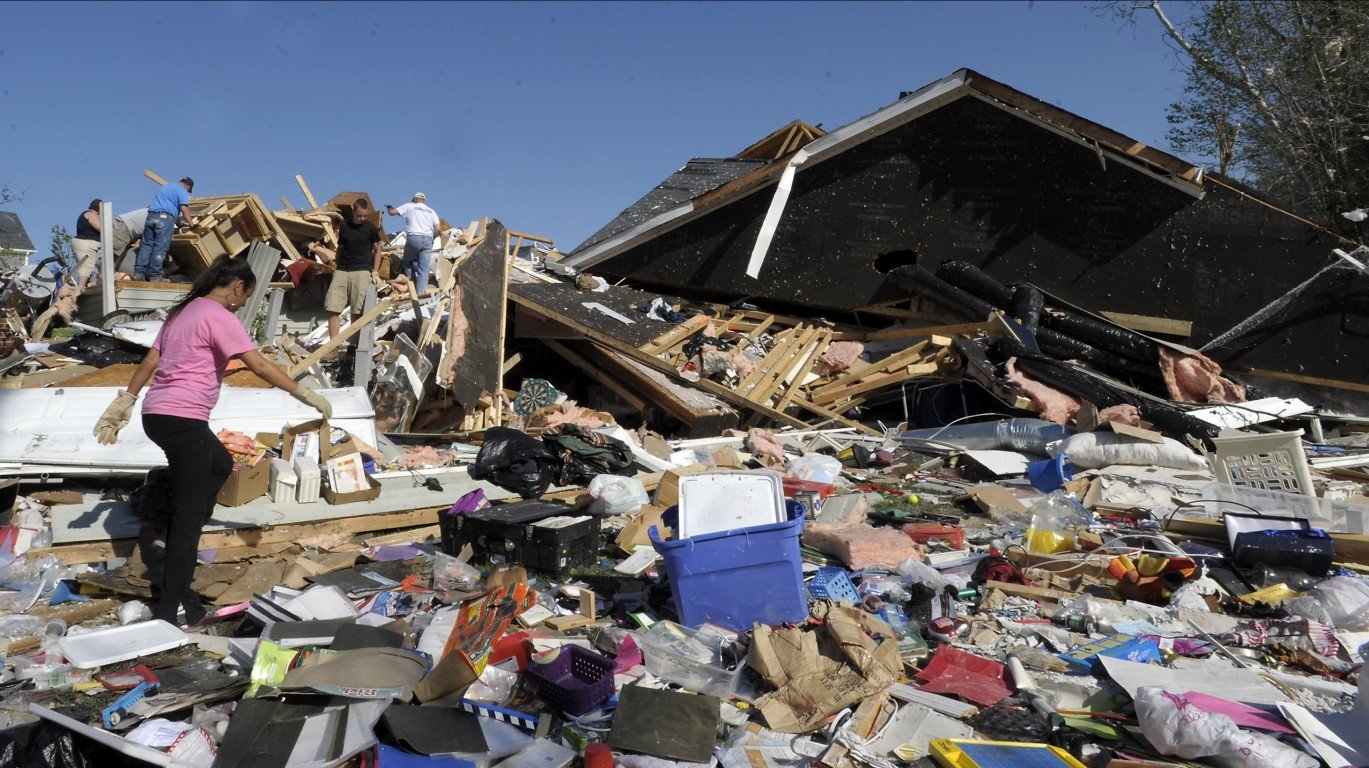
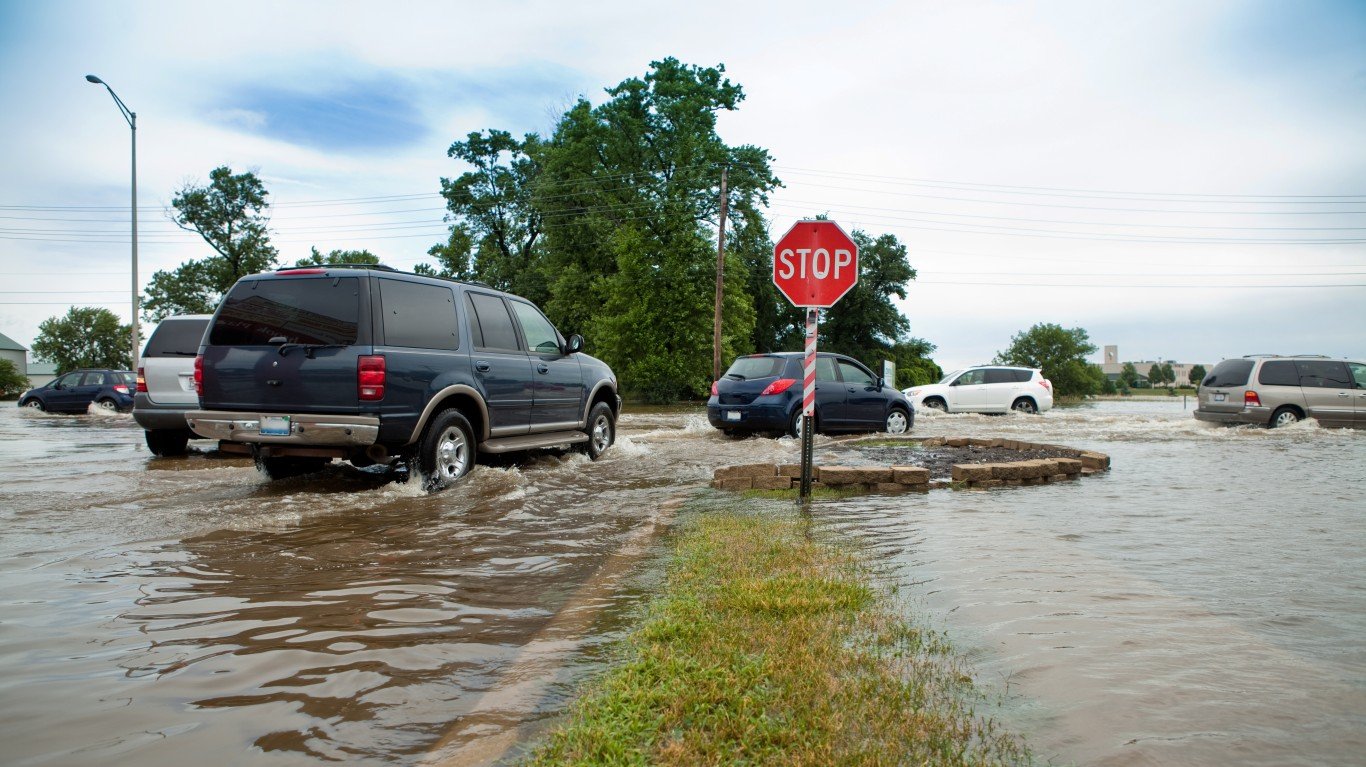
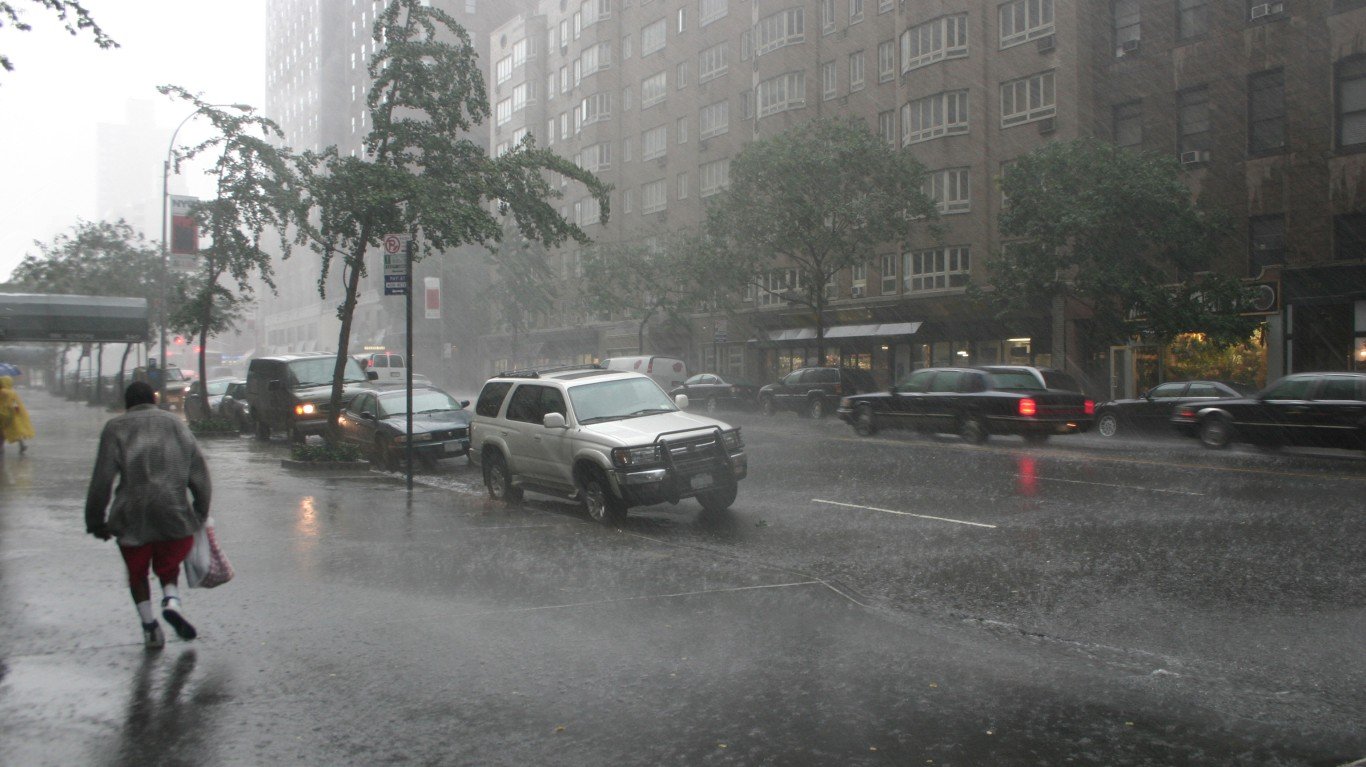
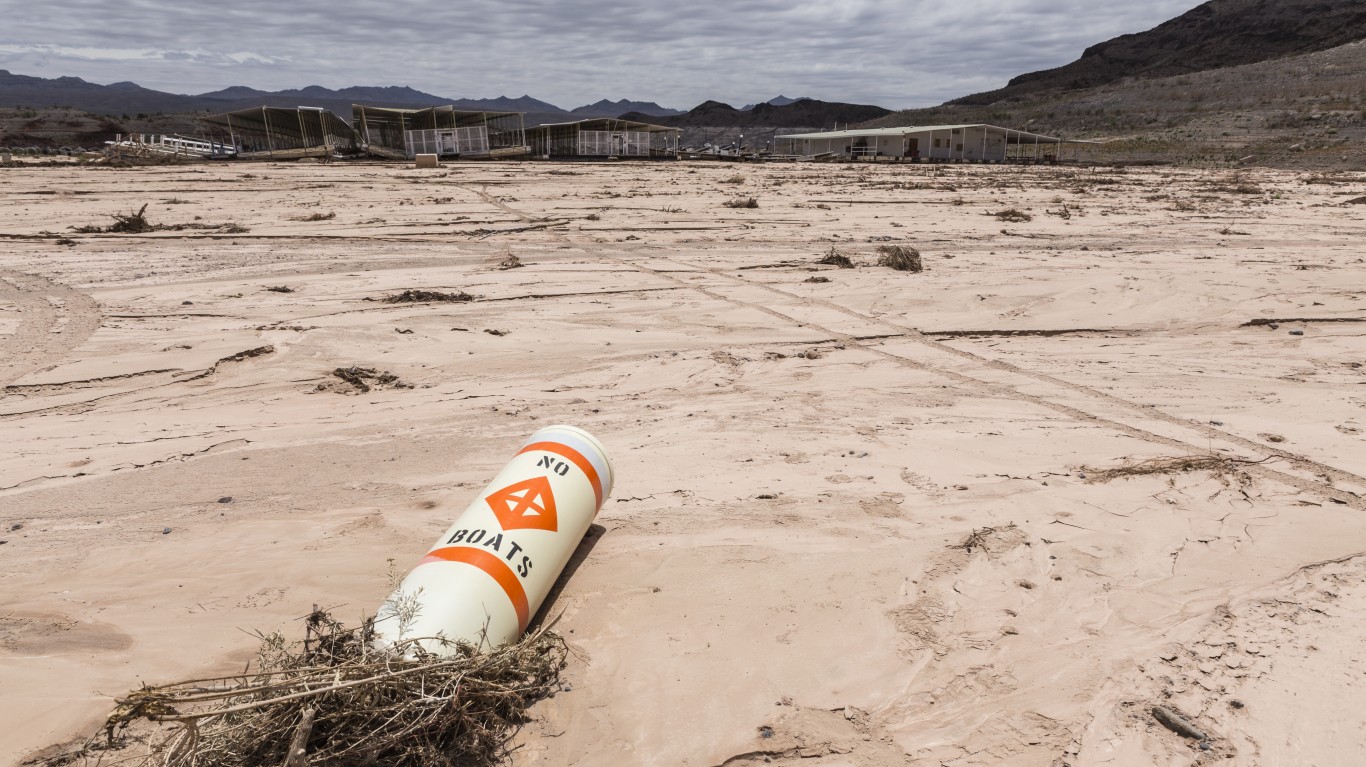
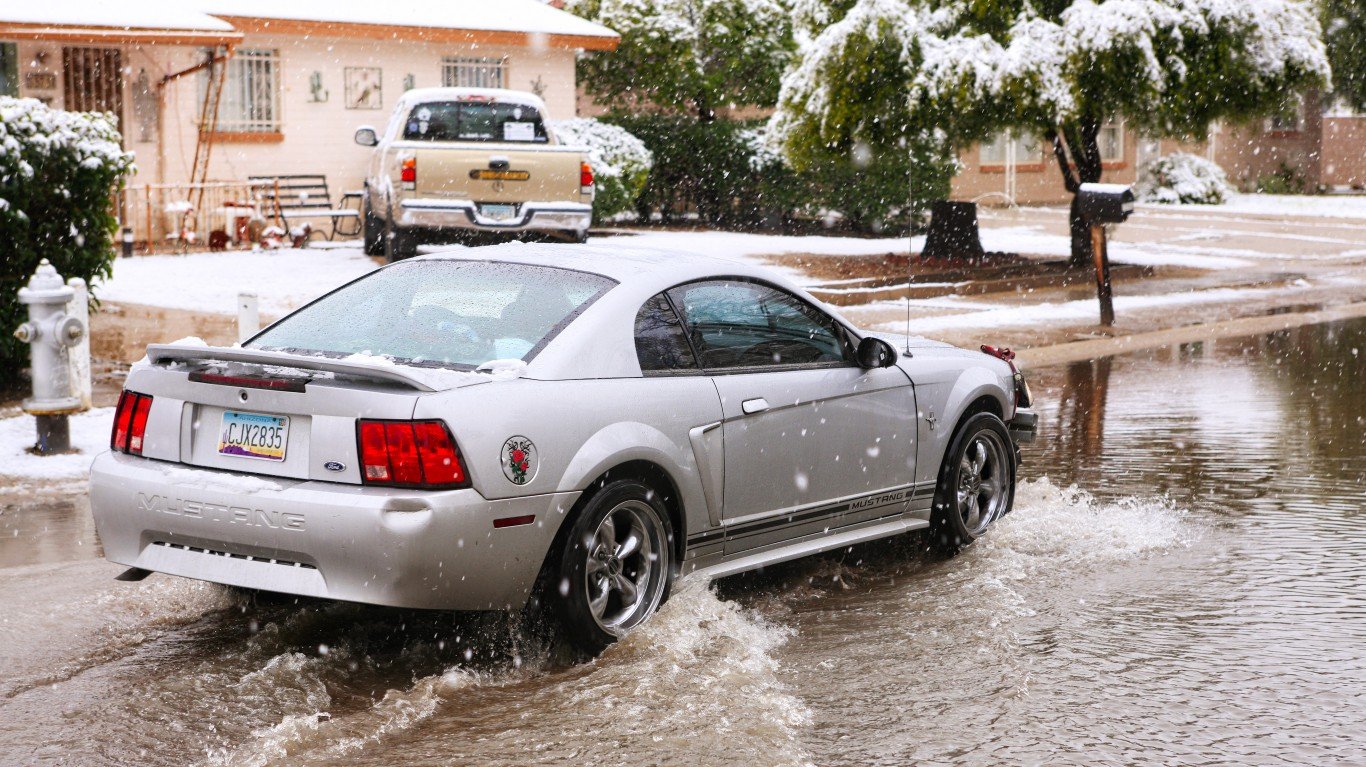
Homeownership is one of the best ways to secure a comfortable financial future. But with the effect of climate change kicking in front doors worldwide, locking yourself into a decades-long mortgage can mean exposing yourself to future adverse impacts of blistering heat waves, heavy storms, wildfires, and flooding — not to mention the rising insurance premiums that come with all of that. (Find out how 2023 compares to the hottest summers over last 50 years.)
In order to gauge where in the United States people are more or less likely to endure climate change impacts, 24/7 Wall St. reviewed a ranking by online insurance marketplace Policygenius, which examined how the country’s 50 most-populated metropolitan statistical areas will fare by 2050 based on several climate change-related indicators that impact an area’s livability such as heat, air quality, and rising sea levels. Policygenius’ full methodology can be found here.
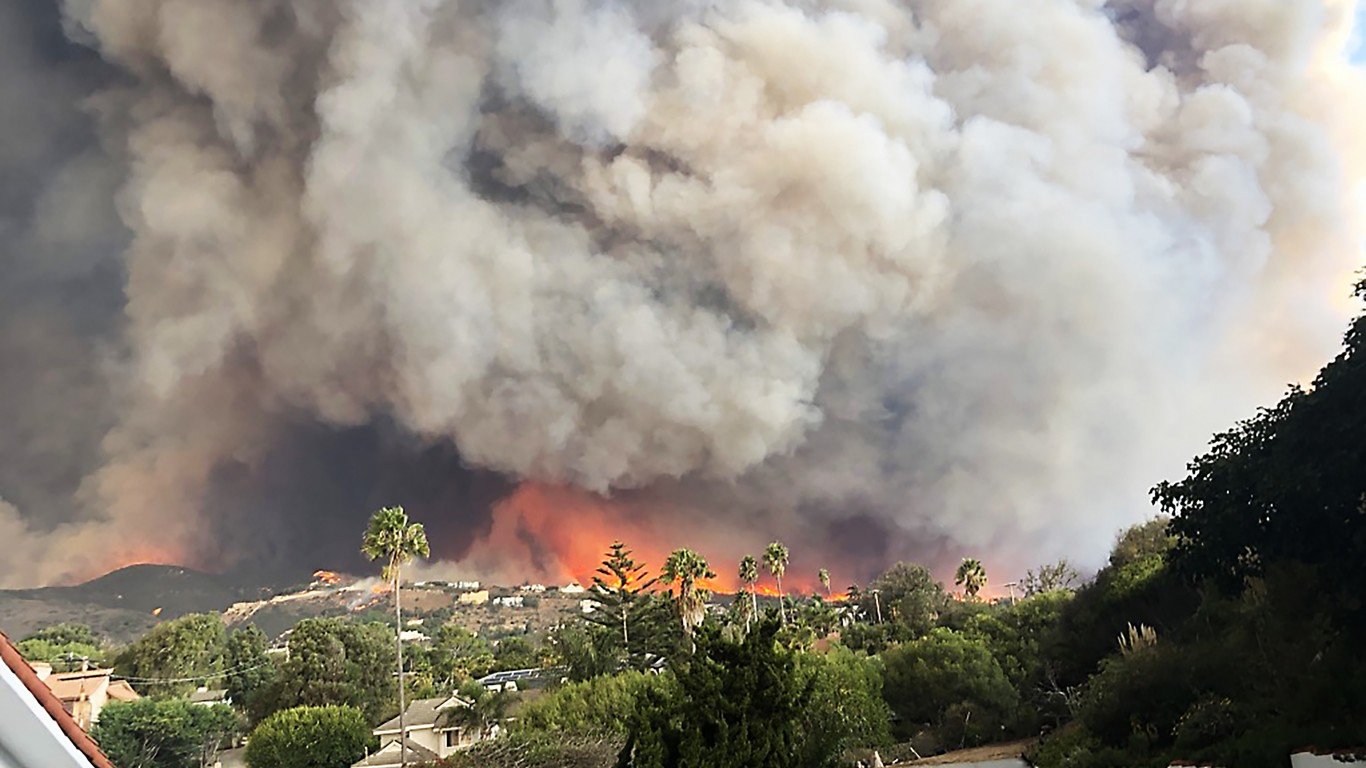
Despite the constant threat of earthquakes, San Francisco earned the highest overall score as the best city to confront the effects of climate change, with minimal exposure to extreme heat and humidity; a low percentage of properties built on flood plains; and geographically shielded from the effects of seasonal wildfires. Policygenius emphasizes that this ranking is of the largest metros and San Francisco has a much higher risk than many smaller cities.
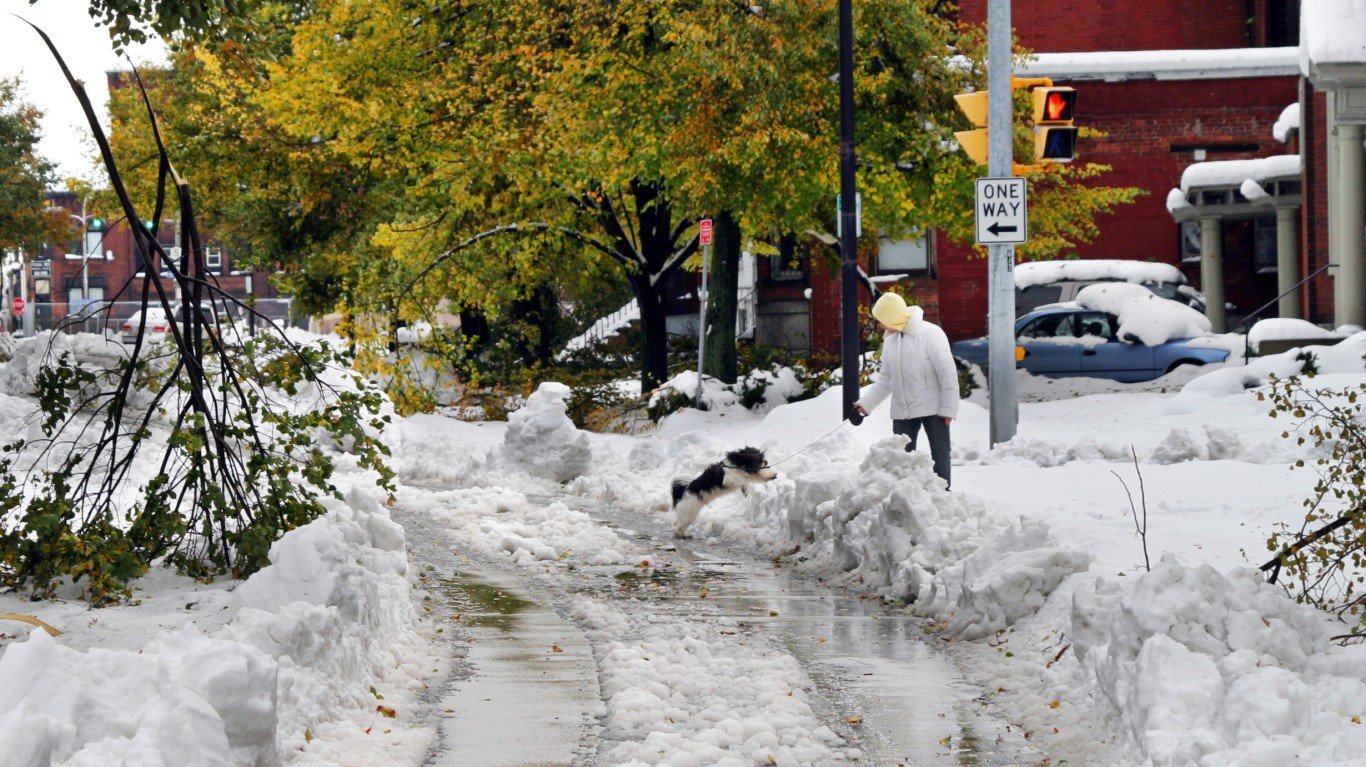
Seattle, Minneapolis, Baltimore, and Milwaukee are other cities that received high overall scores.
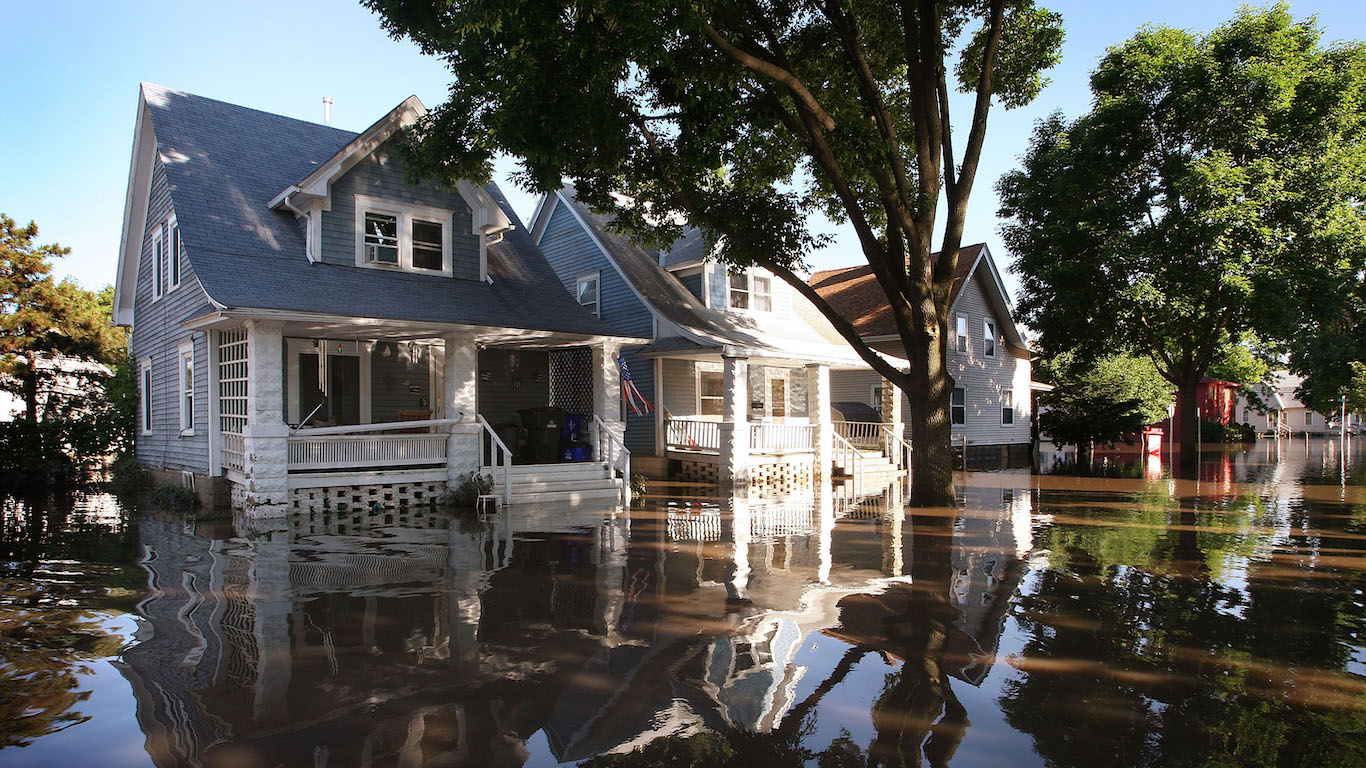
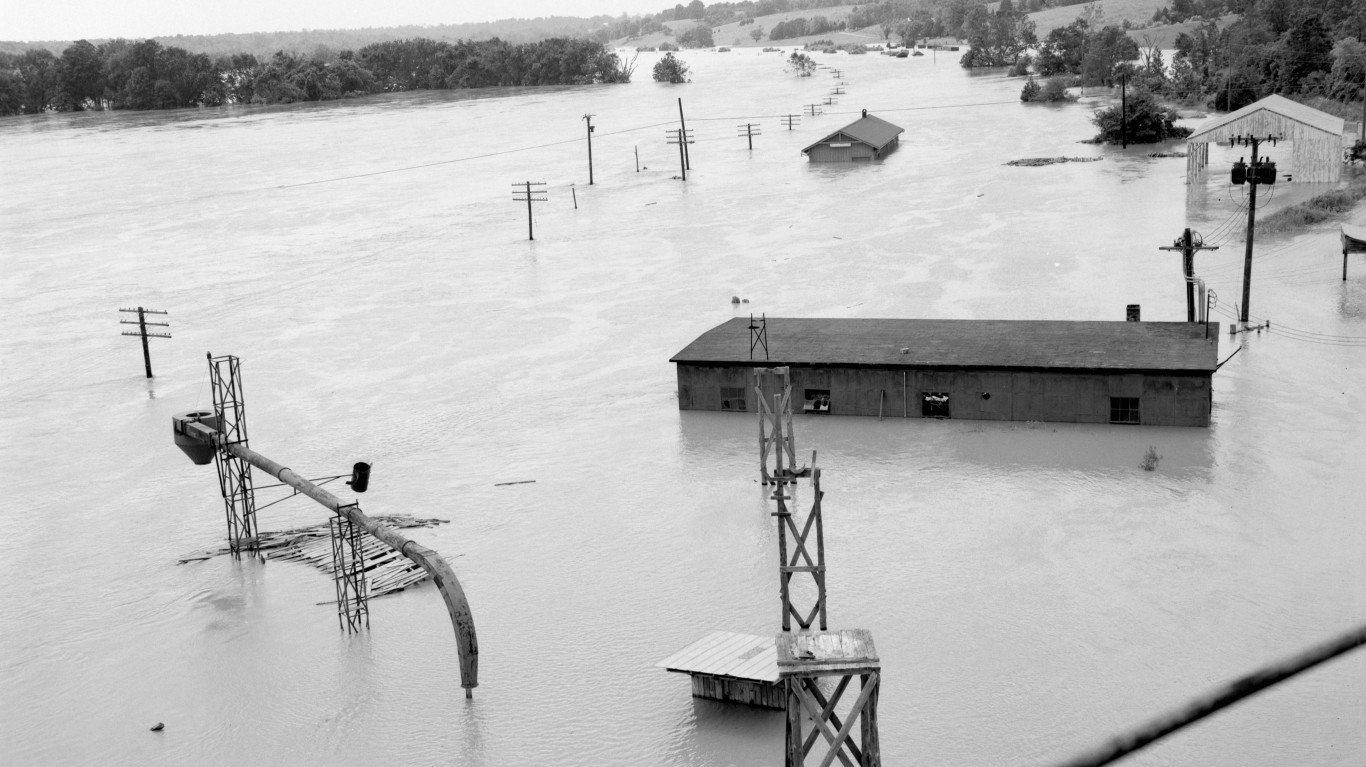
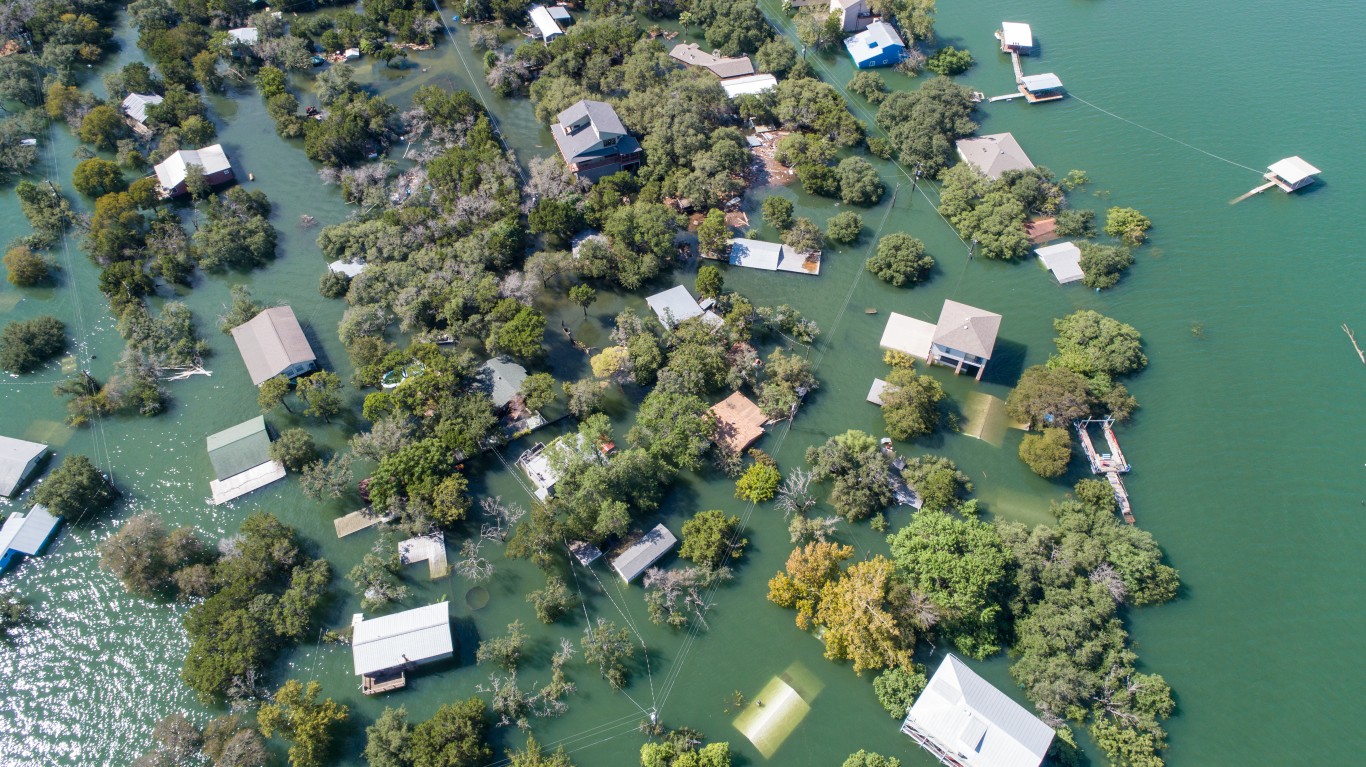
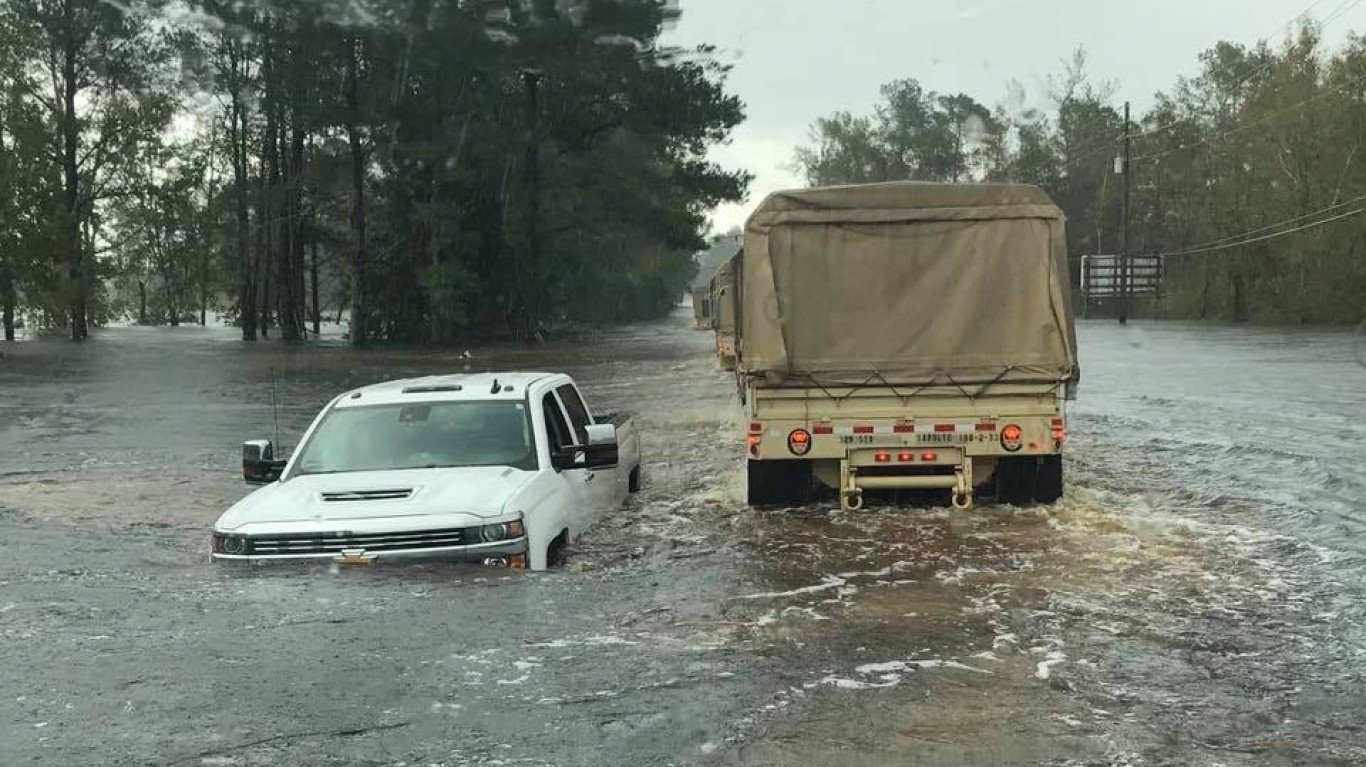
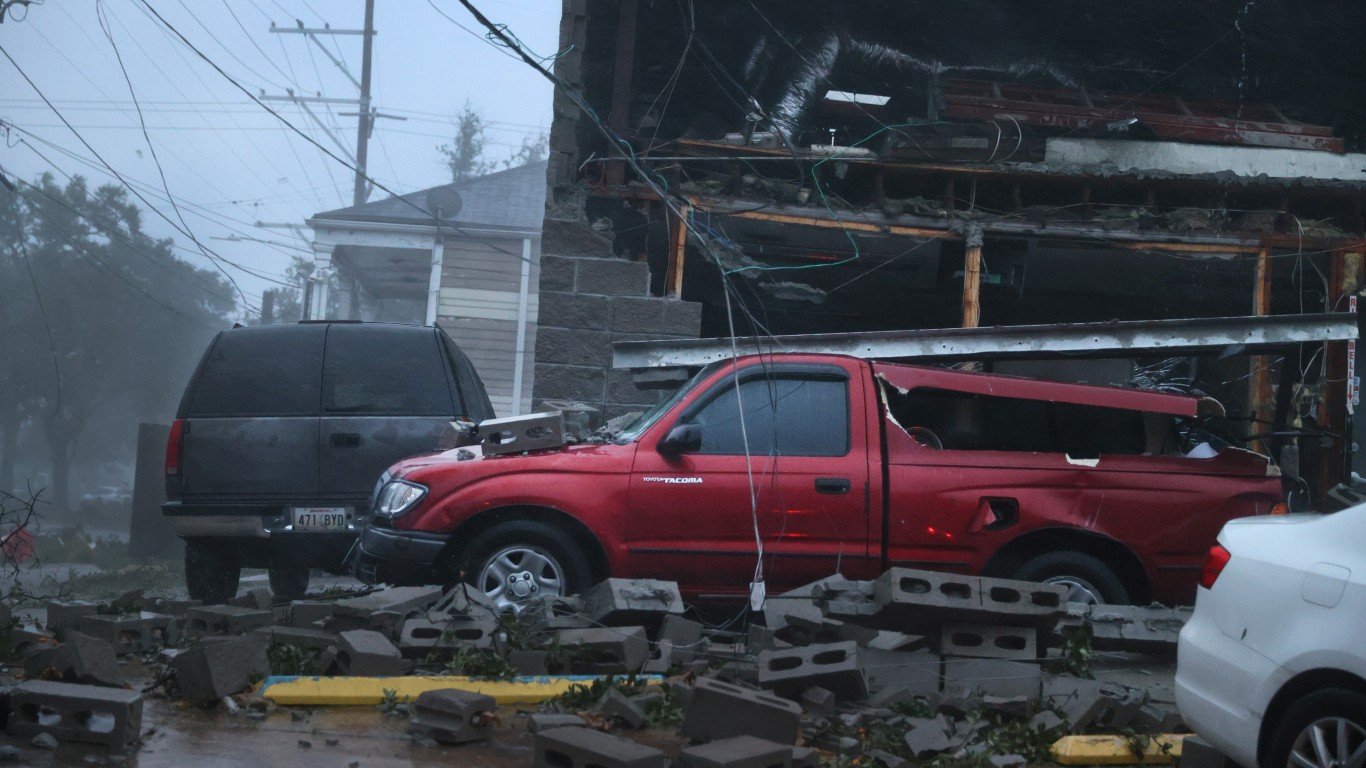
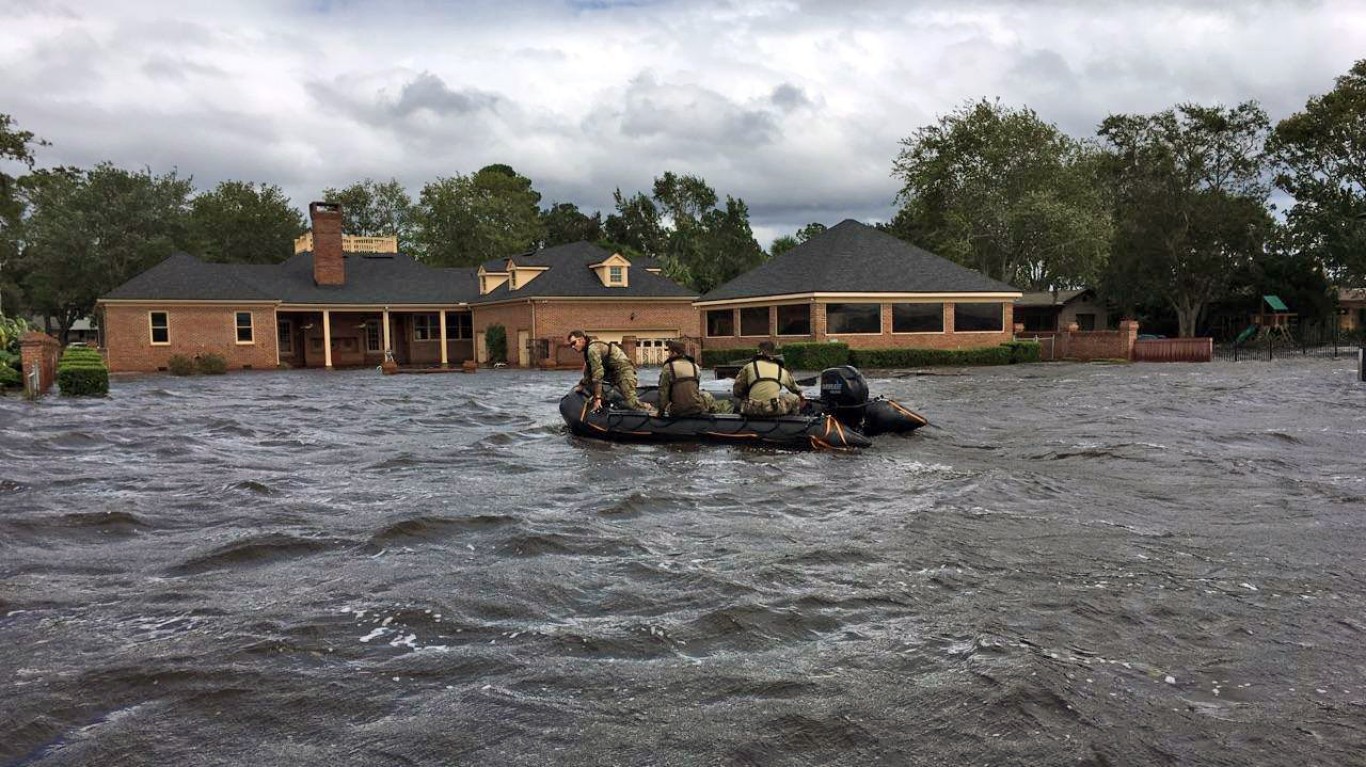
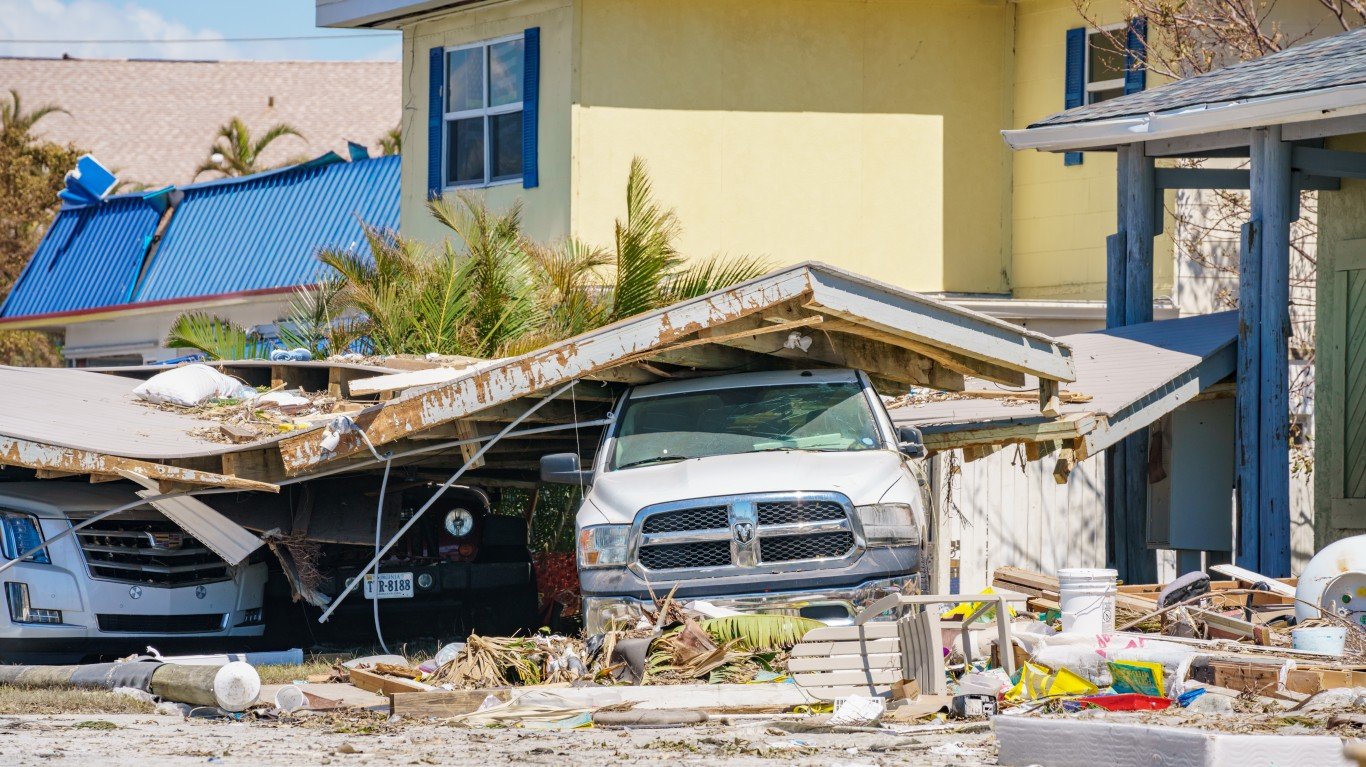
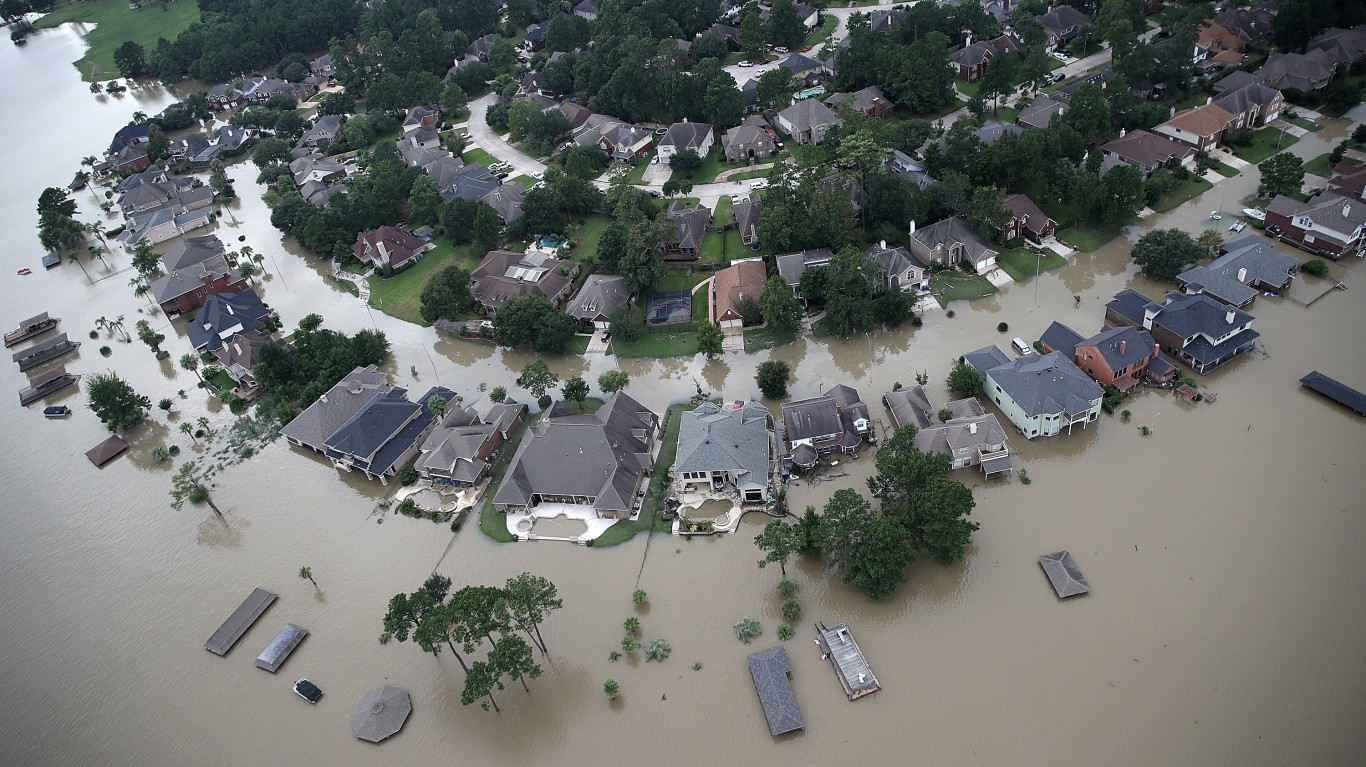
At the other end, Houston is least prepared to confront the challenges of climate change, according to Policygenius, owing to its exposure to hurricanes that are expected to become stronger and more frequent in the coming decades. Approximately 16% of Houston homes are built on 100-year flood plains, meaning they have a higher chance of being flooded, even by smaller storms. Other cities with low overall scores are Los Angeles, Tucson, Arizona; New Orleans, and Florida’s top four most-populated metro areas. (Globally, these are the 25 worst cities to live as global warming gets worse.)
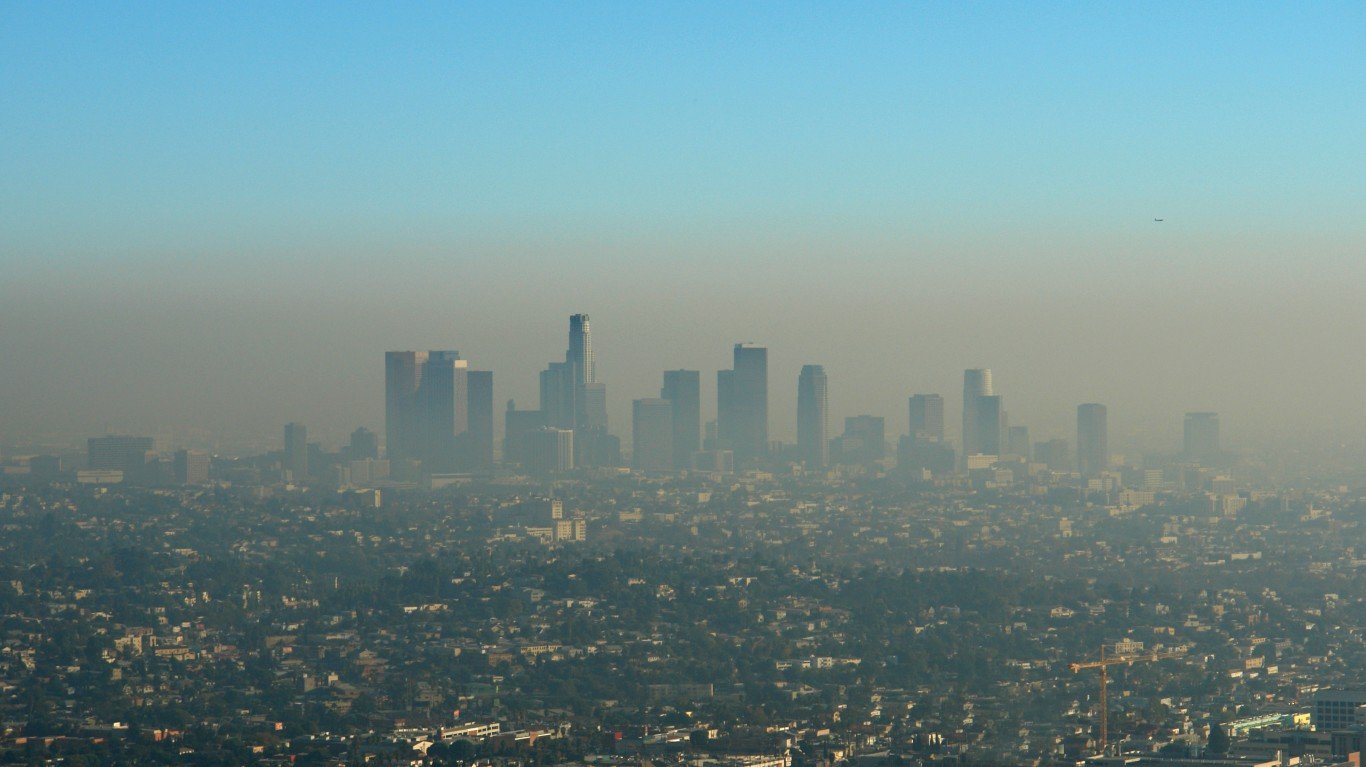
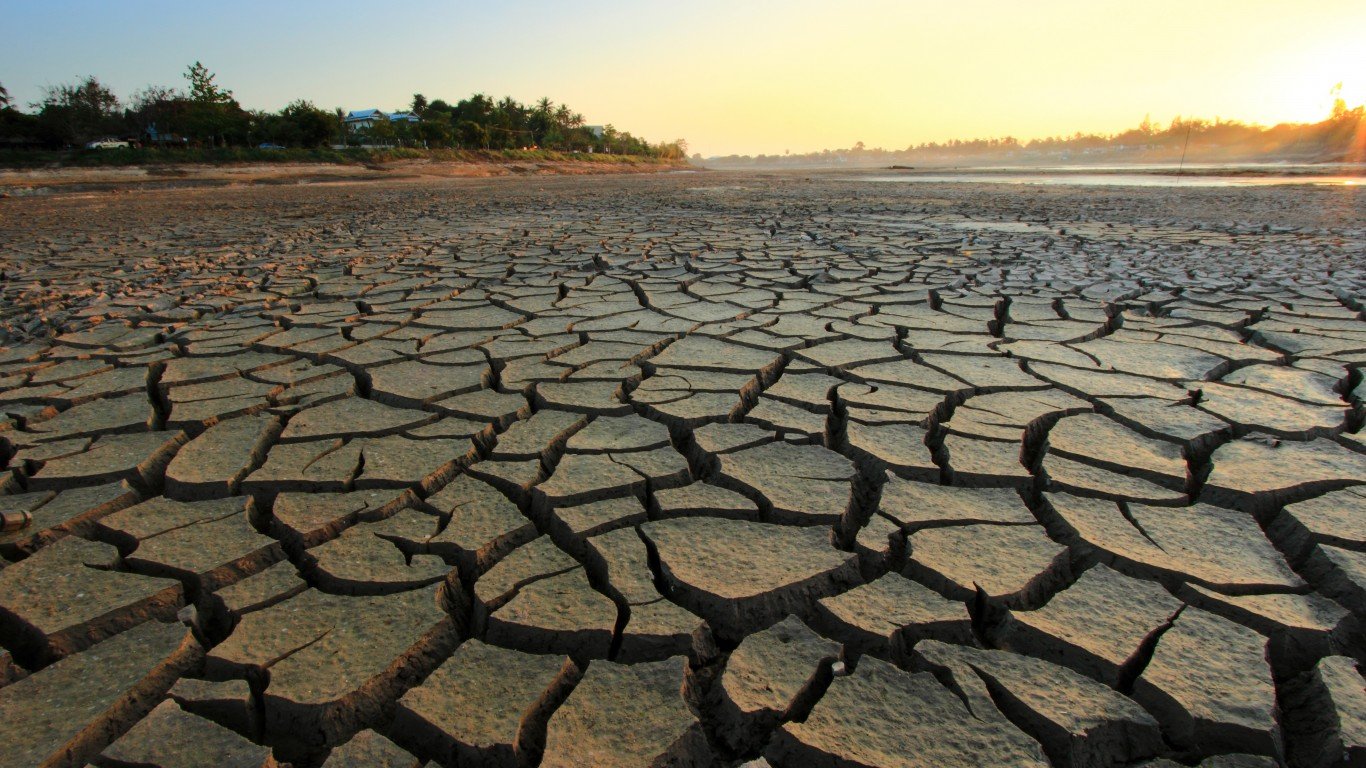
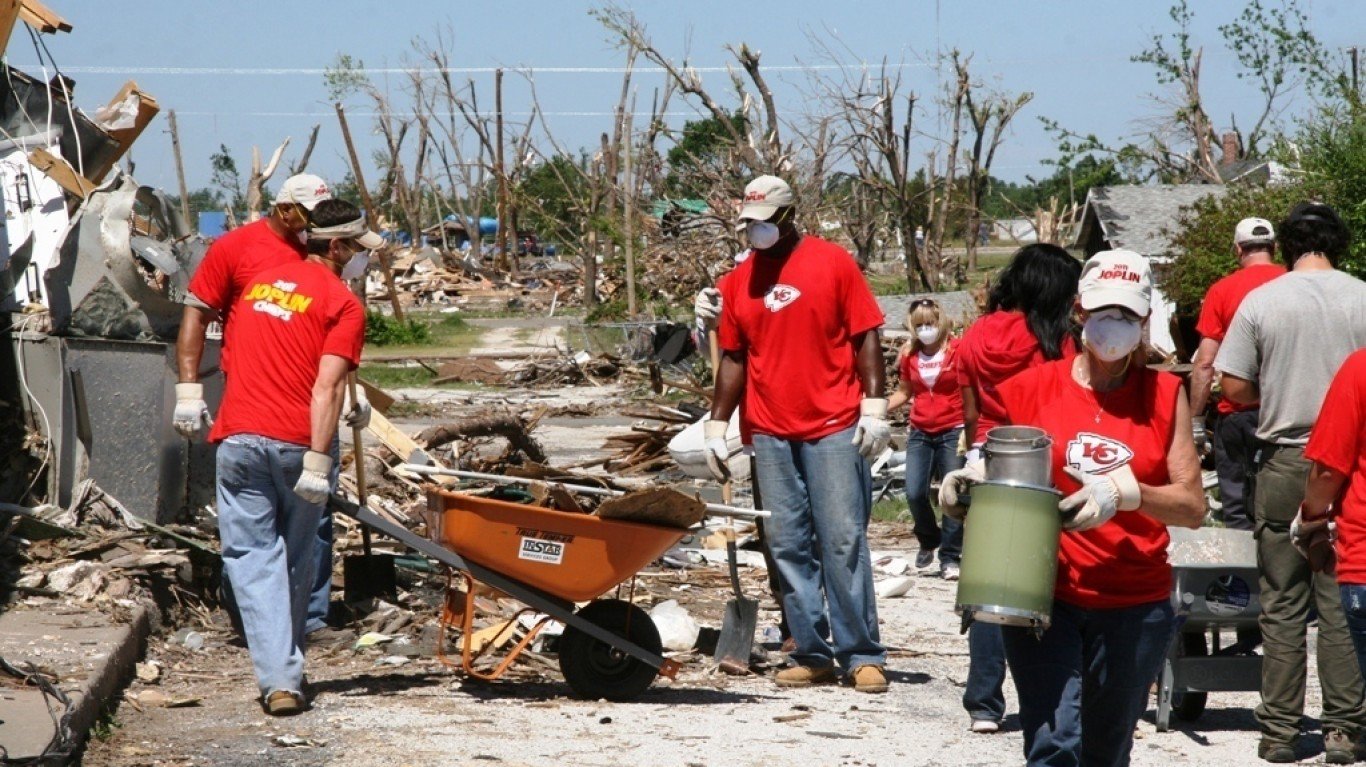
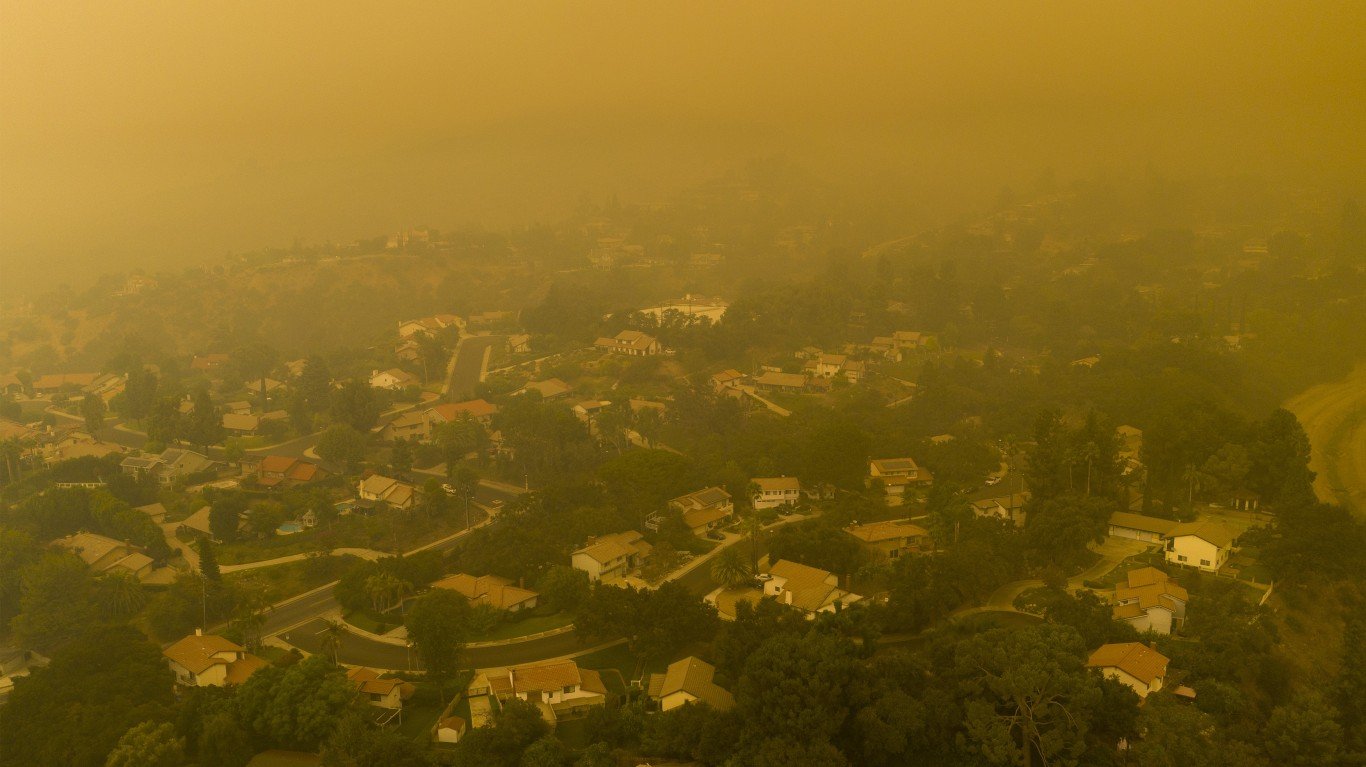
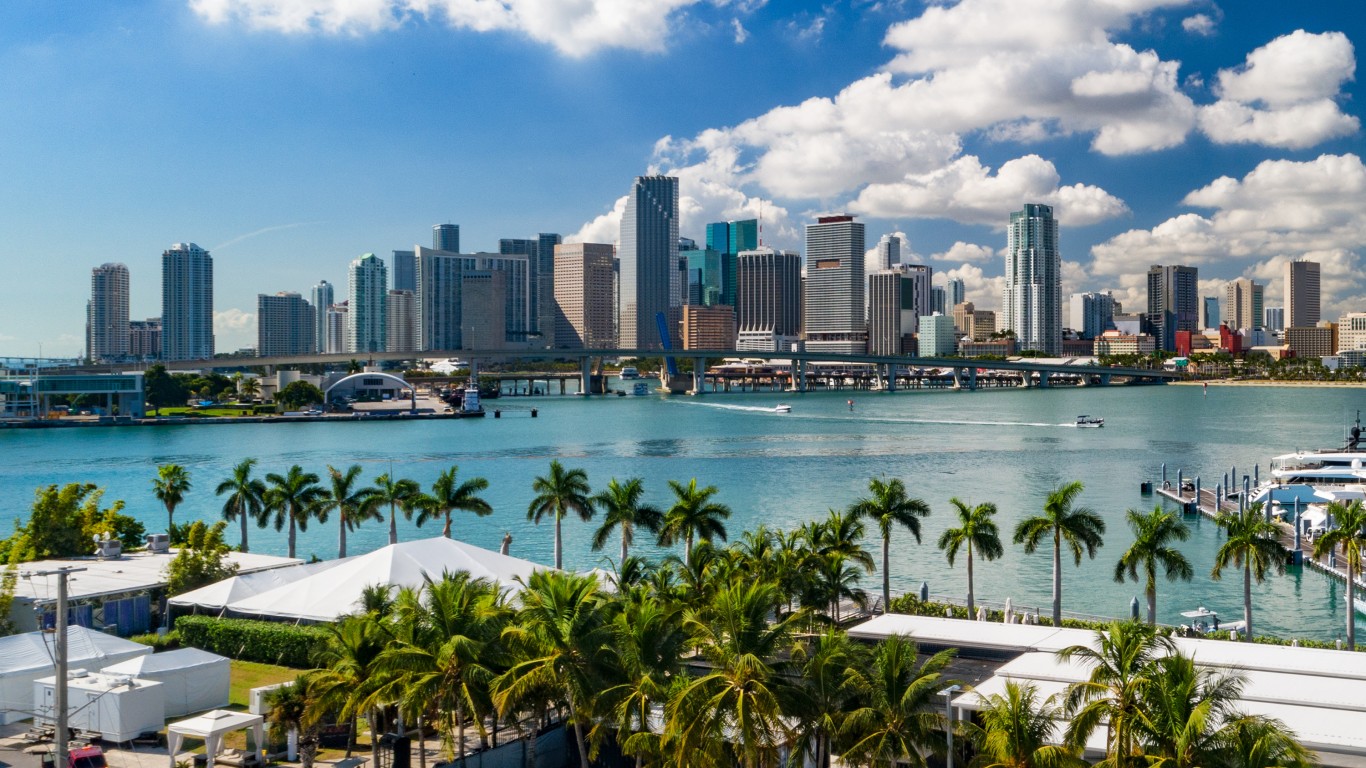
Three cities scored the lowest in four indicators: Los Angeles for air quality, Tucson for heat and humidity, and Miami for flooding and sea level rise; climate-related disasters. This is likely not surprising. A recent report from the American Lung Association gave Los Angeles (and 10 other counties) failing grades in all three of its air quality measures,while Tucson keeps beating heat records. Similarly, Miami could see hurricanes becoming more frequent and more intense, and it is already seeing the effects of sea level rise.
Click here to see the best and worst American cities to live as climate change gets worse.
Click here to see our detailed methodology.

1. San Francisco, CA
> Extreme heat and humidity: 95.7/100
> Air quality: 90/100
> Flooding and sea level rise: 82.5/100
> Natural disasters: 91.3/100
> Population: 4,623,264
[in-text-ad]
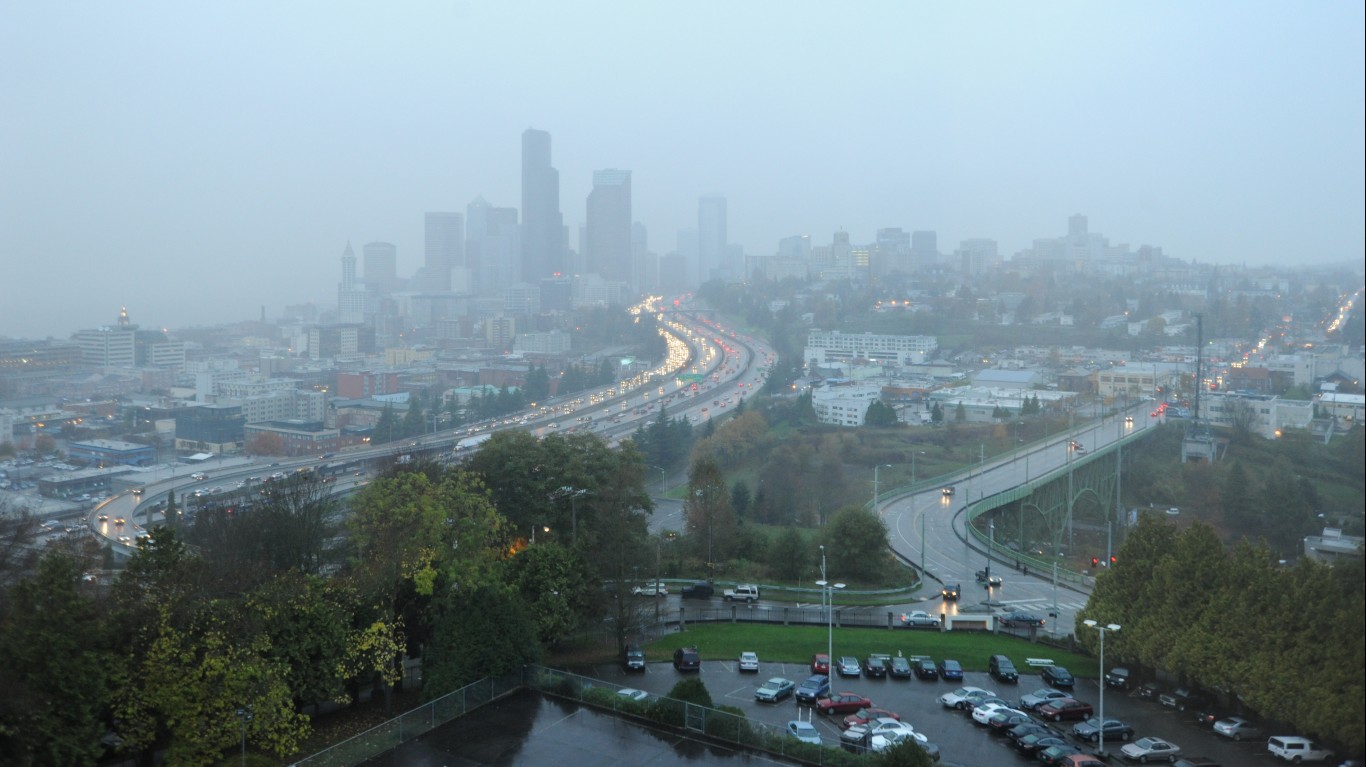
2. Seattle, WA
> Extreme heat and humidity: 90.5/100
> Air quality: 85/100
> Flooding and sea level rise: 36.5/100
> Natural disasters: 67.3/100
> Population: 4,011,553
[recirclink id=1312342]

3. Minneapolis, MN
> Extreme heat and humidity: 66.3/100
> Air quality: 52/100
> Flooding and sea level rise: 64.7/100
> Natural disasters: 52/100
> Population: 3,690,512
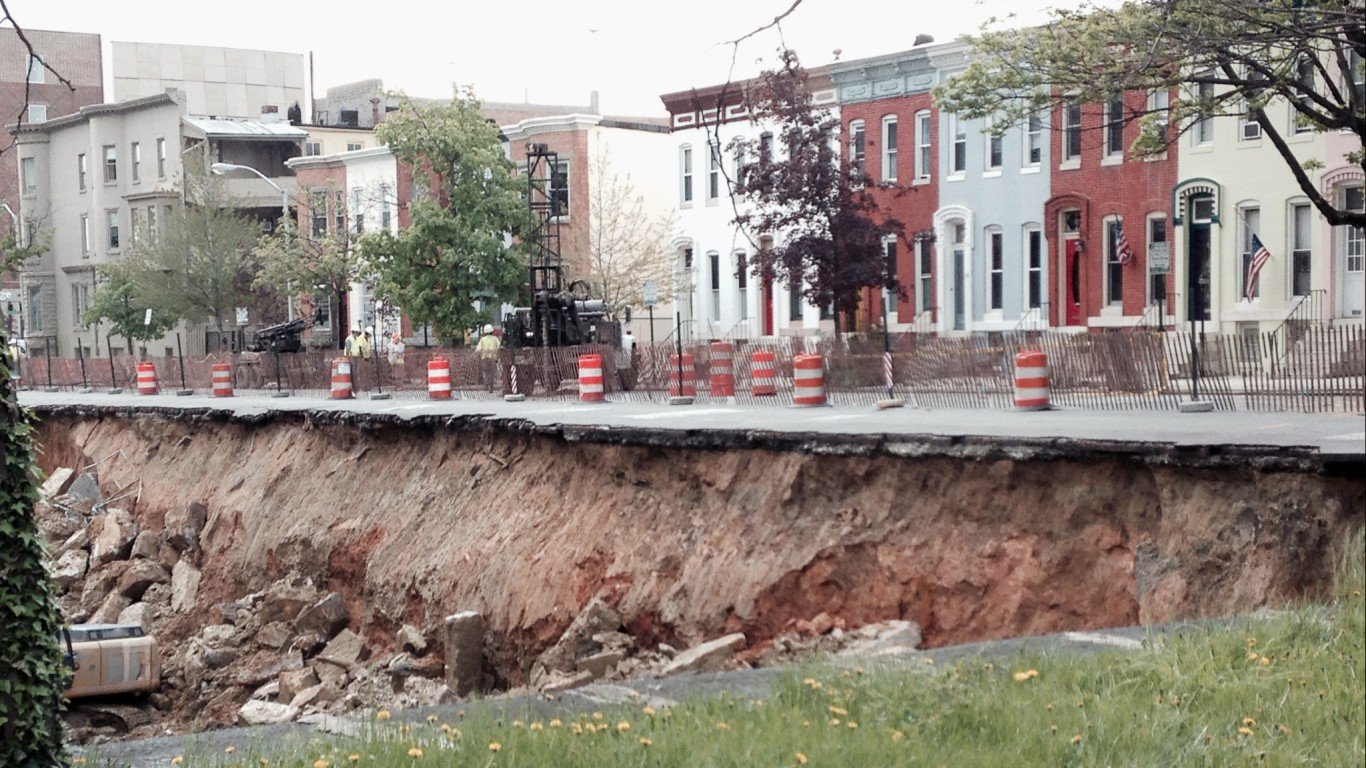
4. Baltimore, MD
> Extreme heat and humidity: 66/100
> Air quality: 69/100
> Flooding and sea level rise: 60.5/100
> Natural disasters: 62/100
> Population: 2,838,327
[in-text-ad-2]

5. Milwaukee, WI
> Extreme heat and humidity: 71/100
> Air quality: 34/100
> Flooding and sea level rise: 78.7/100
> Natural disasters: 70.7/100
> Population: 1,566,487

6. San Jose, CA
> Extreme heat and humidity: 100/100
> Air quality: 42/100
> Flooding and sea level rise: 40/100
> Natural disasters: 57.3/100
> Population: 1,952,185
[in-text-ad]

7. Columbus, OH
> Extreme heat and humidity: 63/100
> Air quality: 58/100
> Flooding and sea level rise: 71.3/100
> Natural disasters: 70/100
> Population: 2,151,017
[recirclink id=1304185]

8. Portland, OR
> Extreme heat and humidity: 78/100
> Air quality: 94/100
> Flooding and sea level rise: 28.3/100
> Natural disasters: 72/100
> Population: 2,510,696
9. Buffalo, NY
> Extreme heat and humidity: 85.7/100
> Air quality: 75/100
> Flooding and sea level rise: 34/100
> Natural disasters: 58.7/100
> Population: 1,162,336
[in-text-ad-2]

10. Cleveland, OH
> Extreme heat and humidity: 68.7/100
> Air quality: 22/100
> Flooding and sea level rise: 75.3/100
> Natural disasters: 66.7/100
> Population: 2,075,662
11. Raleigh, NC
> Extreme heat and humidity: 58/100
> Air quality: 78/100
> Flooding and sea level rise: 68/100
> Natural disasters: 36.7/100
> Population: 1,448,411
[in-text-ad]
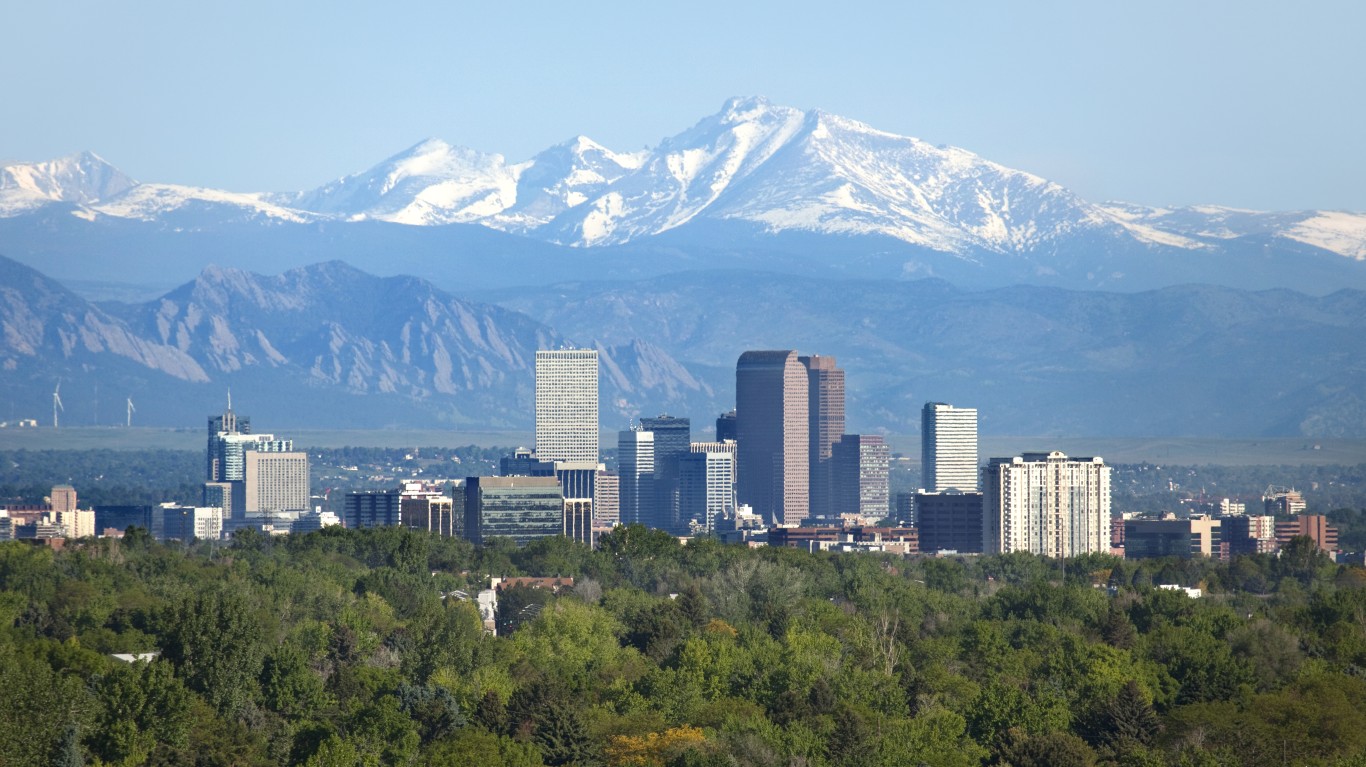
12. Denver, CO
> Extreme heat and humidity: 55.3/100
> Air quality: 17/100
> Flooding and sea level rise: 96/100
> Natural disasters: 68/100
> Population: 2,972,567
[recirclink id=1304189]

13. Pittsburgh, PA
> Extreme heat and humidity: 74.8/100
> Air quality: 26/100
> Flooding and sea level rise: 35.3/100
> Natural disasters: 64/100
> Population: 2,353,538

14. Providence, RI
> Extreme heat and humidity: 89.7/100
> Air quality: 69/100
> Flooding and sea level rise: 41.3/100
> Natural disasters: 52/100
> Population: 1,675,774
[in-text-ad-2]
15. Austin, TX
> Extreme heat and humidity: 52/100
> Air quality: 58/100
> Flooding and sea level rise: 79/100
> Natural disasters: 31.3/100
> Population: 2,352,426
16. Kansas City, MO
> Extreme heat and humidity: 47.3/100
> Air quality: 44/100
> Flooding and sea level rise: 78/100
> Natural disasters: 61.3/100
> Population: 2,199,544
[in-text-ad]

17. Washington, DC
> Extreme heat and humidity: 38/100
> Air quality: 46/100
> Flooding and sea level rise: 52/100
> Natural disasters: 88/100
> Population: 6,358,652
[recirclink id=1281713]

18. Bridgeport, CT
> Extreme heat and humidity: 71/100
> Air quality: 75/100
> Flooding and sea level rise: 16.5/100
> Natural disasters: 52/100
> Population: 959,768
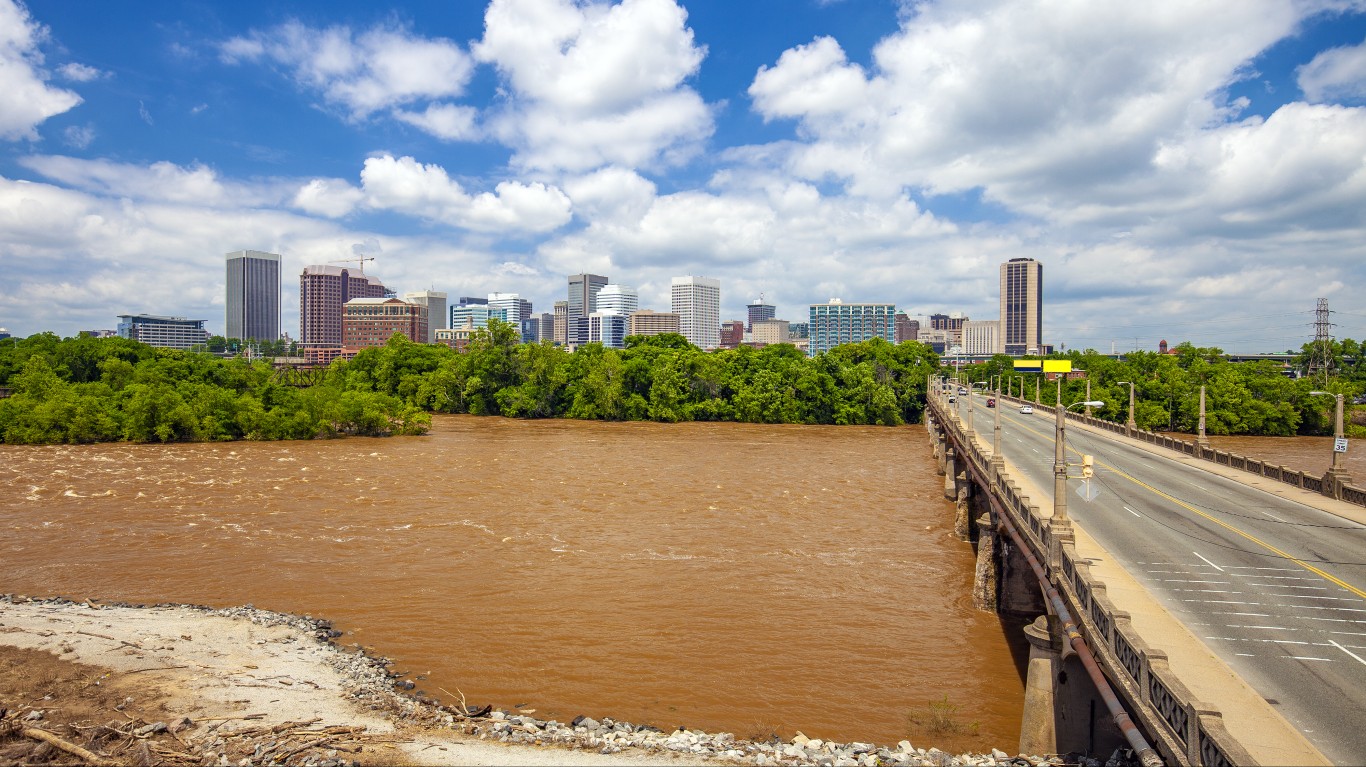
19. Richmond, VA
> Extreme heat and humidity: 48.3/100
> Air quality: 92/100
> Flooding and sea level rise: 58/100
> Natural disasters: 61.3/100
> Population: 1,317,525
[in-text-ad-2]
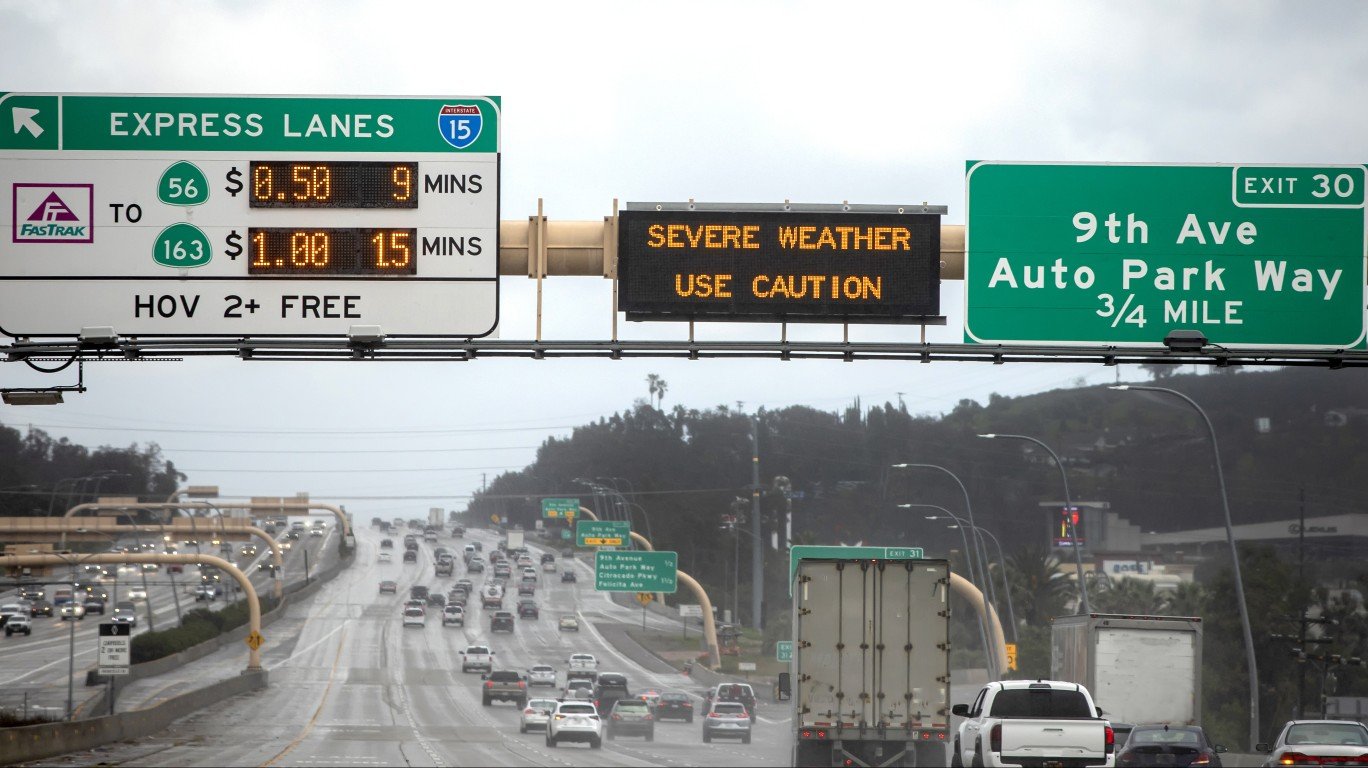
20. San Diego, CA
> Extreme heat and humidity: 90/100
> Air quality: 13/100
> Flooding and sea level rise: 64.5/100
> Natural disasters: 34/100
> Population: 3,286,069
21. Detroit, MI
> Extreme heat and humidity: 70/100
> Air quality: 39/100
> Flooding and sea level rise: 60/100
> Natural disasters: 65.3/100
> Population: 4,365,205
[in-text-ad]
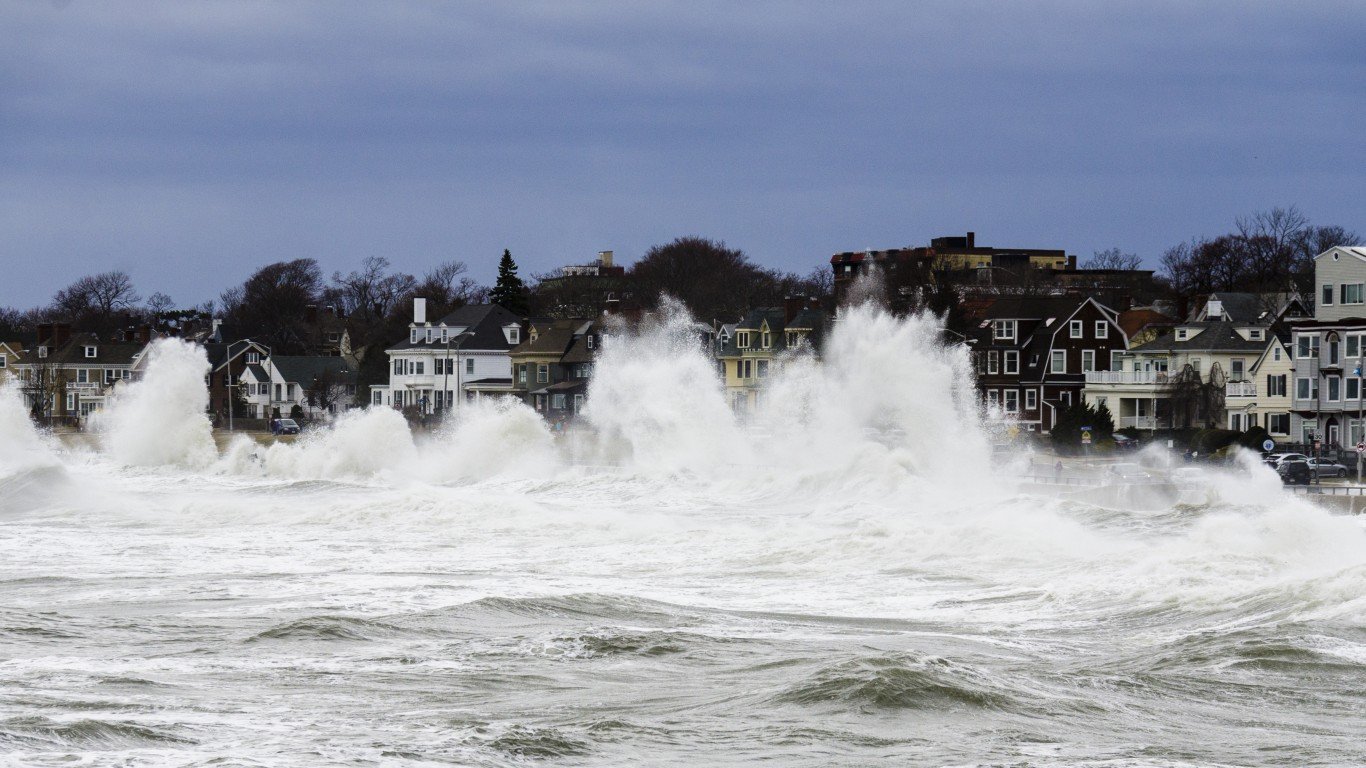
22. Boston, MA
> Extreme heat and humidity: 75.3/100
> Air quality: 81/100
> Flooding and sea level rise: 11/100
> Natural disasters: 67.3/100
> Population: 4,899,932
[recirclink id=1265879]
23. Charlotte, NC
> Extreme heat and humidity: 59/100
> Air quality: 52/100
> Flooding and sea level rise: 54.7/100
> Natural disasters: 46.7/100
> Population: 2,701,046
24. St. Louis, MO
> Extreme heat and humidity: 33/100
> Air quality: N/A
> Flooding and sea level rise: 57.3/100
> Natural disasters: 77.3/100
> Population: 2,806,615
[in-text-ad-2]
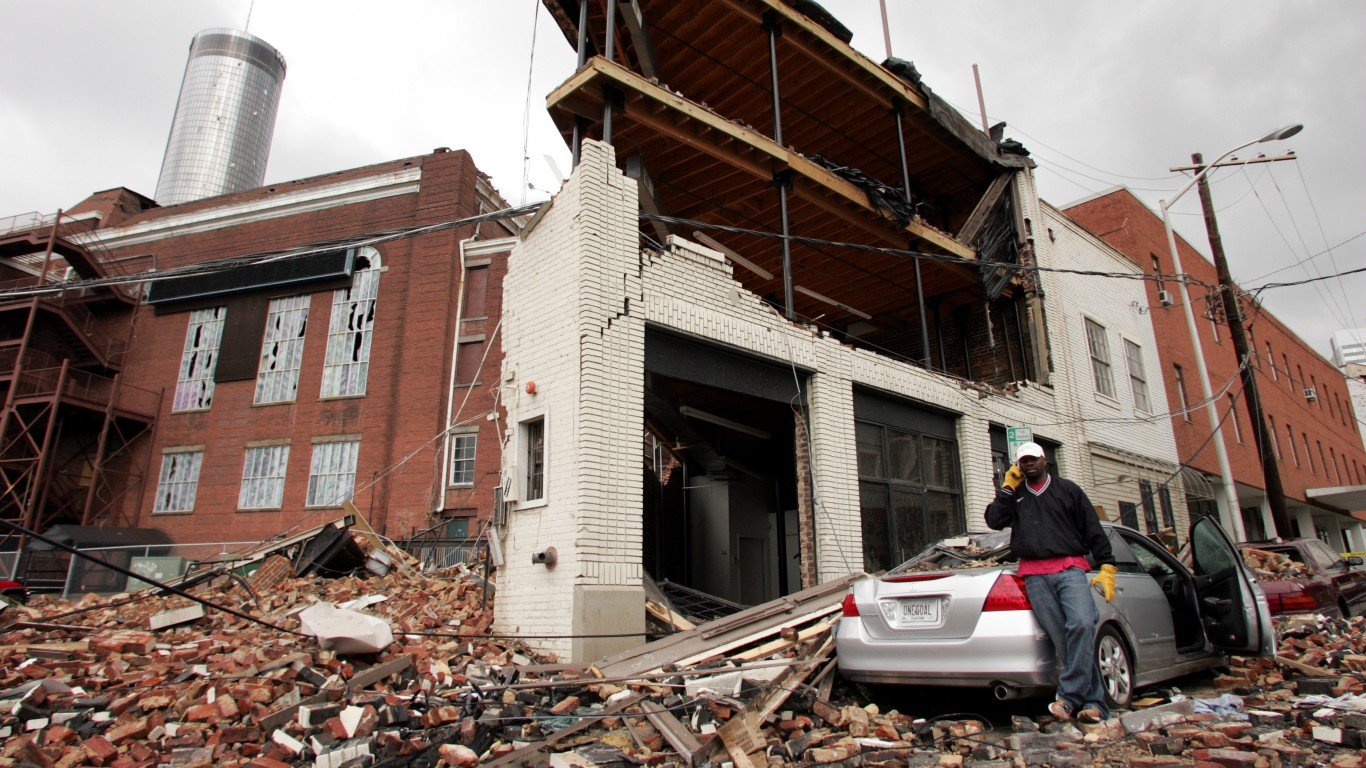
25. Atlanta, GA
> Extreme heat and humidity: 58.8/100
> Air quality: 48/100
> Flooding and sea level rise: 53.3/100
> Natural disasters: 44/100
> Population: 6,144,970
26. Dallas, TX
> Extreme heat and humidity: 50.8/100
> Air quality: 72/100
> Flooding and sea level rise: 96/100
> Natural disasters: 34.7/100
> Population: 7,759,615
[in-text-ad]
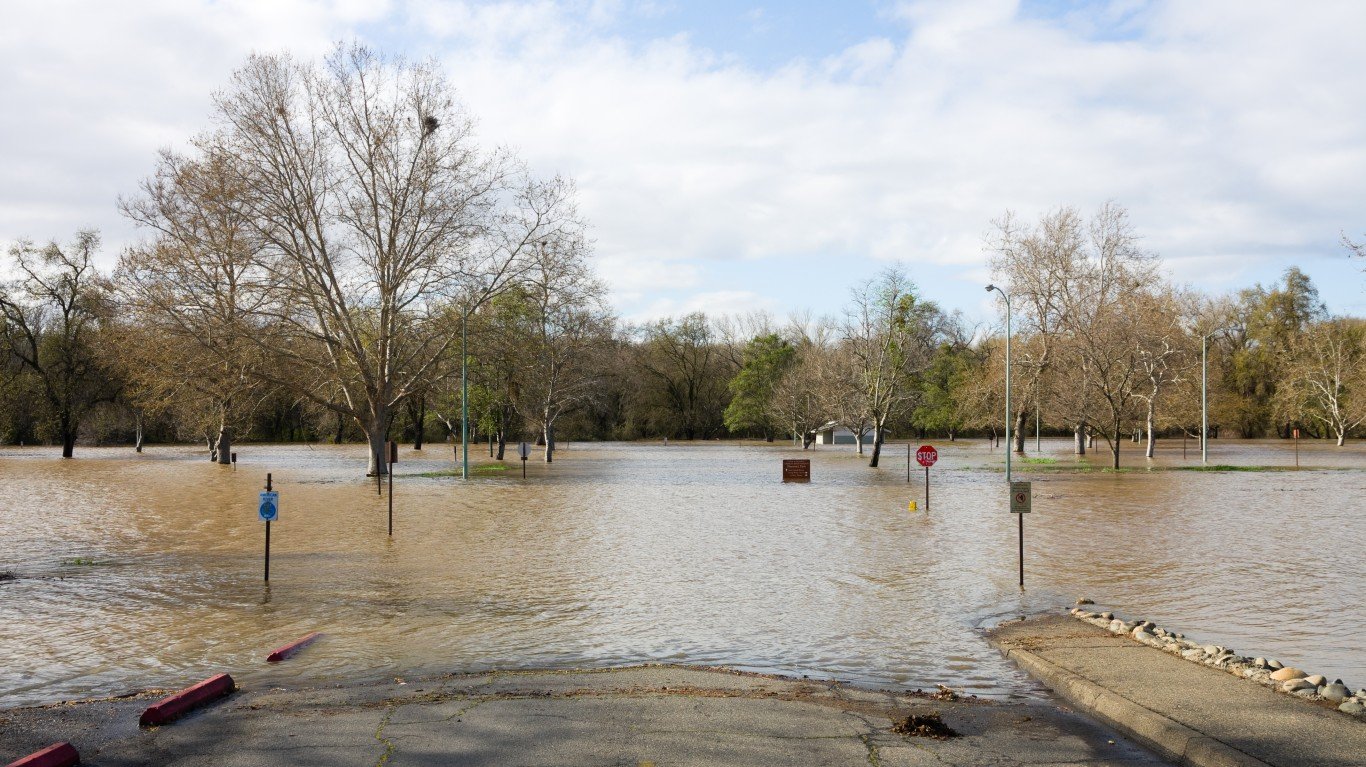
27. Sacramento, CA
> Extreme heat and humidity: 28/100
> Air quality: 66/100
> Flooding and sea level rise: 57.5/100
> Natural disasters: 62.7/100
> Population: 2,411,428
[recirclink id=1312342]
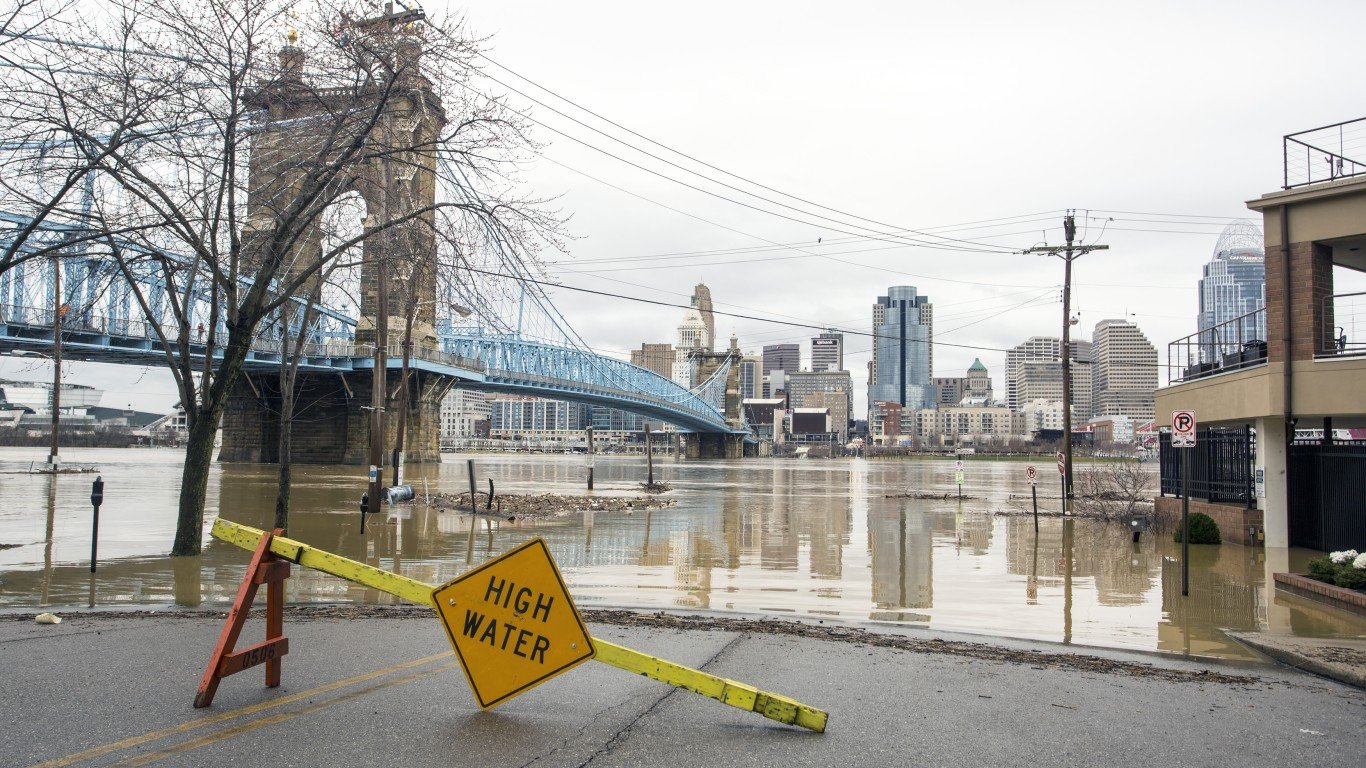
28. Cincinnati, OH
> Extreme heat and humidity: 51.3/100
> Air quality: 30/100
> Flooding and sea level rise: 38.3/100
> Natural disasters: 68.7/100
> Population: 2,261,665
29. Virginia Beach, VA
> Extreme heat and humidity: 50.5/100
> Air quality: 96/100
> Flooding and sea level rise: 10/100
> Natural disasters: 39.3/100
> Population: 1,806,423
[in-text-ad-2]

30. Indianapolis, IN
> Extreme heat and humidity: 62/100
> Air quality: 17/100
> Flooding and sea level rise: 70.3/100
> Natural disasters: 62.7/100
> Population: 2,129,479
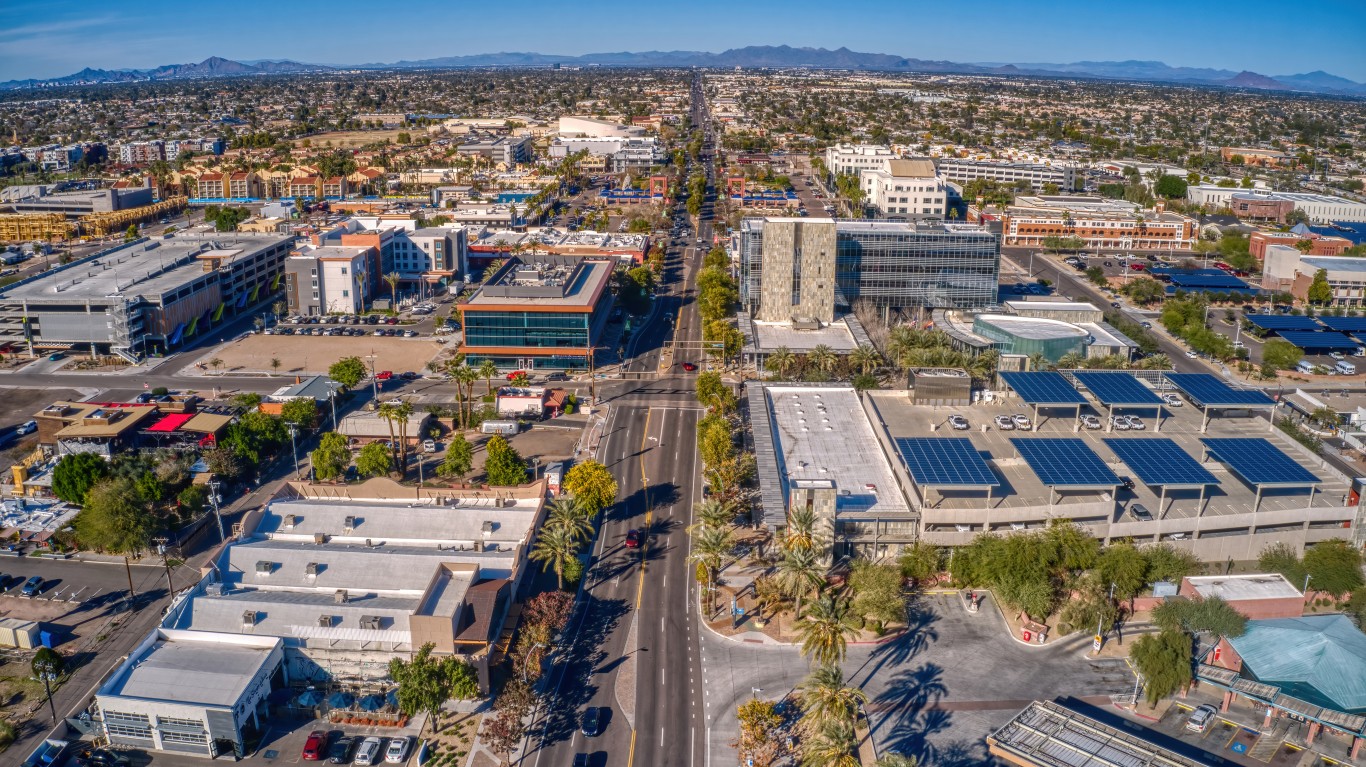
31. Phoenix, AZ
> Extreme heat and humidity: 52.5/100
> Air quality: 4/100
> Flooding and sea level rise: 94/100
> Natural disasters: 31.3/100
> Population: 4,946,145
[in-text-ad]
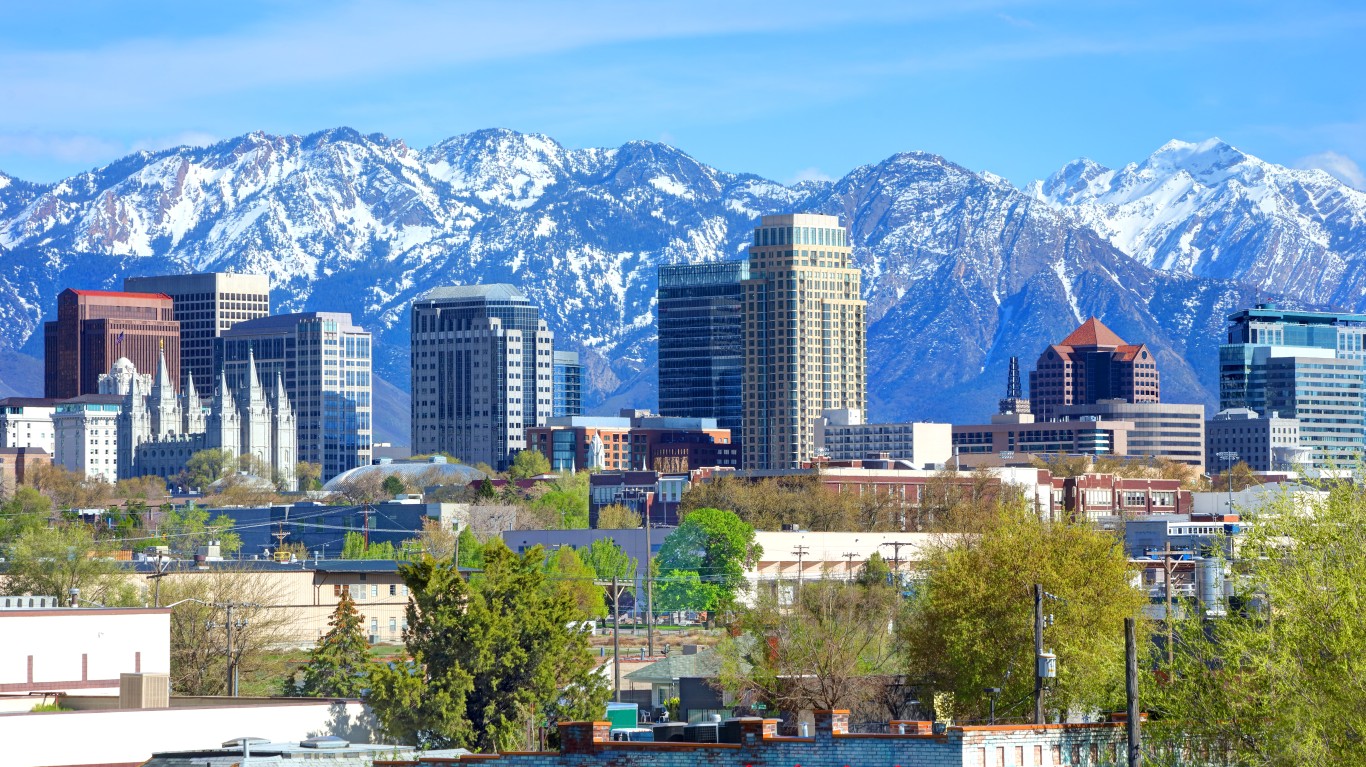
32. Salt Lake City, UT
> Extreme heat and humidity: 32/100
> Air quality: 22/100
> Flooding and sea level rise: 41/100
> Natural disasters: 62.7/100
> Population: 1,263,061
[recirclink id=1304185]
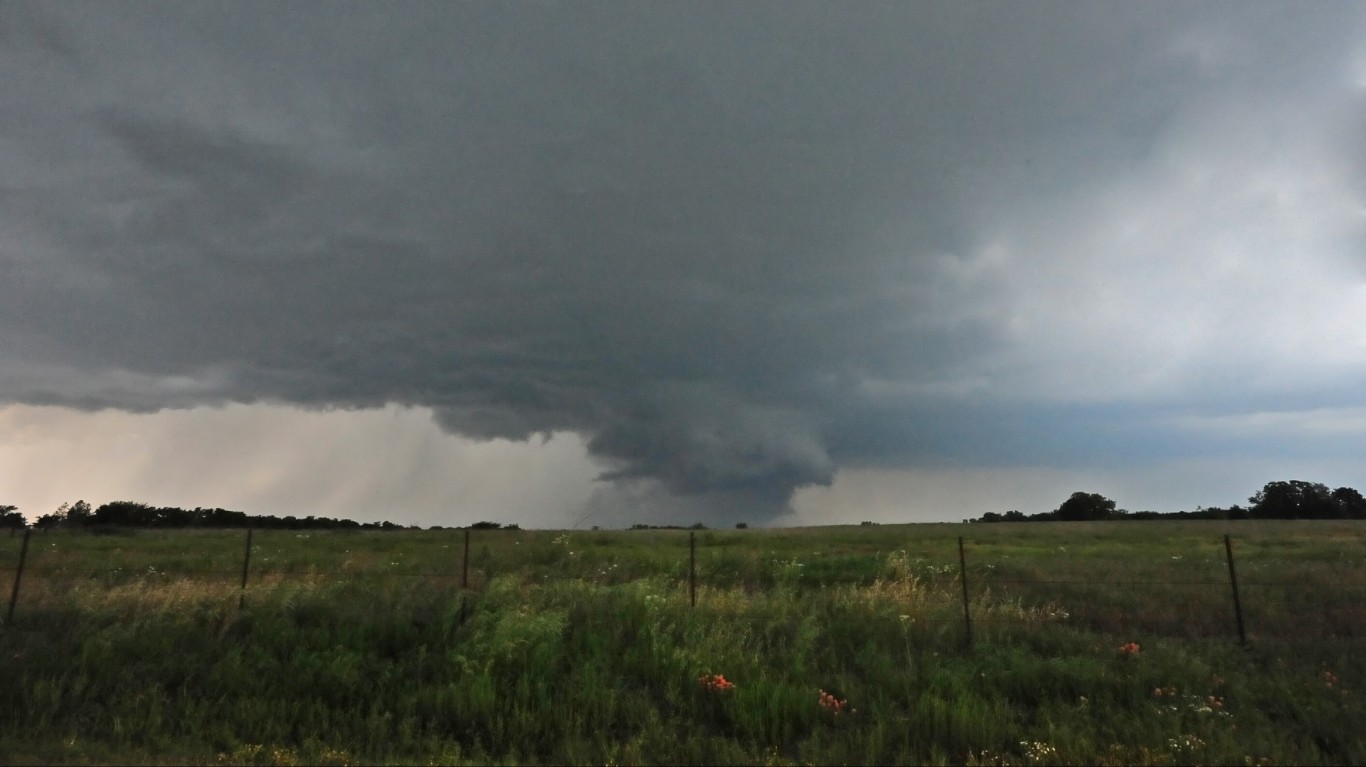
33. Oklahoma City, OK
> Extreme heat and humidity: 51.8/100
> Air quality: 28/100
> Flooding and sea level rise: 81.3/100
> Natural disasters: 29.3/100
> Population: 1,441,647
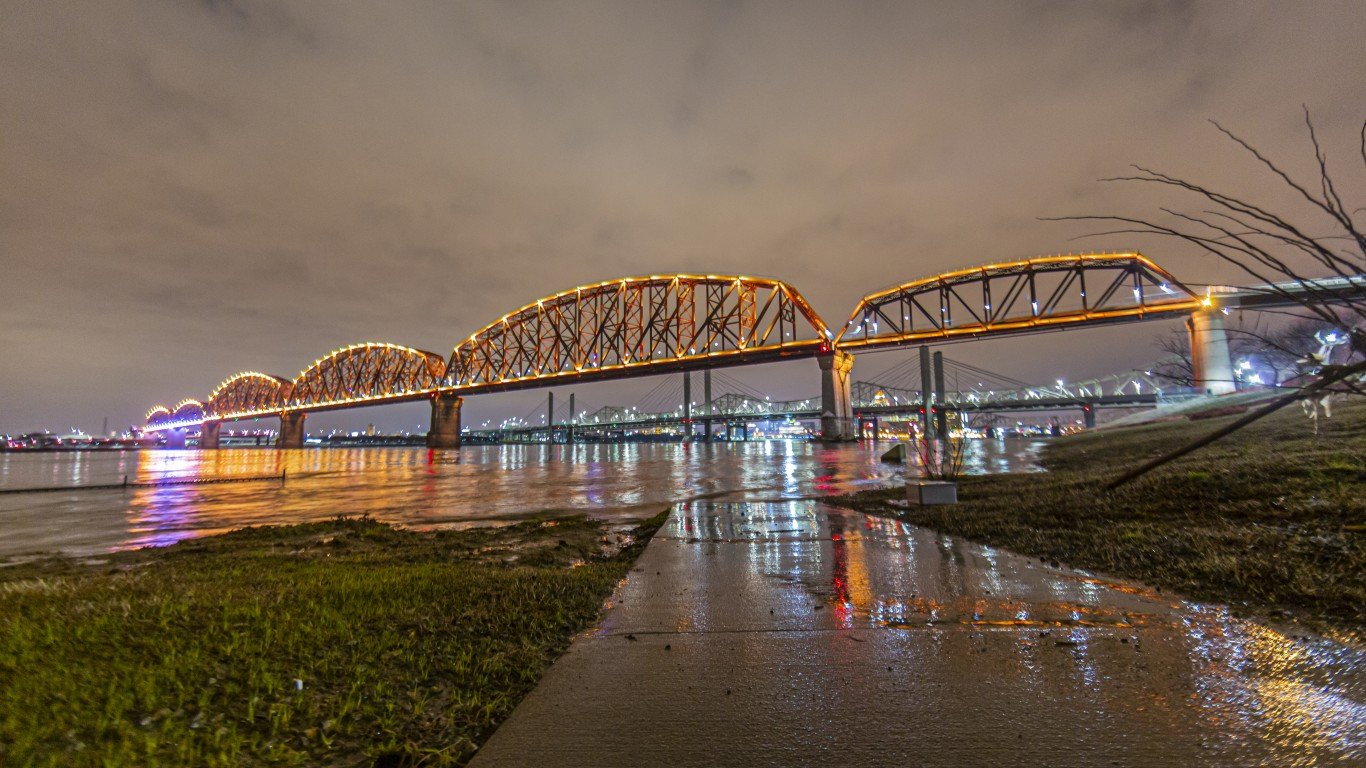
34. Louisville, KY
> Extreme heat and humidity: 31/100
> Air quality: 36/100
> Flooding and sea level rise: 39.7/100
> Natural disasters: 66.7/100
> Population: 1,284,826
[in-text-ad-2]

35. San Antonio, TX
> Extreme heat and humidity: 51.8/100
> Air quality: 32/100
> Flooding and sea level rise: 84.3/100
> Natural disasters: 34.7/100
> Population: 2,601,788
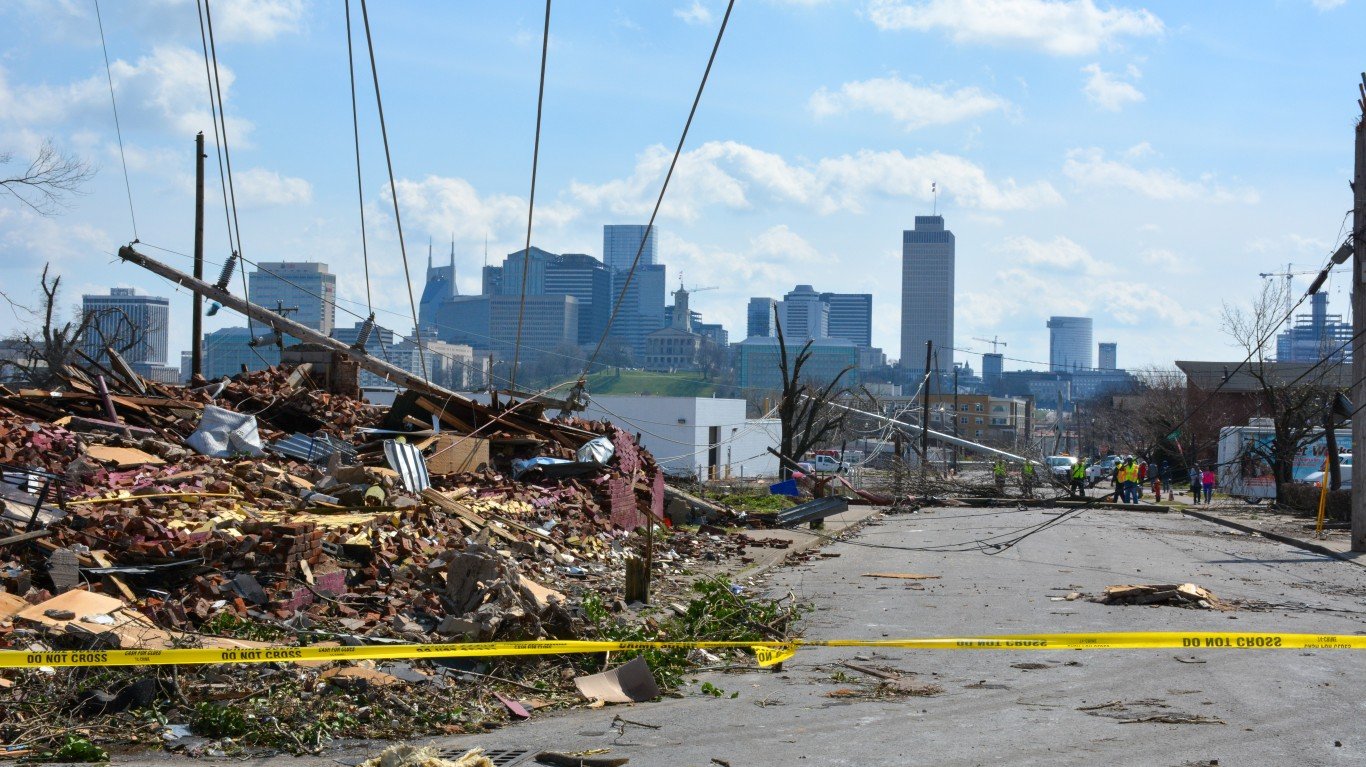
36. Nashville, TN
> Extreme heat and humidity: 34.3/100
> Air quality: 52/100
> Flooding and sea level rise: 42/100
> Natural disasters: 48.7/100
> Population: 2,013,506
[in-text-ad]
37. Chicago, IL
> Extreme heat and humidity: 48.8/100
> Air quality: 13/100
> Flooding and sea level rise: 27.3/100
> Natural disasters: 55.3/100
> Population: 9,510,390
[recirclink id=1304189]
38. New York, NY
> Extreme heat and humidity: 63.3/100
> Air quality: 88/100
> Flooding and sea level rise: 22.5/100
> Natural disasters: 65.3/100
> Population: 19,768,458

39. Philadelphia, PA
> Extreme heat and humidity: 51.7/100
> Air quality: 39/100
> Flooding and sea level rise: 39.8/100
> Natural disasters: 55.3/100
> Population: 6,228,601
[in-text-ad-2]

40. Riverside, CA
> Extreme heat and humidity: 53.2/100
> Air quality: 6/100
> Flooding and sea level rise: 48.7/100
> Natural disasters: 29.3/100
> Population: 4,653,105

41. Memphis, TN
> Extreme heat and humidity: 22/100
> Air quality: 62/100
> Flooding and sea level rise: 46.3/100
> Natural disasters: 36.7/100
> Population: 1,336,438
[in-text-ad]
42. Las Vegas, NV
> Extreme heat and humidity: 19.3/100
> Air quality: 8/100
> Flooding and sea level rise: 89/100
> Natural disasters: 58/100
> Population: 2,292,476
[recirclink id=1281713]
43. New Orleans, LA
> Extreme heat and humidity: 24/100
> Air quality: 98/100
> Flooding and sea level rise: 8/100
> Natural disasters: 31.3/100
> Population: 1,261,726
44. Tucson, AZ
> Extreme heat and humidity: 8/100
> Air quality: 10/100
> Flooding and sea level rise: 94.7/100
> Natural disasters: 42/100
> Population: 1,052,030
[in-text-ad-2]
45. Orlando, FL
> Extreme heat and humidity: 20/100
> Air quality: 85/100
> Flooding and sea level rise: 51/100
> Natural disasters: 12/100
> Population: 2,691,925
46. Los Angeles, CA
> Extreme heat and humidity: 54/100
> Air quality: 2/100
> Flooding and sea level rise: 40/100
> Natural disasters: 38/100
> Population: 12,997,353
[in-text-ad]
47. Jacksonville, FL
> Extreme heat and humidity: 20/100
> Air quality: 64/100
> Flooding and sea level rise: 10.5/100
> Natural disasters: 20.7/100
> Population: 1,637,666
[recirclink id=1265879]
48. Tampa, FL
> Extreme heat and humidity: 27.3/100
> Air quality: 58/100
> Flooding and sea level rise: 11/100
> Natural disasters: 10.7/100
> Population: 3,219,514
49. Miami, FL
> Extreme heat and humidity: 37.3/100
> Air quality: 81/100
> Flooding and sea level rise: 5.5/100
> Natural disasters: 3.3/100
> Population: 6,091,747
[in-text-ad-2]
50. Houston, TX
> Extreme heat and humidity: 14.7/100
> Air quality: 22/100
> Flooding and sea level rise: 20/100
> Natural disasters: 21.3/100
> Population: 7,206,841
Methodology
To find the best and worst American cities to live in as climate change gets worse, 24/7 Wall St. reviewed online insurance marketplace Policygenius ranking of America’s 50 largest cities by population. To determine which of those U.S. metro areas are the best and worst to live in 2050, Policygenius analyzed data from several sources and scored to cities across six key factors: Heat and humidity; flooding and sea level rise; climate-related disasters; air quality; social vulnerability; and community resilience.
Each city was then assigned a categorical score based on its average ranking across the different indicators for each category with higher scores meaning a better outlook and a lower score a worse outlook. Full methodology can be found here. We added metro area population from the Census Bureau’s American Community Survey 2021 one-year estimates.
Contact [email protected] for any questions or corrections.