The 25 Companies Making Billions Building The World’s Weapons
The United States Department of Defense submitted an $824 billion budget request for fiscal 2024, $8 billion more than its budget in fiscal 2023. The United States spends more on defense than any other country in the world, and a…

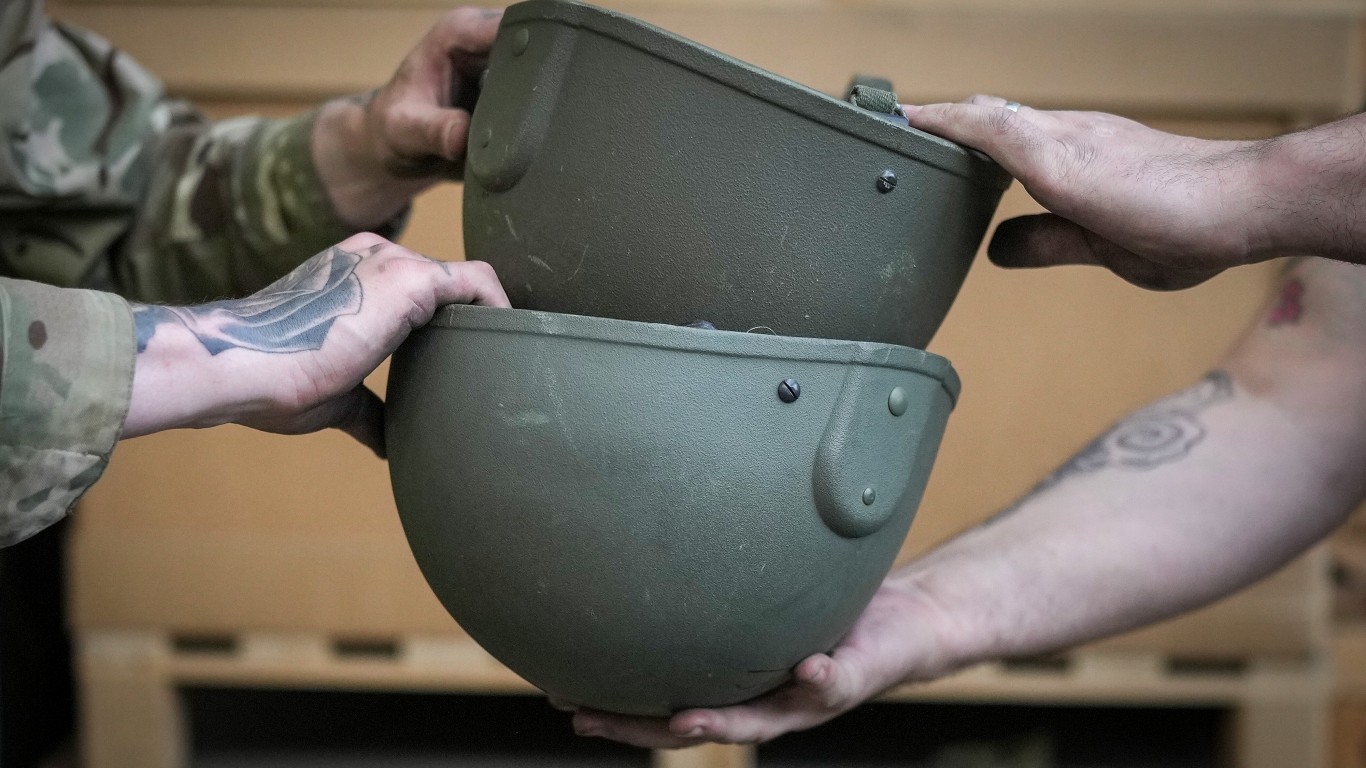
The United States Department of Defense submitted an $824 billion budget request for fiscal 2024, $8 billion more than its budget in fiscal 2023. The United States spends more on defense than any other country in the world, and a handful of major companies are benefitting.
The world’s 100 largest defense contractors – many of which are headquartered in the United States – brought in over $592 billion in weapons and military service contracts in 2021. And only 25 companies accounted for over 70% of those sales. (Here is a look at every gun currently used by the U.S. military.)
Using data on 2021 arms and military services sales from the Stockholm International Peace Research Institute, 24/7 Wall St. identified the companies profiting most from war. Each of the 25 companies on this list is estimated to have topped $5 billion in arms and military services sales in 2021.
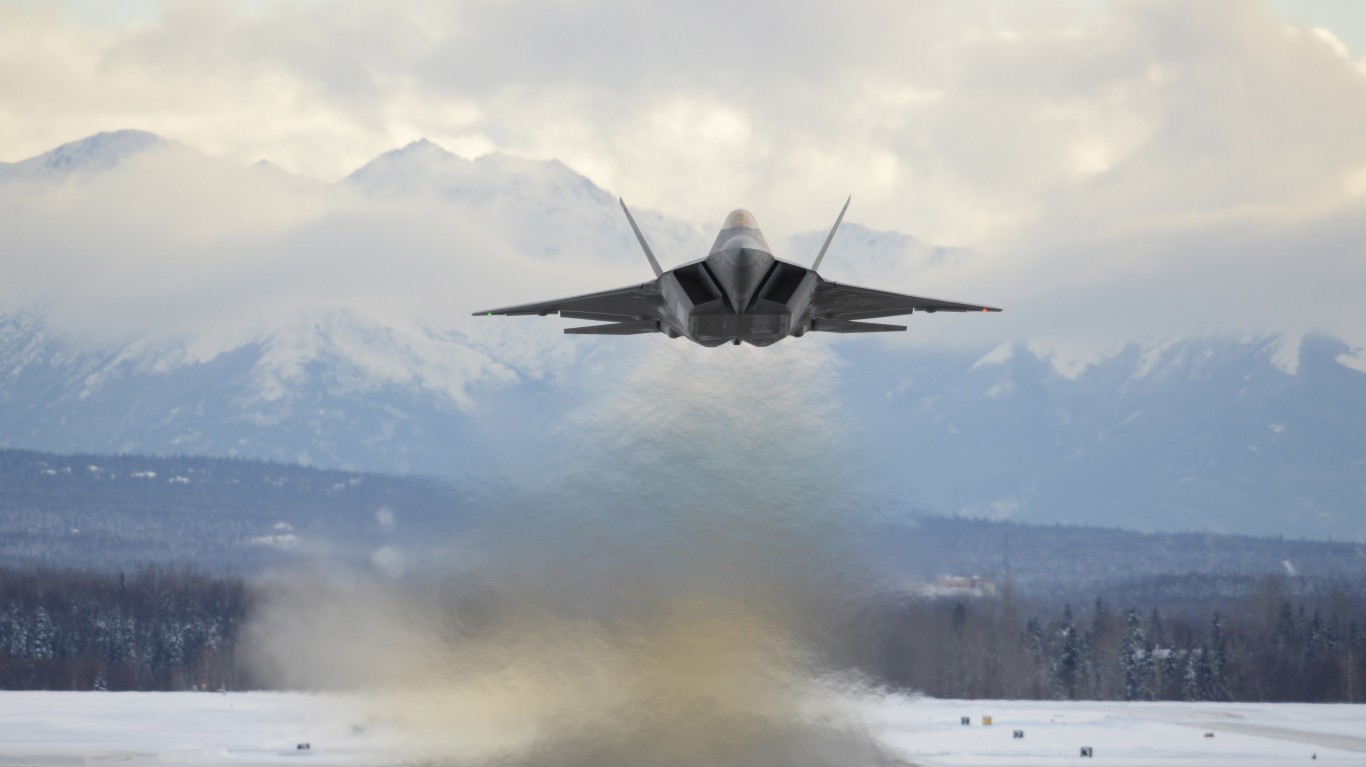
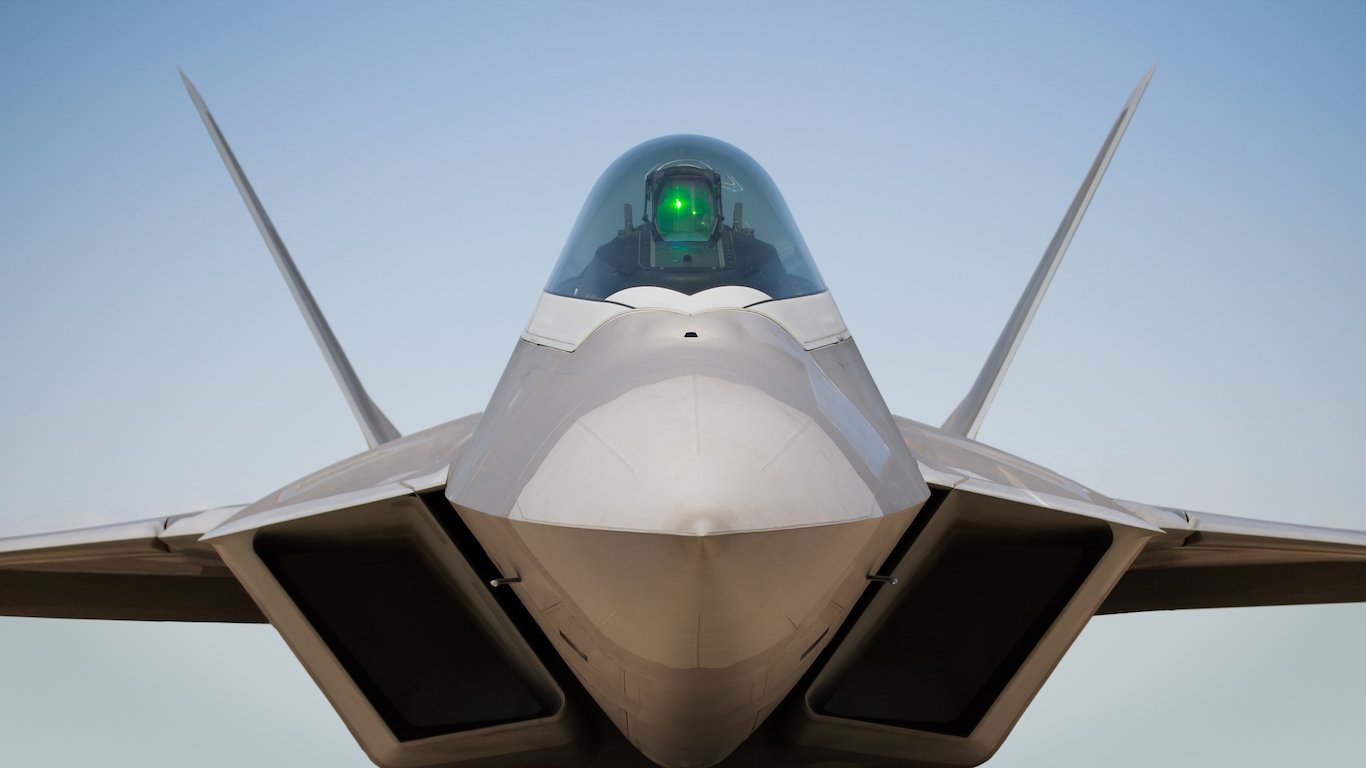
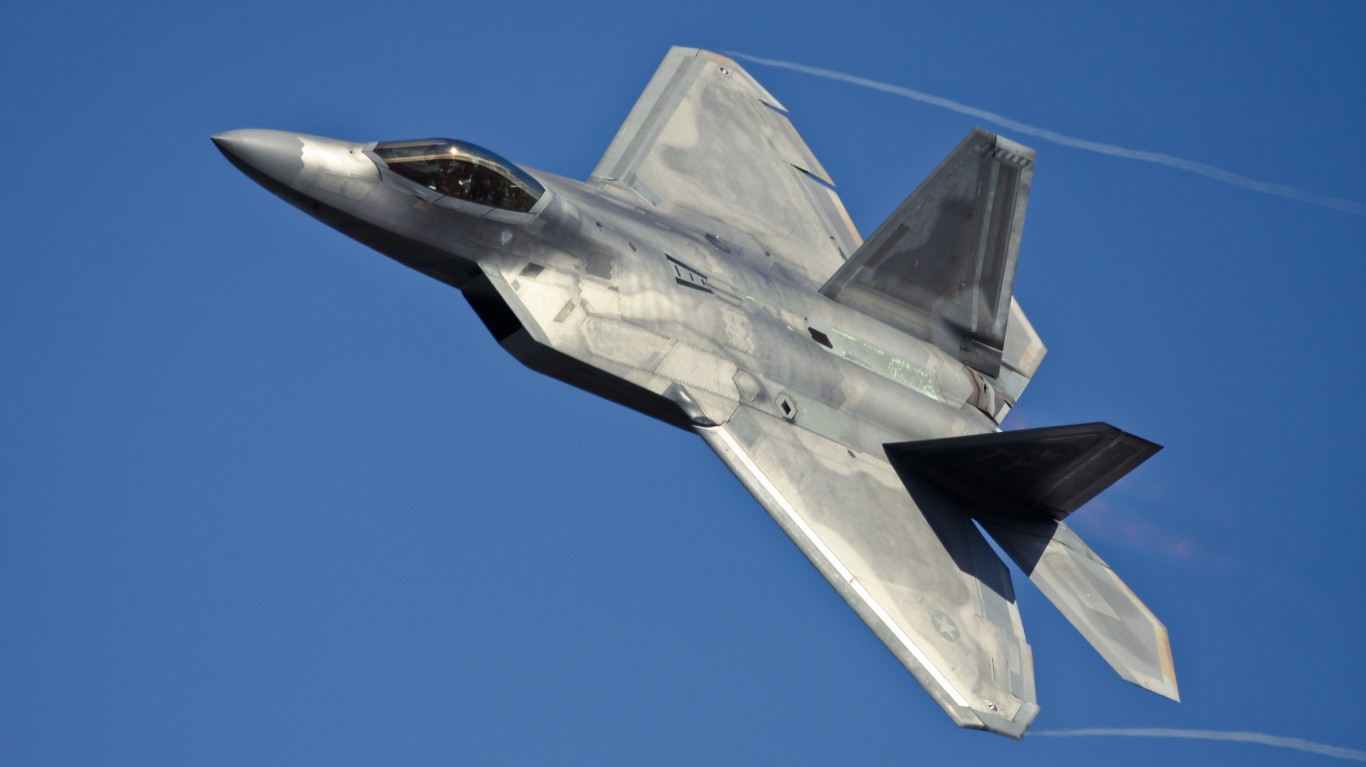
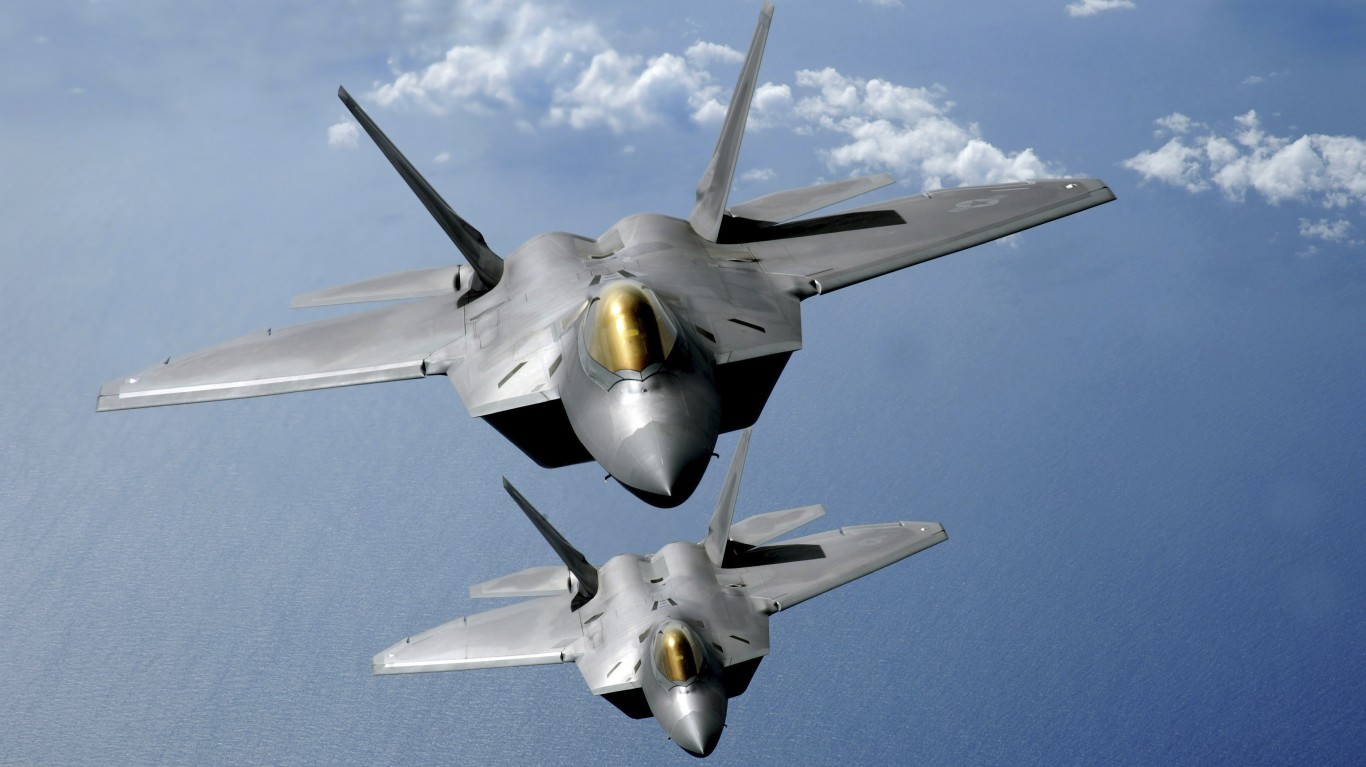
The world’s five largest defense contractors by 2021 arms sales are American companies. These contractors include Lockheed Martin, maker of the fifth generation F-35 fighter jet, and Northrop Grumman, the company behind the newly unveiled B-21 Raider stealth bomber. Each of these weapons systems has a nine-figure price tag.
All told, 12 of the 25 largest defense contractors are headquartered in the United States, seven are in China, and the rest are in Europe and the United Kingdom. (Here is a look at the countries with the most military firepower.)
None of the companies on this list trade exclusively in arms and military services. Boeing, for example, manufactures a range of weapons systems, including the V-22 Osprey, a plane capable of vertical takeoff and landing. But nearly half of its 2021 revenue came from other divisions, such as commercial aircraft.
Click here to see the companies profiting most from war.
Click here to read our detailed methodology.

25. Amentum
> Arms sales; 2021: $5.0 billion* (approx. 78% of annual company revenue)
> 1-yr. change in arms sales (inflation adj.): +3.3%
> Company headquartered in: United States
> *Note: The arms sales figure for this company is an estimate with a high degree of uncertainty. Amentum is a spinoff of AECOM’s Management Services segment. It also bought Dyncorp International in November 2020. Amentum’s arms sales figure for 2020 is pro forma, i.e. it is the combined 2020 arms sales of AECOM and Dyncorp International.

24. Safran
> Arms sales; 2021: $5.0 billion (approx. 28% of annual company revenue)
> 1-yr. change in arms sales (inflation adj.): +5.9%
> Company headquartered in: France
23. Honeywell International
> Arms sales; 2021: $5.2 billion (approx. 15% of annual company revenue)
> 1-yr. change in arms sales (inflation adj.): -14.7%
> Company headquartered in: United States

22. Booz Allen Hamilton
> Arms sales; 2021: $5.6 billion (approx. 67% of annual company revenue)
> 1-yr. change in arms sales (inflation adj.): -2.4%
> Company headquartered in: United States

21. Peraton
> Arms sales; 2021: $5.8 billion* (approx. 83% of annual company revenue)
> 1-yr. change in arms sales (inflation adj.): +0.02%
> Company headquartered in: United States
> *Note: The arms sales figure for this company is an estimate with a high degree of uncertainty. Peraton acquired Perspecta and Northrop Grumman’s integrated mission support and IT solutions business in 2021. Its arms sales figure for 2020 is pro forma, i.e. it is the combined 2020 arms sales of Peraton, Perspecta and Northrup Grumman’s integrated mission support and IT solutions business.

20. CSGC
> Arms sales; 2021: $5.9 billion (approx. 13% of annual company revenue)
> 1-yr. change in arms sales (inflation adj.): +1.5%
> Company headquartered in: China
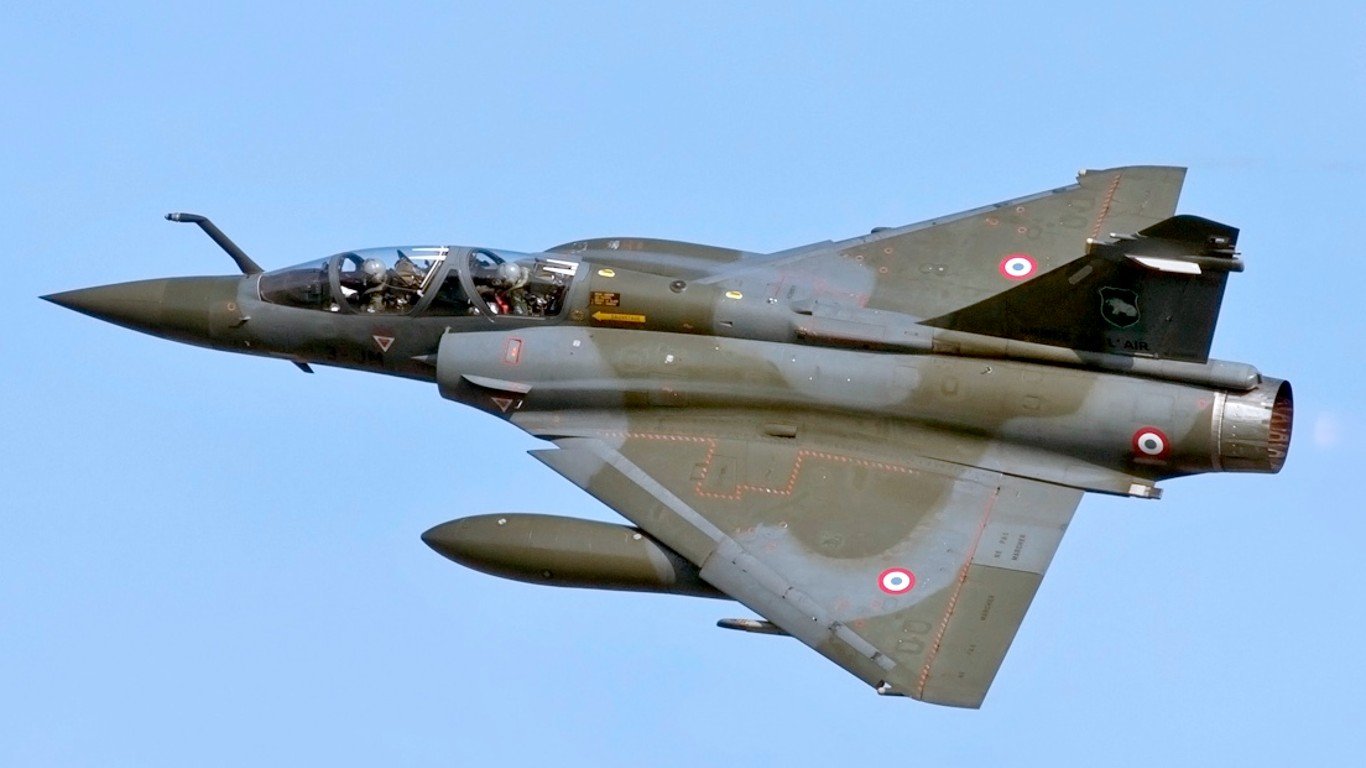
19. Dassault Aviation Group
> Arms sales; 2021: $6.3 billion (approx. 73% of annual company revenue)
> 1-yr. change in arms sales (inflation adj.): +58.9%
> Company headquartered in: France
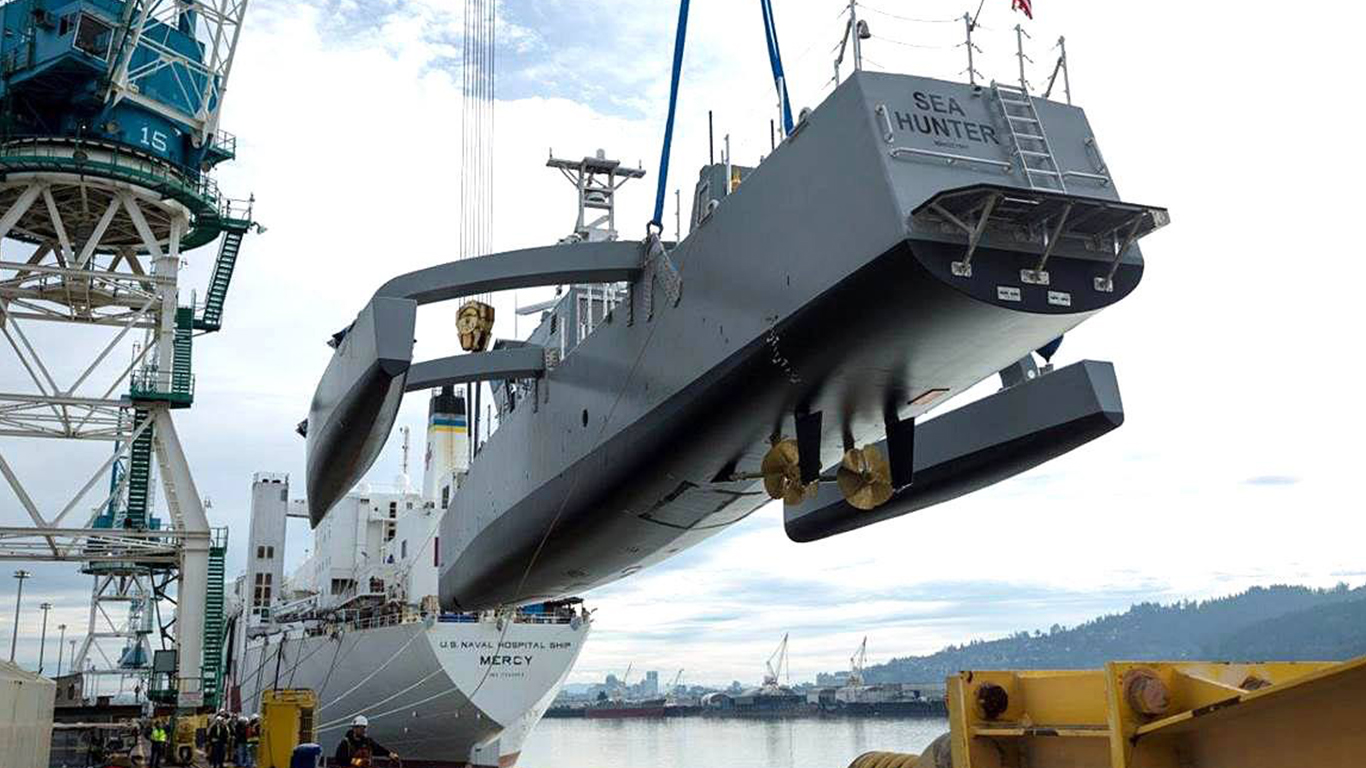
18. Leidos
> Arms sales; 2021: $8.0 billion (approx. 58% of annual company revenue)
> 1-yr. change in arms sales (inflation adj.): +4.9%
> Company headquartered in: United States
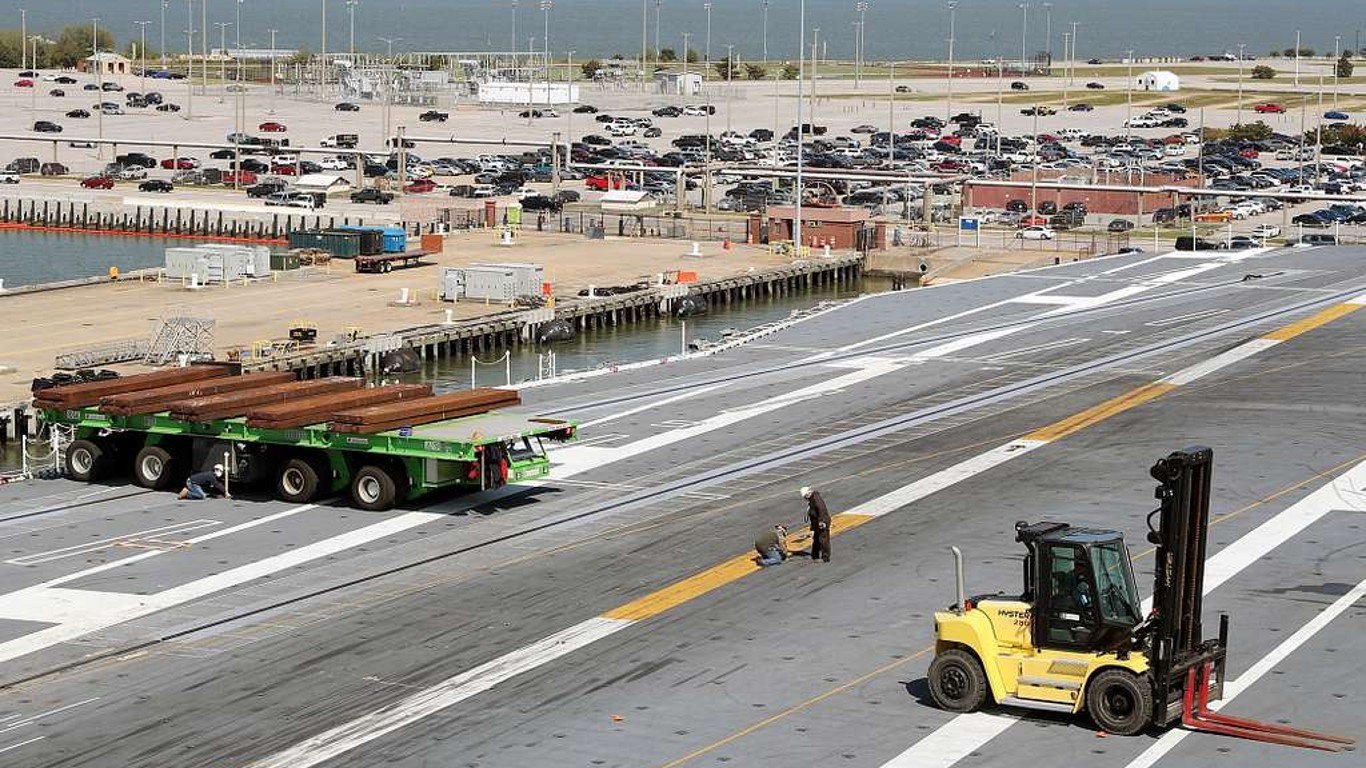
17. Huntington Ingalls Industries
> Arms sales; 2021: $8.6 billion* (approx. 90% of annual company revenue)
> 1-yr. change in arms sales (inflation adj.): -0.3%
> Company headquartered in: United States
> *Note: Huntington Ingalls Industries was renamed HII in 2022.
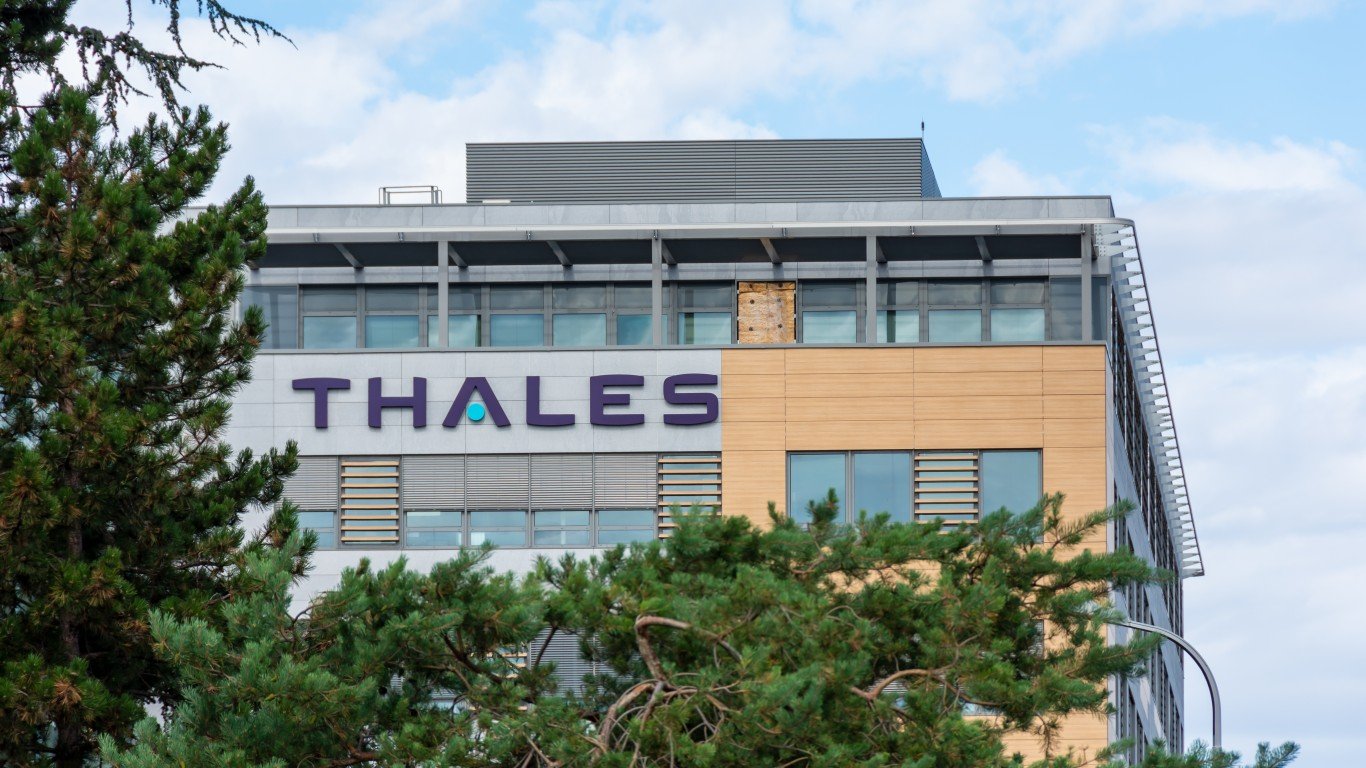
16. Thales
> Arms sales; 2021: $9.8 billion (approx. 51% of annual company revenue)
> 1-yr. change in arms sales (inflation adj.): +2.1%
> Company headquartered in: France

15. Airbus
> Arms sales; 2021: $10.9 billion (approx. 18% of annual company revenue)
> 1-yr. change in arms sales (inflation adj.): -14.8%
> Company headquartered in: Trans-European

14. CSSC
> Arms sales; 2021: $11.1 billion* (approx. 21% of annual company revenue)
> 1-yr. change in arms sales (inflation adj.): +9.3%
> Company headquartered in: China
> *Note: The arms sales figure for this company is an estimate with a high degree of uncertainty.

13. L3Harris Technologies
> Arms sales; 2021: $13.4 billion (approx. 75% of annual company revenue)
> 1-yr. change in arms sales (inflation adj.): -9.7%
> Company headquartered in: United States
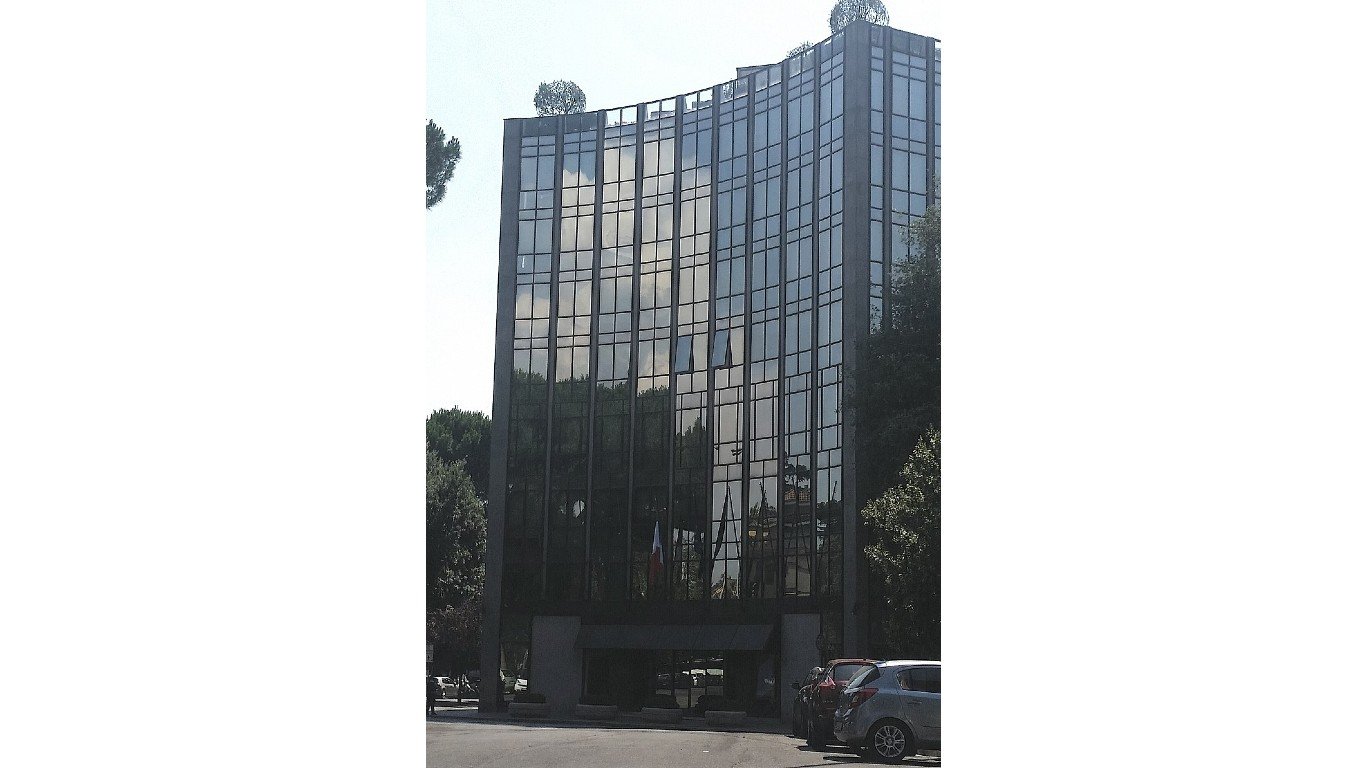
12. Leonardo
> Arms sales; 2021: $13.9 billion (approx. 83% of annual company revenue)
> 1-yr. change in arms sales (inflation adj.): +17.5%
> Company headquartered in: Italy
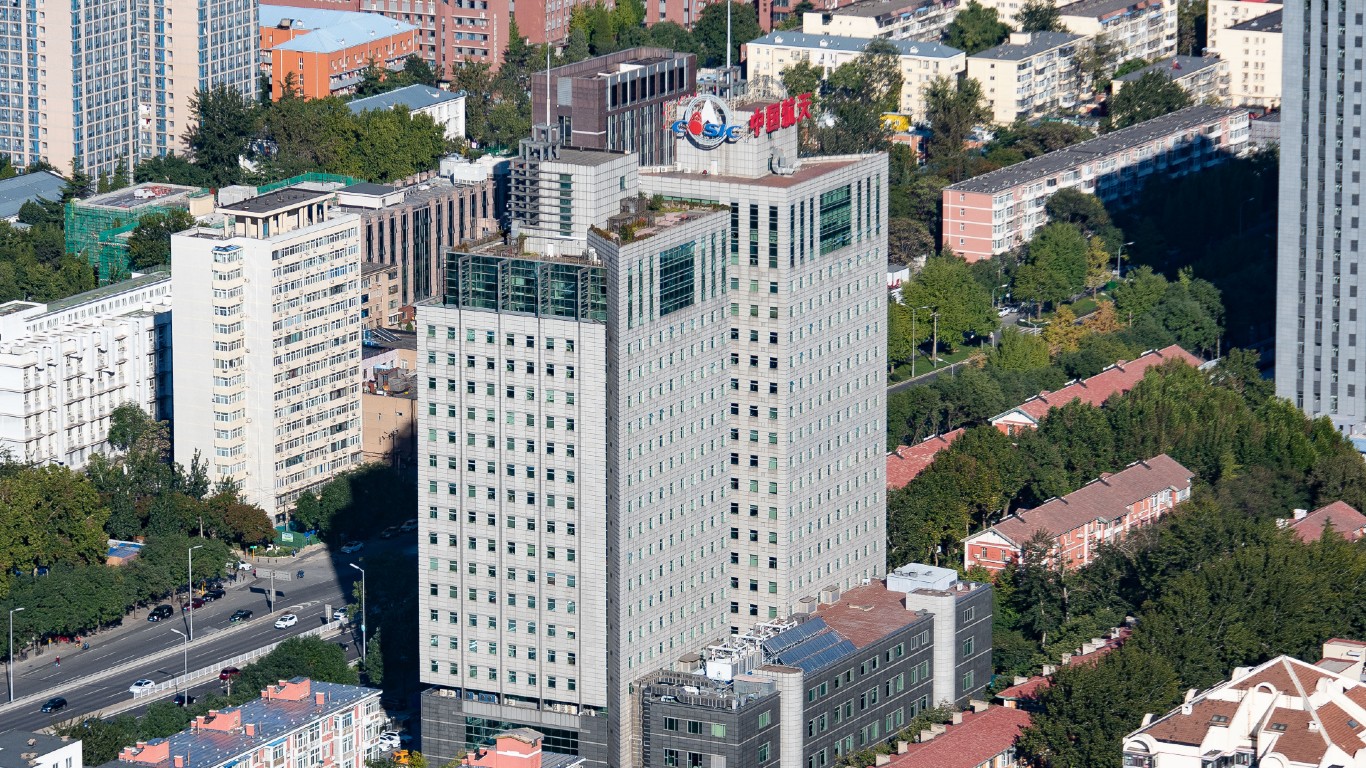
11. CASIC
> Arms sales; 2021: $14.5 billion* (approx. 31% of annual company revenue)
> 1-yr. change in arms sales (inflation adj.): +12.6%
> Company headquartered in: China
> *Note: The arms sales figure for this company is an estimate with a high degree of uncertainty.

10. CETC
> Arms sales; 2021: $15.0 billion* (approx. 27% of annual company revenue)
> 1-yr. change in arms sales (inflation adj.): -5.6%
> Company headquartered in: China
> *Note: The arms sales figure for this company is an estimate with a high degree of uncertainty.
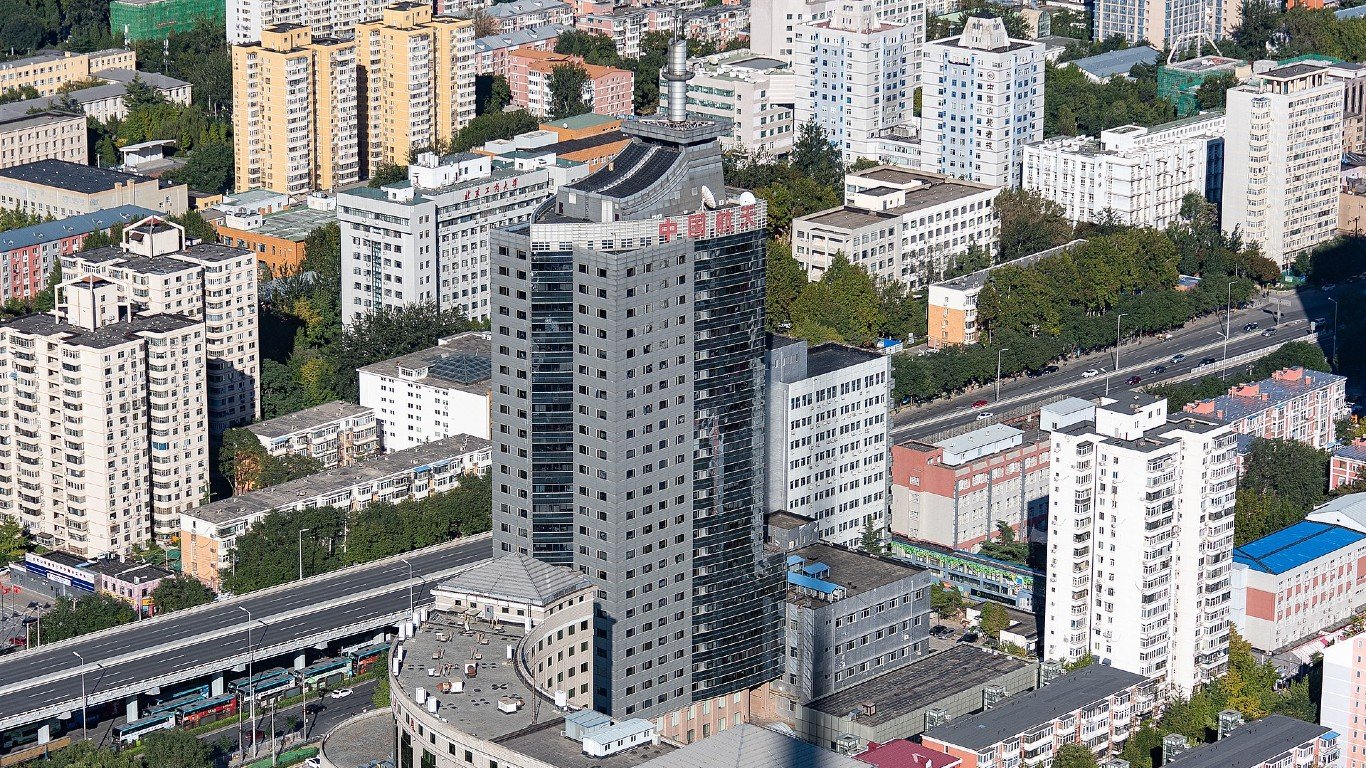
9. CASC
> Arms sales; 2021: $19.1 billion* (approx. 44% of annual company revenue)
> 1-yr. change in arms sales (inflation adj.): +4.2%
> Company headquartered in: China
> *Note: The arms sales figure for this company is an estimate with a high degree of uncertainty.

8. AVIC
> Arms sales; 2021: $20.1 billion (approx. 25% of annual company revenue)
> 1-yr. change in arms sales (inflation adj.): +9.0%
> Company headquartered in: China
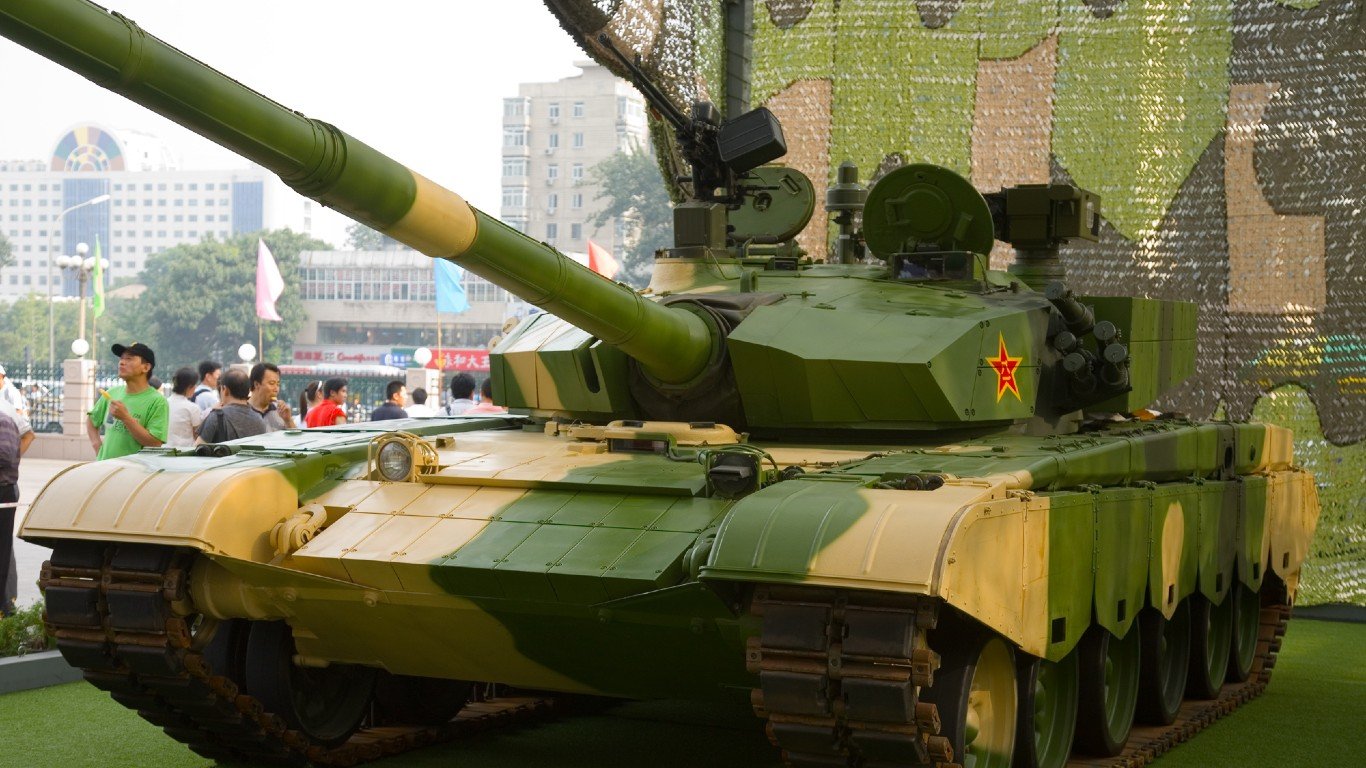
7. NORINCO
> Arms sales; 2021: $21.6 billion (approx. 26% of annual company revenue)
> 1-yr. change in arms sales (inflation adj.): +10.7%
> Company headquartered in: China
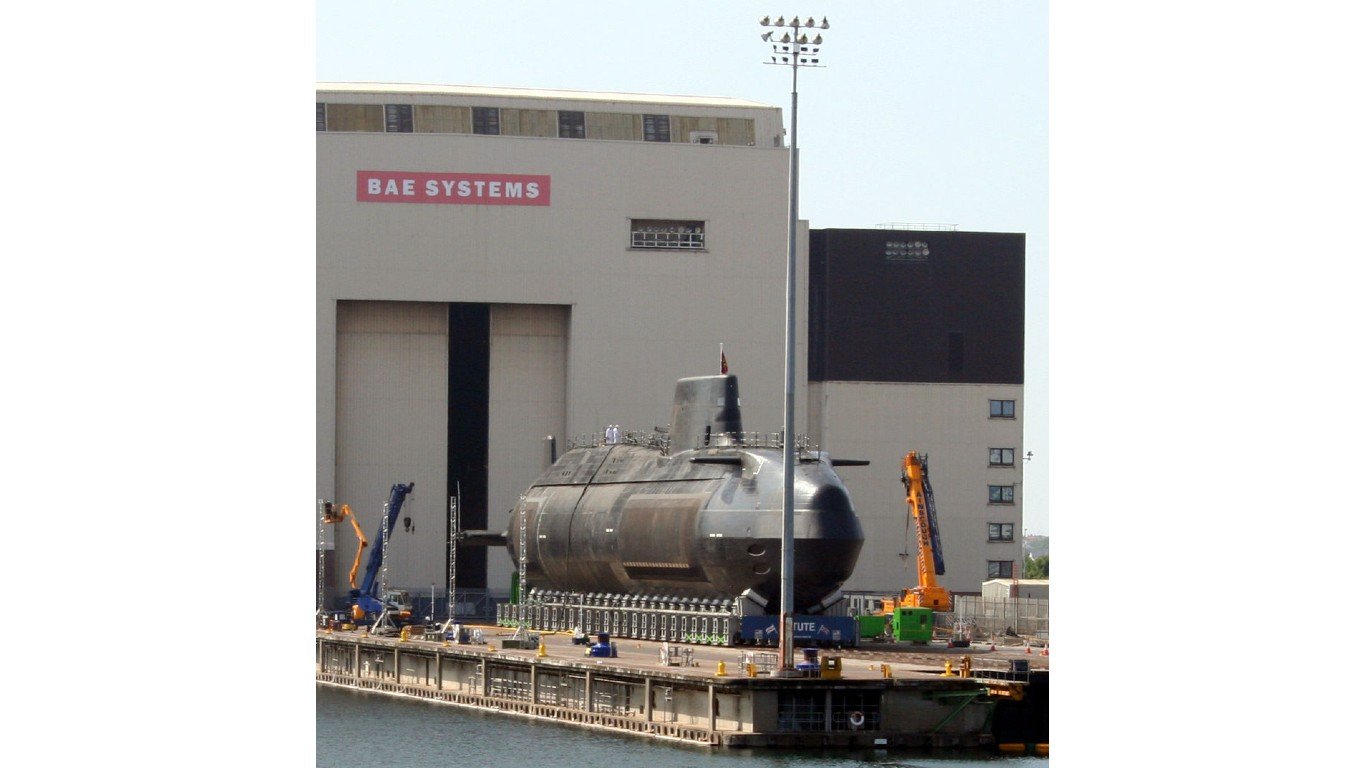
6. BAE Systems
> Arms sales; 2021: $26.0 billion (approx. 97% of annual company revenue)
> 1-yr. change in arms sales (inflation adj.): -1.0%
> Company headquartered in: United Kingdom
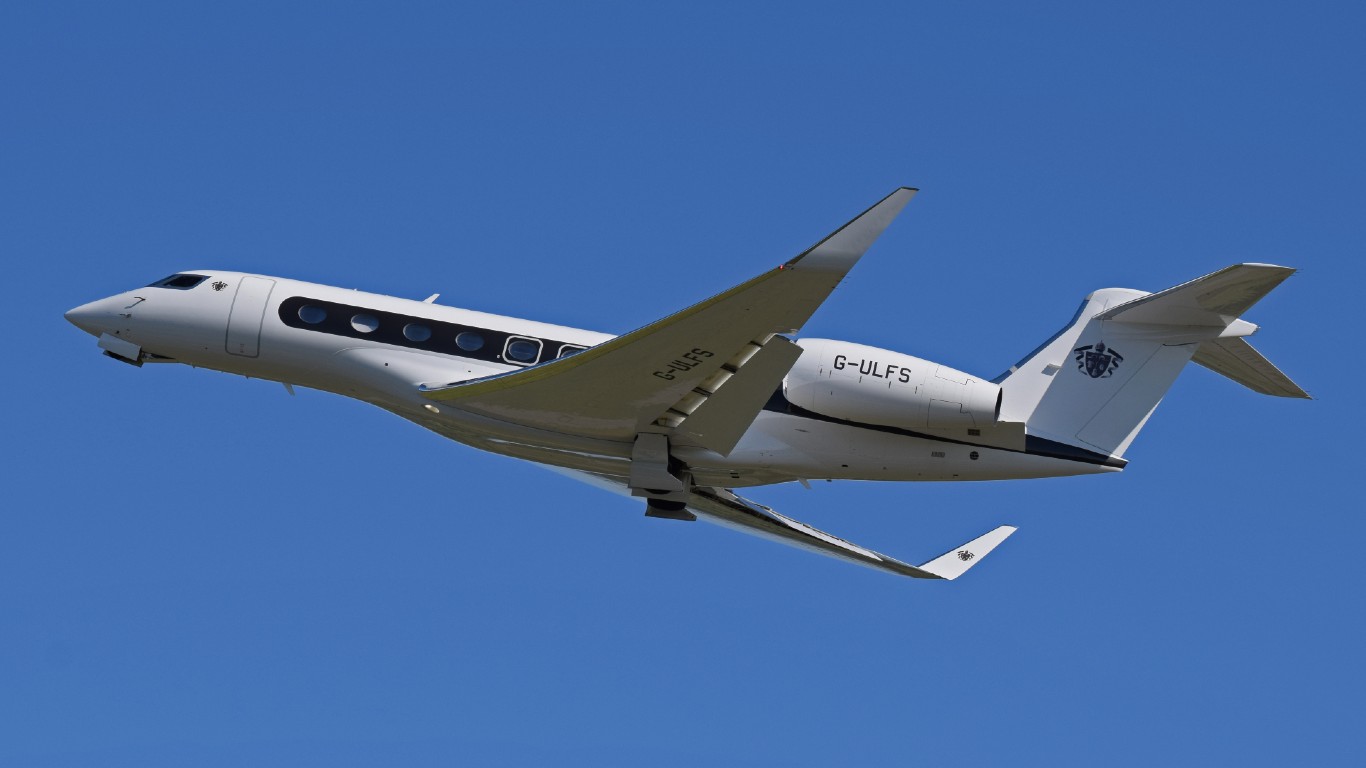
5. General Dynamics Corp.
> Arms sales; 2021: $26.4 billion (approx. 69% of annual company revenue)
> 1-yr. change in arms sales (inflation adj.): -2.1%
> Company headquartered in: United States

4. Northrop Grumman Corp.
> Arms sales; 2021: $29.9 billion (approx. 84% of annual company revenue)
> 1-yr. change in arms sales (inflation adj.): -5.8%
> Company headquartered in: United States
3. Boeing
> Arms sales; 2021: $33.4 billion (approx. 54% of annual company revenue)
> 1-yr. change in arms sales (inflation adj.): -2.1%
> Company headquartered in: United States
2. Raytheon Technologies
> Arms sales; 2021: $41.9 billion (approx. 65% of annual company revenue)
> 1-yr. change in arms sales (inflation adj.): +9.1%
> Company headquartered in: United States
1. Lockheed Martin Corp.
> Arms sales; 2021: $60.3 billion (approx. 90% of annual company revenue)
> 1-yr. change in arms sales (inflation adj.): -0.6%
> Company headquartered in: United States
Methodology
To identify the companies profiting most from war, 24/7 Wall St. reviewed data from the Stockholm International Peace Research Institute. Companies are ranked based on SIPRI’s estimates of arms and military services sales in 2021.
Year-over-year change in revenue from arms sales are also from SIPRI and use 2020 sales figures adjusted for inflation to be comparable to the current year. Notes, including those identifying companies for which arms sales data is uncertain, are from SIPRI.
Contact [email protected] for any questions or corrections.
Sam Stebbins is a writer at 247WallSt.com where his primary focus is on government policy, politics, companies, and broad social and economic trends. Sam has been writing in the money and news verticals for over 8 years and holds a bachelor's degree from Hobart College, which he earned in 2010. Sam resides in upstate New York and enjoys hiking, biking, canoeing, and skiing in the Adirondack Mountains and across the Northeast.