With over 72 million people, millennials – generally defined as those born between 1981 and 1996 – are the largest generation in U.S. history. Now all working age and well into adulthood, the life decisions millennials make are driving key economic and demographic trends in the United States.
Millennials have been slower to start their own households and are more likely to live longer with their parents than members of previous generations. According to a Pew Research Center survey, 15% of millennials were living in their parents’ home in 2018, compared to less than 10% of the Silent Generation, baby boomers, and Gen-Xers in comparable eras. Millennials are also far less likely to move than young adults of previous generations.
Hit hard by the Great Recession, housing trends within the millennial generation are partially the result of financial insecurity, as millennials may be the first generation in American history to earn less in aggregate than their parents did. For the small minority of millennials who do move each year, however, some U.S. cities are far more preferable than others.
Using data from the U.S. Census Bureau’s American Community Survey, 24/7 Wall St. identified the major cities millennials are moving to the most. We ranked all U.S. metro areas with populations of at least 250,000 on the change in residents between the ages of 25 and 39 from 2019 to 2022.
The majority of metro areas on this list — 16 of 25 — are in the South, compared to four in the West, three in the Northeast, and only two in the Midwest. Among these places, the share of 25 to 39 year olds increased by anywhere from 6.6% to 14.3% between 2019 and 2022. Supplemental unemployment data is from the Bureau of Labor Statistics.
Mostly absent from this list are large, so-called “superstar” cities that have historically drawn in large numbers of young, college-educated, and upwardly mobile professionals. Many of these cities, like Boston, Los Angeles, New York, and San Francisco, are expensive places to live and have reported a net-decline in their millennial population in recent years. Of the metro areas on this list, all but two are home to fewer than 1 million people. (These are America’s fastest growing big cities.)
In keeping with the financial concerns widespread among the millennial generation, the vast majority of these metro areas have a lower overall cost of living than the U.S. as whole. In just over half of the 25 cities on this list, the average cost of goods and services is at least 5% lower than it is nationwide, according to the latest estimates from the Bureau of Economic Analysis.
Lower living expenses in these places makes homeownership more affordable for new residents. In 17 of the 25 metro areas on this list, the homeownership rate among those who recently moved there exceeds the comparable national rate of 40.9%, according to one-year ACS estimates. (These are the counties with the least expensive housing markets in each state.)
Here are the major cities millennials are moving to the most.
25. Salisbury, MD-DE

- Increase in 25-39 year-olds, 2019 to 2022: +6.6%
- Total population change, 2019 to 2022: +5.6%
- Homeownership rate, moved 2021 or later: 56.2%
- Unemployment rate, 2022: 4.4%
- Total population: 439,031
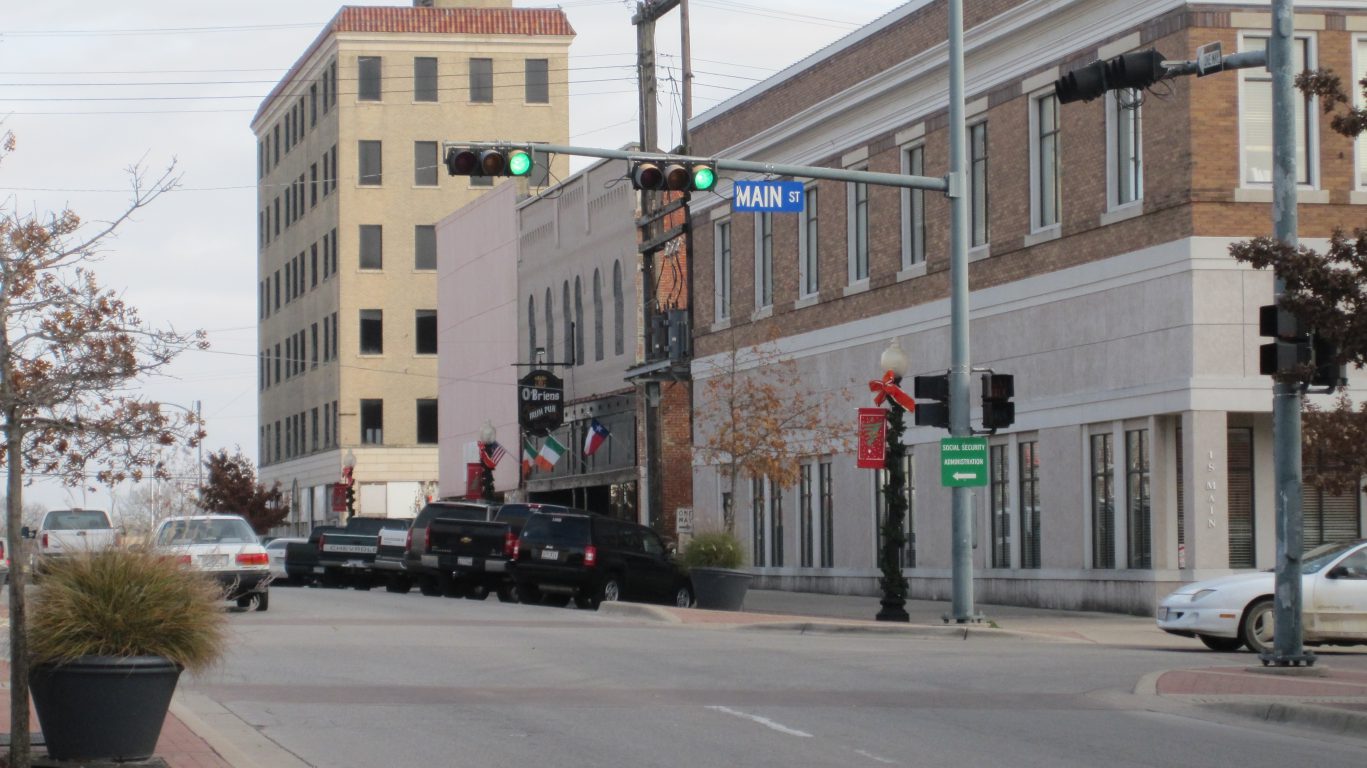
24. Longview, TX

- Increase in 25-39 year-olds, 2019 to 2022: +6.6%
- Total population change, 2019 to 2022: +1.6%
- Homeownership rate, moved 2021 or later: 45.0%
- Unemployment rate, 2022: 4.2%
- Total population: 291,219
23. Killeen-Temple, TX
- Increase in 25-39 year-olds, 2019 to 2022: +6.7%
- Total population change, 2019 to 2022: +7.6%
- Homeownership rate, moved 2021 or later: 35.9%
- Unemployment rate, 2022: 4.4%
- Total population: 496,228
22. Fort Wayne, IN

- Increase in 25-39 year-olds, 2019 to 2022: +6.7%
- Total population change, 2019 to 2022: +3.1%
- Homeownership rate, moved 2021 or later: 45.2%
- Unemployment rate, 2022: 2.8%
- Total population: 426,076
21. North Port-Sarasota-Bradenton, FL

- Increase in 25-39 year-olds, 2019 to 2022: +7.0%
- Total population change, 2019 to 2022: +6.5%
- Homeownership rate, moved 2021 or later: 57.0%
- Unemployment rate, 2022: 2.9%
- Total population: 891,411
20. Knoxville, TN
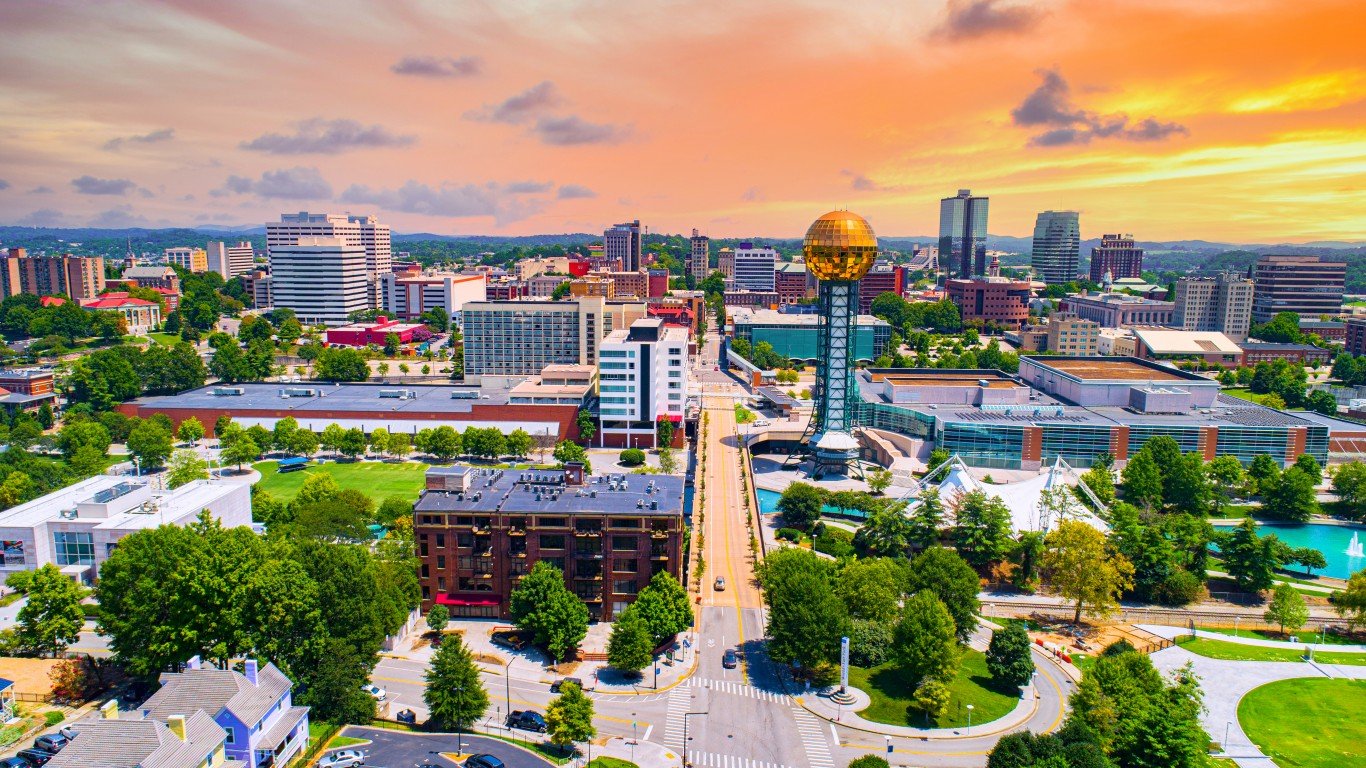
- Increase in 25-39 year-olds, 2019 to 2022: +7.2%
- Total population change, 2019 to 2022: +4.3%
- Homeownership rate, moved 2021 or later: 42.9%
- Unemployment rate, 2022: 3.1%
- Total population: 906,674
19. Kingsport-Bristol, TN-VA

- Increase in 25-39 year-olds, 2019 to 2022: +7.4%
- Total population change, 2019 to 2022: +0.9%
- Homeownership rate, moved 2021 or later: 48.7%
- Unemployment rate, 2022: 3.4%
- Total population: 310,483
18. Canton-Massillon, OH

- Increase in 25-39 year-olds, 2019 to 2022: +7.6%
- Total population change, 2019 to 2022: +0.5%
- Homeownership rate, moved 2021 or later: 43.9%
- Unemployment rate, 2022: 4.0%
- Total population: 399,316
17. Reno, NV
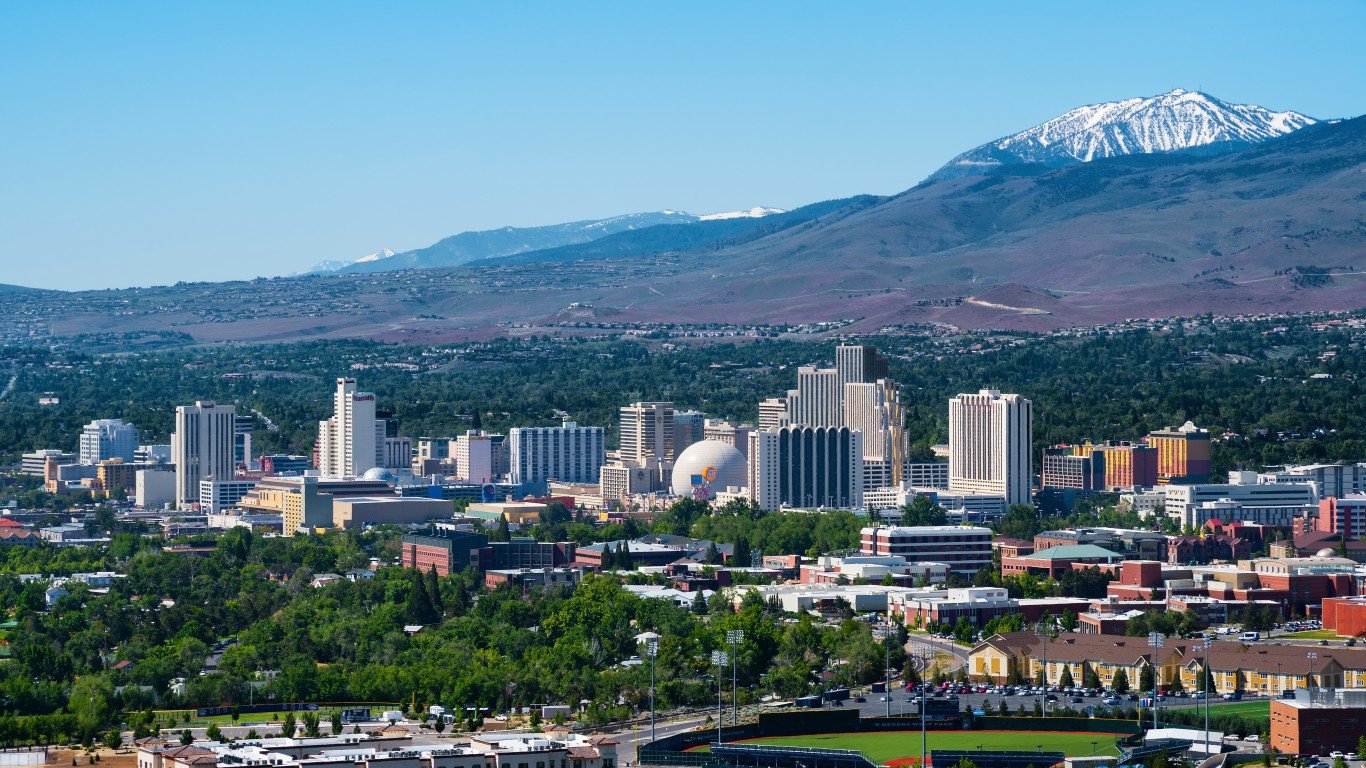
- Increase in 25-39 year-olds, 2019 to 2022: +7.8%
- Total population change, 2019 to 2022: +5.5%
- Homeownership rate, moved 2021 or later: 37.1%
- Unemployment rate, 2022: 3.5%
- Total population: 501,206
16. Portland-South Portland, ME

- Increase in 25-39 year-olds, 2019 to 2022: +8.0%
- Total population change, 2019 to 2022: +4.3%
- Homeownership rate, moved 2021 or later: 49.4%
- Unemployment rate, 2022: 2.5%
- Total population: 561,576
15. Montgomery, AL

- Increase in 25-39 year-olds, 2019 to 2022: +8.4%
- Total population change, 2019 to 2022: +4.1%
- Homeownership rate, moved 2021 or later: 40.3%
- Unemployment rate, 2022: 2.8%
- Total population: 388,243
14. Raleigh-Cary, NC

- Increase in 25-39 year-olds, 2019 to 2022: +8.4%
- Total population change, 2019 to 2022: +6.7%
- Homeownership rate, moved 2021 or later: 37.4%
- Unemployment rate, 2022: 3.1%
- Total population: 1,484,338
13. Austin-Round Rock-Georgetown, TX

- Increase in 25-39 year-olds, 2019 to 2022: +8.7%
- Total population change, 2019 to 2022: +8.7%
- Homeownership rate, moved 2021 or later: 29.3%
- Unemployment rate, 2022: 2.9%
- Total population: 2,421,115
12. Deltona-Daytona Beach-Ormond Beach, FL
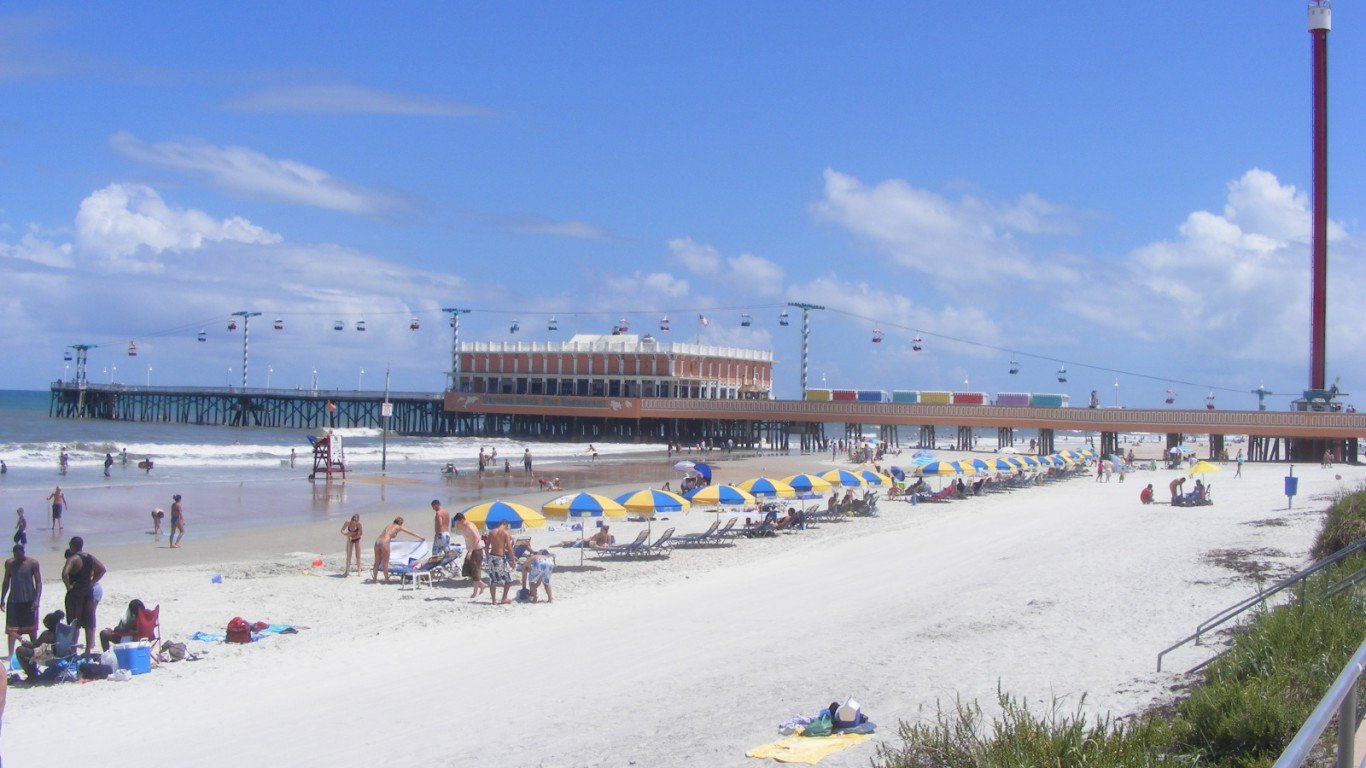
- Increase in 25-39 year-olds, 2019 to 2022: +9.2%
- Total population change, 2019 to 2022: +5.6%
- Homeownership rate, moved 2021 or later: 57.4%
- Unemployment rate, 2022: 3.2%
- Total population: 705,897
11. Salem, OR
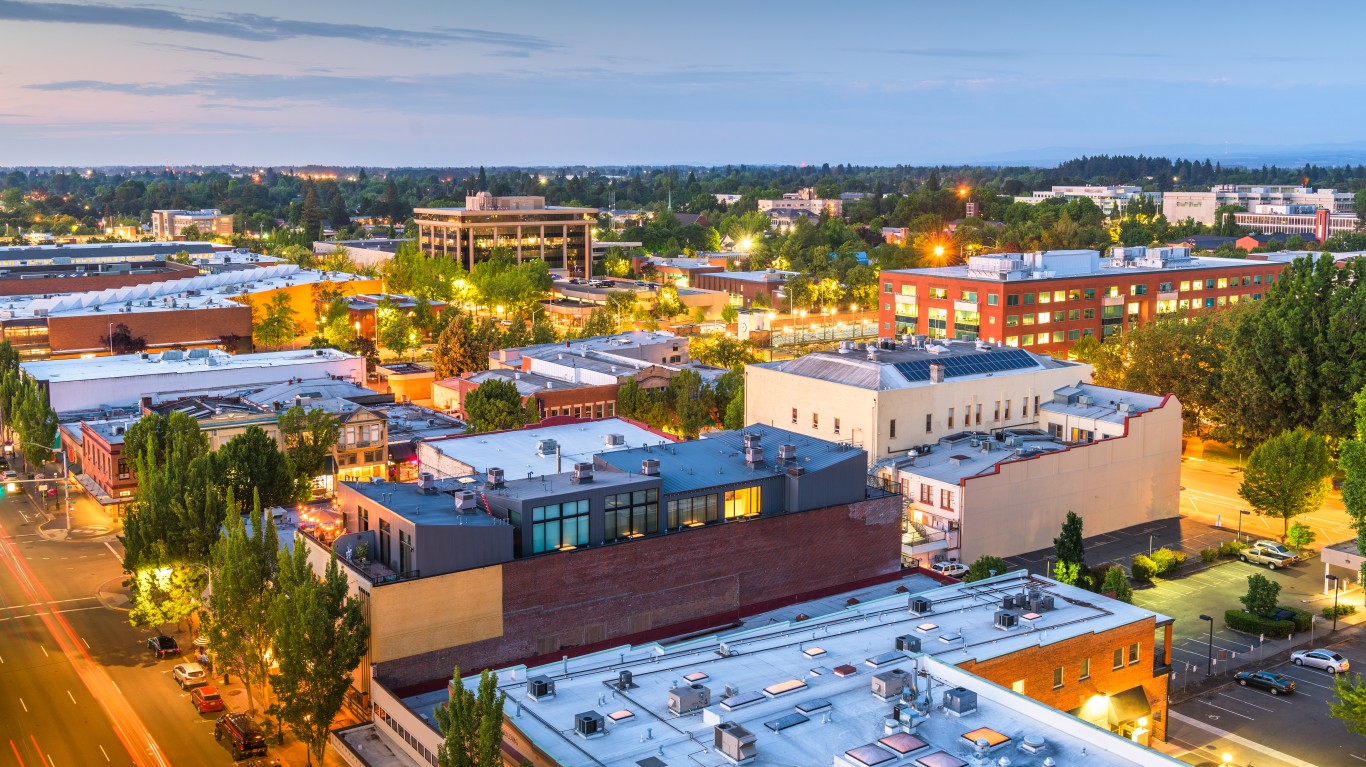
- Increase in 25-39 year-olds, 2019 to 2022: +9.3%
- Total population change, 2019 to 2022: +0.6%
- Homeownership rate, moved 2021 or later: 49.0%
- Unemployment rate, 2022: 4.3%
- Total population: 436,317
10. Wilmington, NC

- Increase in 25-39 year-olds, 2019 to 2022: +10.4%
- Total population change, 2019 to 2022: +1.1%
- Homeownership rate, moved 2021 or later: 41.3%
- Unemployment rate, 2022: 3.3%
- Total population: 300,658
9. Clarksville, TN-KY
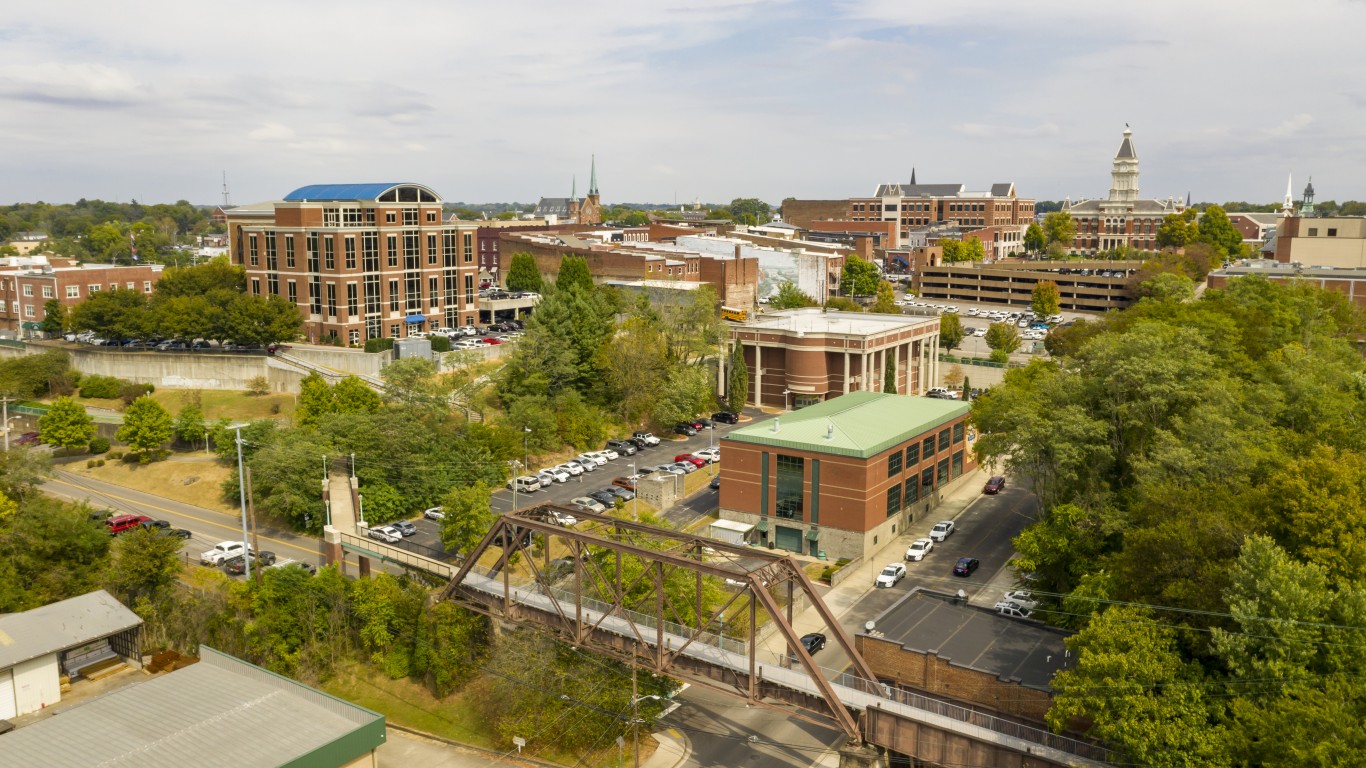
- Increase in 25-39 year-olds, 2019 to 2022: +10.6%
- Total population change, 2019 to 2022: +8.2%
- Homeownership rate, moved 2021 or later: 38.8%
- Unemployment rate, 2022: 4.0%
- Total population: 336,447
8. Harrisburg-Carlisle, PA

- Increase in 25-39 year-olds, 2019 to 2022: +10.7%
- Total population change, 2019 to 2022: +4.4%
- Homeownership rate, moved 2021 or later: 45.4%
- Unemployment rate, 2022: 3.7%
- Total population: 603,493
7. Manchester-Nashua, NH

- Increase in 25-39 year-olds, 2019 to 2022: +10.7%
- Total population change, 2019 to 2022: +2.3%
- Homeownership rate, moved 2021 or later: 48.7%
- Unemployment rate, 2022: 2.4%
- Total population: 426,594
6. Fayetteville-Springdale-Rogers, AR

- Increase in 25-39 year-olds, 2019 to 2022: +10.9%
- Total population change, 2019 to 2022: +7.6%
- Homeownership rate, moved 2021 or later: 43.2%
- Unemployment rate, 2022: 2.4%
- Total population: 576,724
5. Greeley, CO
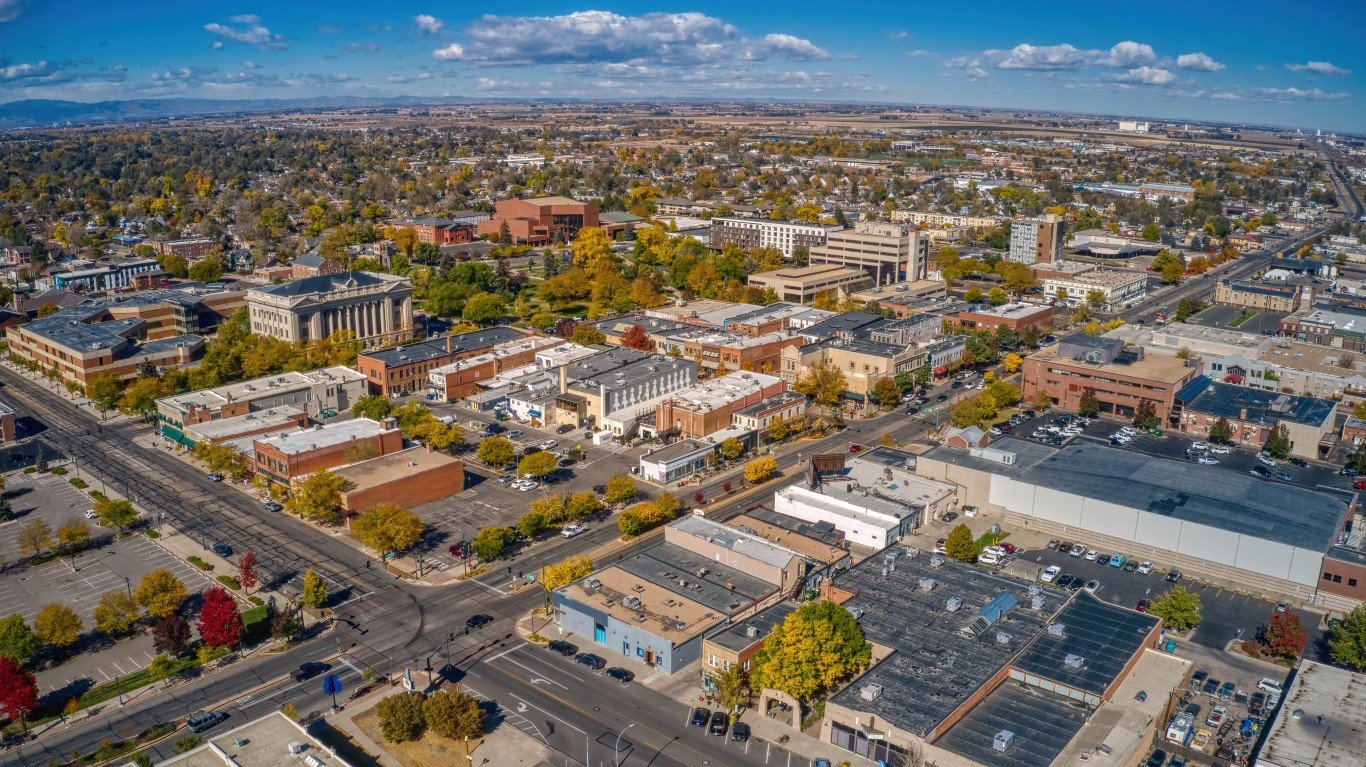
- Increase in 25-39 year-olds, 2019 to 2022: +11.5%
- Total population change, 2019 to 2022: +7.9%
- Homeownership rate, moved 2021 or later: 59.6%
- Unemployment rate, 2022: 3.2%
- Total population: 350,176
4. Waco, TX
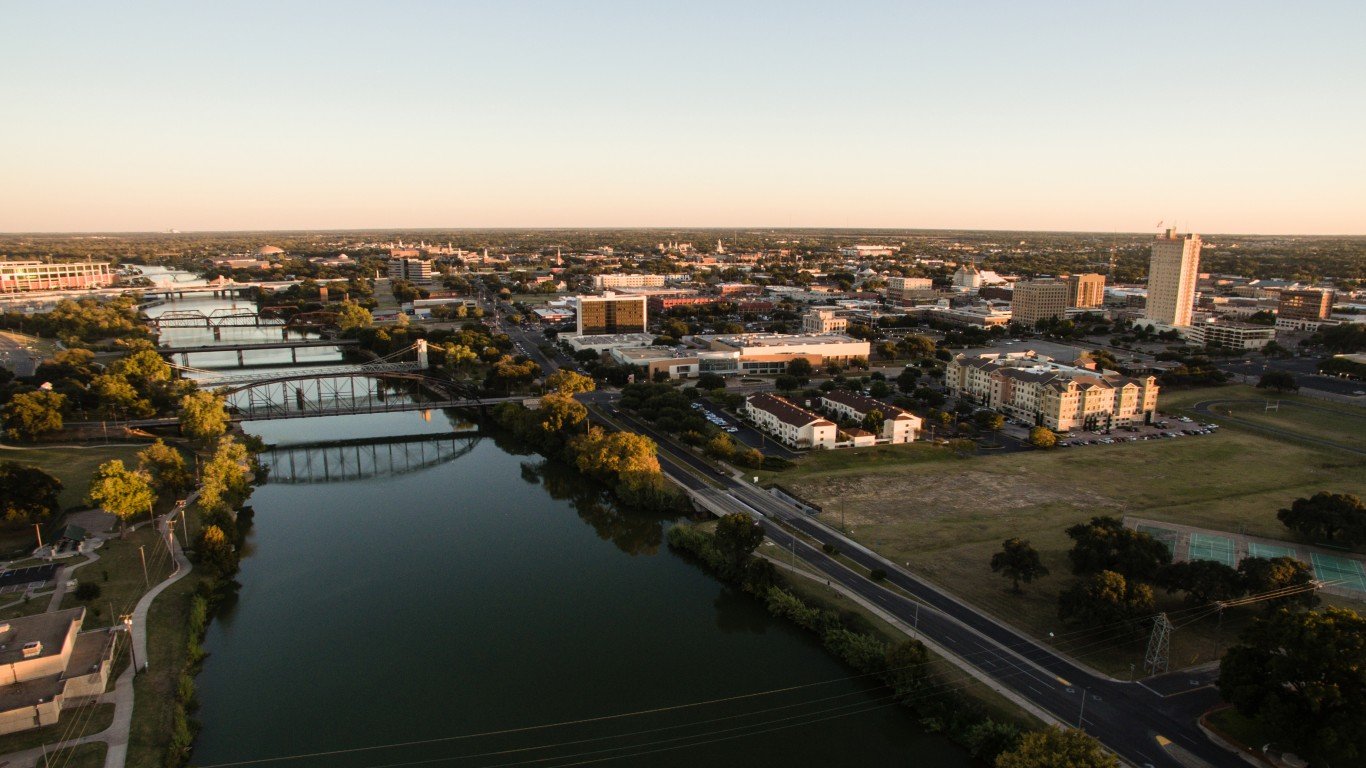
- Increase in 25-39 year-olds, 2019 to 2022: +11.8%
- Total population change, 2019 to 2022: +4.4%
- Homeownership rate, moved 2021 or later: 32.8%
- Unemployment rate, 2022: 3.6%
- Total population: 282,813
3. Lakeland-Winter Haven, FL
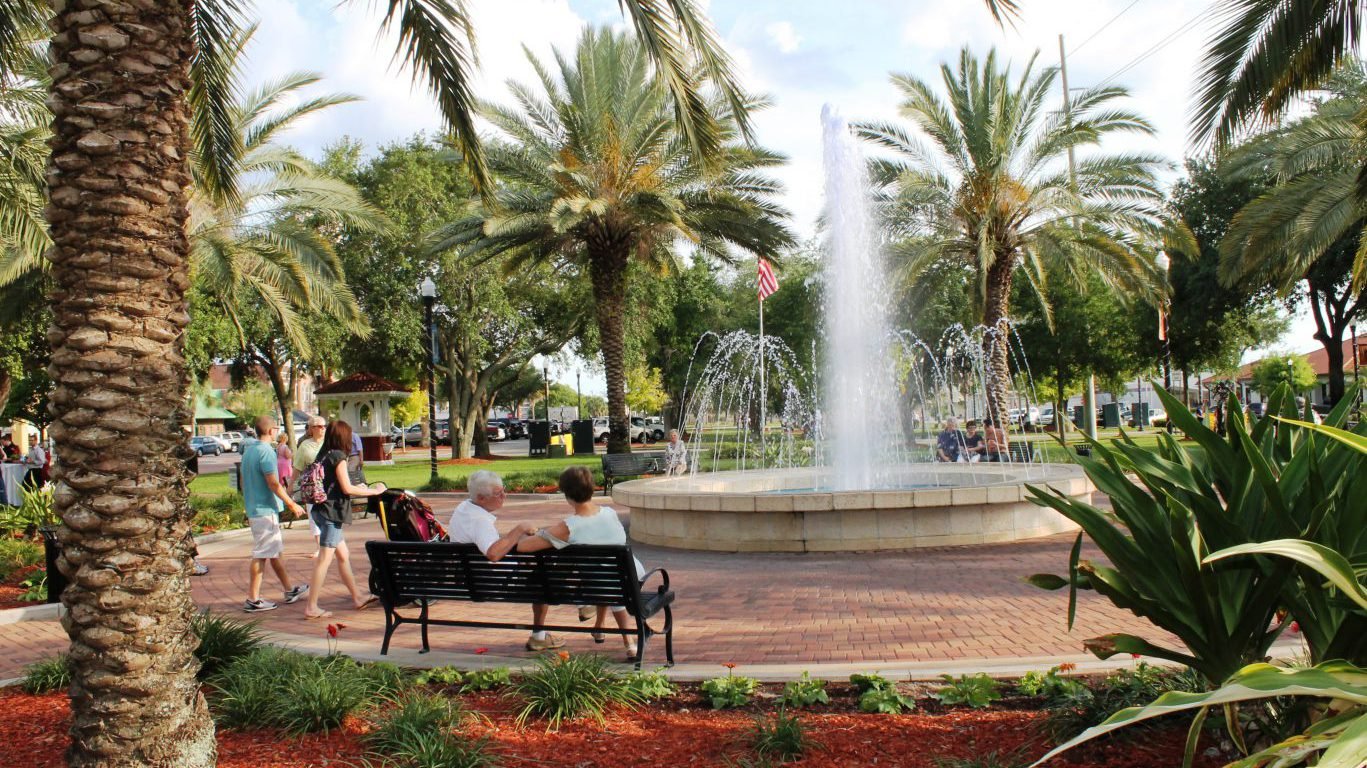
- Increase in 25-39 year-olds, 2019 to 2022: +12.2%
- Total population change, 2019 to 2022: +8.6%
- Homeownership rate, moved 2021 or later: 55.3%
- Unemployment rate, 2022: 3.5%
- Total population: 787,404
2. Provo-Orem, UT

- Increase in 25-39 year-olds, 2019 to 2022: +13.6%
- Total population change, 2019 to 2022: +10.0%
- Homeownership rate, moved 2021 or later: 40.5%
- Unemployment rate, 2022: 2.1%
- Total population: 714,454
1. Spartanburg, SC
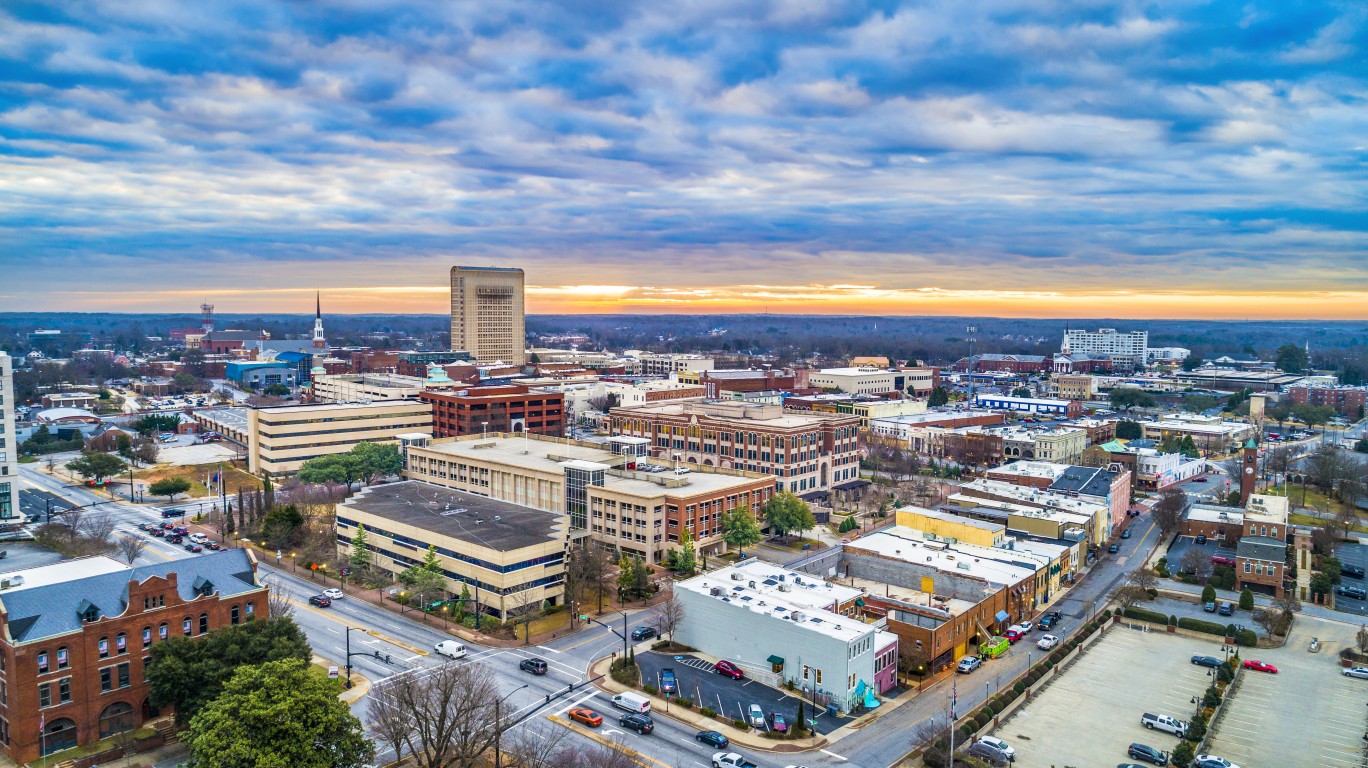
- Increase in 25-39 year-olds, 2019 to 2022: +14.3%
- Total population change, 2019 to 2022: +8.1%
- Homeownership rate, moved 2021 or later: 52.5%
- Unemployment rate, 2022: 3.3%
- Total population: 345,831
Contact [email protected] for any questions or corrections.