
Illegal immigration is a long-standing problem in the United States. Despite the efforts of multiple presidential administrations, Congress has yet to pass comprehensive immigration reform legislation. Now, after decades of inaction, the rate of illegal border crossings has hit new highs. (Here is a look at the most partisan issues in American politics.)
U.S. Customs and Border Protection reported encounters with 3.2 million migrants in the country illegally in the 2023 fiscal year, up nearly 400% from fiscal 2020 — and the problem only appears to be getting worse. With over 613,000 encounters reported in the first two months of fiscal 2024, the rate of illegal migrant apprehensions and expulsions is on pace to climb another 16% year over year.
While the vast majority of migrants who enter the U.S. illegally do so through the southern border, every year, the CBP reports encounters with thousands of illegal immigrants in cities across the country.
Using data from the U.S. CBP, 24/7 Wall St. identified the U.S. cities with the most illegal immigrants. We ranked all 19 U.S. cities with CBP field offices on the number of encounters between CBP agents and foreign nationals who entered the U.S. illegally between fiscal 2020 and the first two months of fiscal 2024 (Oct. 1, 2019 through Nov. 30, 2023). Encounters include both expulsions and identification of inadmissible persons under Title 8 and Title 42.
The cities with CBP field offices are spread across the U.S., spanning 13 states, including California and Texas, which are each home to three. They are generally large cities, as all but two have populations of over 300,000. The two smallest cities on this list — Buffalo, New York, and Laredo, Texas — are each located on or near the border of Canada and Mexico, the only two countries that neighbor the United States. Among them, the number of illegal migrants encountered by CBP since fiscal 2020 ranges from about 17,300 to over 380,000.
Several places on this list are so-called “sanctuary cities,” a designation that typically indicates local authorities do not fully cooperate with federal law enforcement seeking to deport illegal migrants. However, the term “sanctuary city” has no official legal meaning, and several sanctuary cities — including Boston, New York, and Seattle — rank highly on this list.
In keeping with the recent nationwide surge in illegal border crossings, of the last four full fiscal years, 2023 ranks as the year with most illegal immigrant encounters in all but two cities on this list. In over half of these cities, fiscal 2024 is so far on pace to surpass each of the previous four fiscal years. (Here is a look at the countries where at least half the population wants to move away.)
19. Portland, OR

- Illegal immigrant encounters, Oct. 2019 – Nov. 2023: 17,337
- Top origin country: Ukraine; 6,089 encounters (35.1% of all encounters reported by Portland Field Office)
- Second most common origin country: Philippines; 2,390 encounters (13.8% of all encounters reported by Portland Field Office)
- Third most common origin country: India; 1,470 encounters (8.5% of all encounters reported by Portland Field Office)
- Year with the most illegal immigrant encounters from FY 2020-2023: Fiscal 2023; 6,727 encounters (39% of total)
18. Detroit

- Illegal immigrant encounters, Oct. 2019 – Nov. 2023: 33,754
- Top origin country: Canada; 12,900 encounters (38.2% of all encounters reported by Detroit Field Office)
- Second most common origin country: India; 4,063 encounters (12.0% of all encounters reported by Detroit Field Office)
- Third most common origin country: Ukraine; 3,983 encounters (11.8% of all encounters reported by Detroit Field Office)
- Year with the most illegal immigrant encounters from FY 2020-2023: Fiscal 2023; 14,937 encounters (44% of total)
17. Tampa, FL

- Illegal immigrant encounters, Oct. 2019 – Nov. 2023: 40,133
- Top origin country: Venezuela; 7,851 encounters (19.6% of all encounters reported by Tampa Field Office)
- Second most common origin country: Cuba; 5,580 encounters (13.9% of all encounters reported by Tampa Field Office)
- Third most common origin country: Philippines; 4,379 encounters (10.9% of all encounters reported by Tampa Field Office)
- Year with the most illegal immigrant encounters from FY 2020-2023: Fiscal 2023; 22,541 encounters (56% of total)
16. Baltimore

- Illegal immigrant encounters, Oct. 2019 – Nov. 2023: 52,703
- Top origin country: Philippines; 14,990 encounters (28.4% of all encounters reported by Baltimore Field Office)
- Second most common origin country: Ukraine; 8,916 encounters (16.9% of all encounters reported by Baltimore Field Office)
- Third most common origin country: Russia; 5,094 encounters (9.7% of all encounters reported by Baltimore Field Office)
- Year with the most illegal immigrant encounters from FY 2020-2023: Fiscal 2023; 18,911 encounters (36% of total)
15. Chicago

- Illegal immigrant encounters, Oct. 2019 – Nov. 2023: 56,064
- Top origin country: Ukraine; 37,162 encounters (66.3% of all encounters reported by Chicago Field Office)
- Second most common origin country: Mexico; 5,701 encounters (10.2% of all encounters reported by Chicago Field Office)
- Third most common origin country: India; 2,060 encounters (3.7% of all encounters reported by Chicago Field Office)
- Year with the most illegal immigrant encounters from FY 2020-2023: Fiscal 2023; 26,039 encounters (46% of total)
14. Atlanta

- Illegal immigrant encounters, Oct. 2019 – Nov. 2023: 57,852
- Top origin country: Philippines; 14,651 encounters (25.3% of all encounters reported by Atlanta Field Office)
- Second most common origin country: Ukraine; 11,161 encounters (19.3% of all encounters reported by Atlanta Field Office)
- Third most common origin country: China; 6,181 encounters (10.7% of all encounters reported by Atlanta Field Office)
- Year with the most illegal immigrant encounters from FY 2020-2023: Fiscal 2022; 15,651 encounters (27% of total)
13. Tucson, AZ
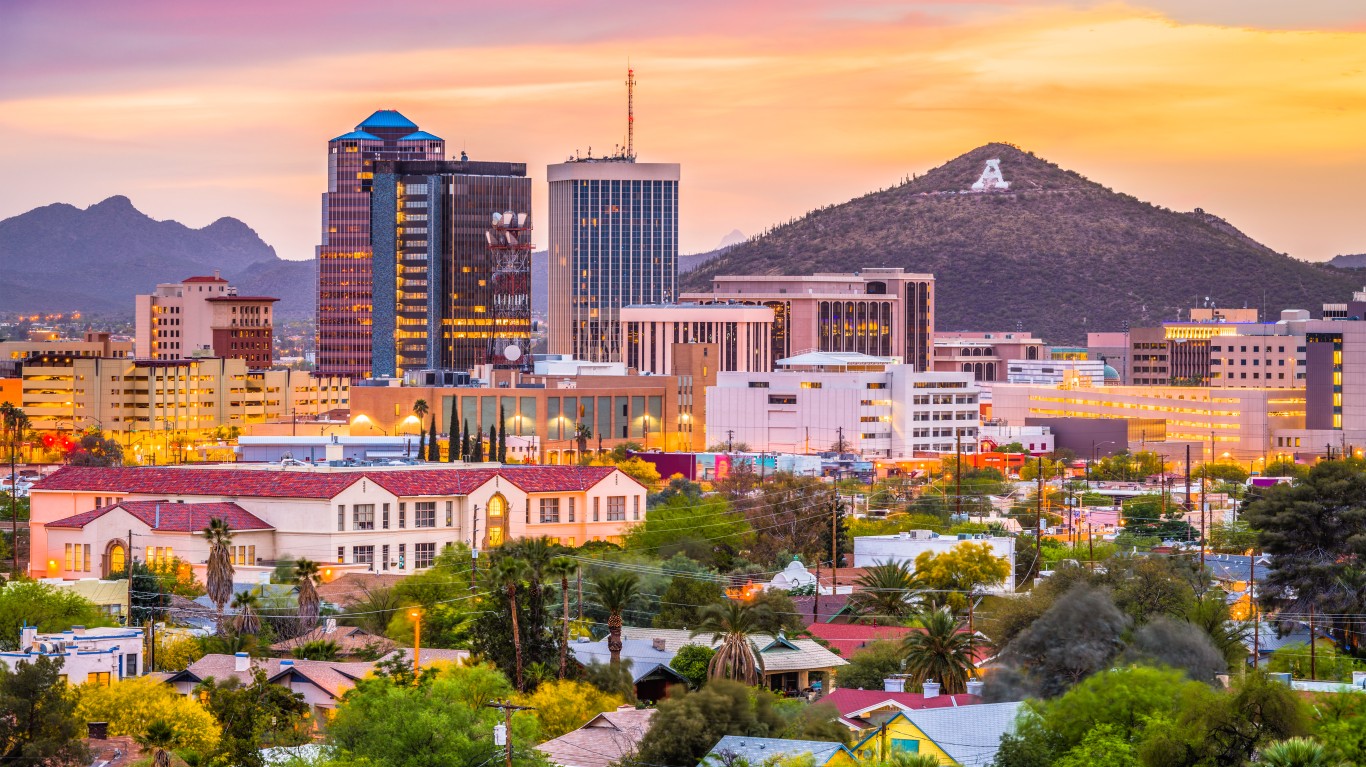
- Illegal immigrant encounters, Oct. 2019 – Nov. 2023: 62,254
- Top origin country: Mexico; 40,864 encounters (65.6% of all encounters reported by Tucson Field Office)
- Second most common origin country: Venezuela; 6,014 encounters (9.7% of all encounters reported by Tucson Field Office)
- Third most common origin country: Cuba; 5,326 encounters (8.6% of all encounters reported by Tucson Field Office)
- Year with the most illegal immigrant encounters from FY 2020-2023: Fiscal 2023; 29,553 encounters (47% of total)
12. San Francisco

- Illegal immigrant encounters, Oct. 2019 – Nov. 2023: 65,375
- Top origin country: Philippines; 14,160 encounters (21.7% of all encounters reported by San Francisco Field Office)
- Second most common origin country: Ukraine; 10,734 encounters (16.4% of all encounters reported by San Francisco Field Office)
- Third most common origin country: China; 10,626 encounters (16.3% of all encounters reported by San Francisco Field Office)
- Year with the most illegal immigrant encounters from FY 2020-2023: Fiscal 2023; 24,756 encounters (38% of total)
11. New Orleans

- Illegal immigrant encounters, Oct. 2019 – Nov. 2023: 70,522
- Top origin country: Philippines; 27,746 encounters (39.3% of all encounters reported by New Orleans Field Office)
- Second most common origin country: China; 13,243 encounters (18.8% of all encounters reported by New Orleans Field Office)
- Third most common origin country: India; 7,683 encounters (10.9% of all encounters reported by New Orleans Field Office)
- Year with the most illegal immigrant encounters from FY 2020-2023: Fiscal 2021; 23,362 encounters (33% of total)
10. Los Angeles

- Illegal immigrant encounters, Oct. 2019 – Nov. 2023: 72,623
- Top origin country: Philippines; 11,481 encounters (15.8% of all encounters reported by Los Angeles Field Office)
- Second most common origin country: Ukraine; 11,071 encounters (15.2% of all encounters reported by Los Angeles Field Office)
- Third most common origin country: Mexico; 10,583 encounters (14.6% of all encounters reported by Los Angeles Field Office)
- Year with the most illegal immigrant encounters from FY 2020-2023: Fiscal 2023; 24,160 encounters (33% of total)
9. Boston

- Illegal immigrant encounters, Oct. 2019 – Nov. 2023: 95,120
- Top origin country: Canada; 29,250 encounters (30.8% of all encounters reported by Boston Field Office)
- Second most common origin country: India; 5,238 encounters (5.5% of all encounters reported by Boston Field Office)
- Third most common origin country: Ukraine; 4,329 encounters (4.6% of all encounters reported by Boston Field Office)
- Year with the most illegal immigrant encounters from FY 2020-2023: Fiscal 2023; 45,380 encounters (48% of total)
8. El Paso, TX

- Illegal immigrant encounters, Oct. 2019 – Nov. 2023: 104,125
- Top origin country: Mexico; 44,383 encounters (42.6% of all encounters reported by El Paso Field Office)
- Second most common origin country: Venezuela; 19,770 encounters (19.0% of all encounters reported by El Paso Field Office)
- Third most common origin country: Haiti; 10,086 encounters (9.7% of all encounters reported by El Paso Field Office)
- Year with the most illegal immigrant encounters from FY 2020-2023: Fiscal 2023; 54,624 encounters (52% of total)
7. New York

- Illegal immigrant encounters, Oct. 2019 – Nov. 2023: 114,089
- Top origin country: Ukraine; 51,324 encounters (45.0% of all encounters reported by New York Field Office)
- Second most common origin country: Haiti; 18,775 encounters (16.5% of all encounters reported by New York Field Office)
- Third most common origin country: Philippines; 8,558 encounters (7.5% of all encounters reported by New York Field Office)
- Year with the most illegal immigrant encounters from FY 2020-2023: Fiscal 2023; 52,026 encounters (46% of total)
6. Seattle

- Illegal immigrant encounters, Oct. 2019 – Nov. 2023: 117,619
- Top origin country: Canada; 20,532 encounters (17.5% of all encounters reported by Seattle Field Office)
- Second most common origin country: India; 18,980 encounters (16.1% of all encounters reported by Seattle Field Office)
- Third most common origin country: Ukraine; 15,794 encounters (13.4% of all encounters reported by Seattle Field Office)
- Year with the most illegal immigrant encounters from FY 2020-2023: Fiscal 2023; 54,579 encounters (46% of total)
5. Buffalo, NY

- Illegal immigrant encounters, Oct. 2019 – Nov. 2023: 181,744
- Top origin country: Canada; 50,535 encounters (27.8% of all encounters reported by Buffalo Field Office)
- Second most common origin country: India; 30,345 encounters (16.7% of all encounters reported by Buffalo Field Office)
- Third most common origin country: China; 9,965 encounters (5.5% of all encounters reported by Buffalo Field Office)
- Year with the most illegal immigrant encounters from FY 2020-2023: Fiscal 2023; 84,751 encounters (47% of total)
4. Houston

- Illegal immigrant encounters, Oct. 2019 – Nov. 2023: 252,316
- Top origin country: Philippines; 70,326 encounters (27.9% of all encounters reported by Houston Field Office)
- Second most common origin country: India; 46,782 encounters (18.5% of all encounters reported by Houston Field Office)
- Third most common origin country: China; 18,937 encounters (7.5% of all encounters reported by Houston Field Office)
- Year with the most illegal immigrant encounters from FY 2020-2023: Fiscal 2023; 75,085 encounters (30% of total)
3. San Diego

- Illegal immigrant encounters, Oct. 2019 – Nov. 2023: 305,310
- Top origin country: Mexico; 122,144 encounters (40.0% of all encounters reported by San Diego Field Office)
- Second most common origin country: Russia; 48,212 encounters (15.8% of all encounters reported by San Diego Field Office)
- Third most common origin country: Ukraine; 24,603 encounters (8.1% of all encounters reported by San Diego Field Office)
- Year with the most illegal immigrant encounters from FY 2020-2023: Fiscal 2023; 131,648 encounters (43% of total)
2. Miami

- Illegal immigrant encounters, Oct. 2019 – Nov. 2023: 310,498
- Top origin country: Haiti; 92,870 encounters (29.9% of all encounters reported by Miami Field Office)
- Second most common origin country: Venezuela; 56,751 encounters (18.3% of all encounters reported by Miami Field Office)
- Third most common origin country: Cuba; 52,047 encounters (16.8% of all encounters reported by Miami Field Office)
- Year with the most illegal immigrant encounters from FY 2020-2023: Fiscal 2023; 208,409 encounters (67% of total)
1. Laredo, TX

- Illegal immigrant encounters, Oct. 2019 – Nov. 2023: 381,422
- Top origin country: Mexico; 126,685 encounters (33.2% of all encounters reported by Laredo Field Office)
- Second most common origin country: Haiti; 78,313 encounters (20.5% of all encounters reported by Laredo Field Office)
- Third most common origin country: Venezuela; 51,789 encounters (13.6% of all encounters reported by Laredo Field Office)
- Year with the most illegal immigrant encounters from FY 2020-2023: Fiscal 2023; 215,356 encounters (56% of total)
Contact [email protected] for any questions or corrections.