Homelessness is on the rise in the United States. According to a study published by the National Alliance to End Homelessness, the number of Americans experiencing homlessness has grown each year since 2015. As of January 2020, there were an estimated 580,466 Americans experiencing homelessness.
Though the exact effects the COVID-19 pandemic had on America’s homelessness problem have yet to be determined, some early indications suggest little reason for optimism.
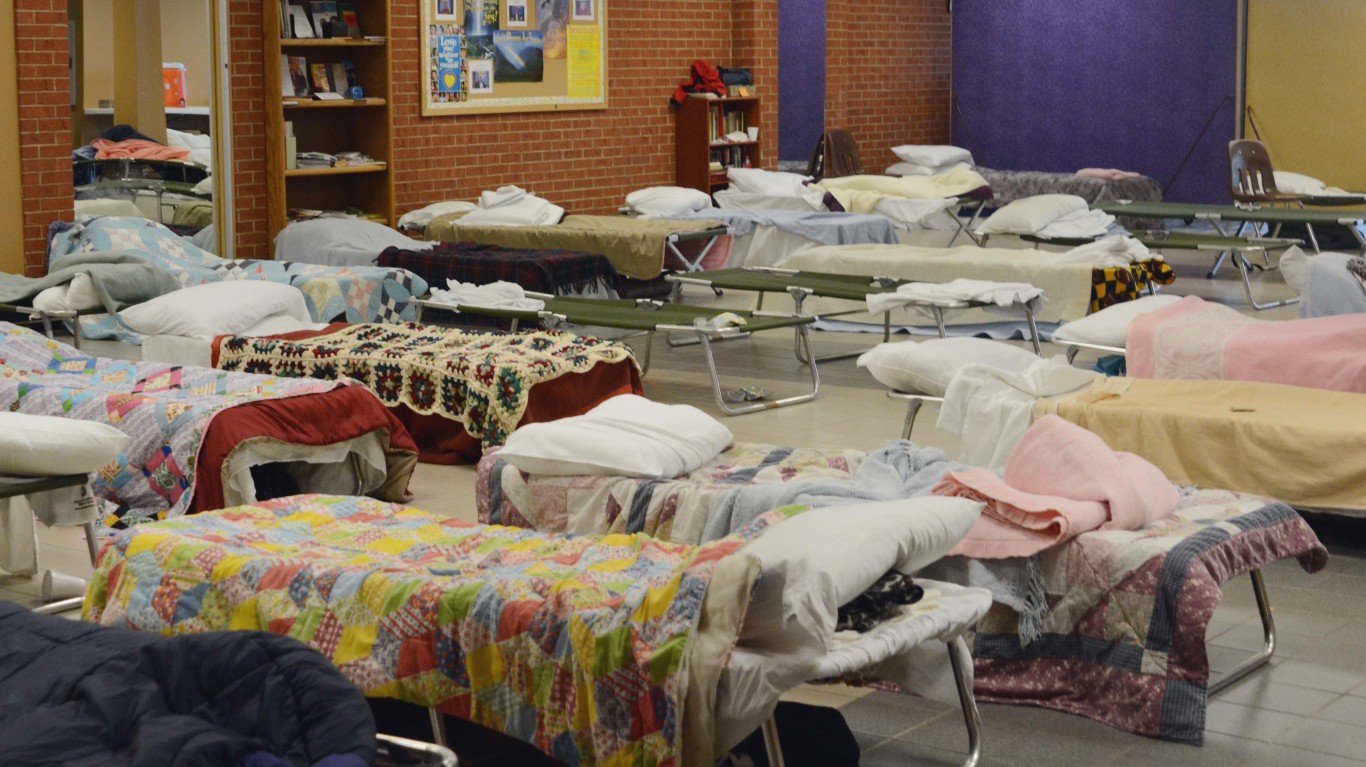
For reasons at least partly related to the pandemic, a portion of Americans – as high as 35% in some states – say they have missed their rent or mortgage payments or have low confidence that they can pay next month’s, according to the U.S. Census Bureau’s Household Pulse Survey. Additionally, in some parts of the country, the pandemic interrupted access to temporary housing locations, and social distancing rules meant fewer beds in shelter facilities.
Nationwide, men are far more likely to experience homelessness than women, and rates of homelessness tend to be higher among historically marginalized racial groups, including Native Americans and Black Americans. Homelessness rates also vary considerably by state.
In Oregon, an estimated 14,655 people are experiencing homelessness – or about 34.7 for every 10,000 people, the fourth highest homeless rate among states.
According to the National Alliance to End Homelessness, many areas with a high cost of living, especially high housing costs, also have higher rates of homelessness. Similarly, areas with lower costs of living often have lower rates of homelessness. This pattern holds in Oregon. Just as the homelessness rate in the state is higher than average, so too is the cost of living. The overall cost of living in Oregon, which includes housing costs, is about 3.5% higher than the national average.
| Rank | State | Homelessness rate (per 10,000) | Homeless population | Poverty rate (%) | Cost of livng (%) |
|---|---|---|---|---|---|
| 1 | New York | 46.9 | 91,271 | 13.0 | 9.5 higher than avg. |
| 2 | Hawaii | 45.6 | 6,458 | 9.3 | 11.3 higher than avg. |
| 3 | California | 40.9 | 161,548 | 11.8 | 9.9 higher than avg. |
| 4 | Oregon | 34.7 | 14,655 | 11.4 | 3.5 higher than avg. |
| 5 | Washington | 30.1 | 22,923 | 9.8 | 7.1 higher than avg. |
| 6 | Alaska | 26.6 | 1,949 | 10.1 | 3.4 higher than avg. |
| 7 | Massachusetts | 26.1 | 17,975 | 9.4 | 6.7 higher than avg. |
| 8 | Nevada | 22.4 | 6,900 | 12.5 | 1.1 lower than avg. |
| 9 | Vermont | 17.8 | 1,110 | 10.2 | 1 lower than avg. |
| 10 | Colorado | 17.1 | 9,846 | 9.3 | 2 higher than avg. |
| 11 | New Mexico | 15.9 | 3,333 | 18.2 | 6.8 lower than avg. |
| 12 | Maine | 15.6 | 2,097 | 10.9 | 3.5 lower than avg. |
| 13 | Arizona | 15.1 | 10,979 | 13.5 | 1.6 lower than avg. |
| 14 | Montana | 14.5 | 1,545 | 12.6 | 5.9 lower than avg. |
| 15 | Minnesota | 14.1 | 7,940 | 9.0 | 1.3 lower than avg. |
| 16 | Idaho | 13 | 2,315 | 11.2 | 7.1 lower than avg. |
| 17 | Florida | 12.8 | 27,487 | 12.7 | 0.1 lower than avg. |
| 18 | Nebraska | 12.4 | 2,404 | 9.9 | 6.6 lower than avg. |
| 19 | New Hampshire | 12.3 | 1,675 | 7.3 | 3.4 higher than avg. |
| 20 | Delaware | 12 | 1,165 | 11.3 | 1.1 lower than avg. |
| 21 | South Dakota | 12 | 1,058 | 11.9 | 7.7 lower than avg. |
| 22 | New Jersey | 10.9 | 9,662 | 9.2 | 10.9 higher than avg. |
| 23 | Tennessee | 10.6 | 7,256 | 13.9 | 8.1 lower than avg. |
| 24 | Missouri | 10.6 | 6,527 | 12.9 | 7 lower than avg. |
| 25 | Wyoming | 10.6 | 612 | 10.1 | 6.6 lower than avg. |
| 26 | Maryland | 10.5 | 6,360 | 9.0 | 4.8 higher than avg. |
| 27 | Pennsylvania | 10.4 | 13,375 | 12.0 | 2.1 lower than avg. |
| 28 | Rhode Island | 10.4 | 1,104 | 10.8 | 1.6 higher than avg. |
| 29 | Oklahoma | 9.9 | 3,932 | 15.2 | 9.6 lower than avg. |
| 30 | Utah | 9.8 | 3,131 | 8.9 | 2.6 lower than avg. |
| 31 | Georgia | 9.6 | 10,234 | 13.3 | 5.2 lower than avg. |
| 32 | Texas | 9.4 | 27,229 | 13.6 | 0.9 lower than avg. |
| 33 | Ohio | 9.1 | 10,655 | 13.1 | 6.8 lower than avg. |
| 34 | Kentucky | 9 | 4,011 | 16.3 | 10 lower than avg. |
| 35 | North Carolina | 8.8 | 9,280 | 13.6 | 7.8 lower than avg. |
| 36 | Michigan | 8.6 | 8,638 | 13.0 | 4.9 lower than avg. |
| 37 | Indiana | 8.4 | 5,625 | 11.9 | 6.6 lower than avg. |
| 38 | Iowa | 8.4 | 2,647 | 11.2 | 8.1 lower than avg. |
| 39 | Kansas | 8.4 | 2,449 | 11.4 | 6.9 lower than avg. |
| 40 | South Carolina | 8.3 | 4,287 | 13.8 | 7.9 lower than avg. |
| 41 | Illinois | 8.2 | 10,431 | 11.5 | 0.2 lower than avg. |
| 42 | Connecticut | 8.1 | 2,905 | 10.0 | 2.9 higher than avg. |
| 43 | Wisconsin | 7.8 | 4,515 | 10.4 | 5.5 lower than avg. |
| 44 | Arkansas | 7.8 | 2,366 | 16.2 | 11.6 lower than avg. |
| 45 | West Virginia | 7.5 | 1,341 | 16.0 | 11.7 lower than avg. |
| 46 | North Dakota | 7.1 | 541 | 10.6 | 7.8 lower than avg. |
| 47 | Virginia | 7 | 5,957 | 9.9 | 0.3 higher than avg. |
| 48 | Alabama | 6.8 | 3,351 | 15.5 | 10.9 lower than avg. |
| 49 | Louisiana | 6.8 | 3,173 | 19.0 | 8.2 lower than avg. |
| 50 | Mississippi | 3.7 | 1,107 | 19.6 | 12.4 lower than avg. |