
Despite the efforts of multiple presidential administrations, the problem of illegal immigration — particularly along the southern border — has gone unaddressed by Congress for decades. Most recently, congressional Republicans withdrew support for an immigration reform bill drafted by the Biden White House and a bipartisan group of senators, ultimately voting the measure down. Meanwhile, the flow of illegal migrants remains at historic highs.
In the first eight months of fiscal 2024, U.S. Customs and Border Protection reported nearly 2 million encounters with illegal migrants nationwide — up 9%, 34%, and 127%, respectively, from the same eight months in the three preceding fiscal years. As undocumented border crossings have surged, the issue has become a political liability. According to Gallup survey data, 48% of Americans report worrying a “great deal” about illegal immigration, up from 32% in 2020.
With public concern over border security at record highs, and the 2024 general election only months away, President Biden issued an executive order that effectively bars asylum seekers from illegally entering the U.S. through Mexico. Unusually restrictive for an incumbent Democratic candidate, the policy is a practical necessity in the face of congressional inaction, according to a White House statement. (Here is a look at how Biden and Trump compare on the most important issues.)
While the ongoing debate over U.S. immigration policy is dominated by the crisis at the southern border, every year, the CBP reports encounters with thousands of illegal immigrants in cities across the country.
Using data from the U.S. CBP, 24/7 Wall St. identified the U.S. cities with the most illegal immigrants. We ranked all 19 U.S. cities with CBP field offices on the number of encounters between CBP agents and foreign nationals who entered the U.S. illegally in the last 12 months — from May 2023 to April 2024. Encounters include apprehensions, expulsions, and identification of inadmissible persons under Title 8 and Title 42.
The cities with CBP field offices are spread across the U.S., spanning 13 states, including California and Texas, which are each home to three. Among them, the number of illegal migrants encountered by CBP in the last 12 months ranges from about 5,500 to nearly 300,000. (Here is a look at the states with the most illegal immigrants.)
Several places on this list are so-called “sanctuary cities,” a designation that typically indicates local authorities may not fully cooperate with federal law enforcement seeking to deport illegal migrants. However, the term “sanctuary city” has no official legal meaning, and several sanctuary cities — including Boston, New York, and Seattle — rank highly on this list.
Why It Matters

Source: Joe Raedle / Getty Images News via Getty Images
Rates of illegal entries into the United States have spiked in recent years, and in cities across the country, federal law enforcement are encountering thousands of undocumented migrants every month. With the 2024 presidential election only months away, and immigration as a leading issue for millions of voters, the Biden administration has adopted a hard-line approach to border security. Exactly how effective the new policy will be — both politically, and at its stated goal of reducing the flow of illegal migrants — remains to be seen.
19. Portland, OR

Source: Shunyu Fan / iStock via Getty Images
- Illegal immigrant encounters, May 2023 – April 2024: 5,491
- Top origin country: Ukraine; 2,094 migrants (38.1% of all migrant encounters in Portland)
- Month with the most encounters in past year: August 2023; 711 migrants (12.9% of all migrant encounters in Portland)
- Month with the fewest encounters in past year: January 2024; 301 (5.5% of all migrant encounters in Portland)
18. New Orleans, LA

Source: SeanPavonePhoto / Getty Images
- Illegal immigrant encounters, May 2023 – April 2024: 10,197
- Top origin country: Philippines; 4,051 migrants (39.7% of all migrant encounters in New Orleans)
- Month with the most encounters in past year: September 2023; 1,166 migrants (11.4% of all migrant encounters in New Orleans)
- Month with the fewest encounters in past year: April 2024; 558 (5.5% of all migrant encounters in New Orleans)
17. Atlanta, GA

Source: rodclementphotography / iStock via Getty Images
- Illegal immigrant encounters, May 2023 – April 2024: 12,803
- Top origin country: Ukraine; 3,259 migrants (25.5% of all migrant encounters in Atlanta)
- Month with the most encounters in past year: June 2023; 1,280 migrants (10.0% of all migrant encounters in Atlanta)
- Month with the fewest encounters in past year: July 2023; 899 (7.0% of all migrant encounters in Atlanta)
16. Detroit, MI

Source: Steven_Kriemadis / iStock via Getty Images
- Illegal immigrant encounters, May 2023 – April 2024: 15,069
- Top origin country: India; 1,946 migrants (12.9% of all migrant encounters in Detroit)
- Month with the most encounters in past year: May 2023; 1,459 migrants (9.7% of all migrant encounters in Detroit)
- Month with the fewest encounters in past year: February 2024; 1,023 (6.8% of all migrant encounters in Detroit)
15. Baltimore, MD

Source: Kruck20 / iStock via Getty Images
- Illegal immigrant encounters, May 2023 – April 2024: 18,677
- Top origin country: Philippines; 5,503 migrants (29.5% of all migrant encounters in Baltimore)
- Month with the most encounters in past year: May 2023; 1,764 migrants (9.4% of all migrant encounters in Baltimore)
- Month with the fewest encounters in past year: April 2024; 1,298 (6.9% of all migrant encounters in Baltimore)
14. Chicago, IL

Source: franckreporter / E+ via Getty Images
- Illegal immigrant encounters, May 2023 – April 2024: 19,568
- Top origin country: Ukraine; 14,868 migrants (76.0% of all migrant encounters in Chicago)
- Month with the most encounters in past year: September 2023; 2,078 migrants (10.6% of all migrant encounters in Chicago)
- Month with the fewest encounters in past year: January 2024; 1,123 (5.7% of all migrant encounters in Chicago)
13. Tampa, FL

Source: SeanPavonePhoto / iStock via Getty Images
- Illegal immigrant encounters, May 2023 – April 2024: 22,454
- Top origin country: Cuba; 7,306 migrants (32.5% of all migrant encounters in Tampa)
- Month with the most encounters in past year: November 2023; 2,392 migrants (10.7% of all migrant encounters in Tampa)
- Month with the fewest encounters in past year: September 2023; 1,613 (7.2% of all migrant encounters in Tampa)
12. Los Angeles, CA

Source: Ron and Patty Thomas / E+ via Getty Images
- Illegal immigrant encounters, May 2023 – April 2024: 24,020
- Top origin country: Nicaragua; 5,423 migrants (22.6% of all migrant encounters in Los Angeles)
- Month with the most encounters in past year: October 2023; 2,268 migrants (9.4% of all migrant encounters in Los Angeles)
- Month with the fewest encounters in past year: July 2023; 1,608 (6.7% of all migrant encounters in Los Angeles)
11. San Francisco, CA

Source: bluejayphoto / iStock via Getty Images
- Illegal immigrant encounters, May 2023 – April 2024: 28,509
- Top origin country: China; 10,689 migrants (37.5% of all migrant encounters in San Francisco)
- Month with the most encounters in past year: February 2024; 2,762 migrants (9.7% of all migrant encounters in San Francisco)
- Month with the fewest encounters in past year: November 2023; 1,777 (6.2% of all migrant encounters in San Francisco)
10. Tucson, AZ
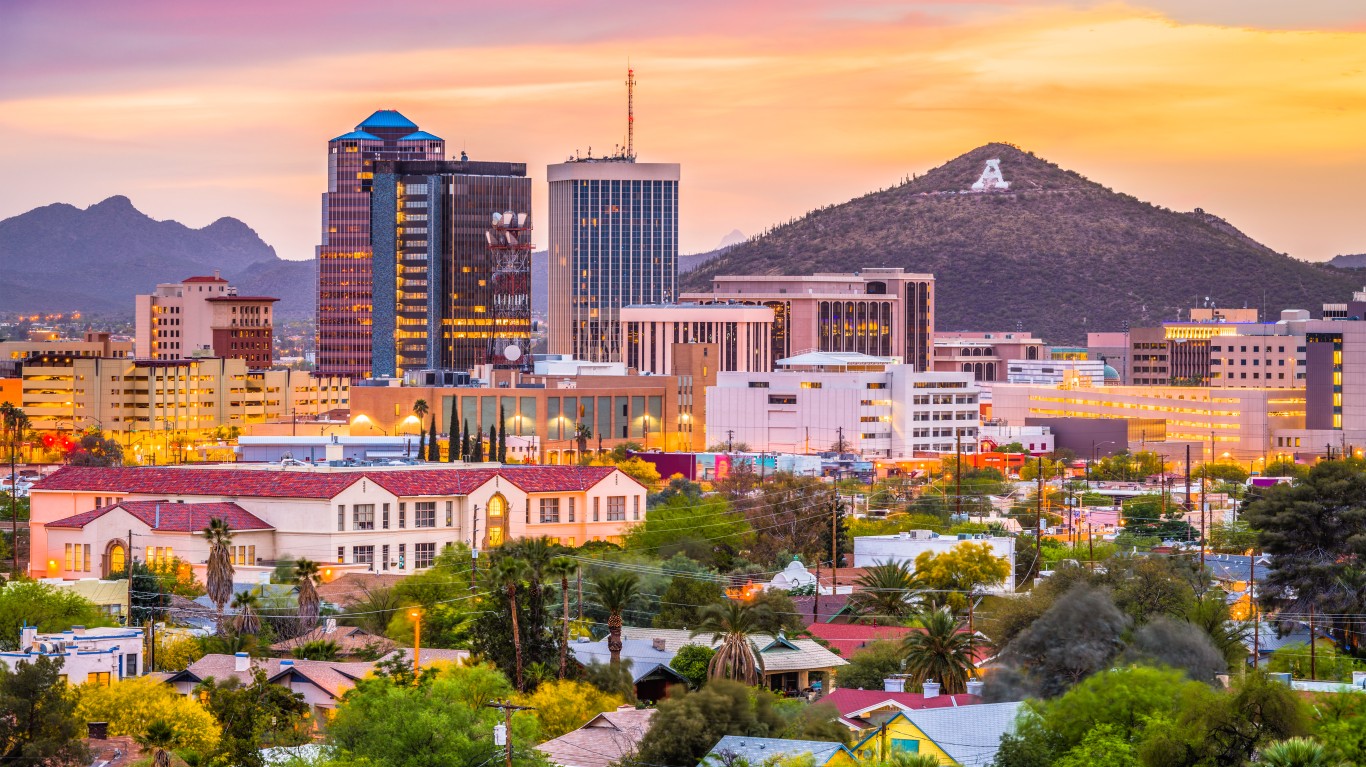
Source: Sean Pavone / iStock via Getty Images
- Illegal immigrant encounters, May 2023 – April 2024: 46,249
- Top origin country: Mexico; 20,361 migrants (44.0% of all migrant encounters in Tucson)
- Month with the most encounters in past year: September 2023; 4,565 migrants (9.9% of all migrant encounters in Tucson)
- Month with the fewest encounters in past year: May 2023; 2,766 (6.0% of all migrant encounters in Tucson)
9. New York, NY

Source: GCShutter / E+ via Getty Images
- Illegal immigrant encounters, May 2023 – April 2024: 47,104
- Top origin country: Haiti; 20,296 migrants (43.1% of all migrant encounters in New York)
- Month with the most encounters in past year: February 2024; 4,738 migrants (10.1% of all migrant encounters in New York)
- Month with the fewest encounters in past year: March 2024; 2,440 (5.2% of all migrant encounters in New York)
8. Boston, MA

Source: DenisTangneyJr / E+ via Getty Images
- Illegal immigrant encounters, May 2023 – April 2024: 51,530
- Top origin country: Canada; 8,715 migrants (16.9% of all migrant encounters in Boston)
- Month with the most encounters in past year: September 2023; 5,576 migrants (10.8% of all migrant encounters in Boston)
- Month with the fewest encounters in past year: November 2023; 3,250 (6.3% of all migrant encounters in Boston)
7. Seattle, WA

Source: chinaface / E+ via Getty Images
- Illegal immigrant encounters, May 2023 – April 2024: 62,052
- Top origin country: India; 13,695 migrants (22.1% of all migrant encounters in Seattle)
- Month with the most encounters in past year: September 2023; 5,788 migrants (9.3% of all migrant encounters in Seattle)
- Month with the fewest encounters in past year: May 2023; 4,517 (7.3% of all migrant encounters in Seattle)
6. Buffalo, NY

Source: DenisTangneyJr / E+ via Getty Images
- Illegal immigrant encounters, May 2023 – April 2024: 70,257
- Top origin country: Canada; 14,625 migrants (20.8% of all migrant encounters in Buffalo)
- Month with the most encounters in past year: May 2023; 7,903 migrants (11.2% of all migrant encounters in Buffalo)
- Month with the fewest encounters in past year: April 2024; 4,385 (6.2% of all migrant encounters in Buffalo)
5. Houston, TX

Source: Sean Pavone / iStock via Getty Images
- Illegal immigrant encounters, May 2023 – April 2024: 72,480
- Top origin country: Philippines; 17,698 migrants (24.4% of all migrant encounters in Houston)
- Month with the most encounters in past year: August 2023; 6,819 migrants (9.4% of all migrant encounters in Houston)
- Month with the fewest encounters in past year: February 2024; 5,398 (7.4% of all migrant encounters in Houston)
4. El Paso, TX

Source: Sean Pavone / iStock via Getty Images
- Illegal immigrant encounters, May 2023 – April 2024: 87,896
- Top origin country: Venezuela; 22,297 migrants (25.4% of all migrant encounters in El Paso)
- Month with the most encounters in past year: August 2023; 8,040 migrants (9.1% of all migrant encounters in El Paso)
- Month with the fewest encounters in past year: May 2023; 4,571 (5.2% of all migrant encounters in El Paso)
3. San Diego, CA

Source: f11photo / iStock via Getty Images
- Illegal immigrant encounters, May 2023 – April 2024: 177,065
- Top origin country: Mexico; 53,826 migrants (30.4% of all migrant encounters in San Diego)
- Month with the most encounters in past year: October 2023; 16,027 migrants (9.1% of all migrant encounters in San Diego)
- Month with the fewest encounters in past year: May 2023; 9,482 (5.4% of all migrant encounters in San Diego)
2. Laredo, TX

Source: DenisTangneyJr / iStock via Getty Images
- Illegal immigrant encounters, May 2023 – April 2024: 283,596
- Top origin country: Mexico; 73,037 migrants (25.8% of all migrant encounters in Laredo)
- Month with the most encounters in past year: December 2023; 24,853 migrants (8.8% of all migrant encounters in Laredo)
- Month with the fewest encounters in past year: May 2023; 18,584 (6.6% of all migrant encounters in Laredo)
1. Miami, FL

Source: Davel5957 / iStock via Getty Images
- Illegal immigrant encounters, May 2023 – April 2024: 295,385
- Top origin country: Haiti; 115,836 migrants (39.2% of all migrant encounters in Miami)
- Month with the most encounters in past year: December 2023; 27,662 migrants (9.4% of all migrant encounters in Miami)
- Month with the fewest encounters in past year: March 2024; 17,599 (6.0% of all migrant encounters in Miami)
Take This Retirement Quiz To Get Matched With An Advisor Now (Sponsored)
Are you ready for retirement? Planning for retirement can be overwhelming, that’s why it could be a good idea to speak to a fiduciary financial advisor about your goals today.
Start by taking this retirement quiz right here from SmartAsset that will match you with up to 3 financial advisors that serve your area and beyond in 5 minutes. Smart Asset is now matching over 50,000 people a month.
Click here now to get started.
Thank you for reading! Have some feedback for us?
Contact the 24/7 Wall St. editorial team.
Editors' Picks