Fewer Americans moved to a new home in the past year than at any other time since 1948 — the earliest year with available data from the U.S. Census Bureau. Only about 27.1 million Americans moved between March 2020 and March 2021, compared to 28.7 million from 1947 to 1948, when the U.S. population was less than half its current size.
The most recent data on relocation in the United States reflects the continuation of a longer-term downward trend in domestic relocation, as moving has become less common in each of the last six years. While the COVID-19 pandemic pushed many Americans out of urban areas and into the suburbs, it also likely created many hurdles that made moving more difficult.
Regardless of the causal factors, the fact remains that only 8.4% of Americans age 1 and up moved to a new home in the past year, less than half the share reported in years passed. (This is the top city Americans are moving to.)
Most Americans who moved in the past year did not go far. The largest share of movers — 4.9% of the population — relocated to a new home within the same county. Meanwhile, 1.9% of the population moved to a new county in the same state, and just 1.4% of the population relocated to a different state. Here is a look at the 40 places where young people are moving.
Using data from the Current Population Survey from the Census Bureau, 24/7 Wall St. identified the number of Americans who moved the year you were born. Prior to 2004, the period of moving was as of March 1 of the previous year. Total number of movers includes those moving from abroad. Due to data limitations, the years 1972 through 1975 and 1977 to 1980 are not included in this analysis. All data came from the CPS.
Click here to see how many Americans moved the year you were born
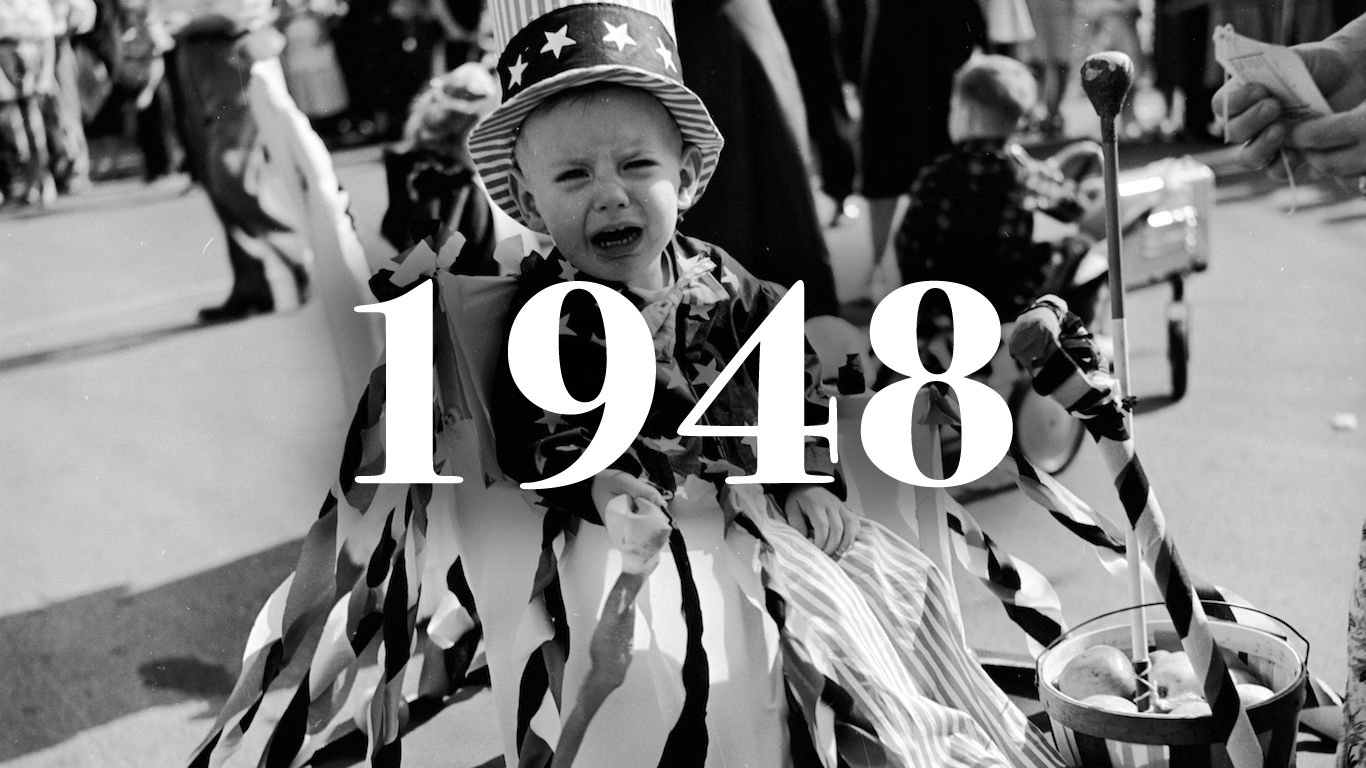
1947-1948
> Pct. 1 yr. and older who moved: 20.2% of pop. — 9th most in 66 years (28,672,000 total)
> Moved within same county: 13.6% of pop. (19,202,000 total)
> Moved to a new county in-state: 3.3% of pop. (4,638,000 total)
> Moved to a new state: 3.1% of pop. (4,370,000 total)
[in-text-ad]
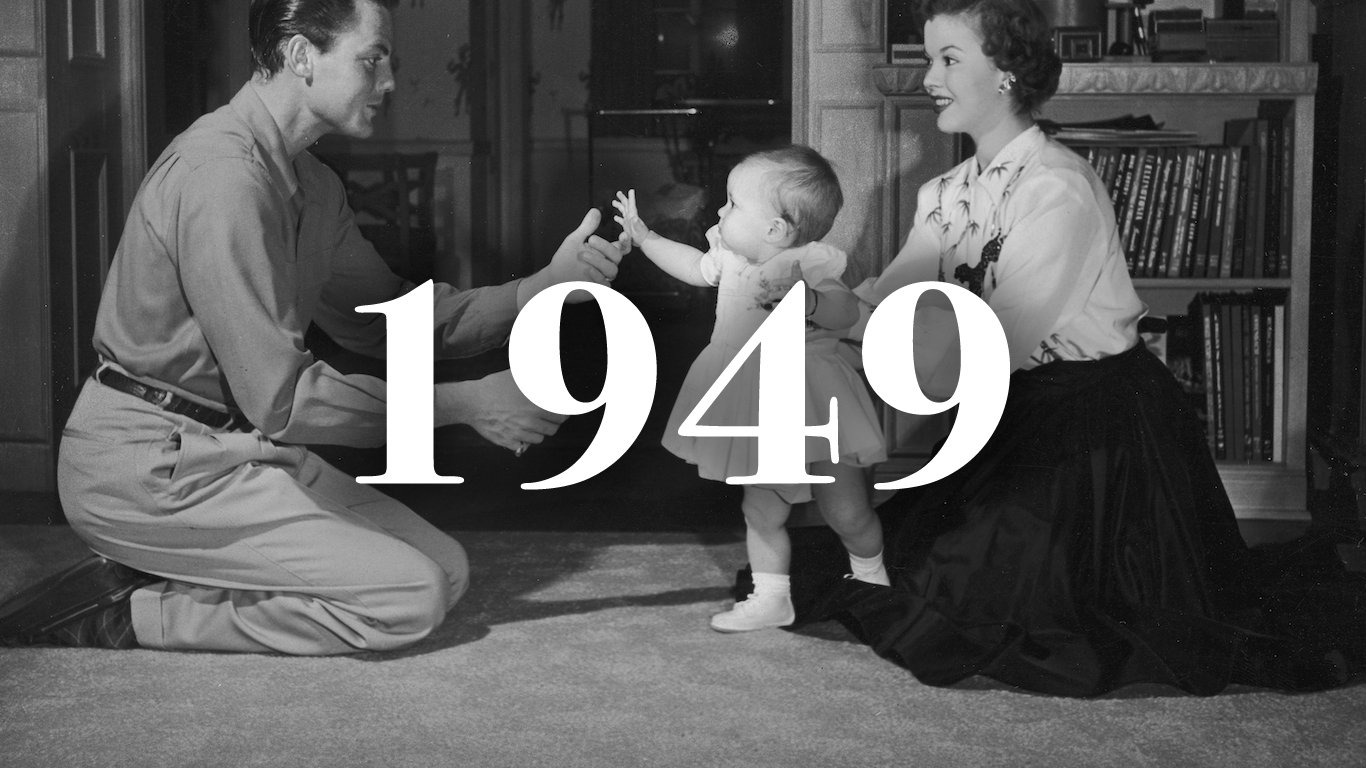
1948-1949
> Pct. 1 yr. and older who moved: 19.2% of pop. — 20th most in 66 years (27,603,000 total)
> Moved within same county: 13.0% of pop. (18,792,000 total)
> Moved to a new county in-state: 2.8% of pop. (3,992,000 total)
> Moved to a new state: 3.0% of pop. (4,344,000 total)
1949-1950
> Pct. 1 yr. and older who moved: 19.1% of pop. — 21st most in 66 years (28,015,000 total)
> Moved within same county: 13.1% of pop. (19,276,000 total)
> Moved to a new county in-state: 3.0% of pop. (4,360,000 total)
> Moved to a new state: 2.6% of pop. (3,889,000 total)
1950-1951
> Pct. 1 yr. and older who moved: 21.2% of pop. — most in 66 years (31,464,000 total)
> Moved within same county: 13.9% of pop. (20,694,000 total)
> Moved to a new county in-state: 3.6% of pop. (5,276,000 total)
> Moved to a new state: 3.5% of pop. (5,188,000 total)
[recirclink id=942076]
1951-1952
> Pct. 1 yr. and older who moved: 20.3% of pop. — 7th most in 66 years (30,478,000 total)
> Moved within same county: 13.2% of pop. (19,874,000 total)
> Moved to a new county in-state: 3.2% of pop. (4,854,000 total)
> Moved to a new state: 3.4% of pop. (5,112,000 total)
1952-1953
> Pct. 1 yr. and older who moved: 20.6% of pop. — 4th most in 66 years (31,526,000 total)
> Moved within same county: 13.5% of pop. (20,638,000 total)
> Moved to a new county in-state: 3.0% of pop. (4,626,000 total)
> Moved to a new state: 3.6% of pop. (5,522,000 total)
1953-1954
> Pct. 1 yr. and older who moved: 19.3% of pop. — 19th most in 66 years (30,025,000 total)
> Moved within same county: 12.2% of pop. (19,046,000 total)
> Moved to a new county in-state: 3.2% of pop. (4,947,000 total)
> Moved to a new state: 3.2% of pop. (5,034,000 total)
[in-text-ad-2]
1954-1955
> Pct. 1 yr. and older who moved: 20.4% of pop. — 6th most in 66 years (32,419,000 total)
> Moved within same county: 13.3% of pop. (21,086,000 total)
> Moved to a new county in-state: 3.5% of pop. (5,511,000 total)
> Moved to a new state: 3.1% of pop. (4,895,000 total)
1955-1956
> Pct. 1 yr. and older who moved: 21.1% of pop. — 2nd most in 66 years (34,040,000 total)
> Moved within same county: 13.7% of pop. (22,186,000 total)
> Moved to a new county in-state: 3.6% of pop. (5,859,000 total)
> Moved to a new state: 3.1% of pop. (5,053,000 total)
1956-1957
> Pct. 1 yr. and older who moved: 19.9% of pop. — 13th most in 66 years (32,723,000 total)
> Moved within same county: 13.1% of pop. (21,566,000 total)
> Moved to a new county in-state: 3.2% of pop. (5,192,000 total)
> Moved to a new state: 3.1% of pop. (5,076,000 total)
1957-1958
> Pct. 1 yr. and older who moved: 20.3% of pop. — 7th most in 66 years (34,103,000 total)
> Moved within same county: 13.1% of pop. (22,023,000 total)
> Moved to a new county in-state: 3.4% of pop. (5,656,000 total)
> Moved to a new state: 3.3% of pop. (5,584,000 total)
[in-text-ad]
1958-1959
> Pct. 1 yr. and older who moved: 19.7% of pop. — 16th most in 66 years (33,640,000 total)
> Moved within same county: 13.1% of pop. (22,315,000 total)
> Moved to a new county in-state: 3.2% of pop. (5,419,000 total)
> Moved to a new state: 3.0% of pop. (5,070,000 total)
1959-1960
> Pct. 1 yr. and older who moved: 19.9% of pop. — 13th most in 66 years (34,685,000 total)
> Moved within same county: 12.9% of pop. (22,564,000 total)
> Moved to a new county in-state: 3.3% of pop. (5,724,000 total)
> Moved to a new state: 3.2% of pop. (5,523,000 total)
1960-1961
> Pct. 1 yr. and older who moved: 20.6% of pop. — 4th most in 66 years (36,533,000 total)
> Moved within same county: 13.7% of pop. (24,289,000 total)
> Moved to a new county in-state: 3.1% of pop. (5,493,000 total)
> Moved to a new state: 3.2% of pop. (5,753,000 total)
[recirclink id=968127]
1961-1962
> Pct. 1 yr. and older who moved: 19.6% of pop. — 17th most in 66 years (35,218,000 total)
> Moved within same county: 13.0% of pop. (23,341,000 total)
> Moved to a new county in-state: 3.0% of pop. (5,461,000 total)
> Moved to a new state: 3.1% of pop. (5,562,000 total)
1962-1963
> Pct. 1 yr. and older who moved: 20.0% of pop. — 12th most in 66 years (36,432,000 total)
> Moved within same county: 12.6% of pop. (23,059,000 total)
> Moved to a new county in-state: 3.1% of pop. (5,712,000 total)
> Moved to a new state: 3.6% of pop. (6,640,000 total)
1963-1964
> Pct. 1 yr. and older who moved: 20.1% of pop. — 11th most in 66 years (37,187,000 total)
> Moved within same county: 13.0% of pop. (24,089,000 total)
> Moved to a new county in-state: 3.3% of pop. (6,191,000 total)
> Moved to a new state: 3.3% of pop. (6,047,000 total)
[in-text-ad-2]
1964-1965
> Pct. 1 yr. and older who moved: 20.7% of pop. — 3rd most in 66 years (38,846,000 total)
> Moved within same county: 13.4% of pop. (25,122,000 total)
> Moved to a new county in-state: 3.5% of pop. (6,597,000 total)
> Moved to a new state: 3.3% of pop. (6,147,000 total)
1965-1966
> Pct. 1 yr. and older who moved: 19.8% of pop. — 15th most in 66 years (37,586,000 total)
> Moved within same county: 12.7% of pop. (24,165,000 total)
> Moved to a new county in-state: 3.3% of pop. (6,275,000 total)
> Moved to a new state: 3.3% of pop. (6,263,000 total)
1966-1967
> Pct. 1 yr. and older who moved: 19.0% of pop. — 23rd most in 66 years (36,523,000 total)
> Moved within same county: 11.6% of pop. (22,339,000 total)
> Moved to a new county in-state: 3.3% of pop. (6,308,000 total)
> Moved to a new state: 3.4% of pop. (6,553,000 total)
1967-1968
> Pct. 1 yr. and older who moved: 19.5% of pop. — 18th most in 66 years (37,886,000 total)
> Moved within same county: 11.8% of pop. (22,960,000 total)
> Moved to a new county in-state: 3.4% of pop. (6,607,000 total)
> Moved to a new state: 3.6% of pop. (7,035,000 total)
[in-text-ad]
1968-1969
> Pct. 1 yr. and older who moved: 19.0% of pop. — 23rd most in 66 years (37,332,000 total)
> Moved within same county: 11.7% of pop. (22,993,000 total)
> Moved to a new county in-state: 3.2% of pop. (6,316,000 total)
> Moved to a new state: 3.4% of pop. (6,625,000 total)
1969-1970
> Pct. 1 yr. and older who moved: 19.1% of pop. — 21st most in 66 years (38,095,000 total)
> Moved within same county: 11.7% of pop. (23,225,000 total)
> Moved to a new county in-state: 3.1% of pop. (6,250,000 total)
> Moved to a new state: 3.6% of pop. (7,066,000 total)
1970-1971
> Pct. 1 yr. and older who moved: 18.7% of pop. — 25th most in 66 years (37,705,000 total)
> Moved within same county: 11.4% of pop. (23,018,000 total)
> Moved to a new county in-state: 3.1% of pop. (6,197,000 total)
> Moved to a new state: 3.4% of pop. (6,946,000 total)
[recirclink id=986880]
1975-1976
> Pct. 1 yr. and older who moved: 17.7% of pop. — 31st most in 66 years (36,793,000 total)
> Moved within same county: 10.8% of pop. (22,399,000 total)
> Moved to a new county in-state: 3.4% of pop. (7,106,000 total)
> Moved to a new state: 3.0% of pop. (6,140,000 total)
1980-1981
> Pct. 1 yr. and older who moved: 17.2% of pop. — 34th most in 66 years (38,200,000 total)
> Moved within same county: 10.4% of pop. (23,097,000 total)
> Moved to a new county in-state: 3.4% of pop. (7,614,000 total)
> Moved to a new state: 2.8% of pop. (6,175,000 total)

1981-1982
> Pct. 1 yr. and older who moved: 17.0% of pop. — 35th most in 66 years (38,127,000 total)
> Moved within same county: 10.3% of pop. (23,081,000 total)
> Moved to a new county in-state: 3.3% of pop. (7,330,000 total)
> Moved to a new state: 3.0% of pop. (6,628,000 total)
[in-text-ad-2]
1982-1983
> Pct. 1 yr. and older who moved: 16.6% of pop. — 39th most in 66 years (37,408,000 total)
> Moved within same county: 10.1% of pop. (22,858,000 total)
> Moved to a new county in-state: 3.3% of pop. (7,403,000 total)
> Moved to a new state: 2.7% of pop. (6,169,000 total)
1983-1984
> Pct. 1 yr. and older who moved: 17.3% of pop. — 32nd most in 66 years (39,379,000 total)
> Moved within same county: 10.4% of pop. (23,659,000 total)
> Moved to a new county in-state: 3.6% of pop. (8,198,000 total)
> Moved to a new state: 2.8% of pop. (6,444,000 total)

1984-1985
> Pct. 1 yr. and older who moved: 20.2% of pop. — 9th most in 66 years (46,470,000 total)
> Moved within same county: 13.1% of pop. (30,126,000 total)
> Moved to a new county in-state: 3.5% of pop. (7,995,000 total)
> Moved to a new state: 3.0% of pop. (6,921,000 total)

1985-1986
> Pct. 1 yr. and older who moved: 18.6% of pop. — 26th most in 66 years (43,237,000 total)
> Moved within same county: 11.3% of pop. (26,401,000 total)
> Moved to a new county in-state: 3.7% of pop. (8,665,000 total)
> Moved to a new state: 3.0% of pop. (6,971,000 total)
[in-text-ad]
1986-1987
> Pct. 1 yr. and older who moved: 18.6% of pop. — 26th most in 66 years (43,693,000 total)
> Moved within same county: 11.6% of pop. (27,196,000 total)
> Moved to a new county in-state: 3.7% of pop. (8,762,000 total)
> Moved to a new state: 2.8% of pop. (6,593,000 total)

1987-1988
> Pct. 1 yr. and older who moved: 17.8% of pop. — 29th most in 66 years (42,174,000 total)
> Moved within same county: 11.0% of pop. (26,201,000 total)
> Moved to a new county in-state: 3.3% of pop. (7,727,000 total)
> Moved to a new state: 3.0% of pop. (7,046,000 total)

1988-1989
> Pct. 1 yr. and older who moved: 17.8% of pop. — 29th most in 66 years (42,620,000 total)
> Moved within same county: 10.9% of pop. (26,123,000 total)
> Moved to a new county in-state: 3.3% of pop. (7,949,000 total)
> Moved to a new state: 3.0% of pop. (7,081,000 total)
[recirclink id=931795]
1989-1990
> Pct. 1 yr. and older who moved: 17.9% of pop. — 28th most in 66 years (43,381,000 total)
> Moved within same county: 10.6% of pop. (25,726,000 total)
> Moved to a new county in-state: 3.3% of pop. (8,061,000 total)
> Moved to a new state: 3.3% of pop. (8,033,000 total)

1990-1991
> Pct. 1 yr. and older who moved: 17.0% of pop. — 35th most in 66 years (41,539,000 total)
> Moved within same county: 10.3% of pop. (25,151,000 total)
> Moved to a new county in-state: 3.2% of pop. (7,881,000 total)
> Moved to a new state: 2.9% of pop. (7,122,000 total)
1991-1992
> Pct. 1 yr. and older who moved: 17.3% of pop. — 32nd most in 66 years (42,800,000 total)
> Moved within same county: 10.7% of pop. (26,587,000 total)
> Moved to a new county in-state: 3.2% of pop. (7,853,000 total)
> Moved to a new state: 2.9% of pop. (7,105,000 total)
[in-text-ad-2]

1992-1993
> Pct. 1 yr. and older who moved: 17.0% of pop. — 35th most in 66 years (43,099,000 total)
> Moved within same county: 10.7% of pop. (26,932,000 total)
> Moved to a new county in-state: 3.1% of pop. (7,855,000 total)
> Moved to a new state: 2.7% of pop. (6,916,000 total)
1993-1994
> Pct. 1 yr. and older who moved: 16.7% of pop. — 38th most in 66 years (42,835,000 total)
> Moved within same county: 10.4% of pop. (26,638,000 total)
> Moved to a new county in-state: 3.2% of pop. (8,226,000 total)
> Moved to a new state: 2.6% of pop. (6,726,000 total)

1994-1995
> Pct. 1 yr. and older who moved: 16.4% of pop. — 41st most in 66 years (42,317,000 total)
> Moved within same county: 10.8% of pop. (27,908,000 total)
> Moved to a new county in-state: 3.1% of pop. (7,888,000 total)
> Moved to a new state: 2.2% of pop. (5,743,000 total)

1995-1996
> Pct. 1 yr. and older who moved: 16.3% of pop. — 42nd most in 66 years (42,537,000 total)
> Moved within same county: 10.3% of pop. (26,696,000 total)
> Moved to a new county in-state: 3.1% of pop. (8,009,000 total)
> Moved to a new state: 2.5% of pop. (6,471,000 total)
[in-text-ad]

1996-1997
> Pct. 1 yr. and older who moved: 16.5% of pop. — 40th most in 66 years (43,391,000 total)
> Moved within same county: 10.5% of pop. (27,740,000 total)
> Moved to a new county in-state: 3.0% of pop. (7,960,000 total)
> Moved to a new state: 2.4% of pop. (6,389,000 total)

1997-1998
> Pct. 1 yr. and older who moved: 16.0% of pop. — 44th most in 66 years (42,507,000 total)
> Moved within same county: 10.2% of pop. (27,082,000 total)
> Moved to a new county in-state: 3.0% of pop. (7,867,000 total)
> Moved to a new state: 2.4% of pop. (6,355,000 total)

1998-1999
> Pct. 1 yr. and older who moved: 15.9% of pop. — 45th most in 66 years (42,636,000 total)
> Moved within same county: 9.4% of pop. (25,268,000 total)
> Moved to a new county in-state: 3.1% of pop. (8,423,000 total)
> Moved to a new state: 2.8% of pop. (7,516,000 total)
[recirclink id=931299]

1999-2000
> Pct. 1 yr. and older who moved: 16.1% of pop. — 43rd most in 66 years (43,388,000 total)
> Moved within same county: 9.0% of pop. (24,399,000 total)
> Moved to a new county in-state: 3.3% of pop. (8,814,000 total)
> Moved to a new state: 3.1% of pop. (8,428,000 total)
2000-2001
> Pct. 1 yr. and older who moved: 14.2% of pop. — 47th most in 66 years (39,007,000 total)
> Moved within same county: 8.0% of pop. (21,918,000 total)
> Moved to a new county in-state: 2.7% of pop. (7,550,000 total)
> Moved to a new state: 2.8% of pop. (7,783,000 total)
2001-2002
> Pct. 1 yr. and older who moved: 14.8% of pop. — 46th most in 66 years (41,111,000 total)
> Moved within same county: 8.5% of pop. (23,712,000 total)
> Moved to a new county in-state: 2.9% of pop. (8,066,000 total)
> Moved to a new state: 2.8% of pop. (7,770,000 total)
[in-text-ad-2]
2002-2003
> Pct. 1 yr. and older who moved: 14.2% of pop. — 47th most in 66 years (40,093,000 total)
> Moved within same county: 8.3% of pop. (23,468,000 total)
> Moved to a new county in-state: 2.7% of pop. (7,728,000 total)
> Moved to a new state: 2.7% of pop. (7,628,000 total)
2003-2004
> Pct. 1 yr. and older who moved: 13.7% of pop. — 50th most in 66 years (38,995,000 total)
> Moved within same county: 7.9% of pop. (22,551,000 total)
> Moved to a new county in-state: 2.8% of pop. (7,842,000 total)
> Moved to a new state: 2.6% of pop. (7,330,000 total)

2004-2005
> Pct. 1 yr. and older who moved: 13.9% of pop. — 49th most in 66 years (39,888,000 total)
> Moved within same county: 7.9% of pop. (22,736,000 total)
> Moved to a new county in-state: 2.7% of pop. (7,847,000 total)
> Moved to a new state: 2.6% of pop. (7,441,000 total)
2005-2006
> Pct. 1 yr. and older who moved: 13.7% of pop. — 50th most in 66 years (39,837,000 total)
> Moved within same county: 8.6% of pop. (24,851,000 total)
> Moved to a new county in-state: 2.8% of pop. (8,010,000 total)
> Moved to a new state: 2.0% of pop. (5,679,000 total)
[in-text-ad]

2006-2007
> Pct. 1 yr. and older who moved: 13.2% of pop. — 52nd most in 66 years (38,681,000 total)
> Moved within same county: 8.6% of pop. (25,192,000 total)
> Moved to a new county in-state: 2.5% of pop. (7,436,000 total)
> Moved to a new state: 1.7% of pop. (4,862,000 total)

2007-2008
> Pct. 1 yr. and older who moved: 11.9% of pop. — 56th most in 66 years (35,167,000 total)
> Moved within same county: 7.8% of pop. (23,013,000 total)
> Moved to a new county in-state: 2.1% of pop. (6,282,000 total)
> Moved to a new state: 1.6% of pop. (4,728,000 total)
2008-2009
> Pct. 1 yr. and older who moved: 12.5% of pop. — 53rd most in 66 years (37,105,000 total)
> Moved within same county: 8.4% of pop. (24,984,000 total)
> Moved to a new county in-state: 2.1% of pop. (6,374,000 total)
> Moved to a new state: 1.6% of pop. (4,660,000 total)
[recirclink id=942076]
2009-2010
> Pct. 1 yr. and older who moved: 12.5% of pop. — 53rd most in 66 years (37,445,000 total)
> Moved within same county: 8.6% of pop. (25,910,000 total)
> Moved to a new county in-state: 2.1% of pop. (6,227,000 total)
> Moved to a new state: 1.4% of pop. (4,323,000 total)

2010-2011
> Pct. 1 yr. and older who moved: 11.6% of pop. — 58th most in 66 years (35,038,000 total)
> Moved within same county: 7.7% of pop. (23,330,000 total)
> Moved to a new county in-state: 1.9% of pop. (5,868,000 total)
> Moved to a new state: 1.6% of pop. (4,756,000 total)

2011-2012
> Pct. 1 yr. and older who moved: 12.0% of pop. — 55th most in 66 years (36,488,000 total)
> Moved within same county: 7.7% of pop. (23,493,000 total)
> Moved to a new county in-state: 2.2% of pop. (6,782,000 total)
> Moved to a new state: 1.7% of pop. (5,059,000 total)
[in-text-ad-2]

2012-2013
> Pct. 1 yr. and older who moved: 11.7% of pop. — 57th most in 66 years (35,918,000 total)
> Moved within same county: 7.5% of pop. (23,150,000 total)
> Moved to a new county in-state: 2.3% of pop. (6,961,000 total)
> Moved to a new state: 1.6% of pop. (4,770,000 total)

2013-2014
> Pct. 1 yr. and older who moved: 11.5% of pop. — 60th most in 66 years (35,681,000 total)
> Moved within same county: 7.6% of pop. (23,436,000 total)
> Moved to a new county in-state: 2.1% of pop. (6,446,000 total)
> Moved to a new state: 1.5% of pop. (4,666,000 total)

2014-2015
> Pct. 1 yr. and older who moved: 11.6% of pop. — 58th most in 66 years (36,324,000 total)
> Moved within same county: 7.3% of pop. (22,905,000 total)
> Moved to a new county in-state: 2.1% of pop. (6,653,000 total)
> Moved to a new state: 1.6% of pop. (5,093,000 total)

2015-2016
> Pct. 1 yr. and older who moved: 11.2% of pop. — 61st most in 66 years (35,138,000 total)
> Moved within same county: 6.9% of pop. (21,588,000 total)
> Moved to a new county in-state: 2.4% of pop. (7,501,000 total)
> Moved to a new state: 1.5% of pop. (4,768,000 total)
[in-text-ad]

2016-2017
> Pct. 1 yr. and older who moved: 11.0% of pop. — 62nd most in 66 years (34,902,000 total)
> Moved within same county: 6.8% of pop. (21,614,000 total)
> Moved to a new county in-state: 2.1% of pop. (6,668,000 total)
> Moved to a new state: 1.7% of pop. (5,366,000 total)
[recirclink id=968127]

2017-2018
> Pct. 1 yr. and older who moved: 10.1% of pop. — 63rd most in 66 years (32,352,000 total)
> Moved within same county: 6.2% of pop. (19,852,000 total)
> Moved to a new county in-state: 2.0% of pop. (6,496,000 total)
> Moved to a new state: 1.5% of pop. (4,838,000 total)

2018-2019
> Pct. 1 yr. and older who moved: 9.8% of pop. — 64th most in 66 years (31,371,000 total)
> Moved within same county: 5.9% of pop. (18,833,000 total)
> Moved to a new county in-state: 2.1% of pop. (6,663,000 total)
> Moved to a new state: 1.5% of pop. (4,738,000 total)
[in-text-ad-2]

2019-2020
> Pct. 1 yr. and older who moved: 9.3% of pop. — 65th most in 66 years (29,780,000 total)
> Moved within same county: 5.4% of pop. (17,522,000 total)
> Moved to a new county in-state: 2.2% of pop. (7,059,000 total)
> Moved to a new state: 1.3% of pop. (4,233,000 total)
2020-2021
> Pct. 1 yr. and older who moved: 8.4% of pop. — 66th most in 66 years (27,059,000 total)
> Moved within same county: 4.9% of pop. (15,805,000 total)
> Moved to a new county in-state: 1.9% of pop. (6,270,000 total)
> Moved to a new state: 1.4% of pop. (4,374,000 total)
Contact [email protected] for any questions or corrections.