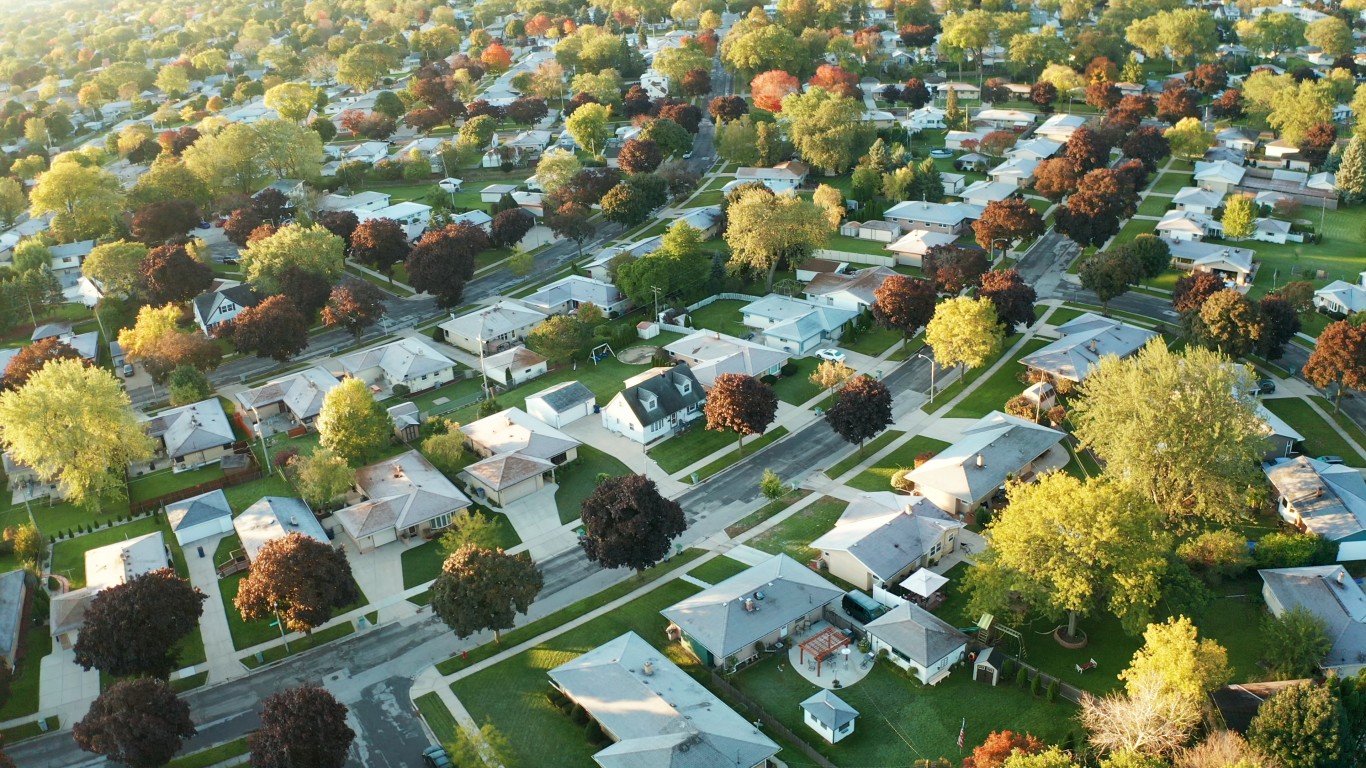
Spanning nearly 3.8 million square miles and home to over 335 million people, the United States is the third largest country in the world by both landmass and population. And while the standard of living across the U.S. as a whole compares favorably to much of the world, in a country this large, some places are far more desirable than others.
Overall quality of life is somewhat subjective. But within any given community, factors related to the local economy, public health and safety, and access to culture and entertainment can all make a meaningful difference. To be sure, data from the U.S. Census Bureau shows that nearly 40% of the 28.2 million Americans who moved in 2022 did so to either take or find a new job, have a better or more affordable home, live in a safer neighborhood, or for health reasons. (This is how big a house you can buy for $200,000 in every state.)
Many of the elements that can contribute to, or detract from, quality of life, are quantifiable – and when taken together they offer a more objective measure of the best places to live in the United States.
Using data from the Census Bureau, the FBI, and the Centers for Disease Control and Prevention, 24/7 Wall St. created a weighted index of 22 measures to identify the 50 best U.S. cities to live in. The measures used in the index fall into one of three broad categories: economy, community, and overall quality of life. We considered all places in the U.S. with sufficient data and populations of at least 5,000. Our list includes cities, towns, villages, boroughs, and unincorporated communities. To avoid geographic clustering, we only considered the top-ranking place in a given county.
Generally, the places on this list tend to have low crime rates, thriving economies, and relatively financially secure populations. A majority of residents of most of these communities also typically have easy access to quality health care, public parks and recreation facilities, as well as to entertainment and cultural attractions such as bars, restaurants, theaters, and museums.
The largest share of the best places to live are in the West, including 11 in California alone. The Northeast is home to 17 of these communities, including seven in New Jersey and four in Massachusetts.
While some of the places on this list are large cities with hundreds of thousands of residents, most are relatively small, with populations of less than 30,000. Still, many of these smaller communities are within commuting distance of major cities like Chicago, Miami, New York, and Washington D.C. (Here is a look at America’s richest cities.)
Click here to see the best cities to live, according to data.
Click here to read our detailed methodology.

50. Boulder, Colorado
> Median home value: $790,100
> Median household income: $74,902
> Population with access to exercise opportunities: 95.0%
> Recreational establishments: 18.3 per 10,000 businesses
> Total population: 104,930
[in-text-ad]

49. North Oaks, Minnesota
> Median home value: $696,800
> Median household income: $220,861
> Population with access to exercise opportunities: 99.8%
> Recreational establishments: 38.9 per 10,000 businesses
> Total population: 5,204
 24/7 Wall St.
48. Coto de Caza, California
> Median home value: $1,165,200
> Median household income: $210,990
> Population with access to exercise opportunities: 99.1%
> Recreational establishments: 17.2 per 10,000 businesses
> Total population: 15,873
Source: davidwoodberry / iStock via Getty Images
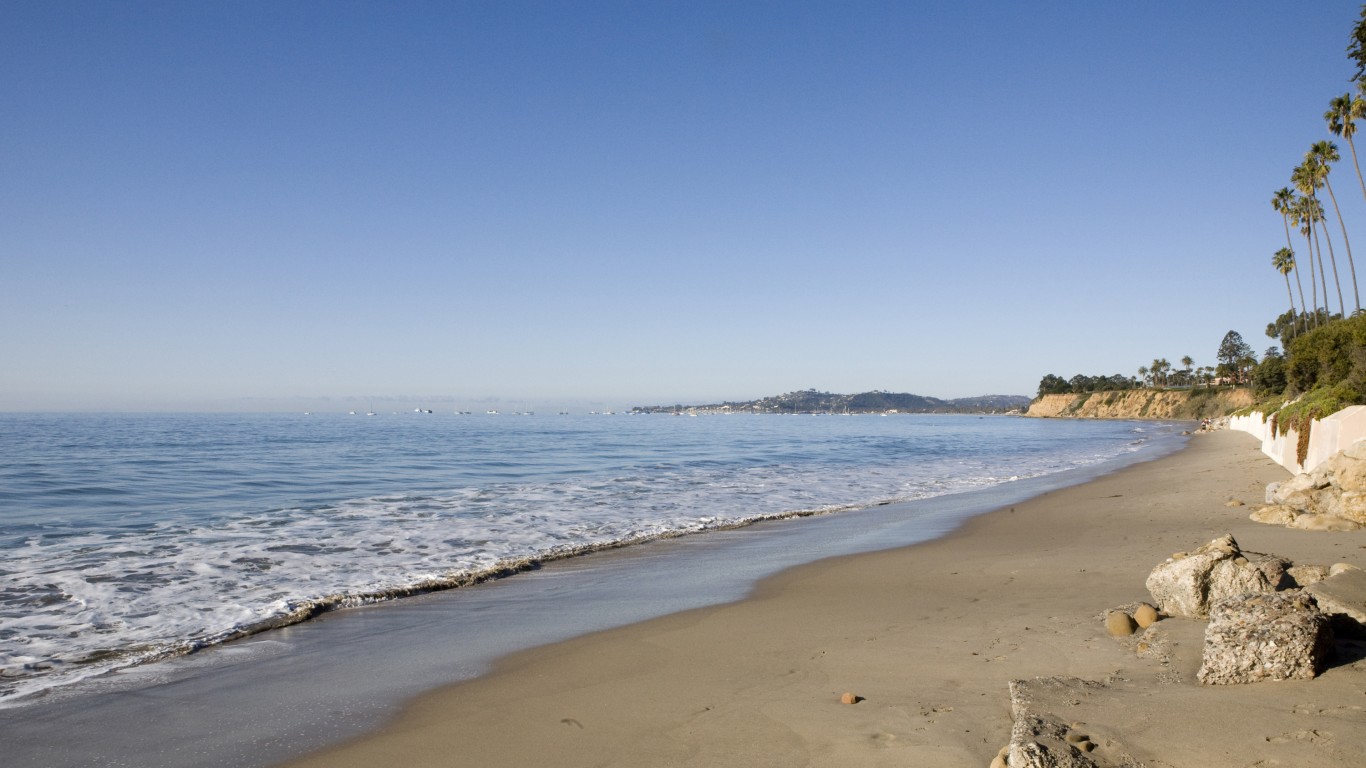
47. Montecito, California
> Median home value: $2,000,000+
> Median household income: $193,423
> Population with access to exercise opportunities: 96.1%
> Recreational establishments: 49.5 per 10,000 businesses
> Total population: 8,494
[in-text-ad-2]

Source: vwalakte / iStock via Getty Images
46. Key West, Florida
> Median home value: $728,500
> Median household income: $75,638
> Population with access to exercise opportunities: 80.6%
> Recreational establishments: 179.6 per 10,000 businesses
> Total population: 26,776

Source: lucky-photographer / iStock via Getty Images
45. Key Biscayne, Florida
> Median home value: $1,246,700
> Median household income: $167,990
> Population with access to exercise opportunities: 98.5%
> Recreational establishments: 18.1 per 10,000 businesses
> Total population: 14,530
[in-text-ad]

44. Fox Chapel, Pennsylvania
> Median home value: $769,300
> Median household income: $247,930
> Population with access to exercise opportunities: 92.9%
> Recreational establishments: 47.1 per 10,000 businesses
> Total population: 5,314

43. Bellaire, Texas
> Median home value: $857,900
> Median household income: $211,202
> Population with access to exercise opportunities: 91.0%
> Recreational establishments: 17.1 per 10,000 businesses
> Total population: 17,262

42. St. Helena, California
> Median home value: $1,370,500
> Median household income: $122,348
> Population with access to exercise opportunities: 95.2%
> Recreational establishments: 27.2 per 10,000 businesses
> Total population: 5,530
[in-text-ad-2]

41. Druid Hills, Georgia
> Median home value: $698,000
> Median household income: $137,576
> Population with access to exercise opportunities: 88.5%
> Recreational establishments: 12.4 per 10,000 businesses
> Total population: 8,611

40. Fairwood, Maryland
> Median home value: $588,600
> Median household income: $177,315
> Population with access to exercise opportunities: 97.3%
> Recreational establishments: 11.8 per 10,000 businesses
> Total population: 7,453
[in-text-ad]
Source: aimintang / iStock Unreleased via Getty Images
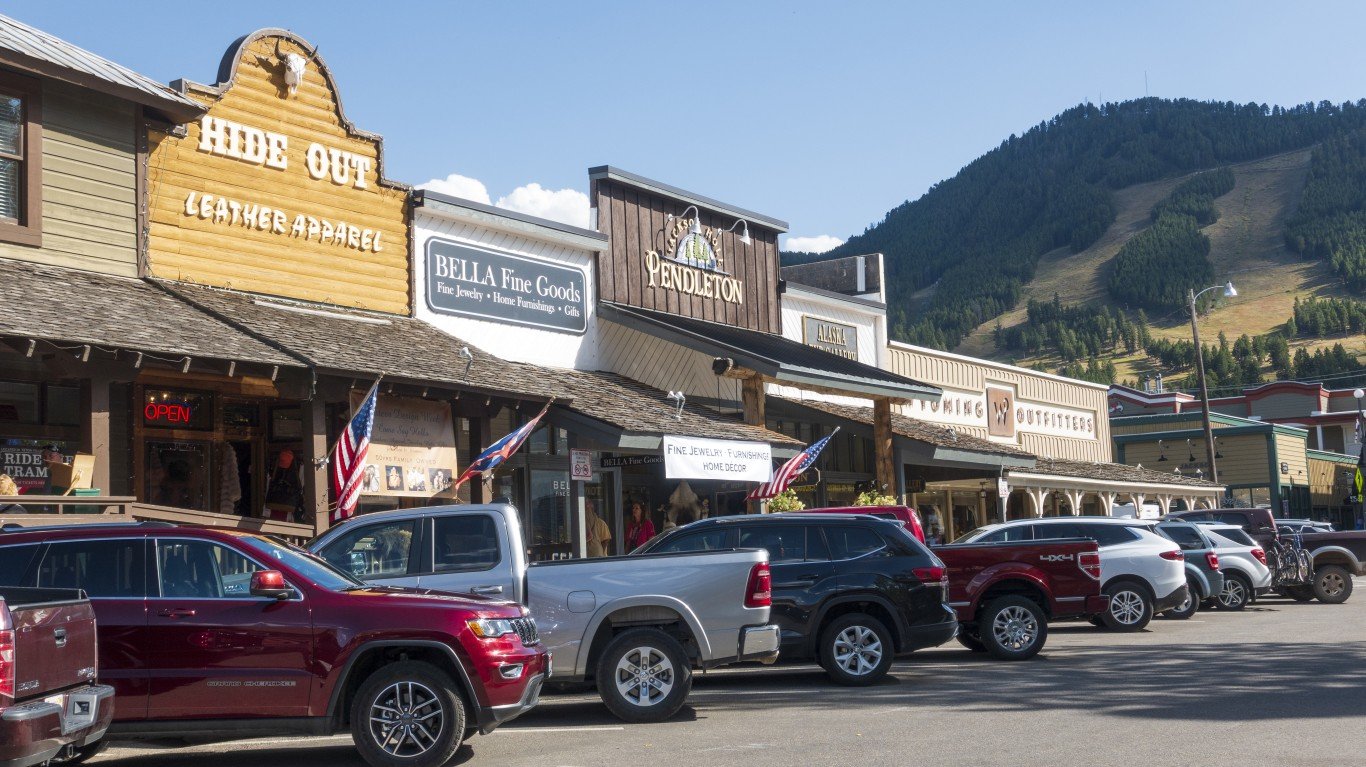
39. Jackson, Wyoming
> Median home value: $836,300
> Median household income: $83,289
> Population with access to exercise opportunities: 97.7%
> Recreational establishments: 51.2 per 10,000 businesses
> Total population: 10,728

38. Southlake, Texas
> Median home value: $723,800
> Median household income: $239,833
> Population with access to exercise opportunities: 94.6%
> Recreational establishments: 19.6 per 10,000 businesses
> Total population: 30,754
Source: jorgeantonio / iStock via Getty Images
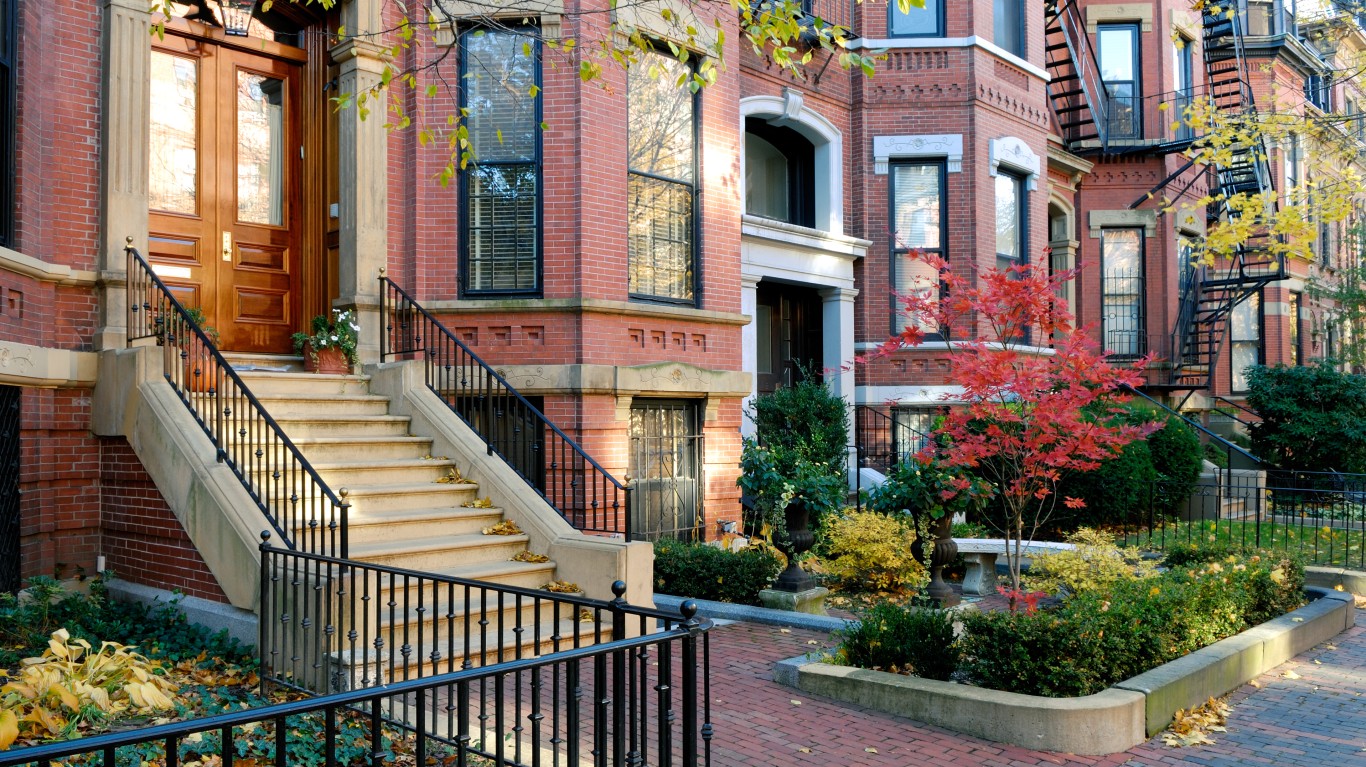
37. Boston, Massachusetts
> Median home value: $610,400
> Median household income: $81,744
> Population with access to exercise opportunities: 99.8%
> Recreational establishments: 31.2 per 10,000 businesses
> Total population: 672,814
[in-text-ad-2]
Source: DenisTangneyJr / iStock via Getty Images
36. Hingham, Massachusetts
> Median home value: $1,020,600
> Median household income: $206,384
> Population with access to exercise opportunities: 91.5%
> Recreational establishments: 59.4 per 10,000 businesses
> Total population: 5,557

35. Merion Station, Pennsylvania
> Median home value: $693,800
> Median household income: $233,340
> Population with access to exercise opportunities: 96.4%
> Recreational establishments: 38.7 per 10,000 businesses
> Total population: 5,369
[in-text-ad]
Source: Tomsmith585 / iStock Unreleased via Getty Images
34. Westfield, New Jersey
> Median home value: $810,400
> Median household income: $185,319
> Population with access to exercise opportunities: 99.8%
> Recreational establishments: 16.4 per 10,000 businesses
> Total population: 30,950

33. Chatham, New Jersey
> Median home value: $827,900
> Median household income: $209,283
> Population with access to exercise opportunities: 98.5%
> Recreational establishments: 33.1 per 10,000 businesses
> Total population: 9,208

32. Laie, Hawaii
> Median home value: $937,000
> Median household income: $101,011
> Population with access to exercise opportunities: 97.3%
> Recreational establishments: 33.4 per 10,000 businesses
> Total population: 6,436
[in-text-ad-2]

Source: Jonathan Ross / iStock via Getty Images
31. Aspen, Colorado
> Median home value: N/A
> Median household income: $89,625
> Population with access to exercise opportunities: 94.6%
> Recreational establishments: N/A
> Total population: 7,019

30. Ridgewood, New Jersey
> Median home value: $789,900
> Median household income: $194,256
> Population with access to exercise opportunities: 99.5%
> Recreational establishments: 9.5 per 10,000 businesses
> Total population: 25,991
[in-text-ad]

Source: Focqus, LLC / iStock via Getty Images
29. Paradise Valley, Arizona
> Median home value: $1,778,000
> Median household income: $203,659
> Population with access to exercise opportunities: 92.7%
> Recreational establishments: 25.6 per 10,000 businesses
> Total population: 12,666

Source: bpperry / iStock via Getty Images
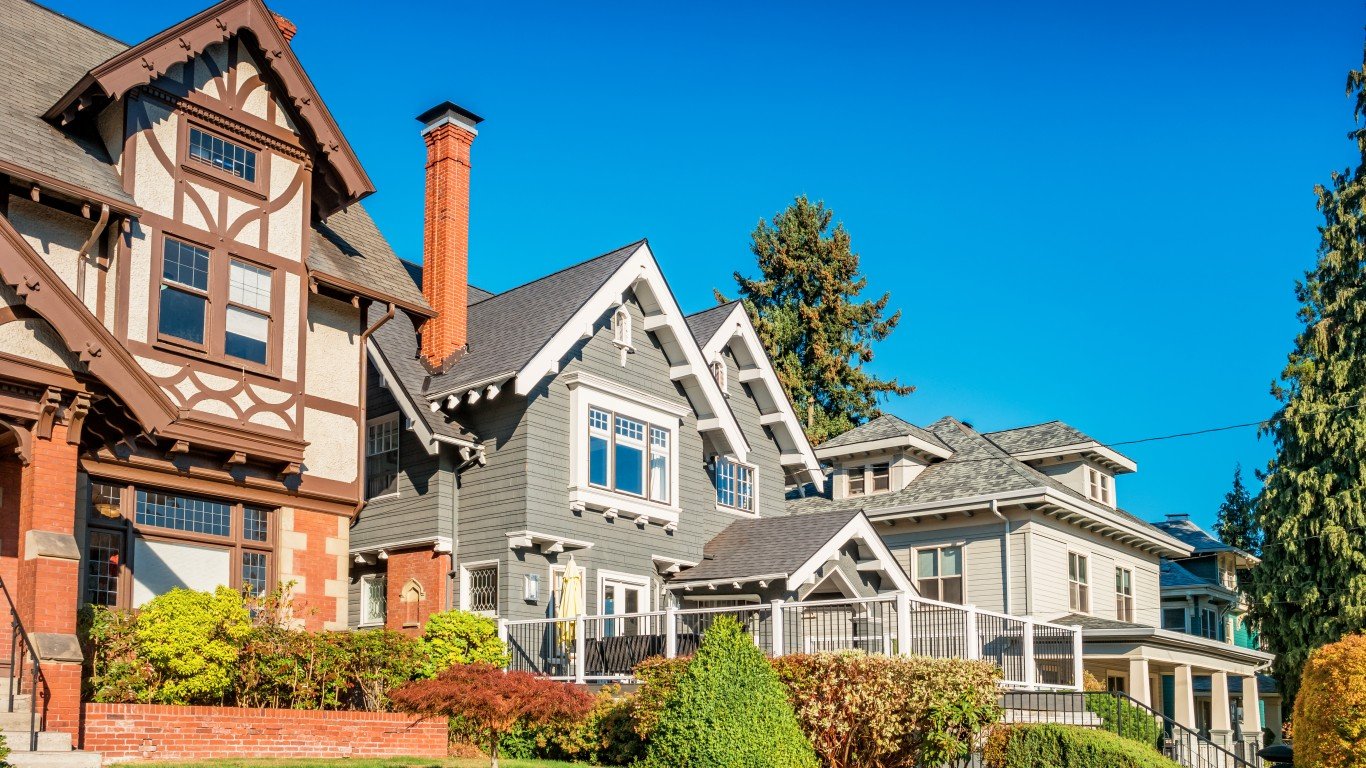
28. Bainbridge Island, Washington
> Median home value: $852,700
> Median household income: $145,475
> Population with access to exercise opportunities: 86.8%
> Recreational establishments: 43.8 per 10,000 businesses
> Total population: 24,557

Source: Joseph Trentacosti / iStock via Getty Images
27. Garden City, New York
> Median home value: $881,200
> Median household income: $185,188
> Population with access to exercise opportunities: 99.2%
> Recreational establishments: 30.1 per 10,000 businesses
> Total population: 23,087
[in-text-ad-2]

Source: SeanPavonePhoto / iStock via Getty Images
26. Arlington, Virginia
> Median home value: $755,800
> Median household income: $128,145
> Population with access to exercise opportunities: 100.0%
> Recreational establishments: 19.0 per 10,000 businesses
> Total population: 235,764
Source: P_Wei / E+ via Getty Images
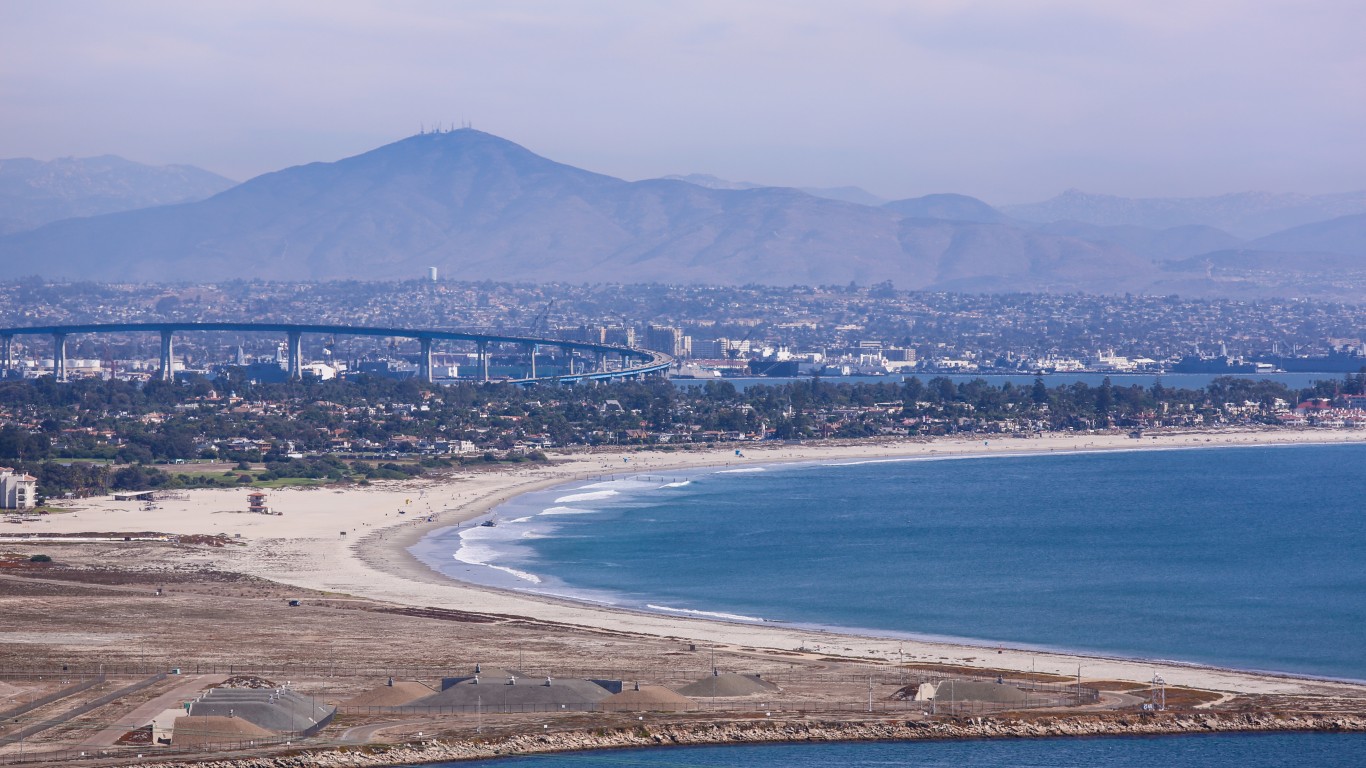
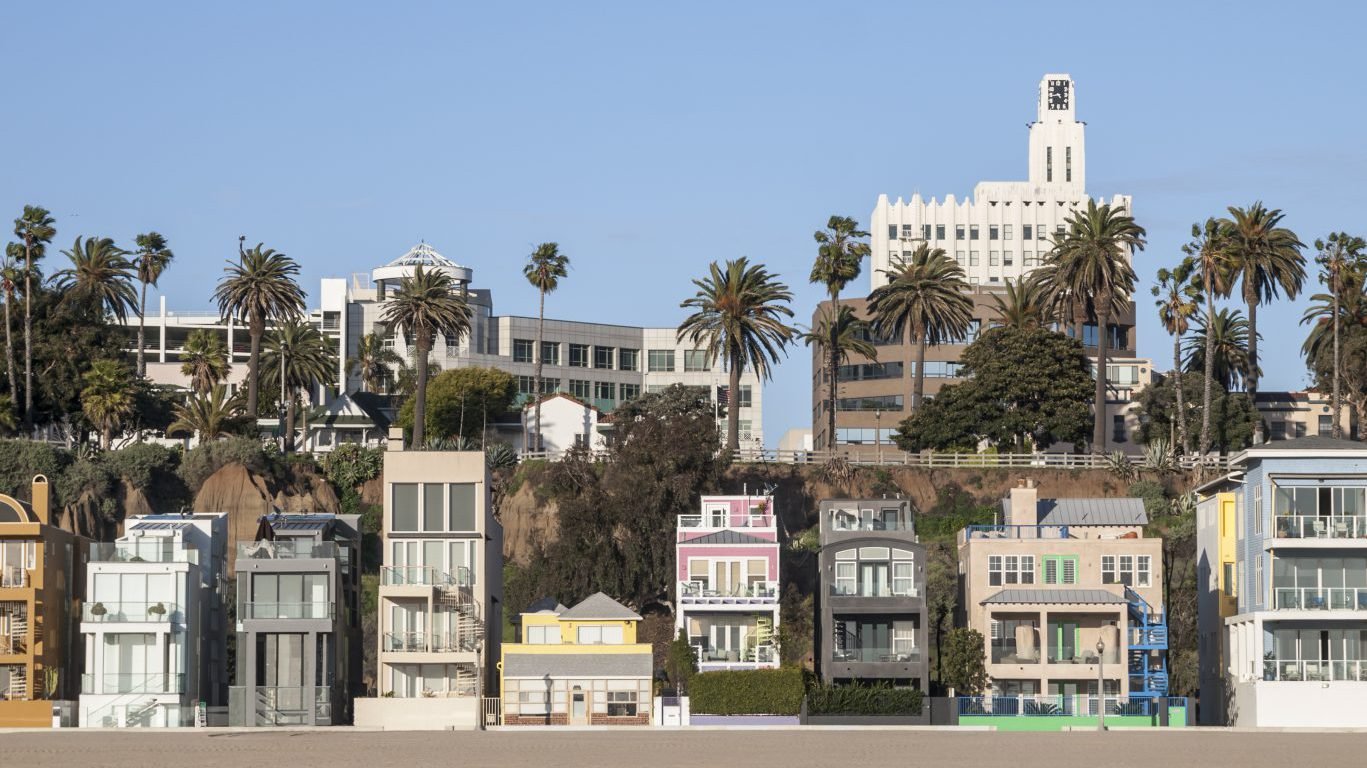
25. Coronado, California
> Median home value: $1,656,900
> Median household income: $114,559
> Population with access to exercise opportunities: 97.7%
> Recreational establishments: 25.7 per 10,000 businesses
> Total population: 20,627
[in-text-ad]

24. La Cañada Flintridge, California
> Median home value: $1,671,400
> Median household income: $187,384
> Population with access to exercise opportunities: 97.9%
> Recreational establishments: 22.1 per 10,000 businesses
> Total population: 20,613
Source: BSPollard / Getty Images
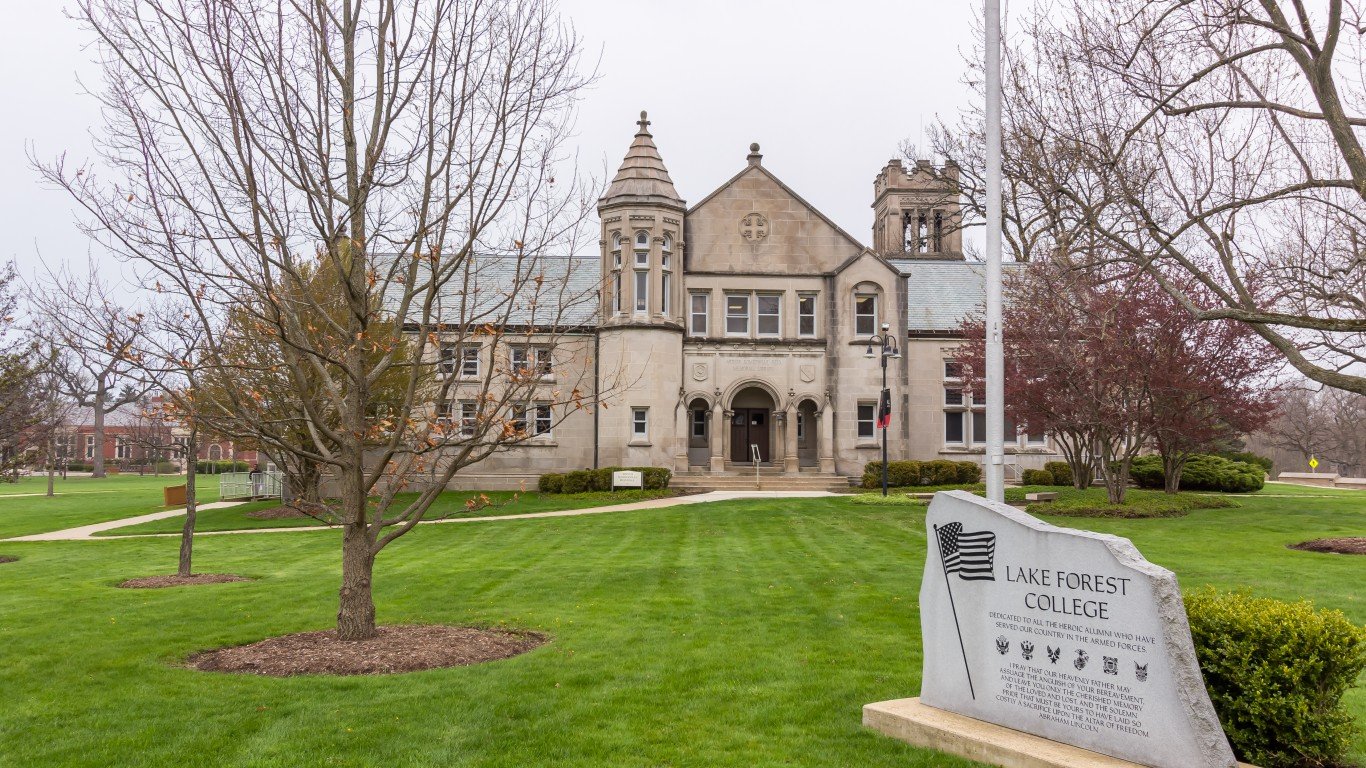
23. Lake Forest, Illinois
> Median home value: $812,900
> Median household income: $194,267
> Population with access to exercise opportunities: 97.8%
> Recreational establishments: 40.8 per 10,000 businesses
> Total population: 19,450

Source: cmart7327 / iStock via Getty Images
22. New York, New York
> Median home value: $660,700
> Median household income: $70,663
> Population with access to exercise opportunities: 98.9%
> Recreational establishments: 14.4 per 10,000 businesses
> Total population: 8,736,047
[in-text-ad-2]

Source: lucentius / iStock Unreleased via Getty Images
21. Berkeley, California
> Median home value: $1,111,000
> Median household income: $97,834
> Population with access to exercise opportunities: 99.4%
> Recreational establishments: 26.3 per 10,000 businesses
> Total population: 119,607

Source: Sean Pavone / iStock via Getty Images
20. Cambridge, Massachusetts
> Median home value: $888,000
> Median household income: $112,565
> Population with access to exercise opportunities: 97.1%
> Recreational establishments: 27.8 per 10,000 businesses
> Total population: 116,892
[in-text-ad]

Source: Coast-to-Coast / iStock via Getty Images
19. Chevy Chase, Maryland
> Median home value: $999,200
> Median household income: $207,971
> Population with access to exercise opportunities: 99.8%
> Recreational establishments: 21.8 per 10,000 businesses
> Total population: 9,889
 24/7 Wall St.
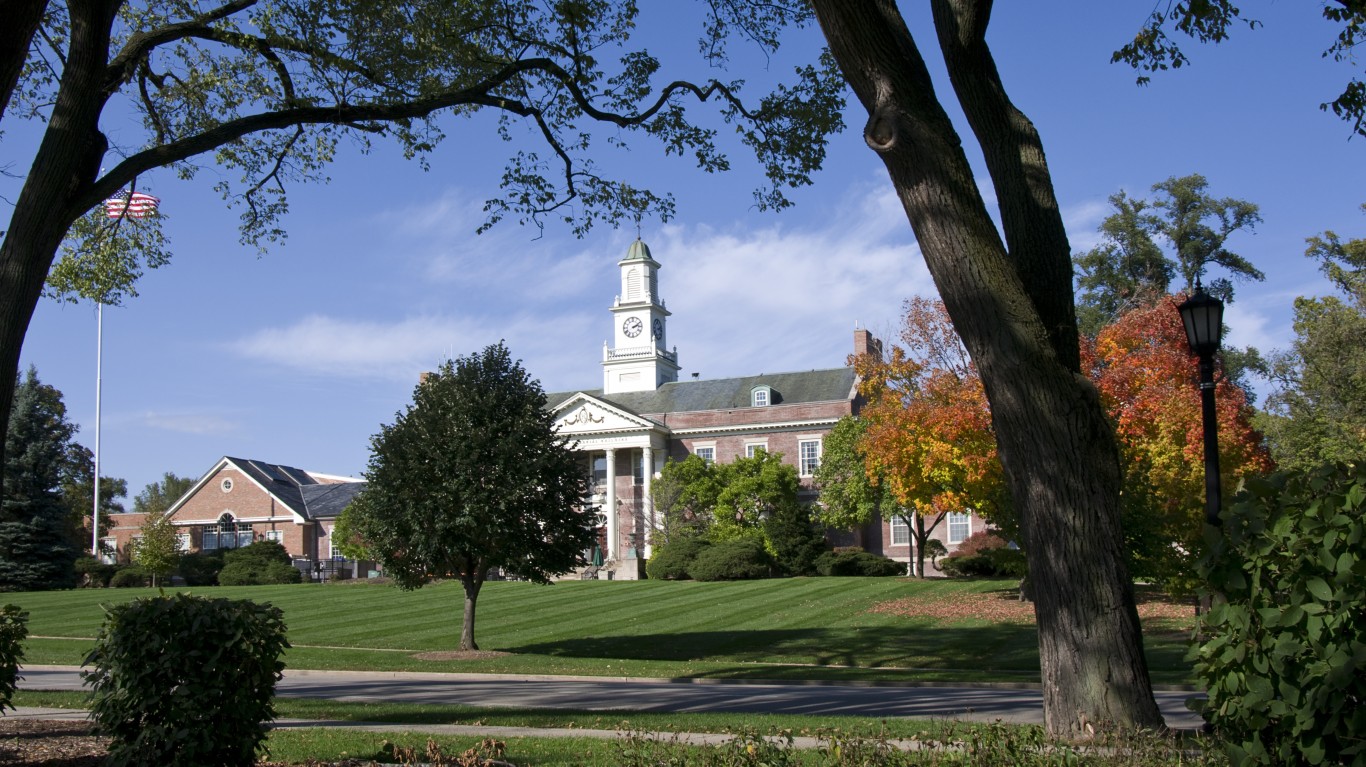
Source: jferrer / iStock via Getty Images
18. Hinsdale, Illinois
> Median home value: $880,100
> Median household income: $224,185
> Population with access to exercise opportunities: 99.7%
> Recreational establishments: 18.8 per 10,000 businesses
> Total population: 17,148

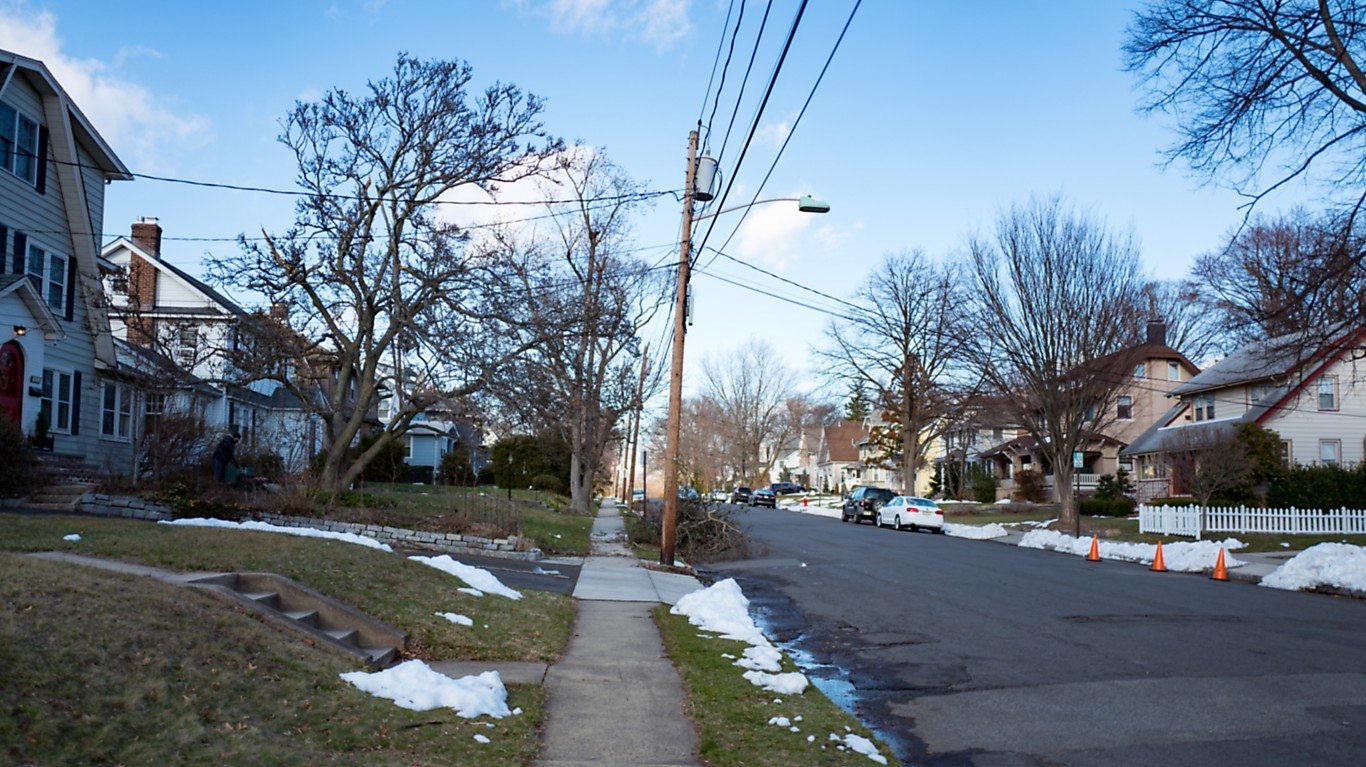
17. Upper Montclair, New Jersey
> Median home value: $797,400
> Median household income: $235,637
> Population with access to exercise opportunities: 99.7%
> Recreational establishments: 21.4 per 10,000 businesses
> Total population: 12,033
[in-text-ad-2]
Source: aimintang / E+ via Getty Images
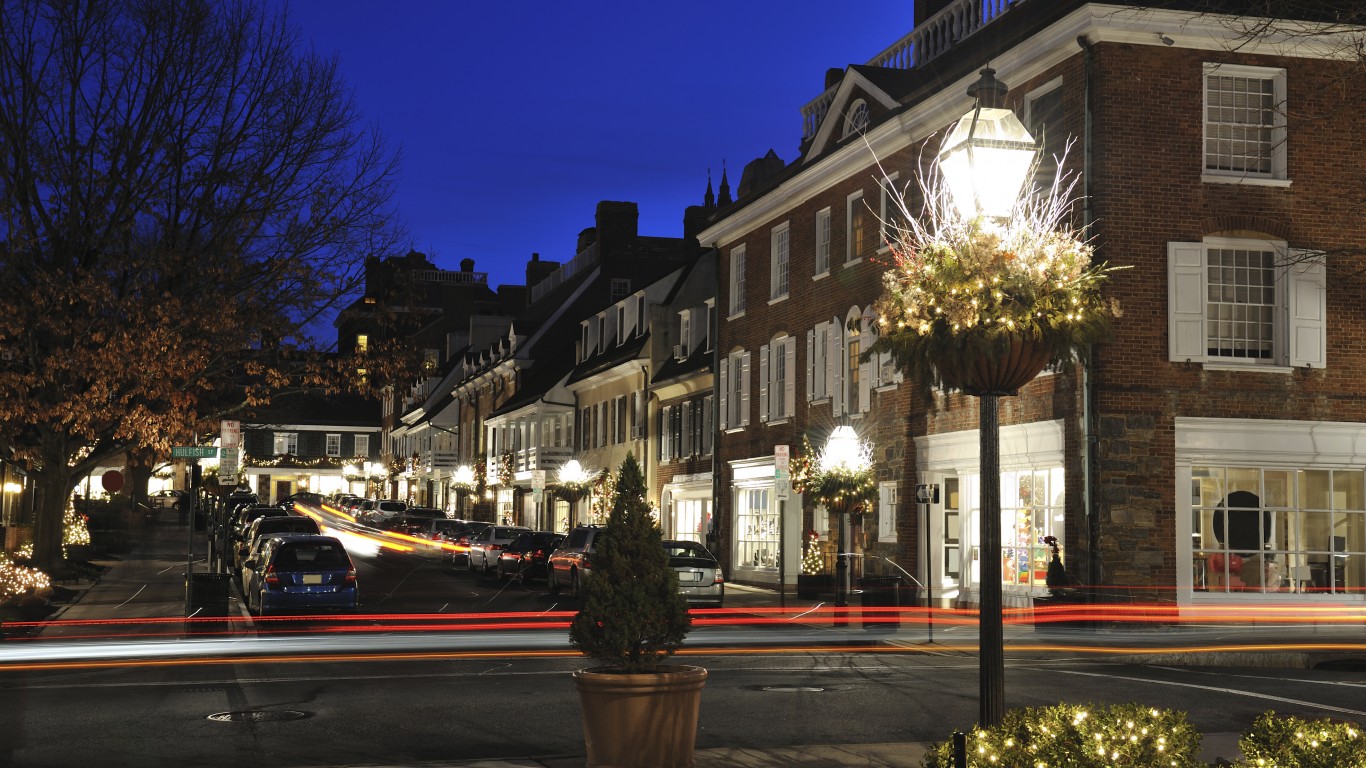
16. Princeton, New Jersey
> Median home value: $893,600
> Median household income: $165,149
> Population with access to exercise opportunities: 99.4%
> Recreational establishments: 22.7 per 10,000 businesses
> Total population: 30,717
Source: krblokhin / iStock Editorial via Getty Images
15. Falls Church, Virginia
> Median home value: $838,300
> Median household income: $155,071
> Population with access to exercise opportunities: 100.0%
> Recreational establishments: 0.0 per 10,000 businesses
> Total population: 14,494
[in-text-ad]

14. Glencoe, Illinois
> Median home value: $1,101,200
> Median household income: $212,132
> Population with access to exercise opportunities: 99.3%
> Recreational establishments: 24.6 per 10,000 businesses
> Total population: 8,824
Source: Sundry Photography / iStock Editorial via Getty Images
13. Mountain View, California
> Median home value: $1,613,300
> Median household income: $158,104
> Population with access to exercise opportunities: 99.5%
> Recreational establishments: 21.9 per 10,000 businesses
> Total population: 82,409

Source: Geoffrey Thiel / iStock via Getty Images
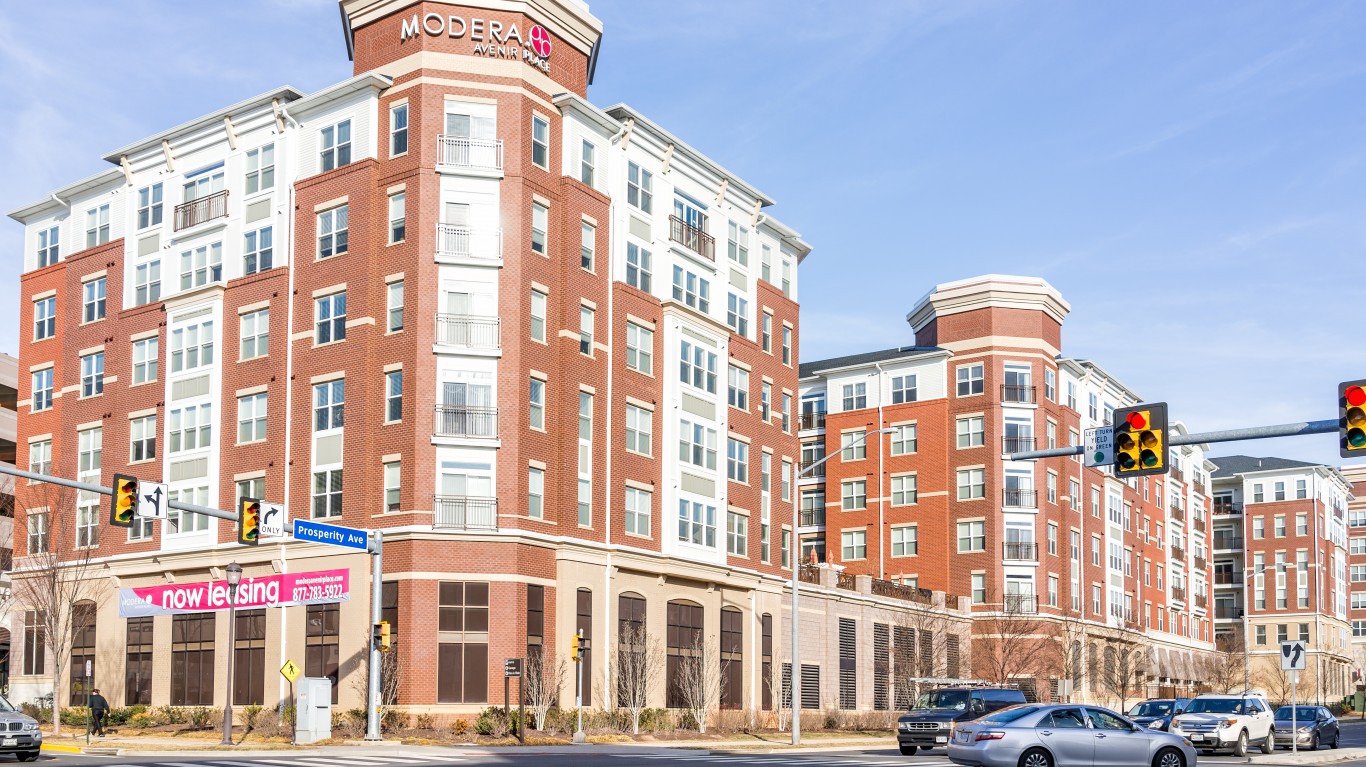
12. McLean, Virginia
> Median home value: $1,102,100
> Median household income: $242,610
> Population with access to exercise opportunities: 99.7%
> Recreational establishments: 14.8 per 10,000 businesses
> Total population: 49,310
[in-text-ad-2]

Source: hermosawave / iStock via Getty Images
11. Mercer Island, Washington
> Median home value: $1,504,500
> Median household income: $170,000
> Population with access to exercise opportunities: 98.0%
> Recreational establishments: 30.4 per 10,000 businesses
> Total population: 25,506
Source: James Andrews / iStock via Getty Images
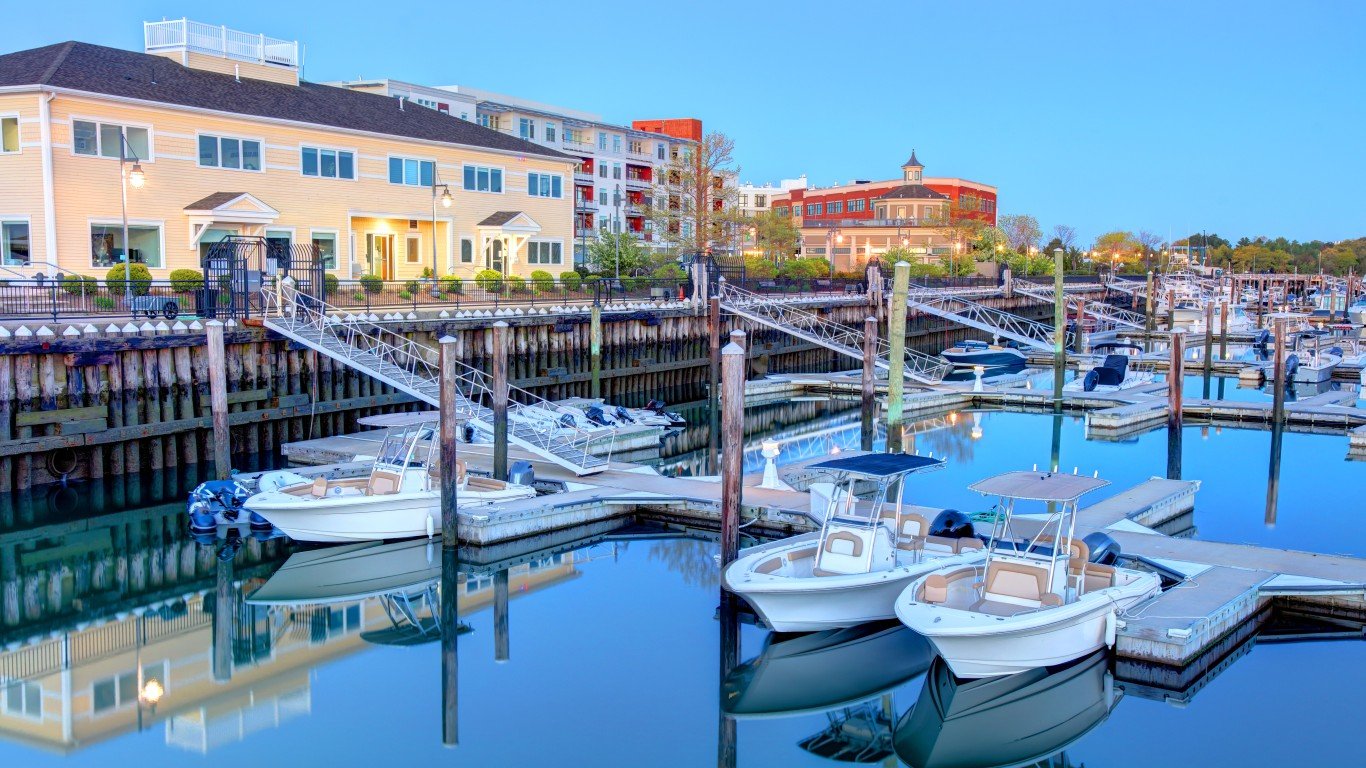
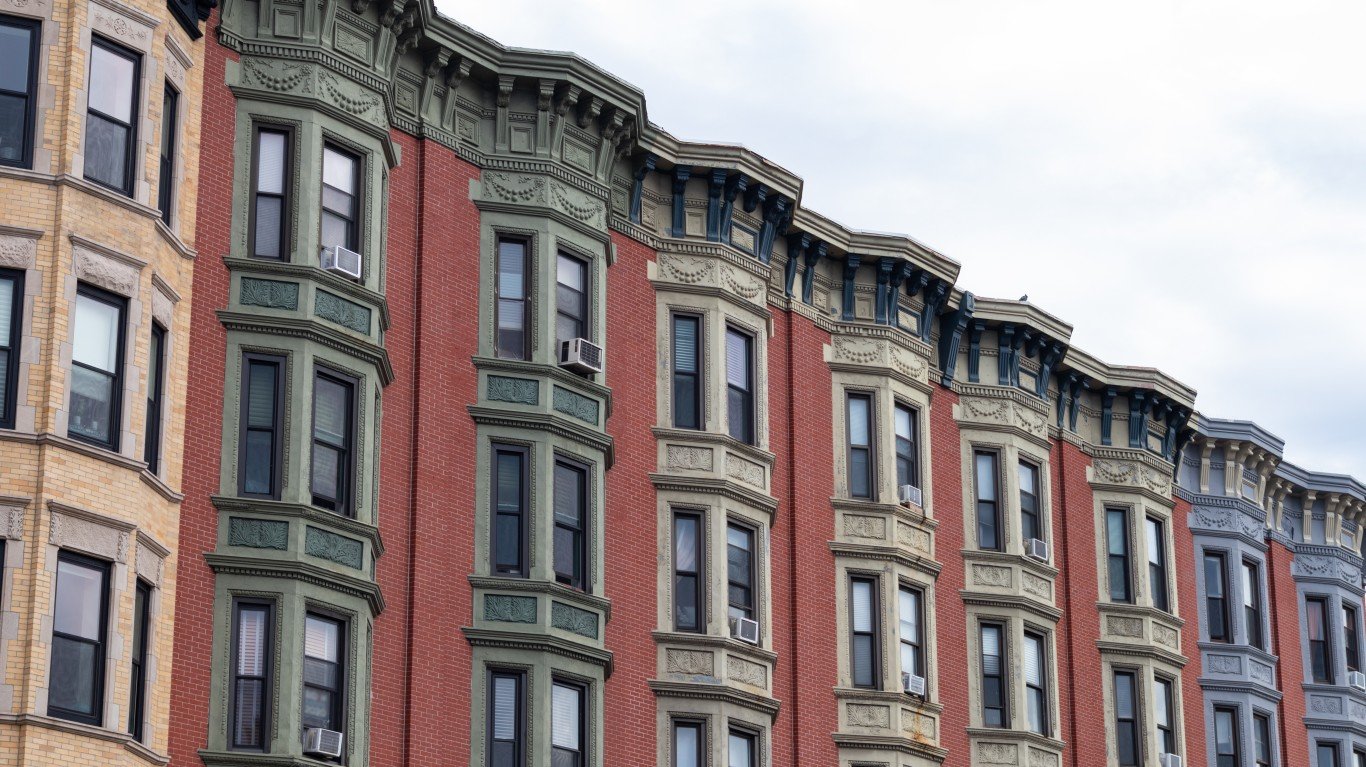
10. Hoboken, New Jersey
> Median home value: $777,600
> Median household income: $160,890
> Population with access to exercise opportunities: 100.0%
> Recreational establishments: 14.4 per 10,000 businesses
> Total population: 59,369
[in-text-ad]

9. Rumson, New Jersey
> Median home value: $1,309,200
> Median household income: $239,188
> Population with access to exercise opportunities: 96.0%
> Recreational establishments: 42.9 per 10,000 businesses
> Total population: 7,292
 24/7 Wall St.
Source: aimintang / iStock via Getty Images
8. Wellesley, Massachusetts
> Median home value: $1,251,800
> Median household income: $226,250
> Population with access to exercise opportunities: 94.7%
> Recreational establishments: 31.6 per 10,000 businesses
> Total population: 29,365

Source: Public Domain / Wikimedia Commons
7. University Park, Texas
> Median home value: $1,380,600
> Median household income: $247,045
> Population with access to exercise opportunities: 96.7%
> Recreational establishments: 20.4 per 10,000 businesses
> Total population: 25,029
[in-text-ad-2]
Source: Yasmine Mejia / iStock via Getty Images
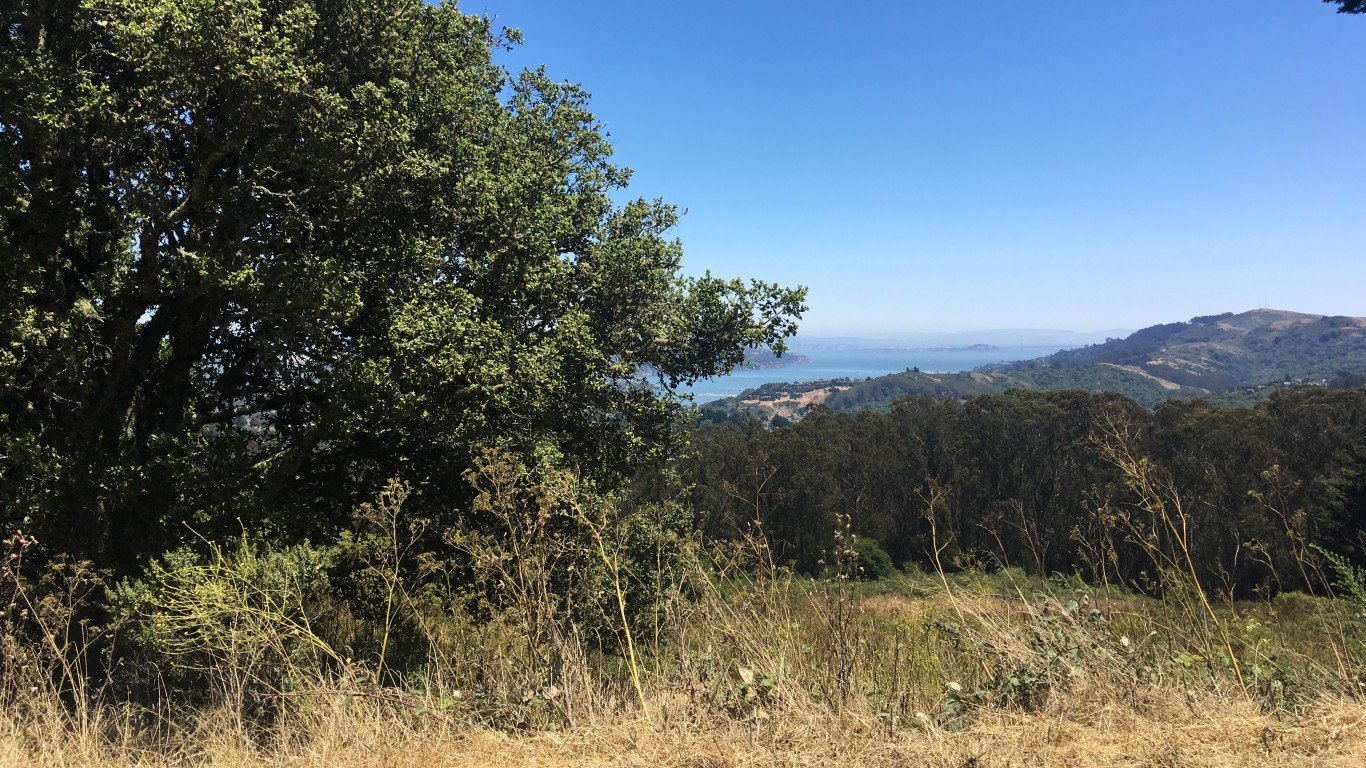
6. Tamalpais-Homestead Valley, California
> Median home value: $1,450,000
> Median household income: $220,875
> Population with access to exercise opportunities: 97.5%
> Recreational establishments: 50.0 per 10,000 businesses
> Total population: 12,535

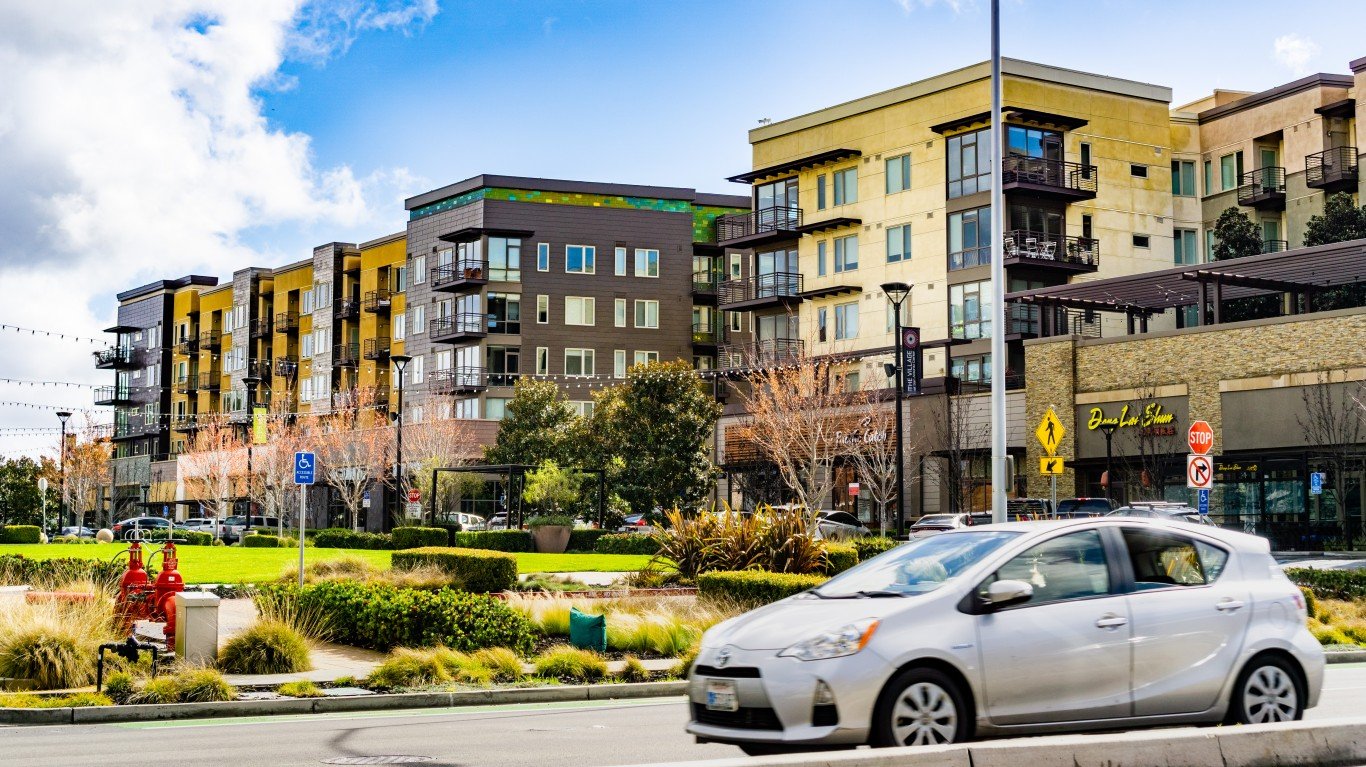
5. San Carlos, California
> Median home value: $1,904,400
> Median household income: $204,570
> Population with access to exercise opportunities: 99.5%
> Recreational establishments: 17.3 per 10,000 businesses
> Total population: 30,754
[in-text-ad]

4. San Francisco, California
> Median home value: $1,194,500
> Median household income: $126,187
> Population with access to exercise opportunities: 100.0%
> Recreational establishments: 41.1 per 10,000 businesses
> Total population: 865,933

3. Old Greenwich, Connecticut
> Median home value: $1,444,800
> Median household income: $234,152
> Population with access to exercise opportunities: 97.5%
> Recreational establishments: 57.2 per 10,000 businesses
> Total population: 6,929

2. Rye, New York
> Median home value: $1,529,400
> Median household income: $207,930
> Population with access to exercise opportunities: 99.6%
> Recreational establishments: 42.6 per 10,000 businesses
> Total population: 16,459
[in-text-ad-2]

Source: Tomsmith585 / iStock Editorial via Getty Images
1. Orinda, California
> Median home value: $1,538,400
> Median household income: $248,984
> Population with access to exercise opportunities: 98.2%
> Recreational establishments: 27.0 per 10,000 businesses
> Total population: 19,497
Methodology
To identify the best cities to live in, 24/7 Wall St. created a weighted index of 22 measures across three categories: economy, quality of life, and community.
The economy category consists of seven measures:
- Employment growth from 2016 to 2021, included at full weight
- Annual unemployment rate, included at full weight
- Median household income, included at full weight
- Poverty rate, included at full weight
- Percentage of the population 25 years and over with bachelor’s degree or higher, included at full weight
- Median home value, included at full weight
- Median real estate taxes as percentage of median home value, included at full weight
The quality of life category consists of 11 measures:
- Percentage of commuting workers 16 and over took public transportation, walked, or took other means to work, included at full weight
- Percentage of workers 16 years and over living in a place who worked in place of residence, included at full weight
- Mean travel time to work, included at half-weight
- Average hospital 30-day readmission rate, included at half-weight
- Average hospital mortality rate for heart attack, CABG surgery, COPD, heart failure, neumonia, and stroke, included at half-weight
- Distance to nearest hospital, included at half-weight
- Percentage of the population in urban census tracts at least 1 mile from a grocery store and in rural census tracts at least 10 miles from a grocery store, included at half-weight
- Annual crude drug-induced mortality rate per 100,000 residents, included at half-weight
- Rate of hospital stays for ambulatory-care sensitive conditions per 100,000 Medicare enrollees, included at half-weight
- Violent crimes per 100,000 residents, included at half-weight
- Property crimes per 100,000 residents, included at half-weight
The community category consists of four measures:
- Population with access to exercise opportunities, included at full weight
- Motion picture theaters (except drive-ins), libraries and archives, theater companies and dinner theaters, sports teams and clubs, museums, zoos and botanical gardens, nature parks and other similar institutions, golf courses and country clubs, and marinas per 10,000 establishments, included at full weight
- Drinking places (alcoholic beverages) per 10,000 establishments, included at full weight
- Restaurants and other eating places per 10,000 establishments, included at full weight
Data on population, employment, unemployment, median home value, median household income, median property taxes paid, commuter characteristics, average travel time to work, and poverty came from the U.S. Census Bureau’s American Community Survey and are five-year estimates for the period 2017 to 2021. Employment data used to calculate five-year employment growth are five-year estimates for the years 2012 to 2016.
Data on the share of the population in urban census tracts or areas at least 1 mile from a grocery store and in rural census tracts at least 10 miles from a grocery store, a measure of poor food access, came from the U.S. Department of Agriculture’s 2021 update to the Food Access Research Atlas and is at the county level.
Data on hospital locations came from the Centers for Medicare & Medicaid Services. Data on 30-day readmission rates and 30-day mortality rates also came from the CMS and are for the period July 2019 to June 2022. Data was aggregated to the city level for cities with at least one hospital, and was aggregated to the county level for cities with no hospitals. Data on the number of drug-related deaths per 100,000 residents per year from the period 2019 to 2021 is from the Centers for Disease Control and Prevention and is at the county level. Data on preventable hospitalizations per 1,000 Medicare enrollees and the percentage of the population with access to exercise opportunities came from the 2023 County Health Rankings and Roadmaps program, a collaboration between the Robert Wood Johnson Foundation and University of Wisconsin Population Health Institute, and is at the county level.
Data on the number of violent crimes and property crimes reported per 100,000 residents came from the FBI’s Uniform Crime Reporting Program and are for the year 2020.
Data on the number of motion picture theaters (except drive-ins), libraries and archives, theater companies and dinner theaters, sports teams and clubs, museums, zoos and botanical gardens, nature parks and other similar institutions, golf courses and country clubs, marinas, drinking places, and restaurants came from the Census Bureau’s 2021 County Business Patterns series and is at the county level.
To avoid geographic clustering, we only took the top-ranking city in a given county. Our list includes cities, towns, villages, boroughs, and census-designated places. We did not include places with fewer than 5,000 residents in our analysis. Cities where 50% or more of the population is enrolled in college or graduate school or where 40% or more of housing units are vacant for seasonal, recreational, or occasional use were excluded. Cities must also have data available for 15 of the 22 measures considered.
ALERT: Take This Retirement Quiz Now (Sponsored)
Take the quiz below to get matched with a financial advisor today.
Each advisor has been vetted by SmartAsset and is held to a fiduciary standard to act in your best interests.
Here’s how it works:
1. Answer SmartAsset advisor match quiz
2. Review your pre-screened matches at your leisure. Check out the advisors’ profiles.
3. Speak with advisors at no cost to you. Have an introductory call on the phone or introduction in person and choose whom to work with in the future
Take the retirement quiz right here.
Thank you for reading! Have some feedback for us?
Contact the 24/7 Wall St. editorial team.
Editors' Picks

